are aid agencies improving? - brookings · 6/9/2016 · policy and institutional environments”...
TRANSCRIPT

Are Aid Agencies Improving?
William Easterly
Global Economy and DevelopmentWorking Paper #9
The Brookings Institution

1
ARE AID AGENCIES IMPROVING?1
William EasterlyBrookings InstitutionNew York University
SEPTEMBER 2007
THE BROOKINGS INSTITUTION
1775 MASSACHUSETTS AVE., NWWASHINGTON, DC 20036
Working Paper #09

2
William Easterly is a Visiting Scholar at Brookings’ Global Economy andDevelopment Program and a Professor of Economics at New York University.
This working paper was published in Economic Policy
Th e views expressed in this working paper do not necessarily refl ect theoffi cial position of Brookings, its board or the advisory council members.
© Th e Brookings Institution
ISBN: 978-0-9790376-8-9

3
AbstractThe record of the aid agencies over time seems to indicate weak evidence of progress over time in response to learning from experience, new knowledge, or changes in political climate. Th e few positive results are an increased sensitivity to per capita income of the recipient (although it happened long ago) a decline in the share of food aid, and a decline in aid tying. Most of the other evidence—increasing donor fragmentation, unchanged emphasis on technical assistance, little or no sign of increased selectivity with respect to policies and institutions, the adjust-ment lending-debt relief imbroglio—suggests an unchanged status quo, lack of response to new knowledge, and repetition of past mistakes.

4
Contents
Abstract . . . . . . . . . . . . . . . . . . . . . . . . . . . . . . . . . . . . . . . . . . . . . . . . . . . . . . . . . . . . 3
Introduction . . . . . . . . . . . . . . . . . . . . . . . . . . . . . . . . . . . . . . . . . . . . . . . . . . . . . . . . . 5
Learning to resolve chronic problems in foreign aid . . . . . . . . . . . . . . . . . . . . . . . . . . . 8
Donor coordination . . . . . . . . . . . . . . . . . . . . . . . . . . . . . . . . . . . . . . . . . . . . . . . . . . . . . . . 8Aid tying . . . . . . . . . . . . . . . . . . . . . . . . . . . . . . . . . . . . . . . . . . . . . . . . . . . . . . . . . . . . . . 12Food aid and technical assistance . . . . . . . . . . . . . . . . . . . . . . . . . . . . . . . . . . . . . . . . . . . . 13
Learning new theories of development . . . . . . . . . . . . . . . . . . . . . . . . . . . . . . . . . . . . 15
Responding to need . . . . . . . . . . . . . . . . . . . . . . . . . . . . . . . . . . . . . . . . . . . . . . . . . . . . . . 16Importance of government policies . . . . . . . . . . . . . . . . . . . . . . . . . . . . . . . . . . . . . . . . . . 20Importance of institutions . . . . . . . . . . . . . . . . . . . . . . . . . . . . . . . . . . . . . . . . . . . . . . . . . 23
Learning from failure . . . . . . . . . . . . . . . . . . . . . . . . . . . . . . . . . . . . . . . . . . . . . . . . . 29
Structural Adjustment . . . . . . . . . . . . . . . . . . . . . . . . . . . . . . . . . . . . . . . . . . . . . . . . . . . . 29Debt relief . . . . . . . . . . . . . . . . . . . . . . . . . . . . . . . . . . . . . . . . . . . . . . . . . . . . . . . . . . . . 33
Conclusions . . . . . . . . . . . . . . . . . . . . . . . . . . . . . . . . . . . . . . . . . . . . . . . . . . . . . . . . 38
Endnotes . . . . . . . . . . . . . . . . . . . . . . . . . . . . . . . . . . . . . . . . . . . . . . . . . . . . . . . . . . 39
References . . . . . . . . . . . . . . . . . . . . . . . . . . . . . . . . . . . . . . . . . . . . . . . . . . . . . . . . . 42
Appendix . . . . . . . . . . . . . . . . . . . . . . . . . . . . . . . . . . . . . . . . . . . . . . . . . . . . . . . . . . 46

5
IntroductionFor long-time observers of foreign aid, the recent wave of attention to “make poverty history” in Africa and other poor countries has some disquieting signs. Th e United Nations, the World Bank, the IMF, and the national aid agencies have signed on to an ambitious project called the “Millennium Development Goals,” in which poverty rates, infant mortality, and other key indicators of low development would be dramatically reduced by the year 2015. To achieve this, aid agencies have embraced and advocated a pro-gram of large aid increases. Th ere is a long debate about how eff ective is foreign aid at creating economic development and eliminating poverty, going back to Rostow (1960), Chenery and Strout (1966), Bauer (1972), Cassen (1987), World Bank (1998), the UN Millennium Commission (2005), Sachs (2005), and Easterly (2006). Yet despite sharply contrasting views on the eff ectiveness of aid, there is a surpris-ing degree of unanimity that the aid system is today deeply fl awed and could be much improved. For example, UK Prime Minister Tony Blair’s Commission for Africa (2005), which called for large increases in aid to Africa, had this to say:2
the system for allocating aid to African countries remains haphazard, uncoordinated and unfo-cused. Some donors continue to commit errors that, at best, reduce the eff ectiveness of aid. At worst, they undermine the long-term development prospects of those they are supposed to be helping. Rich countries pursue their own fi xations and fads… Th ey tie aid so that it can only be used to buy the donor’s own products or services—eff ectively reducing the value of aid by as much as 30 per cent. …Th ey continue to attach unnecessarily detailed conditions to aid packages. Th ey insist on demanding, cumbersome, time-consuming accounting and monitoring systems—and refuse to link with the recipient’s systems. Th ey are insuffi ciently fl exible when it comes to reallocating aid to new priorities in the face of a national emergency. (p. 58)
Similarly, the UN Millennium Project (2005a) led by Jeff rey Sachs, one of the most emphatic propo-nents of increased aid, has a chapter in its main report entitled “Fixing the aid system,” which begins:
Many national strategies will require signifi cant international support. But the international sys-tem is ill equipped to provide it because of a shortage of supportive rules, eff ective institutional arrangements, and above all resolve to translate commitments to action. (p. 193)
Th e companion Overview report (UN Millennium Project 2005b, pp. 38-39) complains that “Develop-ment fi nance is of very poor quality” (referring to bilateral aid) and that “Multilateral agencies are not coordinating their support.”
Th is dissatisfaction with the aid system is not new. Indeed, one of the important early statements of foreign aid policy, John F. Kennedy’s 1961 message to Congress proposing a large increase in foreign aid begins with the statement: “Existing foreign aid programs and concepts are largely unsatisfactory and unsuited for our needs and for the needs of the underdeveloped world as it enters the sixties.”
Another early statement of problems in foreign aid, the landmark Pearson Commission on foreign aid in 1969, makes complaints that echo current complaints as set out in the attached table:

6
Table 1: Chronic problems in aid, past and present
Aid problem or idea
Pearson Commission (1969) Contemporary statements (2005-2006)
More aid to poorest countries
“IDA {International Development Association of the World Bank} has decided to make a special eff ort to assist the poorest members in project preparation so that they can benefi t more fully from IDA fi nancial assistance.” (p. 226)
Th e Commission for Africa (2005, p. 99) calls for “allocating aid to countries where poverty is deepest.”
Donor coordination is a problem
“the present multiplicity of agencies and their lack of coordination leads to much unnecessary duplication of eff ort.” ( p. 228)
UNDP (2005): “weakly coordinated donors, many of them operating overlapping programmes ”
Be selective about whom you give aid
“increased allocation of aid should be primarily linked to performance.” (p. 133)
IMF and World Bank (2005, p.168) “Broad consensus has emerged that development assistance is particularly eff ective in poor countries with sound policy and institutional environments”
Aid tying is a problem
“aid-tying imposes many diff erent costs on aid-receiving countries…{costs} frequently exceed 20 per cent (p. 172) the donors should “consider the progressive untying of bilateral and multilateral aid.” (p. 189)
Th e IMF and World Bank (2005, p. 172): “Untying of aid signifi cantly increases its eff ectiveness.” and “donors agreed to continue to make progress on untying aid.” (p. 173). UNDP (2005, p. 102) notes “price comparisons have found that tied aid reduces the value of assistance by 11%–30%.”
Move away from Food Aid
“one of the most conspicuous forms of tying aid has been food aid… it has sometimes also allowed some low-income countries to neglect agricultural policy” (p. 175)
Th e IMF and World Bank (2006b, p. 83): “transfer of food in kind was found to be about 50 percent more costly than locally procured food and 33 percent more costly than food imports from a third country...”
Technical assistance is a problem
“technical assistance often develops a life of its own, little related in either donor or recipient countries to national or global development objectives.” (p. 180)
Th e IMF and World Bank (2006b): technical assistance “is often badly coordinated among donors and poorly prioritized.”
Debt relief “Th ere has already been a sequence of debt crises…debt service problems of low income countries will become more severe (p. 72) “We recommend that debt relief avoid the need for repeated reschedulings” (p. 157)
Commission for Africa (2005, p. 328): “For poor countries in sub-Saharan Africa which need it, the objective must be 100 per cent debt cancellation as soon as possible…. the relief provided under {recent initiatives} has not been wide enough, or deep enough.”
Do the recent statements simply refl ect dissatisfaction with aid being less than perfectly optimal? Have aid agencies actually made some progress over time on these chronic problems?

7
In order to evaluate aid agency progress, we need some benchmark of how aid agencies would optimally behave, and what would be the optimal transition path from the initial state towards that behavior. It would be very diffi cult to specify such optimal behavior without a lot of good evidence and theory (pres-ently lacking) about the payoff to many diff erent aid agency interventions, especially when there are so many diff erent things that aid agencies do.
Th is paper takes a diff erent tack—it adopts as the benchmark what the aid agencies (and consultants to the aid agencies) themselves state to be desirable behavior. Th e paper is thus investigating the gap between what aid agencies say would be good behavior and the way they actually behave; “progress” is defi ned as closing this gap. Among the vast array of possible aid behaviors, it selects the ones that have been the subject of most of the self-criticisms of aid agencies (such as those listed above), and the ones about which there is more consensus on what is “good” behavior (these two criteria fortunately overlap quite a bit). Th is paper thus contributes insight into how much self-correcting behavior takes place in aid. However, it does not address other very important topics, such as whether the aid agency consensus on good behavior is actually convincing on theoretical or empirical grounds. Th ere is also some arbi-trariness and judgment calls involved in what this author selects as the behaviors to evaluate and what is indeed the consensus against which these behaviors are judged (although the paper will document this consensus as much as possible in the short space available).
Th e transitional dynamics towards the aid agencies’ self-described “good behavior” would involve likely involve at least two types of changes: (1) aid agency learning, and (2) aid agency responses to increased political support for the true goal of foreign aid—i.e. helping the world’s poor.
Learning could come at least from three sources: (1) cumulative experience at dealing with some of the chronic problems of foreign aid, (2) reacting to new knowledge in economic research, and (3) reacting to failure. Th e paper will analyze changes in response to experience to analyze (1) and well-defi ned episodes of new knowledge and failure to analyze (2) and (3).
Th ere are also powerful political and organizational incentives that drive aid behavior. Changes in the out-side political environment could change these incentives in a positive way that leads to aid progress, e.g. the reduced incentive to give aid to corrupt or autocratic allies after the end of the Cold War. A benchmark for aid agency progress is that we would expect some improvement in allocating aid towards the most needy and the most institutionally healthy countries (for a given level of income) after the end of the Cold War.
I will try to distinguish learning from changes in political environment wherever possible. However, the two are not completely separable. One of the facets of learning for the aid community as a whole is how to resist or change bad political or organizational incentives so as to make progress towards the real objective of foreign aid—the alleviation of poverty.
What is the alternative hypothesis to aid agency improvement? Th e most obvious alternative would be stasis, i.e. zero progress. If we detect an absence of progress in cases where the lessons of experience, new knowledge, or previous failures seem painfully obvious, then that may be explained by insuperable political pressures and organizational incentives. Aid agencies may be caught in the kind of bureaucratic paralysis described in the classic work of Wilson (1989). In terms of political economy, the political

8
equilibrium may be static, despite the appearance of some changes in political pressures. Hence, the testable distinction between the two hypotheses is simply that if there is positive progress, we favor the fi rst hypothesis, while if there is zero progress, we favor the second. For the usual statistical reasons, zero progress would be the null hypothesis and we will see if we can reject that hypothesis.4
We can get additional insight into progress and its sources by analyzing separately the behavior of fi ve major donors: the World Bank (International Development Association or IDA for aid), the US, UK, France, and Japan, who had diff erent political environments. Th e World Bank often took the lead in announcing major policy shifts like increased sensitivity to poverty (1973), to country policies (1980), and to institutional measures like corruption (1996). We would naturally expect the World Bank of the donors to be the most likely to follow its own advice. Th e US was obviously the main protagonist in the Cold War, so we would expect it to have experienced the most change after its end in 1989. Th e UK, France, and Japan do not have as obvious break points in their aid behavior, although they may have been infl uenced by all of the above. We might expect a smooth trend towards increased sensitiv-ity towards need, policies, and institutions in these three donors. Th e UK and France might provide an interesting contrast to Japan, since their aid allocations may have initially been driven by colonial ties (which Japan did not have to the same extent), and the colonial ties may have faded over time in favor of selectivity, so we might expect stronger trends in the UK and France. Th ese diff erences in political en-vironment may also infl uence other aspects of aid agency behavior to be considered below, like handling aid coordination, aid tying, technical assistance, and food aid.
Th e remainder of this paper will review key events in foreign aid over time, stylized facts, and empirical trends and regression analysis. It will close with a case study of the interlinked case of structural adjust-ment lending and the debt crisis of low income countries to see how aid agencies reacted to failing ef-forts. Th e specifi c tests are chosen on the basis of what features of aid agency behavior are observable and lend themselves to tests of positive “progress.”
Learning to resolve chronic problems in foreign aidTh e paper fi rst analyzes some of the chronic complaints about foreign aid that were mentioned in the introduction—the lack of coordination, aid-tying, and the over-emphasis on food aid and technical as-sistance.
Donor coordinationA maddening problem in foreign aid for all concerned is the huge administrative costs on both recipient and donor sides from the duplication of donor eff orts and their failure to coordinate their eff orts with each other. Th e United Nations (2005) calls for more coordination so “developing countries are not overburdened with administrative requirements that vary with every donor.” Th e Commission for Africa (2005, p. 62) urges: “Donor counties must co-ordinate their work better with one another,” noting that currently “problems of donor fragmentation and multiple parallel procedures remain pervasive (p. 320)”. Th e IMF and World Bank (2006b, p. 62) note “hosting missions and writing reports for diff erent health programs is estimated to absorb 50–70 percent of the time of a district medical offi cer in Tanzania.” Th is also happens with aid agency country analysis as UNDP (2005, p. ) notes : “Donors conduct overlapping poverty assessments, public expenditure reviews, fi scal policy reviews, assessments of economic policies

9
and fi duciary analysis and are often unaware of similar studies conducted by others or are unwilling to use them.” As the opening table implied, complaints about coordination go back many years, including such landmark studies as the Pearson Commission (1969), Cassen (1987), and World Bank (1998).5
Anecdotally reading the aid agency documents, there is little sign of progress on this issue, although new proposals for “harmonization” continue to emerge from the aid agencies, most recently from the 2005 “Paris Declaration on Aid Eff ectiveness” (OECD 2005). Wilson (1989) reproduces a famous quote on coordination as a perpetual goal of all bureaucracies: “if only we can fi nd the right formula for coordina-tion, we can reconcile the irreconciliable” and “harmonize competing and wholly divergent interests.”6
One of the big causes of the even more severe coordination problem in foreign aid is that all donors seem to want to give to all sectors in all countries. As the 1998 World Bank report Assessing Aid put it, donors want to “plant their fl ags” everywhere. An obvious change that would alleviate the problem would be for donors to specialize more by country or to specialize by sector. As the IMF and World Bank (2005, p. 171) note:
High fragmentation can have negative implications for aid quality for several reasons: high trans-action costs for recipients because more time is taken meeting donor requirements; too many small projects, with consequent limited opportunities to reap scale economies; and smaller or narrower donor stakes in overall country outcomes.53 A large number of donors also compounds the challenge of donor coordination.
Knack and Rahman (2004) confi rm some implications of these statements more rigorously. Th ey fi nd that countries with more donor fragmentation have lower quality bureaucracy as measured by interna-tional comparative measures.7 Coordination may be a problem within all government structures, but it is arguably increasing in the number of diff erent governments involved in an international enterprise like foreign aid. Th is suggests that it would be optimal for donors to specialize more in countries and sectors.
Th e benchmark expectation about progress is that donors would learn to specialize more in response to the continual drumbeat of protest about lack of coordination. Has fragmentation indeed decreased?
Figure 1 shows a donor fragmentation index (also known as a fractionalization index) for each donor as a function of how many countries it covers as a measure of trends in specialization. Th e measure is 1 minus the Herfi ndahl index for aid fl ows. For the donor i, it is equal to 1 minus the sum across j of squares of the shares of recipient j in donor i’s aid disbursements. We see that there is no trend towards increasing special-ization of donors by country. For the typical donor, the fractionalization of recipients increased somewhat from an already very high level over the same period, and has remained at a very high level since then. In this area, there is no sign of learning to specialize in order to lessen coordination problems.
It could be that donors are increasingly specializing by sector, which may still involve operating in a large number of countries. A fractionalization index by sector (1—Herfi ndahl of sector shares) does not show the same general increase as country fractionalization (fi gure 2) However, it doesn’t show any secular decline either, just a lot of variation across donors and across time.

10
Figure 1: Is there increasing specialization by country?
Country fractionalization index by donor (five year moving average)
0.6
0.7
0.8
0.9
1
1969
1971
1973
1975
1977
1979
1981
1983
1985
1987
1989
1991
1993
1995
1997
1999
2001
2003
Cou
ntry
frac
tiona
lizat
ion
(1-H
erfin
dahl
of r
ecip
ient
cou
ntry
shar
es)
JapanUKUSAFranceIDAOther bilateralsOther multilaterals
Notes: source OECD DAC database for aid fl ows, fractionalization= 1- Herfi ndahls based on gross ODA shares by country recipient for each donor. Other bilaterals: Australia, Belgium, Austria, Canada, Denmark, Finland, Germany, Ireland, Italy, Switzerland, Sweden, Norway, New Zealand. Other multilaterals: Arab Agencies, IFAD, Other UN, SAF&ESAF, UNDP, UNFPA, UNHCR, UNICEF, UNRWA, UNTA, WFP, IDB, EC (see Appendix 1 for acronym defi nitions)

11
Figure 2: Is there increasing specialization by sector?
Sector fractionalization indices by donor, five year moving averages
0.65
0.7
0.75
0.8
0.85
0.9
0.9519
7719
7819
7919
8019
8119
8219
8319
8419
8519
8619
8719
8819
8919
9019
9119
9219
9319
9419
9519
9619
9719
9819
9920
0020
0120
0220
0320
04
Sect
or fr
actio
naliz
atio
n in
dex
(1- H
erfin
dahl
of s
ecto
r sha
res)
FranceUnited KingdomUnited StatesIDAJapanOther bilateralsOther multilaterals
Source: OECD DAC data on aid fl ows, 1—Herfi ndahl shares by sectors (listed in Appendix 2). Other bilaterals: Australia, Austria, Belgium, Canada, Denmark, Finland, Germany, Netherlands, Norway, Sweden, Switzerland. Other multilaterals: AfDB, AsDB, EC, IDB
12
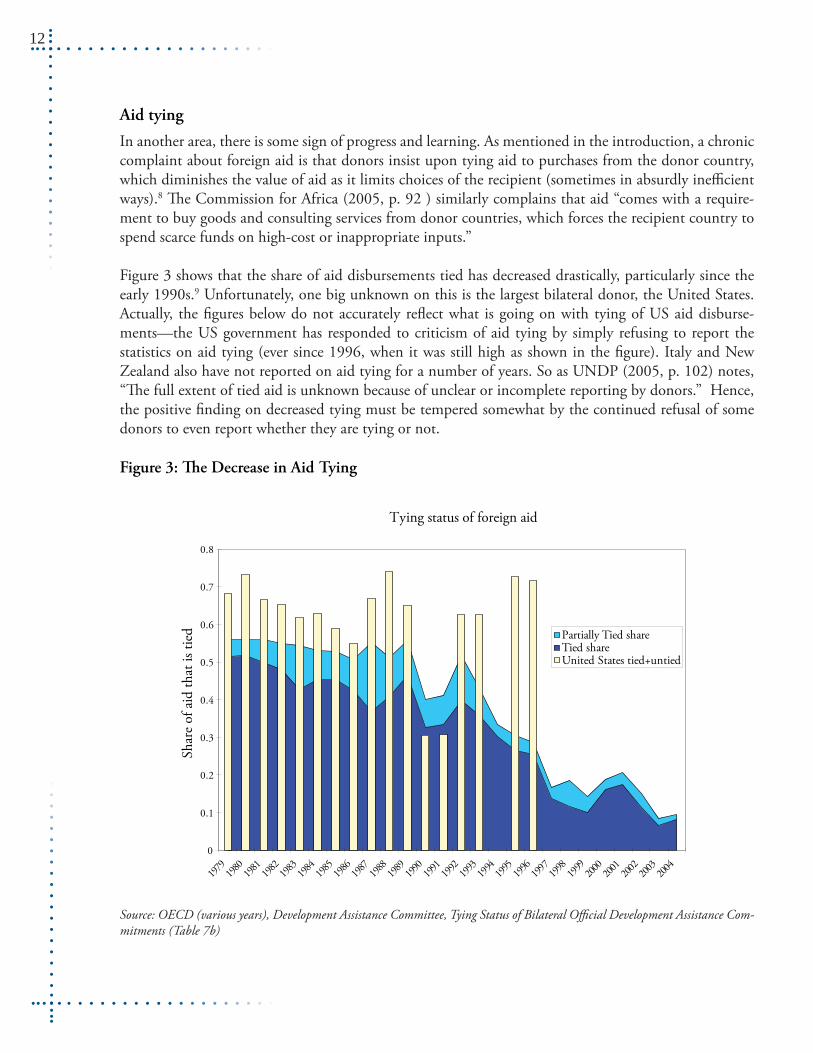
Aid tying
In another area, there is some sign of progress and learning. As mentioned in the introduction, a chronic complaint about foreign aid is that donors insist upon tying aid to purchases from the donor country, which diminishes the value of aid as it limits choices of the recipient (sometimes in absurdly ineffi cient ways).8 Th e Commission for Africa (2005, p. 92 ) similarly complains that aid “comes with a require-ment to buy goods and consulting services from donor countries, which forces the recipient country to spend scarce funds on high-cost or inappropriate inputs.”
Figure 3 shows that the share of aid disbursements tied has decreased drastically, particularly since the early 1990s.9 Unfortunately, one big unknown on this is the largest bilateral donor, the United States. Actually, the fi gures below do not accurately refl ect what is going on with tying of US aid disburse-ments—the US government has responded to criticism of aid tying by simply refusing to report the statistics on aid tying (ever since 1996, when it was still high as shown in the fi gure). Italy and New Zealand also have not reported on aid tying for a number of years. So as UNDP (2005, p. 102) notes, “Th e full extent of tied aid is unknown because of unclear or incomplete reporting by donors.” Hence, the positive fi nding on decreased tying must be tempered somewhat by the continued refusal of some donors to even report whether they are tying or not.
Figure 3: Th e Decrease in Aid Tying
Tying status of foreign aid
0
0.1
0.2
0.3
0.4
0.5
0.6
0.7
0.8
1979
1980
1981
1982
1983
1984
1985
1986
1987
1988
1989
1990
1991
1992
1993
1994
1995
1996
1997
1998
1999
2000
2001
2002
2003
2004
Shar
e of
aid
that
is ti
ed Partially Tied shareTied shareUnited States tied+untied
Source: OECD (various years), Development Assistance Committee, Tying Status of Bilateral Offi cial Development Assistance Com-mitments (Table 7b)

13
Food aid and technical assistance
Two other donor-favored types of aid alleged to be of dubious value are food aid and technical assistance. Critics have frequently pointed out that food aid (usually in the form of in-kind deliveries of food pro-duced in rich countries) undercuts incentives for domestic food producers by driving down domestic food prices.10 It would very likely be superior on economic grounds to give cash grants to people facing starvation to purchase food on local markets (especially since famines and malnutrition are seldom due to inadequate total domestic supplies of food).
Technical assistance is also much-maligned by critics and some aid agencies themselves because it is also frequently tied to hiring consultants from the donor countries. Critics question whether rich country consultants make a signifi cant contribution to poor countries seeking poverty reduction—foreign ex-perts often lack suffi cient local knowledge, and they inadequately transfer what knowledge they do have to local actors.11 Th e United Nations Millennium Project (2005, p. 196) noted that aid was excessively “targeted at technical assistance and emergency aid” and “tied to contractors from donor countries.” Th ey recommend subtracting food aid and technical assistance to arrive at what is available for “develop-ment investments” (p. 197).
Th ese types of aid are politically popular in rich countries because they are subsidizing rich country farm-ers and consultants. Th e IMF and World Bank (2006, p. 7) also criticized both food aid and technical assistance as being insuffi ciently fl exible to be allocated to whatever was the highest priority in the recipi-ent country. Has the aid community learned to resist this type of political pressure and move away from aid instruments of dubious value?
Figure 4 for aid by type to sub-Saharan Africa in real dollars (on a logarithmic scale) shows mixed results. Food aid does seem to have diminished in importance, while technical assistance seems to have remained largely constant. Even the decline in food aid since the 1980s may simply refl ect more the surge in such aid during the famines of the 1980s than any long-run trend. However, looking at secular trends by do-nor (the fi ve year moving average of shares of food aid in total ODA, with data beginning in 1966), we see in Figure 5 that the share of food aid has a steady downward trend in the major food donor, the U.S. Th is is evidence of some combination of learning and changing political pressure leading to a shift away from a type of aid widely seen as counter-productive.

14
Figure 4: Is there a shift away from food aid and technical assistance?
Aid to sub-Saharan Africa by type
1975 1976 1977 1978 1979 1980 1981 1982 1983 1984 1985 1986 1987 1988 1989 1990 1991 1992 1993 1994 1995 1996 1997 1998 1999 2000 2001 2002 2003
Tot
al a
id in
mill
ion
2003
dol
lars
(log
bas
e 10
scal
e) Total ODA NetTechnical Cooperation GrantsFood Aid
100
1,000
10,000
100,000
Figure 5: Has the share of food aid changed with some donors?
Share of food aid in total aid by donor
0
0.05
0.1
0.15
0.2
0.25
0.3
0.35
0.4
1979
1980
1981
1982
1983
1984
1985
1986
1987
1988
1989
1990
1991
1992
1993
1994
1995
1996
1997
1998
1999
2000
2001
2002
2003
2004
Shar
e of
food
aid
in n
et O
DA
(five
yea
r mov
ing
aver
age)
United StatesUnited KingdomJapanFrance

15
Looking at share of technical assistance by donor presents less evidence of progress. Th e US and Japan have an upward trend in the share of technical assistance (also displayed as a fi ve year moving average), while the UK and France show some recent decline but no dominant trend over the whole period (fi g-ure 6). Th is is looking only at quantity of technical assistance dollars; it could be that there have been improvements in the quality of technical assistance.
Figure 6: Shares of Technical cooperation by Donor
Technical cooperation grants as share of total aid by donor
0
0.1
0.2
0.3
0.4
0.5
0.6
0.7
1970
1972
1974
1976
1978
1980
1982
1984
1986
1988
1990
1992
1994
1996
1998
2000
2002
2004
United StatesUnited KingdomJapanFrance
Rat
io o
f tec
hnic
al c
oope
ratio
n gr
ants
to n
et O
DA
(five
yea
r mov
ing
aver
age)
Learning new theories of development
Th ere have been important changes in development theories and accompanying policy recommenda-tions since the 1960s. To broadly sketch (and oversimplify) the changes, the main emphasis in the 1960s was on mobilizing suffi cient fi nancing for infrastructure and industrial capital formation. Th is period stressed projects that would provide these physical inputs to promote overall industrialization and devel-opment in all developing countries. In the 1970s, there was a shift towards trying to improve the world income distribution by directing aid more to the poorest nations. In the 1980s, there was increased awareness of the importance of government policies to give favorable incentives to the private sector, get prices right, facilitate free trade, and maintain macroeconomic stability.12 Th is was refl ected in a concrete policy change: the introduction of structural adjustment lending by the IMF and World Bank in 1979-80 to give loans to developing countries conditional on them adopting these policies. Th en beginning in the 1990s, there was increasing emphasis on the quality of government institutions, such as democratic accountability and control of corruption. Th e new approaches in the 1980s suggested that individual projects would have high returns only if national government policies were favorable, and then begin-ning in the 1990s only if institutions were supportive.

16
Th is thinking was given further impetus in a famous paper by Craig Burnside and David Dollar (pub-lished in AER in 2000, but results fi rst available around 1997 and published in the World Bank’s Assess-ing Aid in 1998). Burnside and Dollar found that aid raised growth only in countries with good policies, as measured by low infl ation, low budget defi cits, and high openness to trade. Another version of these results (Collier and Dollar 1998) also stressed quality of institutions as aff ecting the growth payoff from aid. Unfortunately, these results later failed some simple robustness checks such as introducing new data into the same specifi cation (Easterly, Levine and Roodman 2003). However, whether the Burnside and Dollar results hold (specifi cally whether aid has a positive eff ect on growth when policies/institutions are good) is something of a red herring regarding the issue of selectivity. Th e idea that aid money directed to governments would be more productive if those governments had pro-development policies and in-stitutions is very intuitive (as shown in the introduction, it goes back to the 1960s). What has changed over time is the increasing awareness of which policies and institutions are pro-development, as described above, which should have led to increasing sensitivity to policies like infl ation and trade openness (be-ginning in the 1980s), and institutions like democracy and corruption (beginning in the 1990s).13 Th e IMF and World Bank (2006b, p. 83) indeed argue “Th e results for policy elasticity of aid likewise show a strengthening of the relationship between aid and the quality of policies and institutions.”
Th is source says this statement is based on Dollar and Levin (2006). Actually, Dollar and Levin (2006) have a more restricted fi nding.14 Th ey did not test changing selectivity to policy indicators of the type discussed above. Instead they tested two measures of institutions: democracy and rule of law. Th ey fi nd donors are generally selective with respect to democracy, but the selectivity elasticity has been falling over time. On the rule of law, they found that donors formerly had the opposite of selectivity—they had a signifi cant negative tendency to give aid to countries with weak rule of law (controlling for per capita income and other variables) in 1985-89. Subsequently, they fi nd the relationship reverts to insignifi cance (albeit positive) for 1995-99 and 2000-2003. 15
So let us consider this question anew. How much did aid agencies learn from these new waves of think-ing about development? How is such learning refl ected in their behavior? It is indisputable that the aid agencies gave diff erent advice to poor countries based on progress in development economics, and so in this respect at least there was defi nitely learning.
I again run cross-section regressions for allocation of (log) aid across countries, always controlling for (log) population size, (log) per capita income, and year dummies, year by year for all available years. I now intro-duce variables one at a time that refl ect the increased emphasis on need, policies, and institutions.
Responding to need
One of the chronic problems in foreign aid is directing aid to where it is most needed—giving more aid to the poorest people in the world and less aid to the less poor. Th is is an issue where there have been important changes in both political pressure and the state of development knowledge. A large literature on aid discusses how foreign policy considerations often distort aid infl ows away from the needy towards the strategically important countries.16 Th is was thought to be a particular problem during the Cold War. Th e IMF and World Bank (2006b, p. 7) assert that there is progress but still some way to go: “While aid selectivity is increasingly based on need (poverty level) … there is evidence that other factors still deter-

17
mine a large share of aid disbursements.” Th e IMF and World Bank (2006b, p. 83) later give the source for increasing selectivity based on need: “Dollar and Levin (2004) indicate that … the poverty elasticity of aid had strengthened for most of {bilateral} donors.” {Curiously enough, Dollar and Levin make no such claim (neither the working paper version in 2004, nor the revised 2006 version.)}
As far as new knowledge in the aid community, an important benchmark was World Bank President McNamara’s Annual Meetings speech in September 1973 in Nairobi. He called attention to the concept of absolute poverty and the plight of the poorest people in the world, which was an increased emphasis on poverty compared to the aid community’s previous tendency to treat the “Th ird World” as one ho-mogeneous bloc that should all have their growth fi nanced.17 McNamara’s speech did not come out of a void—it refl ected shifting emphasis in the development literature towards more concern with poverty and income distribution (for example, the famous book by Chenery 1974).
Have aid agencies indeed learned over time how to resist the political pressures to lend, and succeeded at moving closer to their mission of poverty, of which they have become increasingly aware over time? To distinguish such learning from changes in intensity of political pressure, I create a dummy for the Cold War and using it as a slope dummy for the coeffi cient of aid on per capita income.
I look for a trend in the response of aid to per capita income. In this and regressions to follow, I use a basic parsimonious specifi cation in a panel dataset of yearly aid received from all donors from 1960 to 2003 by recipient country, regressing log of aid received in real dollars on time dummies for each indi-vidual year, log of per capita income (in PPP dollars), and log of population.18 I adopted what seemed to be a plausible specifi cation a priori and did not experiment with alternative forms, so as to avoid the kind of data mining that is all too common in the aid literature. Th e source for data on nominal aid dollars (gross Overseas Development Assistance (ODA)) are from the OECD Development Assistance Com-mittee (OECD DAC), and are converted to real dollars (with a base year of 2003) using the defl ator for exactly this purpose provided by the OECD DAC, which takes into account exchange rate movements and dollar infl ation.
Th e regression uses clustered standard errors to recognize that errors for a given country are likely cor-related, as well as robust t-statistics to handle heteroskedasticity. Table 2 shows that the base specifi cation (regression 1) shows strong sensitivity to per capita income (sometimes called the “poverty elasticity”), and an elasticity with respect to population that is less than one (refl ecting the well known small country bias, in which small countries receive higher per capita aid).19 Regression 2 introduces a time trend in the coeffi cient on per capita income, and fi nds it to be signifi cant and negative. (Th e coeffi cient on per capita income by itself is positive, but the magnitudes are such that, including the time trend, the elas-ticity of aid with respect to per capita income is always negative.) Regression 3 considers an alternative hypothesis—that there was a one time shift after the end of the Cold War; it includes a slope dummy for the Cold War (=1 if the year is less than 1990). Per capita income is still signifi cant, but the slope dummy is insignifi cant—there is no evidence that the Cold War distorted aid allocation away from the neediest countries.
Regression 4 explores an alternative story: that there was a one time shift in sensitivity to need associ-ated with the “McNamara revolution” towards increased emphasis in poverty in the 1970s. A dummy

18
for the post-McNamara years interacted with per capita income is indeed highly signifi cant and negative in regressions 4 and 5 (the latter also includes the Cold War dummy which is still insignifi cant). What’s more Regression 6 shows that there is no tendency towards further increases in aid sensitivity to per capita income after the post-1973 shift. (Of course, there could have been some other explanation for the change besides the McNamara policy shift. All that we have established is that there was a one time shift around the mid-1970s).
Hence, the fi rst result is that there does seem to be learning over time to respond to need, but this eff ect is concentrated around a one-time shift around 1973, possibly associated with the changing emphasis in development knowledge exemplifi ed in the McNamara policy shift. Th e main missing result is that there is no evidence that the political opportunity created by the end of the Cold War led to a de-emphasis of strategic considerations and more emphasis on the need of the recipient.
Table 2: Learning to respond to needs? Pooled Cross-section, Time Series regression of log real dollar aid receipts by country recipient on country characteristics, 1960-2003
Regression 1960-2003Regression 1974-2003
Right-hand side variables 1 2 3 4 5 6Log of per capita income in year aid received -0.491 20.712 -0.566 -0.199 -0.228 3.398
(5.09)** -1.95 (6.13)** -1.13 -1.4 (0.25)Log of population 0.546 0.547 0.547 0.545 0.546 0.5
(15.07)** (14.82)** (15.03)** (14.81)** (14.92)** (14.06)**Log per capita income * time trend -0.011 -0.002
(2.01)* -0.29Log per capita income * Cold War dummy 0.145 0.028
-1.23 -0.25Log per capita income * McNamara dummy -0.356 -0.339
(2.26)* (2.27)*Observations 4719 4719 4719 4719 4719 3536R-squared 0.51 0.52 0.51 0.52 0.52 0.56
Robust t-statistics in parentheses (clustered standard errors by country), * signifi cant at 5% level; ** signifi cant at 1% level, includes year dummies (not shown)
Although the regressions in Table 2 have the virtue of considering alternative parsimonious hypotheses, the specifi cations may be too restrictive for the poverty elasticity. As a robustness check, Table 3 presents regressions for successive 5-year averages for the base specifi cation of log real aid regressed on log per capita income and log population. Again, there is evidence of a regime shift in the mid-1970s. Prior to that, aid was weakly related to need or even had the wrong sign. Since the mid-1970s, per capita income

19
has always been a signifi cant determinant of aid receipts. We see why the linear trend in poverty elastic-ity after 1974 fails: the poverty elasticity fi rst increases in absolute value, peaking near the end of the Cold War, but then some rather puzzling erosion in response to need since then (especially relative to the expectation that the end of the Cold War would have led to reallocation from strategic countries to needy countries.)
Table 3: Real aid dollars regressed on need and population sizeEach row represents a cross-section regression of averages for the years shown of log of real aid dollars received by each country on recipients’ log per capita income and log of population
Log per capita
income t-statLog of
population t-stat Observations R-squared
1960-1964 0.118 (0.58) 0.860 (8.99)** 88 0.521965-1969 -0.286 (1.34) 0.734 (8.63)** 91 0.51
1970-1974 -0.315 (1.41) 0.674 (7.02)** 95 0.44
1975-1979 -0.493 (3.09)** 0.481 (6.00)** 101 0.5
1980-1984 -0.573 (3.63)** 0.495 (8.29)** 110 0.43
1985-1989 -0.736 (5.81)** 0.470 (10.16)** 114 0.64
1990-1994 -0.677 (6.73)** 0.485 (11.98)** 142 0.61
1995-1999 -0.611 (5.88)** 0.512 (12.05)** 144 0.67
2000-2003 -0.577 (5.86)** 0.519 (14.26)** 140 0.66Robust t statistics in parentheses, * signifi cant at 5%; ** signifi cant at 1%
One important note is that the discussion of Tables 2 and 3 applies two diff erent criteria for evidence of increased selectivity. Th e result on the time trend in the per capita income coeffi cient or the McNamara dummy in Table 2 shows that the change in coeffi cient is statistically signifi cant (at the 5 percent level). Table 3 shows that the level of the per capita income elasticity fi rst becomes signifi cant in 1975-79. Th e two tests are obviously not equivalent and both give useful information. I will continue applying both types of tests in the rest of the paper.
We can get some additional insight by looking into the behavior of the poverty elasticity for the Interna-tional Development Association (IDA) and the four major bilateral donors for the same fi ve year averages shown in Table 3. Th e log of total aid from each donor is regressed on the log of population and the log of per capita income for the recipient country. Th e coeffi cient on per capita income (the poverty elasticity) is shown for each donor in Table 4. If the poverty elasticity is statistically signifi cant at the 5 percent level, then it is shown in bold type. As more evidence for the “McNamara revolution,” IDA is the donor that shows the biggest increase in magnitude and signifi cance beginning in 1975. France is the other donor with a similar pattern. Japan is the only donor whose relationship to need is never signifi cant. Th e US coeffi cient on need is not signifi cant until the last period, which may refl ect the dominance of its strategic interests during the Cold War and the revival of interest in helping poor countries in the new millennium. However,

20
there seems to be a lot of fl uctuation of all donors, including IDA. In the latest period, 2000-2003, there is an interesting convergence of all donors except Japan at a statistically signifi cant (at the 5 percent level) poverty elasticity of around -0.5. But again, this is not equivalent to saying the change in elasticity from 1995-1999 to 2000-2003 is statistically signifi cant, which it is not for any of these donors.
Th e last two columns in Table 4 allow us to assess the signifi cance of diff erences in coeffi cients. It reports the coeffi cients on the McNamara dummy and the shift in coeffi cient after the Cold War (the negative of the Cold War dummy) in regressions for each donor exactly equivalent to regression 5 in Table 2. Th ere are interesting diff erences among donors. IDA is the only major donor with a signifi cant McNamara shift (apparently McNamara convinced only his own organization?). Th e US is the only donor with a signifi cant increase in sensitivity to need after the Cold War (IDA actually has a puzzling decrease in sensitivity to need after the end of the Cold War), which is plausible since the US was the main Western protagonist in the Cold War and thus most likely to have used aid politically during the Cold War. With the US, the post-Cold War expectations are confi rmed, while for IDA and the other donors they are not.
Table 4: Poverty Elasticity by Donor
Cross-section regression for each fi ve year average period for log of aid from donor shown on log per capita income and log population. Table shows coeffi cient on log per capita income (poverty elasticity). Coef-fi cient shown in bold if signifi cant at 5 pe
Regression of log real aid on log population, log per capita income, year dum-mies, and income slope dummies for post-McNa-mara speech (1973) and end of Cold War (1990) for whole time period
1960-1964
1965-1969
1970-1974
1975-1979
1980-1984
1985-1989
1990-1994
1995-1999
2000-2004
McNamara shift for poverty elasticity
post-Cold War shift for poverty elasticity
IDA 0.09 -0.11 -0.57 -1.14 -1.27 -0.54 -0.24 -0.50 -0.79 0.49US 0.83 0.23 0.22 0.06 0.05 0.07 -0.12 -0.36 -0.58 -0.20 -0.44UK -0.84 -0.69 -0.32 -0.38 -0.15 -0.23 -0.25 -0.25 -0.64 0.35 -0.23France -0.26 -0.38 -0.45 -0.60 -0.83 -0.47 -0.45 -0.43 -0.01Japan -0.25 -0.08 0.32 0.03 -0.25 -0.27 0.13 0.30 0.36 0.26
Notes: Table shows coeffi cient of log of real aid dollars regressed on log of per capita income, controlling for log of population. Th ose coeffi cients statistically signifi cant at the 5 percent level are shown in bold, with robust standard errors. Regressions with less than 40 observations are omitted
Importance of government policies
I consider two measures of policy. First, I used a widely known indicator of trade openness (the broad Sachs-Warner openness dummy that captures tariff s, quotas, black market premiums, prevalence of export marketing boards, and a socialist economic system). Th e data end in 1998.20 Th e second policy measure I

21
consider is a dummy that takes on the value 1 if infl ation is greater than 40 percent, and 0 otherwise.21 I next turn to running the same kind of regression as above to test more comprehensively for time trends in response to policy that would represent learning. Given the collinearity of policy indices (and their collinearity with the other things being tested elsewhere in this paper like other slope dummies), I still introduce the policy variables and their slope dummies one at a time. As described above, there is a well-defi ned shift in development knowledge around 1980 towards stressing selectivity in these type of poli-cies. Hence, the test for learning to be selective is very simple—I test the signifi cance of a slope dummy on policy for the period beginning in 1980. Table 5 shows the results. Th ere is no evidence for a shift in aid allocation in response to policies of the recipient after 1980. Actually, aid is never signifi cantly related to openness, while it is signifi cantly related to high infl ation (but not more so after 1980).
Table 5: Learning to respond to policies? Pooled Cross-section, Time Series regression of log real dollar aid receipts by country recipient on country characteristics, 1960-2003
Regressions1 2 3 4
Log of per capita income in year aid received -0.369 -0.369 -0.524 -0.525(3.12)** (3.12)** (5.39)** (5.40)**
Log of population 0.522 0.521 0.529 0.528(10.84)** (10.84)** (15.49)** (15.37)**
Sachs-Warner openness dummy (=1 if open) 0.202 0.22(1.14) (0.81)
Openness dummy * Dummy for post-1980 period -0.029(-0.13)
Dummy for high infl ation (>40 percent) -0.538 -0.599(4.54)** (2.99)**
High infl ation dummy * Dummy for post-1980 period 0.102(0.44)
Observations 3091 3091 4719 4719R-squared 0.41 0.41 0.53 0.53
Robust t-statistics in parentheses (standard errors clustered by country)* signifi cant at 5% level; ** signifi cant at 1% level
Again, this format may be too restrictive, so Table 6 shows the results of estimating the relationship between aid allocation and policies (controlling for income and population) for all aid and for the fi ve major donors for averages of fi ve year periods from 1960 to 2003. For all aid, the only period in which openness is signifi cant is 1990-94. Looking at the results by donor, the UK and Japan do have a signifi cant tendency to respond to openness, but it does not increase over time. Curiously enough, the relationship between IDA aid allocation and openness is never signifi cant.22 Th e results by donor for high infl ation do show some tendency for infl ation to be signifi cant more often after 1980 (including for IDA), although signifi cance is still sporadic. Hence, there is some support for the increased signifi cance test of increasing selectivity with regard to infl ation.

22
Th e last column of Table 6 shows the coeffi cients on the variables “Openness dummy * Dummy for post-1980 period” and “High infl ation dummy * Dummy for post-1980 period” for each individual donor in regressions identical to those in Table 5, i.e. regressions for pooled annual data of log real aid on log income, log population, year dummies, the respective policy, and the aforementioned policy slope dum-mies. For the two policies and fi ve donors, only one of these policy slope dummies is signifi cant at the fi ve percent level—the shift in response to high infl ation for the UK.
Table 6: Results of regressing log of real aid dollars by donor on infl ation and openness of recipient in successive fi ve year periods, controlling for log per capita income, log of population, and year dummies.
Coeffi cient on log of real aid on high infl ation dummy
1960-1964
1965-1969
1970-1974
1975-1979
1980-1984
1985-1989
1990-1994
1995-1999
2000-2003
Post-1980 shift in coeffi cient on high infl ation dummy
All ODA 0.34 -0.586 -0.051 -0.413 0.237 -0.312 -0.713 -0.853 -0.448 0.102IDA 4.684 0.205 -1.044 -1.125 -0.23 0.657 -1.224 -0.206US 0.179 0.344 -0.163 -0.633 -0.353 -0.288 -0.237 0.022 0.904 -0.025UK -2.625 -1.745 -0.925 -0.056 -0.87 -0.49 -0.527 0.185 -0.844
France -0.281 -0.815 -1.148 -1.052 -0.583 -0.659Japan 1.325 -0.259 -0.926 0.041 -0.360 -1.631 -1.900 -0.884 -0.219
Coeffi cient on log of real aid on Sachs-Warner openness dummy
1960-1964
1965-1969
1970-1974
1975-1979
1980-1984
1985-1989
1990-1994
1995-1999
Post-1980 shift in co-effi cient on openness
All ODA 0.66 -0.414 0.159 0.076 -0.226 0.181 0.682 0.334 -0.029IDA 0.082 0.412 0.445 0.528 0.245 0.077 -0.046US 0.542 -0.183 0.717 0.119 -0.315 0.438 0.629 1.358 0.091UK 1.362 2.986 2.184 2.001 2.12 1.461 1.086 0.882 -0.977France -1.62 -0.904 -0.449 -0.077 0.737 0.412 0.802Japan 1.10 1.64 1.80 1.25 1.10 2.04 0.99 -0.247
Notes: Coeffi cients signifi cant at 5 percent level are shown in bold. Regressions with less than 40 observations are not shown. Openness measures end in 1998 (Sources: Sachs and Warner 1995, updated by Easterly, Levine and Roodman (2003)). All regressions control for log of per capita income and log of population. Source for aid data and dollar defl ator: OECD Development Assistance Committee on-line database. Last column shows coeffi cient on slope dummy for post-1980 period on infl ation and openness in pooled annual regression of log of real aid on log per capita income and log population, year dummies, and level of respective policy variable.
Th e overall picture is that there is little evidence that donors are learning to be increasingly selective with respect to policies in the recipient countries. 23

23
Importance of institutions
What did the aid community learn from the research on the importance of institutions to development in the 1990s? Is there increased sensitivity in aid allocation to institutional variables like democracy and corruption? A confounding factor here is the end of the Cold War. According to a widely accepted nar-rative, donors were happy to indulge corrupt dictators who were allies in the Cold War, but showed less tolerance after the Cold War ended. Th e end of the Cold War also coincides (and may have contributed to) with the increased awareness of “governance” in aid agencies, including democratic accountability and donor criticism of anti-democratic practices.
Th e timing of increased awareness of corruption as a factor infl uencing the eff ectiveness of aid and de-velopment prospects in general in the aid community is diffi cult to be exact about. I have chosen one widely publicized benchmark: World Bank President James Wolfensohn’s address to the World Bank/IMF Annual Meetings in September 1996. A World Bank report the following year concurs in highlight-ing this as a break in aid community awareness of corruption.24 Th ere is no similar watershed statement on the importance of democracy, but it is widely accepted that donors were discussing democracy as a factor in aid and development much more in the later periods than in earlier ones. In addition, there was increased emphasis on institutions in general in the aid community, as represented by the World Bank’s Kaufmann and Kraay (1996, 1998, 2000, 2002, 2004) indices of “good governance” (which included separate indicators for both democracy and corruption), culminating in the 2001 World Development Report on institutions for development.25
Th e paper relates aid allocation by country to a measure of democracy in the recipient (the Polity IV in-dex of democracy that runs from 0 for the least democracy to 10 for the most democracy) from 1960 to 2003.26 Th e other key test is to see how donors’ response to corruption has changed over time. Unfortu-nately, data on corruption (from the International Country Risk Guide) is only available since 1984).27 To be more systematic about this and to test whether there was a change after the Cold War, I again run the same base specifi cation as above, introducing the democracy and corruption variables and their interaction terms with diff erent time periods. On average, as shown in Table 7, aid does respond to democracy positively. Contrary to the conventional wisdom, there is no diff erence in the sensitivity to democracy during the Cold War and that after the Cold War. Since the post-Cold War period coincides with increased rhetoric by donors in favor of democratic accountability, there is also no sign that this shift in rhetoric had an eff ect on aid allocation.28
Th e results on corruption are rather similar. Th e average sensitivity of aid to (freedom from) corruption is positive and signifi cant.29 Contrary to conventional wisdom, donors were not more tolerant of corrup-tion during the Cold War. 30 Looking for an alternative pattern that corruption responded to the shift in awareness about corruption after 1996, I also test a slope dummy for the post-1996 period. Th ere is no evidence for this pattern. I also tested a variant in which a dummy takes on the value of 1 for the worst corruption cases (less than 2 on the 0 to 6 ICRG indicator of freedom from corruption.) Th ere is no evidence for a shift in response to the worst corruption cases either. Th e bottom line is that there is evidence for some sensitivity to corruption, but there is no evidence for learning by the aid agencies in response to new emphases in the literature about corruption.

24
Table 7: Pooled Cross-section, Time Series regression of log real dollar aid reciepts by country recipient on country characteristics, 1960-2003, including year dummies (not shown)
Regression:Right-hand side variables: 1 2 3 4 5 6Log of per capita income in year aid re-ceived -0.421 -0.42 -0.624 -0.628 -0.623 -0.589
(4.73)** (4.69)** (6.44)** (6.48)** (6.41)** (5.76)**
Log of population 0.51 0.511 0.458 0.461 0.457 0.452
(13.05)** (13.01)** (9.41)** (9.45)** (9.40)** (9.28)**
Democracy index (0-10, with increase meaning more democracy, from Polity IV) 0.045 0.052
(2.37)* (2.13)*
Democracy * Post Cold War dummy (=1 if year > 1989) -0.015
(-0.66)
Corruption index (0-6, with increase meaning less corruption, from ICRG) 0.143 0.064 0.15
(2.03)* (0.69) (1.89)
Corruption index * Post Cold War 0.123
(1.36)
Corruption index*Dummy for period following World Bank emphasis on cor-ruption (=1 if year > 1996) -0.024
(-0.25)
Dummy for worst corruption (=1 if ICRG Corruption <2) -0.249
(-1.25)
Worst Corruption * Dummy for year >1996 0.101
(0.45)
Observations 4154 4154 1776 1776 1776 1776
R-squared 0.41 0.41 0.50 0.50 0.50 0.49
Robust t-statistics in parentheses (clustered standard errors) * signifi cant at 5% level; ** signifi cant at 1% level
Next consider more detailed results on democracy by donor and with an unrestricted format in which a separate coeffi cient on democracy is calculated for each subsequent fi ve year period. Table 8 is analogous to Table 6: it performs cross-section regressions for log aid on log income, log population, and democracy and then shows the coeffi cient on democracy (shown in bold if signifi cant at the 5 percent level). Th e last column of Table 8 shows the coeffi cient on the variable Democracy * Post Cold War dummy (=1 if year > 1989) in

25
regressions exactly the same as those in Table 7 for each individual aid donor. Table 8 shows some diff erences by donor. France and Japan show a positive shift in response to democracy (although in France, it was a move-ment away from rewarding autocracy towards NO sensitivity to democracy).
Table 8: Coeffi cients on democracy in regressions for log of real aid dollars by donors on log of per capita income and log population by donor (coeffi cients signifi cant at 5 percent level shown in bold)Democracy defi ned in levels: 0-10 democracy index from Polity IV
Coeffi cient of log of real aid on democracy
1960-1964
1965-1969
1970-1974
1975-1979
1980-1984
1985-1989
1990-1994
1995-1999
2000-2003
Coeffi cient on shift of democracy coeffi cient after 1989
IDA 0.06 0.09 0.00 0.06 0.05 0.02 0.06 0.10 0.005US -0.04 0.13 0.02 -0.01 0.02 0.07 0.07 0.06 0.11 -0.003UK 0.13 0.38 0.34 0.20 0.22 0.11 0.11 0.11 0.12 -0.091
France -0.13 -0.18 -0.12 -0.10 0.02 -0.04 -0.04 0.083
Japan 0.12 0.09 0.03 -0.02 0.12 0.17 0.15 0.09 0.086
To test robustness of these results for both total ODA and by donor for democracy, I next explore several variations on the defi nition of democracy. Several ways of entering democracy are considered: (1) change in the 0-10 Polity IV scale over the fi ve year period, (2) a dummy =1 for “democratic transitions” defi ned as a change in the Polity IV democracy measure of 5 or more,31 (3) entering both (1) and the level of the Polity IV variable together, and (4) considering the Freedom House measure of democracy instead of the Polity IV measure. Th e strongest estimates for learning come in the regressions that enter a dummy for a large democratic transition (movement of 5 or more on the 0-10 Polity IV scale) for 1995-99.32
All ODA, the US, the UK, and Japan, but not France, have a signifi cant coeffi cient on the democratic transition for 1995-99. When the regression includes both the level of democracy and the transition dummy, both are signifi cant for all ODA, the UK, and Japan in 1995-99.33 On the downside, none of the transitions are signifi cant in 1990-94, which was supposed to be the post-Cold War watershed pe-riod, and only UK aid has a signifi cant coeffi cient on transition during 2000-2003.
Th e overall results are only weakly supportive of increased sensitivity after 1990. Of all the permutations of log of aid on development (including both Table 8 and Table 9), we have a minority of signifi cant coeffi cients of the right sign at the 5 percent level. Before 1990, out of 177 estimated coeffi cients, 32 are signifi cant and of the right sign (another 7 were signifi cant but of the wrong sign). After 1990, out of 102 estimated coeffi cients, 32 are signifi cant (all of the right sign). Hence, before 1990, 18 percent of the estimated coeffi cients are of the right sign and signifi cant, while after 1990, 31 percent of the esti-mated coeffi cients are signifi cant of the right sign. Th is is a shift towards increased statistical signifi cance of democracy after 1990, but not overwhelmingly impressive. Obviously, 5 percent of the coeffi cients would be signifi cant at the 5 percent level (half positive and half negative on average) in a random set of independent regressions in which there was no true relationship, although this is not an exact benchmark for our exercise since our regressions are not independent.

26
Table 9: Coeffi cients on democracy in regressions for log of real aid dollars by donors – alterna-tive defi nitions of democracy and transitions
Coeffi cient of log of real aid on democracy
1 9 6 0 -1964
1 9 6 5 -1969
1 9 7 0 -1974
1 9 7 5 -1979
1 9 8 0 -1984
1 9 8 5 -1989
1 9 9 0 -1994
1 9 9 5 -1999
2 0 0 0 -2003
Transition or level
1. Results by donor on democratic transition, defi ned as the change from beginning of period to end of period in the 0-10 Polity IV democracy scaleAll ODA 0.07 0.00 -0.05 0.02 0.07 -0.05 -0.01 0.02 0.03 TransitionIDA 0.04 0.10 -0.07 0.02 -0.01 -0.01 0.05 0.08 TransitionUS 0.02 -0.01 -0.03 -0.09 0.10 0.06 0.03 -0.02 0.07 TransitionUK 0.33 0.03 0.09 -0.08 -0.02 -0.20 -0.01 0.05 0.15 TransitionFrance 0.11 -0.10 -0.09 -0.05 0.02 -0.13 0.07 TransitionJapan -0.02 0.05 0.01 0.08 0.06 -0.02 0.07 -0.07 Transition
2. Results by donor on democratic transition, defi ned as dummy=1 if the change from beginning of period to end of period in the 0-10 Polity IV democracy scale being 5 or greater, 0 otherwiseAll ODA 0.62 0.15 -0.69 -0.05 0.40 -0.69 -0.02 0.56 0.16 TransitionIDA 0.64 1.49 -0.53 -0.18 -0.12 -0.06 0.34 TransitionUS -0.06 -0.17 -0.71 -0.40 1.67 0.03 0.30 1.26 0.89 TransitionUK 2.74 3.52 1.37 -0.53 -0.62 -1.03 -0.03 1.21 1.40 TransitionFrance -0.99 -0.82 -1.11 -0.56 0.29 0.13 0.21 TransitionJapan -0.08 0.59 0.22 0.26 0.71 -0.06 1.84 -0.46 Transition
3. Results by donor on democracy level and democratic transition, defi ned respectively as in 1 and 3All ODA 0.06 0.09 0.06 0.02 0.06 0.08 0.06 0.07 0.06 Level
0.45 -0.18 -0.89 -0.09 0.32 -0.75 -0.13 0.79 0.06 TransitionIDA 0.04 0.09 0.01 0.06 0.05 0.04 0.10 Level
0.42 1.32 -0.55 -0.25 -0.19 -0.15 0.15 TransitionUS -0.04 0.15 0.03 0.00 0.07 0.07 0.07 0.10 Level
0.05 -0.79 -0.77 -0.40 1.67 0.00 0.14 1.50 0.69 TransitionUK 0.07 0.32 0.33 0.21 0.23 0.11 0.12 0.11 0.10 Level
2.56 2.18 0.30 -0.92 -0.92 -1.12 -0.32 1.54 1.20 TransitionFrance -0.13 -0.18 -0.11 -0.09 0.01 -0.04 -0.04 Level
-0.86 -0.71 -0.96 -0.44 0.28 0.01 0.31 TransitionJapan 0.12 0.08 0.03 -0.02 0.12 0.19 0.16 0.09 Level
-0.15 0.38 0.17 0.29 0.58 -0.51 2.32 -0.65 Transition
4. Democracy defi ned in levels: 1 (most democratic) to 7 (least democratic) from Freedom HouseAll ODA -0.15 -0.01 -0.09 -0.09 0.01 -0.12 -0.10 Level IDA -0.23 0.00 -0.25 -0.14 0.00 -0.08 -0.14 Level US -0.26 -0.05 -0.20 -0.08 -0.13 -0.05 -0.20 Level UK -0.55 -0.38 -0.63 -0.48 -0.40 -0.25 -0.25 Level France 0.38 0.25 0.33 0.35 0.21 0.00 0.03 Level Japan -0.26 -0.08 0.00 -0.22 -0.17 -0.22 -0.16 Level
Notes: Coeffi cients signifi cant at 5 percent level with robust standard errors are shown in bold. Regressions with less than 40 observations are not shown (also a couple of regressions with dummies always equal to zero were omitted.)

27
Table 10 considers the response of donors over time to corruption, considering both the continuous cor-ruption rating and the “worst corruption” dummy. Th e results are somewhat similar to democracy. Th ere are more signifi cant coeffi cients after 1995, which supports the idea that the change in awareness of cor-ruption signifi ed by the Wolfensohn speech in 1996 aff ected donor behavior. On the downside, most of the signifi cance is concentrated in 1995-99 and mostly disappears in 2000-2003 (except for Wolfensohn’s IDA itself ). Applying the other test of whether we can reject equality of coeffi cients before and after 1996 (shown in the last column, based again on the pooled annual regression specifi cation from Table 7), the results are not supportive of a post-1996 shift. Only Japan shows a signifi cant change in coeffi cients.
Table 10: Results by donor on corruption – coeffi cient on corruption measure in regression of log aid on log per capita income, log population and corruption (signifi cant coeffi cients shown in bold)
Coeffi cient on log of real aid on freedom from corruption/1/2
1980-1984
1985-1989
1990-1994
1995-1999
2000-2003
Shift in coeffi cient after 1996
IDA 0.308 0.021 0.635 0.096US -0.337 -0.079 0.095 0.537 0.315 0.232UK 0.024 0.156 0.293 0.484 0.285 0.066France -0.204 0.147 0.122 0.067 -0.035 -0.087Japan -0.116 -0.415 0.254 1.043 0.214 0.444
Coeffi cient on log of real aid on dummy for worst corruption (=1 if corruption is <2 on 0 to 6 scale)
1980-1984
1985-1989
1990-1994
1995-1999
2000-2003
Shift in coeffi cient after 1996
IDA -0.597 -0.758 -1.11 -0.477US 0.43 0.348 -0.716 -1.299 0.098 -0.034UK 0.424 -0.571 -0.261 -1.164 -0.517 -0.139France 0.03 -0.499 -0.331 0.565 0.197 0.024Japan 0.839 1.276 -0.915 -2.848 -0.205 -0.689
Notes: Regressions for fi ve year averages of log of real ODA on log per capita income, log population and corruption measure; regressions with less than 40 observations are not shown. Corruption measures begin in 1983, measure runs from 0 (most corrupt) to 6 (least corrupt). Source: International Country Risk Guide.
Last column shows coeffi cient on slope dummy on corruption after 1996 in a pooled regression of annual log real aid by donor on log per capita income, log population, and year dummies, with standard errors clustered by country. Coeffi cients signifi cant at 5 percent level shown in bold.
We can summarize all of the results on selectivity diff erentiated by the donor that we would have expected various political events or shift in knowledge to aff ect most, to see if that improves the pattern of success. Table 11 shows the summary. Th e one-time shift for all donors towards increased sensitivity to need after the McNamara speech in 1973 was already noted, including the World Bank itself. Th e US, the main Cold War protagonist, shifted towards increased sensitivity to need after the end of the Cold War. Otherwise the results are pretty bleak. Th e World Bank shows no sign of increased sensitivity to policies despite the policy revolution it led after 1980. Th e data fail to confi rm the conventional wisdom about the US lending to corrupt dicta-tors during the Cold War and then changing its stripes afterwards. Th e World Bank failed to heed its own campaign against aid to corrupt rulers after 1996. Th e three donors—the UK, France, and Japan—that may have been less directly aff ected by the Cold War or by World Bank-led changes in development wisdom, fail to show any general trend towards improved selectivity over time in response to need, policies, or institutions.

28
Table 11: Results of selectivity tests diff erentiated by donor
Exogenous event Donor most aff ected
Prediction of shift
Increased sen-sitivity to:
Predicted ef-fect on donor most aff ected?
Predicted eff ect on all donors?
World Bank president McNamara initiative towards emphasizing poverty more, 1973
World Bank (IDA)
One-time shift Need YES YES
Increased emphasis on policies after 1980
World Bank (IDA) because of structural adjustment lending
One-time shift Infl ation NO NO
Openness NO NO
End of Cold War, 1990 USA One-time shift Need YES NODemocracy NO NOCorruption NO NO
Increased awareness of corruption, World Bank President Wolfensohn speech, 1996
World Bank (IDA)
One-time shift Corruption NO NO
Steadily increasing selectivity with respect to need, policies, institu-tions
UK Trend Need NO YES
Infl ation NO NOOpenness NO NODemocracy NO NOCorruption NO NO
France Trend Need NOInfl ation NOOpenness NODemocracy YES
Corruption NOJapan Trend Need NO
Infl ation NOOpenness NODemocracy NOCorruption YES
29
Learning from failureTh e other element of learning I will explore in the paper is aid agencies’ response to failure. How quickly do aid agencies learn that something is not working, and change their behavior accordingly? I examine three closely related episodes: structural adjustment lending 1979-2005, debt relief over the same period, and projection of growth rates. In all three cases, I concentrate on the low income countries that are also the primary recipients of foreign aid.
Structural Adjustment
Structural adjustment loan was the name given to rapidly disbursing loans from the IMF and World Bank made conditional on policy reforms in the recipient government. Th ey were introduced in late 1979, itself a refl ection of the learning process in aid agencies of the importance of national government policies for de-velopment. (Th e IMF is not usually considered an aid agency. However, the paper will argue that the IMF was equivalent to an aid agency in its policy towards low income countries in the structural adjustment and debt relief episodes.) Among the policy objectives of structural adjustment lending was correction of exces-sive budget and current account defi cits, which was supposed to prevent the development of debt crises.34
Structural adjustment loans (SALs) were supposed to generate “adjustment with growth,” in the language used in IMF and World Bank documents in the 1980s. African countries were among the fi rst to receive structural adjustment, but the failure of growth to revive in Africa quickly made the loans controversial.
Of course, the failure in Africa could refl ect reverse causality and adverse selection—more structural adjustment loans are given to countries that are experiencing economic crises and low growth. A useful metaphor is that of a patient coming to an emergency room—nobody would blame his condition on the hospital staff treating him. However, formal econometric studies that control for reverse causality and adverse selection suggest a zero or negative eff ect of structural adjustment loans on growth, and even little success at changing government macroeconomic policies (Easterly 2005, Przeworski and Vreeland 2004).35 Th e World Bank itself admitted failure of the early part of the adjustment lending period, but argued that it had improved over time:
In many cases where deep-rooted problems were not amenable to quick fi xes, fi rst-round re-forms such as trade liberalization were not accompanied by lasting reductions in poverty or improvements in social conditions. …Despite some successes, notably in East Asia, it became increasingly clear that adjustment programs would need to incorporate more direct measures to accelerate poverty reduction (World Bank 2001, pp. 26-27).
What did the IMF and World Bank learn from the failure of growth to respond to structural adjustment? Although the SALs were initially designed to achieve one-off correction of macroeconomic imbalances and policy distortions, they were frequently given one after the other to the same country. Even multi-stage structural adjustment would eventually have some positive exit tendency. If the problem was that the recipient country did not pursue the right policies, then it is not clear why new loans were given. To extend the metaphor above, if the emergency room patient kept having to be re-admitted, which could be either because the fi rst treatment didn’t work or the patient didn’t take the medicine, one might ques-tion whether the emergency room was the right treatment.

30
One interpretation of this pattern is that the Bank and the Fund followed a counter-productive response to failure –they kept repeating what had previously failed. Alternatively, the repetition of adjustment loans could itself be a consequence or indication of failure—if borrowing countries did not adjust cur-rent account balances or achieve growth, they had a high need for further adjustment loans to adjust to their now worsened external position (such as a higher debt to GDP ratio). In fact, the probability of receiving a new structural adjustment loan in a given year actually increased with the number of SALs received in the previous 10 years with the sample over 1988-2005 (see fi gure 9).
To judge this pattern, we have to ask what is the optimal probability of repeating structural adjustment? Th is is diffi cult to answer in the abstract—again, a multi-stage adjustment process may be optimal and the Bank and the Fund may have learned this in the course of adjustment lending. What seems less likely to be optimal is the upward slope of the graph in Figure 9. If the multiple adjustment treatment is successful, the probability of exit should increase in the number of loans, i.e. the probability of another treatment should decrease in the number of previous loans.
Against this, there could be adverse selection at work—that countries with more cumulative loans are those with deeper problems and thus may most need another loan. However, the sheer number of loans involved likely exceeded what the designers of structural adjustment had in mind for even the most dif-fi cult countries. In 1980-2005, 17 countries had spent 15 or more years under structural adjustment loans. Coupled with the evidence that recipients of structural adjustment loans had little or no tendency to improve their policies from one loan to the next (Easterly 2005, Van de Walle 2001), a story of multi-stage adjustment for the most diffi cult cases is not very plausible.
Figure 9: Probability of repetition of adjustment lending against cumulative loans
Probability of receiving a SAL in current year as function of # years receiving SALs in prior 10 years, 1988-2005
0
0.1
0.2
0.3
0.4
0.5
0.6
0.7
0.8
0 1 2 3 4 5 6 7 8 9
# of years receiving SAL in prior 10 years
Prob
abili
ty o
f new
SAL
in c
urre
nt y
ear

31
Other statistics that are useful to examine loan repetition are the Markov transition probabilities (Table 11). Across successive fi ve year periods, countries receiving 1 or more adjustment loans in one fi ve year period had around an 80 percent chance of getting another adjustment loan in the next fi ve year period. Th is com-pares to an average 42 percent chance of entering structural adjustment if the country did not have one in the previous fi ve year period (the sample universe in all these calculations is those eligible for SALs). Over time, the latter probability has been falling, while the repetition probability stayed roughly constant, so the bias towards repetition has increased. A common explanation off ered for this phenomenon is that the IMF and World Bank were engaged in “defensive lending,” making new structural adjustment loans so that the previous structural adjustment loans could be repaid. Given the Markov transition matrix using the period averages, the ergodic probability of being in a structural adjustment program (i.e. the unconditional prob-ability of being in the SAL state) is high—over two-thirds (Table 11).
Table 11: Transition probabilities for IMF and World Bank Structural Adjustment loans in suc-cessive fi ve year periods, 1981-2005
Period: 1986-90 1991-95 1996-2000 2001-05
Average transition probability for all periods
Probability of having one or more SALs in this fi ve year period con-ditional on having had one of more in previous fi ve year period 0.750 0.809 0.851 0.776 0.796
Period: 1986-90 1991-95 1996-2000 2001-05Probability of having one or more SALs in next fi ve year period con-ditional on NOT having had one in previous fi ve year period 0.606 0.414 0.333 0.333 0.422
Markov transition matrix based on average transition probabilities Time t
Time t+1 SAL No SALE r g o d i c probabilities
SAL 0.796 0.422 0.674No SAL 0.204 0.578 0.326
Th e IMF Executive Board itself noted the problem that some countries were perpetually under IMF supervision, without any exit in sight. Th ey commissioned a study from the Independent Evaluation Offi ce of the IMF on the problem, completed in 2002 (they labeled the phenomenon “prolonged exposure” and criticized the practice).
Th e IEO report in 2002 called for major reforms in IMF practice to prevent excessively prolonged time under IMF programs. To test whether this report had an eff ect on IMF practice, fi gure 10 checks wheth-er the average time spent in IMF programs during 2003-2005 is strongly associated with time in IMF programs from 1979-2002 (the countries in eastern Europe and the former Soviet Union are excluded because they were not eligible before the 1990s).

32
Figure 10: Th e association between time spent in IMF programs before (1979-2002) and after (2003-2005) the IEO report criticizing excessively prolonged time under IMF programs
MAR
AFGAGO
ARG
ATG
BDI
BEN
BFA
BGD
BHR
BLZ
BOL
BRA
BRB
BTNBWA
CAF
CHL
CHN
CIV
CMR
COG
COL
COMCPV
CRI
CUB
DJI
DMA
DOM
DZA
ECU
EGYETH
FJI
GAB
GHA
GIN
GMBGNB
GNQ
GRD
GTM
GUY
HND
HTI
IDN
IND
IRNIRQ
JAM
JORKEN
KHM
KIRKNA
KOR
LAO
LBNLBR
LBYLCA
LKA
LSO
MDG
MDV
MEX
MLI
MMR
MNG
MOZMRT
MUS
MWI
MYSNAM
NER
NGA
NIC
NPL
OMN
PAK
PANPER
PHL
PLW
PNG
PRY
RWA
SAUSDN
SEN
SLB
SLE
SLV
SOM
STP
SURSWZSYCSYR
TCD TGO
THA
TON
TTO
TUN
TZAUGA
URY
VCT
VEN
VNM
VUTWSM
YEM
ZAF
ZAR
ZMB
ZWE
.2
.4
.6
.8
.2 .4 .6 .8
Th e coeffi cient is around 1 and the constant is close to zero with a R-squared of 0.92, indicating that the IMF continued to lend more than average to the same countries that had spent above average time in IMF programs before the IEO report. Th e eff ect is more than one for one, rejecting any tendency for above average IMF loan recipients to regress back towards the mean. Again adverse selection could be biasing this association upwards independent of a “prolonged exposure” problem, except that again the amount of time spent in IMF programs for the worst cases seems too high to represent an optimal course of treatment for even the sickest patients. Critics from both the “left” and the “right” of the econom-ics profession have united in their criticism of repeated structural adjustment: Sachs (2002) complains about the “nearly continuous IMF programs, going on for twenty years or more, despite the fact that under its Articles of Agreement (Article I, Section V), the IMF is supposed to make funding ‘temporarily available’ for emergency relief, not continuously available for a country with unpayable debts.”
Despite the accumulating evidence of failure and the problem of repetition, very little change in struc-tural adjustment lending happened from 1980 to 1999. Finally, in 1999 the IMF and World Bank changed the name of the SALs for low income countries to Poverty Reduction and Growth Facilities (PRGFs) for the IMF and Poverty Reduction Support Credits (PRSCs) for the World Bank. Th is did not explicitly address the repetition problem; instead, it was advertised at the time as a shift towards more emphasis on poverty reduction, which apparently was a reaction to the criticism that adjustment programs did not try hard enough to protect the poorest part of the population.
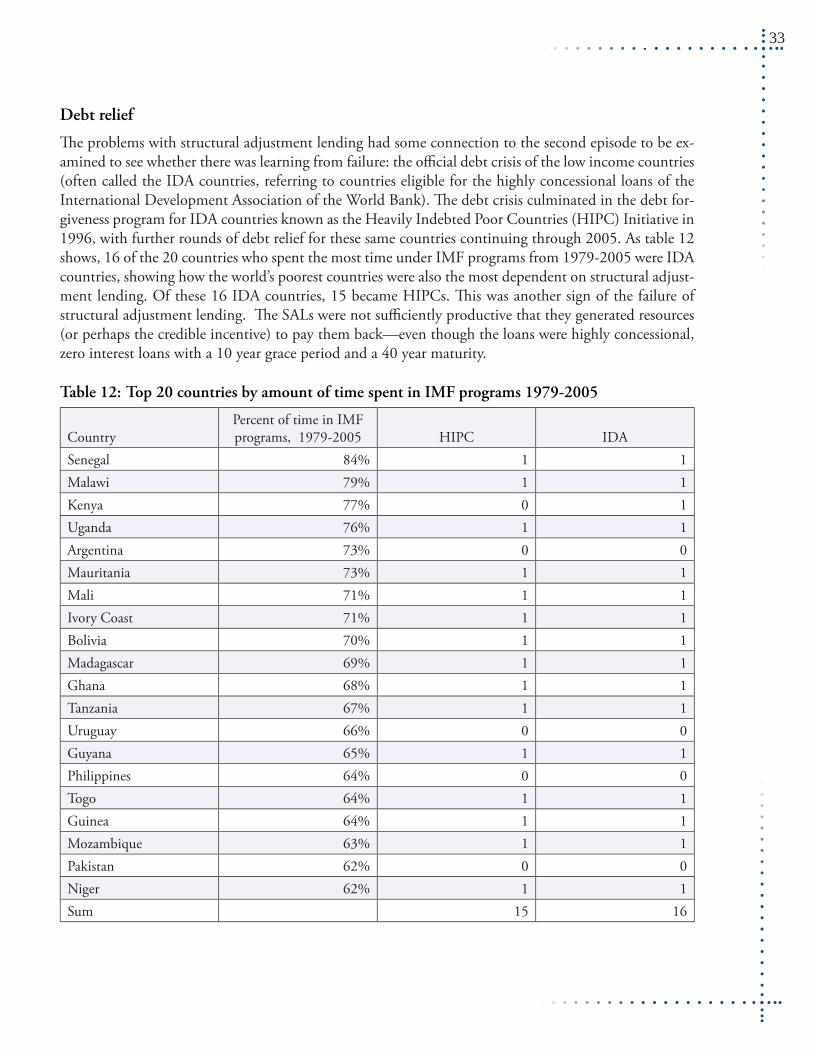
33
Debt relief
Th e problems with structural adjustment lending had some connection to the second episode to be ex-amined to see whether there was learning from failure: the offi cial debt crisis of the low income countries (often called the IDA countries, referring to countries eligible for the highly concessional loans of the International Development Association of the World Bank). Th e debt crisis culminated in the debt for-giveness program for IDA countries known as the Heavily Indebted Poor Countries (HIPC) Initiative in 1996, with further rounds of debt relief for these same countries continuing through 2005. As table 12 shows, 16 of the 20 countries who spent the most time under IMF programs from 1979-2005 were IDA countries, showing how the world’s poorest countries were also the most dependent on structural adjust-ment lending. Of these 16 IDA countries, 15 became HIPCs. Th is was another sign of the failure of structural adjustment lending. Th e SALs were not suffi ciently productive that they generated resources (or perhaps the credible incentive) to pay them back—even though the loans were highly concessional, zero interest loans with a 10 year grace period and a 40 year maturity.
Table 12: Top 20 countries by amount of time spent in IMF programs 1979-2005
CountryPercent of time in IMF programs, 1979-2005 HIPC IDA
Senegal 84% 1 1Malawi 79% 1 1Kenya 77% 0 1Uganda 76% 1 1Argentina 73% 0 0Mauritania 73% 1 1Mali 71% 1 1Ivory Coast 71% 1 1Bolivia 70% 1 1Madagascar 69% 1 1Ghana 68% 1 1Tanzania 67% 1 1Uruguay 66% 0 0Guyana 65% 1 1Philippines 64% 0 0Togo 64% 1 1Guinea 64% 1 1Mozambique 63% 1 1Pakistan 62% 0 0Niger 62% 1 1Sum 15 16

34
Th e announcement at the 2005 G-8 summit of 100% multilateral debt cancellation for the HIPCs was the latest in a long string of G-7 or G-8 summits granting progressively greater relief for low income debtors. As highlighted in the table in the introduction, low income debt has been problematic pretty much from the beginning. Th e following gives some of the incremental steps in debt relief over the past two decades, usually decided by the G-7 summit that year. Both those who want generous debt relief and those who want to “get tough” with debtors have criticized what Sachs (2002) called “the endless rounds of debt rescheduling.” Each set of progressively more favorable terms is named after the location of the G-7 summit36
1987 Venice Terms: interest rate relief on offi cial debt of low-income countries 1988 Toronto Terms: reduction in present value of bilateral debts allowed up to 33%.1991 London Terms: allowable debt reduction in present value raised to 50% 1994 Naples Terms: allowable debt reduction in present value raised to 67%1996—Lyons Terms and HIPC (Heavily Indebted Poor Countries) Debt Initiative, former raises allowable bilateral debt reduction 80%, latter writes down some Bank and Fund debt, “once and for all,” with a “sunset clause” to prevent repetition. Write down of multilateral credits to debt level that is “sustainable”, defi ned as 200-250 percent of exports..1999—Cologne Terms and “Enhanced HIPC.” Allowable debt reduction raised to 90 percent, threshold for sustainable debt lowered to 150 percent of exports.2004—World Bank and IMF extend “sunset clause” of HIPC initiative for the fourth time, to end 2006, closing eligibility for HIPC to new countries as of end-2004. However, countries that are eligible as of end-2004 that do not fulfi ll HIPC conditions by end-2006 will be considered for another extension.37
2005: G-8 Gleneagles summit agrees to 100% multilateral debt cancellation for HIPC countries (Multilateral Debt Relief Initiative or MDRI).
Although some of the offi cial debt originated with non-aid channels like export credit agencies or com-mercial banks, much of it was from concessional loans made by bilateral aid agencies, the IMF, and World Bank. Th e idea of the aid loan was that it enabled aid to be rotated amongst diff erent countries—an aid loan would fi rst have a productive impact in low income country A, who could then pay it back, where it could then be lent again to low income country B, and so on. Another justifi cation was that the aid loans would fi nance investments whose positive returns would make possible debt repayment. Th e record of debt relief is suggestive that the aid loan did not deliver on the promise of benefi cial recirculation of aid funds, and that positive returns to aid projects either were not realized or were not used to repay debt.
It seems that aid agencies have been slow to learn the lesson that low income debt was not fulfi lling its purpose, and in fact actions of the aid community may have made the debt problem worse. Th is is shown fi rst of all by the protracted process of debt relief, in which a little more relief was dribbled out each year. Many offi cials in aid agencies understood well the problem of moral hazard, and moral hazard is not an easy problem to solve in general. Still, it would likely have helped if the aid community as a whole had been able to make at least a partially credible commitment to some kind of one time only debt relief as opposed to an open-ended process of each year giving additional debt relief. As a result, poor countries
•••••
•
•
•

35
had perverse incentives to borrow more in the (correct) expectation that the debt would later be forgiven. Th e moral hazard problem developed more quickly than the learning of aid agencies how to address moral hazard.
Nothing in the latest rounds of debt relief appears to clearly address the problem of moral hazard. Th e IMF Executive Board acknowledged the risk, although not specifi cally mentioning the perverse incen-tives that were created by repeated rounds of debt relief:
Directors considered that the forward-looking DSF (Debt Sustainability Framework) will become an even more important tool for helping countries avoid unsustainable debt re-accumulation post-MDRI while seeking additional fi nancing to attain the MDGs {Millennium Development Goals}.. Th ey empha-sized that the primary responsibility to avoid new debt problems rests with the countries themselves, with technical assistance from the Fund and the World Bank. Directors acknowledged that a large number of low-income countries are increasingly aware of debt issues and have made signifi cant progress toward strengthening their debt management capacity.38
Th e World Bank Executive Board also stated the problem:
Executive Directors and IDA Deputies have expressed concern that this (MDRI) should not lead benefi -ciary countries to immediately begin re-accumulating debt levels that could become unsustainable.39
Th e main solution off ered to perverse incentives to re-borrow is that the IMF and the World Bank pledge to themselves limit their own new lending. Th eir main instrument for deciding how much to limit lend-ing is a “Debt Sustainability Analysis,” which analyzes the ability of the country to repay new loans. Th is seems to miss the crucial points that (1) the perverse incentives created by moral hazard makes “willing-ness to pay” more relevant than repayment ability, (2) aid agencies had already done “debt sustainability analysis” throughout the 80s and 90s, but it failed to prevent the HIPC crisis.
Th e aid agencies have been slow to re-examine the wisdom of making any new aid loans, despite the problems with the old loans. One solution to non-credible loans ripe with moral hazard is to ex-ante give grants. Although the Bush administration has been pushing IDA in this direction for several years, the World Bank’s other members have been slow to agree. (Grants may make sense to replace non-credible loans, but may have other problems such as not requiring the kind of long run investment that would generate returns to repay loans.) Figure 10 below shows that aid loans to Africa do not show any pro-nounced downward trend, although there is some fall after the mid-1990s. Despite the debt cancellation for HIPCs, the IMF and the World Bank continue to make new loans to HIPCs.

36
Figure 12: Grants and Loans to Africa
Aid to sub-Saharan Africa by type
1961
1963
1965
1967
1969
1971
1973
1975
1977
1979
1981
1983
1985
1987
1989
1991
1993
1995
1997
1999
2001
2003
Tot
al a
id in
200
3 m
illio
n do
llars
(log
bas
e 10
scal
e)
ODA GrantsODA Loans Net
1,000
10,000
100,000
100
As to the “debt sustainability analysis,” it seems to suff er from a problem that contributed to the repeti-tion of adjustment loans and the development of the HIPC debt crisis in the fi rst place: excessive op-timism about growth. Th e optimism of IMF and World Bank growth projections have been noted for decades (see for example World Bank 1991), but apparently, as the IMF Independent Evaluation Offi ce

37
2002 report notes still, “internal incentives in the IMF encourage overpromising in programs.”40 Th e IEO notes more hopefully that “the recent initiative to improve the Fund’s analysis of public and external debt sustainability emphasizes the need to discipline projections.”41
Growth projections would be harmless rhetoric except that they infl uence the calculation of how much new debt countries can handle. Excessive optimism leads to overlending, as the IMF IEO report noted in the same report chastising the IMF for its practice of many repeated loans to the same borrowers. On average for IMF programs in the 1990s, the target GDP growth was 4 percent, but actual growth was only 2 percent.42 Since population growth is about two percent also, this means the actual growth of income per person was close to zero.
We now have a track record on HIPC growth projections since the HIPC program began in 1996. Has the practice of over-predicting growth rates, which contributed to the development of the HIPC crisis, been corrected in the process of resolving that crisis? We have a sample of 75 forecasts over 1996-2005 of 1-5 years ahead that could be compared to realized actuals. Each HIPC has had about 3 growth forecasts made over time, as the country has moved through successive rounds of becoming eligible for debt relief. Growth forecasts were excessively optimistic in 76 percent of the cases in which they can be compared to actual subsequent growth (each case represents an average over between 1 to 5 years, defi ned by the overlap between when the forecast was made and the data that has since become available, with fewer years in the later rounds of course). Th e excess optimism actually got worse from earlier to later rounds, with an average overprediction of 1.1 percentage points in the fi rst stage, 1.5 percentage points in the second stage, and 1.7 percentage points in the third stage.43
IMF and World Bank staff are very much aware of the problem of excessive optimism. A 2004 IMF and World Bank document on debt sustainability said “To the extent that debt dynamics in the program baseline scenario appear signifi cantly more benign than would be implied by the country’s previous re-cord, careful justifi cation for the more optimistic outlook would be required.”44 Despite this self-aware-ness of the problem of over-promising, the incentives seem to remain as strong as ever. A quick check of the most recent HIPC documents shows forecasts clinging to optimistic forecasts. African countries on average have never had fi ve consecutive years of 5 percent growth. However, the April 2006 Cameroon HIPC document projected 5.0% growth for 2006-2015, and 5.3% for the whole period 2006-2025.45
Similar recent examples of long-run forecasts around 5% include 2005-2006 reports for Congo (Braz-zaville), Ethiopia, Mali, and Rwanda.
Th e latest IMF and World Bank report on debt sustainability analysis in 2006 again noted that:Baseline projections tended to be more favorable than historical averages—refl ected in consistently lower debt-burden indicators—and it remains important to guard against excessive optimism.46
Th e cycle of repeated adjustment lending, repeated debt relief, and over-optimism on growth rates in recent years does not seem to promise any escape from the aid syndrome noted way back in 1972 by P.T. Bauer (1972): “Concessionary fi nance used unproductively leads to indebtedness which is then used as an argument for further concessionary fi nance.” Here, there seems to be some combination of political pressure and lack of perspective that prevents any real learning to be implemented in escaping the debt cycle.

38
ConclusionsTh e record of the aid agencies over time seems to indicate weak evidence of progress due to learning or changes in political support for poverty alleviation. Th e positive results are an increased sensitivity to per capita income of the recipient (although it happened long ago in the 1970s), a decline in aid tying, and decrease in food aid as a share of total aid. Most of the other evidence—increasing donor fragmentation, unchanged emphasis on technical assistance, little or no sign of increased selectivity with respect to poli-cies and institutions, the adjustment lending-debt relief imbroglio—suggests an unchanged status quo, lack of response to new knowledge, and repetition of past mistakes.
Th e paper does not address the reasons for the failure to progress. Since the aid agencies contain many talented economists who are aware of many of the problems documented here (as shown by some of the quotes above), perhaps there is pressure to continue in certain directions in foreign aid regardless of whether they are productive. Th e political economy that leads to that unhappy result would be a rich area for further study.
Th is paper also has had little to say about what to do about the donors’ failure to make progress. Th ere could be new mechanisms that bypass aid agency bureaucracy, such as Michael Kremer’s proposal to cre-ate a funded incentive for new vaccine development.
Easterly (2006) argues that the relative invisibility of aid agency actions contributes a lot to the unsatis-factory state of foreign aid. Many diff erent constituencies, both academic and political, have called for increased monitoring and evaluation of aid agencies.47 Optimistically, one can hope that more systematic evaluation would give aid agencies more leverage to resist perverse political pressures and more incentive to learn more from past mistakes.

39
Endnotes1. Published in Economic Policy. Th is paper was prepared for the October 20-21, 2006 Panel Meeting of Economic Policy in Helsinki, which was subsequently rescheduled for February 12, 2007 at the New York Federal Reserve Bank, due to a FinnAir strike. I am grateful for the comments and suggestions of the editor, Paul Seabright, all the other editors of Economic Policy, extensive comments by the discussants Allan Drazen, Raquel Fernandez, and Jonathan Temple, and audience discussion at the New York Federal Reserve, and for comments from a seminar at the Brookings Institution. I am grateful to Tobias Pfutze and Julia Schwenkenberg for research assistance.2. Some authors span the diff erent generations of debate—Stern (1976) dismissed the critique of Bauer, and the same author was in charge of the Blair Commission on Africa (2005).3. IDA is the pure “aid” part of the World Bank. It was set up in 1960 to provide highly concessional loans to the poorest coun-tries. Th e rest of World Bank lending is not considered aid, since it is loans at market interest rates to middle income countries.4. Admittedly, zero is somewhat arbitrary. Nonzero but very slow progress may also be judged unsatisfactory. Still it is a step forward to see if we can reject the hypothesis of zero progress.5. A correspondingly large academic literature on donor coordination is summarized in Bigsten (2005).6. Wilson (1987), p. 268. Th e quote is from Harold Seidman.7. O’Connell and Soludo 2001 found that donor fragmentation was higher in Africa than in other continents, using the same measure used here.8. Th is accords with an earlier estimate by Jepma (1991).9. Th is is from OECD DAC data for the shares of total amount of ODA by DAC donors (only OECD members) classifi ed as tied or partially tied.10. One of the classic statements of this argument was Isenman and Singer 1977.11. Th ese complaints surfaced long ago in the academic literature, e.g. Loomis 1968.12. An important impetus in the change in opinion about free trade and development was the Bhagwati-Krueger NBER proj-ect of case studies of trade protection and growth in the 1970s. Anne Krueger eff ectively advocated the pro-free trade position when she was chief economist of the World Bank in the early 1980s, supported by researchers such as Bela Balassa. 13. Drazen (1999) presents a strong political economy argument in favor of tough selectivity as promoting political reform in the recipient.14. Th e statement was probably based on the 2004 Working Paper version of Dollar and Levin, but the revised version from 2006 does not change in important ways as far as the discussion in this paragraph.15. An earlier exercise by Goldin, Rogers, and Stern (2002) asserted that donors had become more selective in the 1990s using the World Bank’s Country Policy and Institutional Assessment (CPIA) policy index. Although this index is confi den-tial and not available to researchers in general, I did have data on this policy index at the time from within the World Bank and found (with a co-worker Amar Hamoudi) these results turned out only to hold in a sub-sample of aid recipients (IDA borrowers) that also excluded India and Indonesia. If all aid-receiving countries are included, or if India and Indonesia are included, then “good policy” countries received signifi cantly less aid per capita then “bad policy” countries at the end of the 1990s, contradicting the Goldin et al (2002) claims. 16. Some examples of recent works in this literature are Alesina and Dollar (2000), Andersen, Hansen, Markussen (2005), Akram (2003), McGillivray, M, Leavy, J., & White, H. (2002), and Boschini and Olofsgård (2002). An earlier wave of research included Maizels and Nissanke (1984) McKinlay and Little (1979), McGillivray, M. (1989, 1992), and White (1992).17. Th ere had been SOME diff erentiation between lower and higher income “Th ird World” countries previously, as refl ected in the creation in 1960 of the International Development Association of the World Bank to give concessional loans to low income countries.18. Th e source for per capita income is Penn World Tables Version 6.1 through the year 2000. Th e source for population is the World Bank’s World Development Indicators (WDI). Per capita income is updated through 2003 using constant price per capita GDP growth rates from WDI. Missing values in earlier years in PWT 6.1 are also fi lled in using WDI per capita growth rates whenever data is available.

40
19. Th e bias towards small countries could be optimal if there is a fi xed cost of implementing an aid program in each country. It also could be a way for donors to diversify risk if their projects are infl uenced by each country government’s actions. How-ever, it could also refl ect donors’ desire to maximize their visibility (good for aid fund raising from legislatures) by operating in as many countries as possible. 20. Th e original data from Sachs and Warner (1995) ended in 1994. Easterly, Levine and Roodman 2003 updated the index to 1998. 21. Bruno and Easterly 1998 and Easterly 2005 suggested 40 percent as a threshold where the association of infl ation and growth is robustly signifi cant and negative. Th e results in the aid selectivity fi gure are less signifi cant with a continuous mea-sure of (log) infl ation.22. Th is could be related to the diffi culty in enforcing conditionality analyzed in Svensson (2002) and documented in Easterly (2005).23. Alesina and Dollar (2000) emphasize the importance of strategic considerations and alliances in aid allocation, measured by proxies such as UN voting patterns and former colonial possessions, which tend to distort aid away from good policies and institutions.24. Helping Countries Combat Corruption: Th e Role of the World Bank, Poverty Reduction and Economic Management, Th e World Bank, September1997.25. Another landmark on corruption is the founding of Transparency International by a former World Bank offi cial in 1993.26. Polity IV has three measures of degree of democracy or autocracy: a 0 to 10 index for democracy, a 0 to 10 index for autocracy, and democracy—autocracy for “polity” ranging from -10 to 10. Th e democracy and autocracy index were com-puted separately because the database authors believed that autocracy was a somewhat diff erent phenomenon than democracy and not its simple opposite. In practice, however democracy and autocracy have a strong inverse correlation of -.86, so for example, a country getting a 10 for autocracy would very likely get a zero for democracy. Source: Polity IV web site at Uni-versity of Maryland: http://www.cidcm.umd.edu/inscr/polity/. I use the fi rst measure because of its specifi city to measuring “democracy,” which is the concept of interest to donors.27. Th ere is some question about how reliable this corruption information was, or how widely it was available. Of course, this is partly endogenous, as any donor that cared about corruption (or all donors together) could invest eff ort in gathering the available data. Other indicators of corruption became available with Transparency International beginning in 1995, and with the World Bank Kaufmann and Kraay exercise to measure corruption and other institutions based on a weighted average of all other ratings (available beginning in 1996). Th ere is high correlations between these measures.28. Th is fi nding is very similar to Dollar and Levin (2006).29. One confounding issue here is that there may be reverse causality—higher aid could cause higher corruption. Svensson (2000) found evidence for this in countries that are ethnically divided. 30. Alesina and Weder (2002) fi nd no evidence that more bilateral or multilateral aid goes to less corrupt countries. (1970-1995).31. Th e defi nition of democratic transition chosen here to corresponds well to Brender and Drazen’s (2005) list of “new democracies.” Of their 36 “new democracies,” 2 are industrial countries and not in this paper’s sample, 29 are captured by this paper’s criterion, and 5 are not. Th is paper’s criterion also resulted in the inclusion of a number of 19 other democratic transitions that were not on Brender and Drazen’s list. However, when we consider the large number of observations (352 in the panel of fi ve year changes) defi ned NOT to be democratic transitions/new democracies in either this classifi cation or that of Brender and Drazen, there is a strong association between this classifi cation and that of Brender and Drazen. 32. To match the fi ve year change to the average aid for the period, the change is defi ned as from the year before to the last year of the fi ve year period. Th us for example, for aid 1990-94, the transition is the change in democracy from 1989 to 1994.33. Alesina and Dollar (2000) found democracy to signifi cant for all ODA in a fi ve year panel for 1970-95, controlling for strategic interests like colonial linkages and similarity in UN voting patterns. It was not signifi cant for the same regression for 1980-95. For the same bilateral donors we consider here, they found democracy conditional on strategic interests to be signifi cant for aid in a panel of fi ve year averages for 1970-94 for the UK, the US, Japan, but not for France. Although the results here are similar, the calculation in this paper is diff erent in that it does not condition on strategic interests, which seems appropriate for evaluating absolute performance of donors relative to objectives and development knowledge.34. Drazen (2002, 2000) has a rich discussion of under what conditions IMF conditionality facilitate economic reform.

41
35. Svensson (2003) has an insightful discussion of why conditions on aid tend to fail because donors feel pressure to disburse funds even if conditions are not met.36. Source is from Sachs (2002) and Easterly (2002).37. International Monetary Fund and International Development Association (2006), p. 4.38. International Monetary Fund (2006a).39. p. 10, World Bank (2006a).40. Independent Evaluation Offi ce (2002), p. 12.41. Ibid., p. 216.42. Baqir, Ramcharan, and Sahay (2003).43. I am grateful to the World Bank’s HIPC Department for providing me with this data.44. International Monetary Fund and International Development Association (2004), p. 27.45. International Monetary Fund (2006b).46. International Monetary Fund and the World Bank (2006).47. see the discussion of evaluation in Banerjee and He 2003, and the Center for Global Development’s program on the “Evaluation Gap” (http://www.cgdev.org/section/initiatives/_active/evalgap).

42
ReferencesAlesina, Alberto and David Dollar (2000). Who Gives Foreign Aid to Whom and Why? Journal of
Economic Growth, 5, 33–63.
Alesina, Alberto and Beatrice Weder (2002). Do Corrupt Governments Receive Less Foreign Aid? American Economic Review, 92(4), 1126-37.
Andersen, Th omas Barnebeck, Henrik Hansen, Th omas Markussen (2005). US Politics and World Bank IDA-Lending, DISCUSSION PAPERS, Institute of Economics University of Copenhagen, May.
Akram, Tanweer (2003). Th e international foreign aid regime: who gets foreign aid and how much? Applied Economics, 35, 1351-1356.
Banerjee, Abhijit V. and Ruimin He (2003). Th e World Bank of the Future. American Economic Review, 3(2), 39-44.
Baqir, R., R. Ramcharan, and R. Sahay (2003). Th e Consistency of IMF Programs, International Monetary Fund Working Paper.
Barro, Robert J. and Jong-Wha Lee (2005). IMF Programs: Who Is Chosen and What Are the Eff ects? Journal of Monetary Economics, 52(7), 1245-69.
Bauer, Peter T. (1972). Dissent on Development, London and Cambridge, MA.
Bauer, Peter T. (1975). N. H. Stern on Substance and Method in Development Economics, Journal of Development Economics, 2(4), 387-405.
Boschini, Anne D. and Anders Olofsgård (2002). Foreign Aid: An Instrument for Fighting Poverty or Communism? Stockholm University, Dissertion in Economics, Chapter 4. (forthcoming: Journal of Development Studies).
Brender, Adi and Allan Drazen (2005). Political Budget Cycles in New Versus Established Democracies. Journal of Monetary Economics, 52(7).
Brown, Adrienne, Mick Foster, Andy Norton, and Felix Naschold (2001). Th e Status of Sector Wide Approaches. Overseas Development Institute, London.
Bruno, Michael and William Easterly (1998). Infl ation Crises and Long-run Growth. Journal of Monetary Economics, 41, 3-26.
Burnside, A. Craig and David Dollar (2000). Aid, Policies, and Growth. American Economic Review.
Cassen, Robert (1987), Does Aid Work? Report to an Intergovernmental Task Force, Clarendon Press: Oxford, U.K.
Chenery, Hollis B. (1974). Redistribution with Growth: Policies to Improve Income Distribution in Developing Countries in the Context of Economic Growth a Joint Study [commissioned] by the World Bank’s Development Research Center and the Institute of Development Studies, University of Sussex, World Bank, University of Sussex.

43
Chenery, Hollis B. and Alan M. Strout (1966), Foreign Assistance and Economic Development. Th e American Economic Review, 6(4), 679-733.
Commission for Africa (2005). Our Common Interest: Report of the Commision for Africa, London.
Dollar, David and Victoria Levin (2004) Th e Increasing Selectivity of Foreign Aid, 1984-2002. World Bank Policy Research Working Paper 3299 (revised 2006).
Dollar, David, and Jakob Svensson (2000). What Explains the Success or Failure of Structural Adjustment Programs. Economic Journal 110, 894-917.
Drazen, Allan (2002). Conditionality and Ownership in IMF Lending: A Political Economy Approach; IMF Staff Papers, 49, 36-67.
Drazen, Allan (2000). Political Economy in Macroeconomics, Princeton University Press: Princeton, NJ.
Drazen, Allan (1999). What Is Gained By Selectively Withholding Foreign Aid?, University of Maryland: College Park, MD.
Easterly, William (2005). What did structural adjustment adjust? Th e association of policies and growth with repeated IMF and World Bank adjustment loans. Journal of Development Economics 76, 1-22.
Easterly, William (2003). Can Foreign Aid Buy Growth? Journal of Economic Perspectives, 17(3), 23-48.
Easterly, W., R. Levine and D. Roodman (2004). New data, new doubts: A Comment on Burnside and Dollar’s “Aid, Policies, and Growth,” (2000). American Economic Review, 94(3), 776-780.
Easterly, William (2002). How did the heavily indebted poor countries become heavily indebted? Reviewing 2 decades of debt relief. World Development, 30(10), 1677-1696.
Easterly, William (2006). Th e White Man’s Burden: Why the West’s Eff orts to Aid the Rest Have Done So Much Ill and So Little Good. Penguin Press: New York.
Goldin, Ian, Halsey Rogers, and Nicholas Stern (2002). Th e Role and Eff ectiveness of Development Assistance. A Case for Aid: Building a Consensus for Development Assistance, World Bank: Washington DC.
Independent Evaluation Offi ce, (2002). Report of the IEO on Prolonged Use of IMF Resources, International Monetary Fund, Washington DC, 2002
International Monetary Fund (2006a). IMF Executive Board Concludes First Review of Low-Income Country Debt Sustainability Framework and Implications of the Multilateral Debt Relief Initiative, Public Information Notice (PIN) No. 06/61.
International Monetary Fund (2006b). Cameroon: Enhanced Heavily Indebted Poor Countries (HIPC) Initiative—Completion Point Document and Multilateral Debt Relief Initiative (MDRI). Washington, DC: IMF.
International Monetary Fund and International Development Association (2004). Debt Sustainability in Low-Income Countries—Proposal for an Operational Framework and Policy Implications. Washington, DC: IMF.

44
International Monetary Fund and International Development Association, (2006). Heavily Indebted Poor Countries (HIPC) Initiative—List of Ring-Fenced Countries that Meet the Income and Indebtedness Criteria at end-2004. Washington, DC: World Bank.
International Monetary Fund and the World Bank, (2006a). Review of Low-Income Country Debt Sustainability Framework and Implications of the MDRI. Washington, DC: World Bank.
IMF and World Bank (2006b). Global Monitoring Report, 2006: Strengthening Mutual Accountability, Aid, Trade and Governance, Washington, DC: World Bank.
Isenman, Paul J. and H.W. Singer (1977). Food Aid: Disincentive Eff ects and Th eir Policy Implications. Economic Development and Cultural Change, 25(2), 205-237
Jepma, Catrinus J. (1991). Th e Tying of Aid. OECD Development Centre: Paris.
Knack, Stephen, and Aminur Rahman (2004), Donor Fragmentation and Bureaucratic Quality in Aid Recipients. Policy Research Working Paper 3186, World Bank: Washington, DC
Loomis, Ralph A. (1968). Why Overseas Technical Assistance is Ineff ective. American Journal of Agricultural Economics, 50(5), 1329-1341.
Maizels, A., & Nissanke, M. K. (1984). Motivations for Aid to Developing Countries. World Development,12(9), 879-900.
McKinlay, R. D., & Little, R. (1979). Th e US Aid Relationship: A Test of the Recipient Need and Donor Interest Models. Political Studies, 27(2), 236-250.
McGillivray, M. (1989). Th e Allocation of Aid among Developing Countries: A Multi-Donor Analysis Using a Per Capita Aid Index. World Development, 17(4), 561-568.
McGillivray, M. (1992). A Reply. World Development, 20 (11), 1699-1702.
McGillivray, M, Leavy, J., & White, H. (2002). Aid Principles and Policy: An Operational Basis for the Assessment of Donor Performance. New Perspectives on Foreign Aid and Economic Development. Westport, CT: Praeger Publishers.
O’Connell, S. and Soludo, C. (2001), Aid Intensity in Africa. World Development, 29(9), 2537-53.
Organization for Economic Cooperation and Development, Development Assistance Committee, Overseas Development Assistance Statistics (various years).
OECD (2005), Paris Declaration on Aid Eff ectiveness. Ownership, Harmonisation, Alignment, Results, and Mutual Accountability, OECD: Paris.
Pearson Commission (1969). Partners in Development: Report of the Commission on International Development, New York: Praeger Publishers.
Przeworski, Adam, and James Raymond Vreeland (2000). Th e Eff ect of IMF Programs on Economic Growth. Journal of Development Economics, 62, 385-421.
Raghuram G. Rajan and Arvind Subramanian (2005). Aid and Growth: What Does the Cross-Country Evidence Really Show? IMF Working Paper.

45
Rao, J. M. (1994). Judging Givers: Equity and Scale in Aid Allocation. World Development, 22(10), 1579-1584.
Rostow, Walt W. (1960). Th e Stages of Economic Growth: A Non-Communist Manifesto, Cambridge UK: Cambridge University Press.
Sachs, Jeff rey D. (2002). Resolving the Debt Crisis of Low-Income Countries, Brookings Papers on Economic Activity, 2002(1), 257-286.
Sachs, Jeff rey D. (2005).Th e End of Poverty: Economic Possibilities for Our Time, New York: Th e Penguin Press.
Svensson, Jakob (2003). Why Conditional Aid Does Not Work and What Can Be Done about It? Journal of Development Economics, 70(2), 381-402
Svensson, Jakob (2000). Foreign Aid and Rent-Seeking. Journal of International Economics, 51(2), 437-61
Stern, Nicholas H. (1974). Professor Bauer on Development. Journal of Development Economics, 191-211.
United Nations Development Program (2005). Human Development Report 2005: International Cooperation at a Crossroads: Aid, trade, and security in an unequal world. New York: United Nations Development Program.
United Nations Millennium Project (2005a). Investing in Development: A Practical Plan to Achieve the Millennium Development Goals (Main Report). New York: United Nations.
United Nations Millennium Project (2005b), Investing in Development: A Practical Plan to Achieve the Millennium Development Goals (Overview Report). New York: United Nations.
United Nations (2005). Th e Millennium Development Goals Report, New York: United Nations.
Van de Walle, Nicolas (2001). African Economies and the Politics of Permanent Crisis, 1979-1999, Cambridge, UK: Cambridge University Press.
White, H. (1992). Th e Allocation of Aid among Developing Countries: A Comment on McGillivray’s Performance Index. World Development, 20(11), 1697-1698.
Wilson, James Q. (1989) Bureaucracy: What Government Agencies Do and Why Th ey Do It, New York: Basic Books.
World Bank (1991). World Development Report 1991: Th e Challenge of Development, Washington DC: World Bank.
World Bank (1998). Assessing Aid, Washington DC: World Bank.
World Bank (2001). Adjustment Lending Retrospective: Final Report, Operations Policy and Country Services, Washington DC: World Bank.
World Bank (2006). IDA’S Implementation of the Multilateral Debt Relief Initiative, Resource Mobilization Department, FRM, Washington DC: World Bank.

46
Appendix: Defi nition of sectors for sectoral Herfi ndahl calculation (from OECD DAC foreign aid database)
I.1. EducationI.1.a) Education, Level Unspecifi edI.1.b) Basic EducationI.1.c) Secondary EducationI.1.d) Post-Secondary EducationI.2. HealthI.2.a) Health, GeneralI.2.b) Basic HealthI.3. Population Pol./Progr. & Reproductive HealthI.4. Water Supply & SanitationI.5.a) Government & Civil Society-generalI.5.b) Confl ict, Peace & SecurityI.6. Other Social Infrastructure & ServicesII.1. Transport & StorageII.2. CommunicationsII.3. EnergyII.4. Banking & Financial ServicesII.5. Business & Other ServicesII.ECONOMIC INFRASTRUCTURE AND SERVICESIII.1.a) AgricultureIII.1.b) ForestryIII.1.c) FishingIII.2.a) IndustryIII.2.b) Mineral Resources & MiningIII.2.c) ConstructionIII.3.a) Trade Policies & RegulationsIII.3.b) TourismIV.1. General Environment ProtectionIV.2. Women In DevelopmentIV.3. Other MultisectorIV.MULTISECTOR / CROSS-CUTTINGIX. ADMINISTRATIVE COSTS OF DONORSVI. COMMODITY AID / GENERAL PROG. ASS.VI.1. General Budget SupportVI.2. Dev. Food Aid/Food Security Ass.VI.3. Other Commodity Ass.VII. ACTION RELATING TO DEBTVIII. EMERGENCY ASSISTANCE & RECONSTRUCTIONVIII.1. Emergency Food AidVIII.2. Other Emergency and Distress ReliefVIII.3. Reconstruction ReliefX. SUPPORT TO NGO’SXI. UNALLOCATED/UNSPECIFIED

Phone: (202) 797-6000Fax: (202)797-6004
www.brookings.edu/global
The Brookings Institution1775 Massachusetts Ave, NWWashington, DC 20036
ISBN: 978-0-9790376-8-9