are asian stock markets characterized by rational speculative bubbles
DESCRIPTION
Stock MarketTRANSCRIPT

Lincoln University Digital Thesis
Copyright Statement
The digital copy of this thesis is protected by the Copyright Act 1994 (New Zealand).
This thesis may be consulted by you, provided you comply with the provisions of the Act and the following conditions of use:
you will use the copy only for the purposes of research or private study you will recognise the author's right to be identified as the author of the thesis and
due acknowledgement will be made to the author where appropriate you will obtain the author's permission before publishing any material from the
thesis.
Are Asian Stock Markets Characterized by Rational Speculative Bubbles?
A thesis
submitted in partial fulfilment
of the requirements for the Degree of
Master of Commerce and Management
at
Lincoln University
By
Bo Hu
Lincoln University
2011

Abstract of a thesis submitted in partial fulfilment of the
requirements for the Degree of M.C.M.
Are Asian Stock Markets Characterized by Rational Speculative Bubbles?
By Bo Hu
Seven Asian stock markets (Japan, South Korea, Singapore, China, Indonesia, Malaysia and
Philippines) were tested by using two methodologies. First, cointegration method tested the
long run relationship among stock prices, dividends and earnings. Second, duration
dependence method tested the hazard rate. The conclusion of this research is that rational
speculative bubbles existed in the Chinese, Indonesian and Malaysian stock markets, but not
in Japan, Singapore, Korea and Philippines over the sample period from 1991 to 2009; and
the presence of rational speculative bubbles is more prevalent in emerging than developed
stock markets. Further sub-period analysis shows that the rational speculative bubbles existed
mainly during the pre-financial crisis sub-period, but not in post-financial crisis sub-period.
In the case of the duration dependence test, weekly data was more sensitive than monthly
data in detecting speculative bubbles.
Keywords: Rational speculative bubbles; Asian stock markets; cointegration, duration dependence.

Acknowledgements
I would like to acknowledge the following people who made this thesis possible. First and
foremost, I have to show my deepest gratitude to my supervisor Dr. Gilbert. V. Nartea for his
encouragement, guidance and support from the initial to the final stage of my study. Thank to
Dr. Gilbert. V. Nartea for taking time to read my work with valuable comments and quick
feedback. I would also like to show my appreciation to my associated supervisor, who is Dr.
Baiding Hu. Dr. Baiding Hu assisted me on the statistical analysis to develop an
understanding for the analysis of the research in a number of ways.
Besides, I would like to thank to my family. This thesis could not be finished without their
support and love during the frustration time of my work.
Finally, I would like to offer my regards and blessings to my friends, George, Lee, Owen,
Andy and those good friends who are living with me for their understandings and supports on
me during the completion of this study. Thanks to George for helping me in the whole study
process. Thanks all the fellows and staff of the Faculty of Commerce for their assistance.

Contents
Chapter 1 Introduction 1
1.1 Introduction 1
1.2 Research Question 3
1.3 Research importance, implication and contributions 4
1.3.1 Research Importance 4
1.3.2 Research Implications 6
1.3.3 Research contributions 7
1.4 Research objectives 8
1.5 Outline of the Thesis 10
Chapter 2 Literature Review 12
2.1 Introduction 12
2.2 General rational speculative bubble model 12
2.2.1 Negative Skewness, Leptokurtosis and Positive Autocorrelation 12
2.2.2 Cointegration test 15
2.2.3. Duration dependence test 17
2.3 Review of studies on rational speculative bubble in stock markets 19
2.3.1 Evidence of rational speculative bubbles in Asian stock markets. 19
2.3.2 Evidence of rational speculative bubble in other international stock markets. 25
2.4 Conclusions 28
Chapter 3 Data and Methods 30
3.1 Introduction 30 3.2 Research Objectives 30
3.3 Research Hypotheses 32

3.4 Background on Asian stock markets 35
3.4.1 The Asian financial crisis 37
3.4.2 The Subprime loan financial crisis 38
3.5 Data Collection 38
3.5.1 Data for duration dependence test 38
3.5.2 Data for cointegration test 42
3.6 Testing Model Description 42
3.6.1 Summary Statistics 42
3.6.2 Multivariate cointegration test 42
3.6.3 Duration dependence test 45
3.7 Conclusion 47
Chapter 4 Results and Discussion
4.1 Introduction 48
4.2 Summary statistics 49
4.2.1 Monthly real returns: Full sample period 50
4.2.2 Monthly real returns: Subperiod analysis 50
4.2.3 Weekly real returns: Full sample period 51
4.2.4 Weekly real returns: Subperiod analysis 52
4.3 Duration dependence 70
4.3.1 Monthly returns: Full sample period 70
4.3.2 Weekly returns: Full sample period 71
4.3.3 Monthly returns: sub-period analysis 72
4.3.4 Weekly returns: sub-period analysis 73
4.4 Results of the unit root and Multivariate cointegration tests 79
4.4.1 The unit root test 79
4.4.2 Multivariate cointegration tests 82
4.5 Conclusion 92

Chapter 5 Conclusions, Limitations and Future Research Directions 95
5.1 Introduction 95
5.2 Overview of the study 95 5.3 Results of this study 97 5.3.1 Result for objective one 97 5.3.2 Result for objective two 97 5.3.3 Result for objective three 98 5.3.4 Result for objective four 98 5.4 Research implications 99 5.5 Conclusion 100
5.6 Limitations 101
5.6.1 Length of full sample period 101
5.6.2 Length of post-Subprime loan financial crisis sub-period 102
5.6.3 Sub-period analysis by cointegration test 102
Reference 104
Appendix 107

List of Figure and Tables
Figure 1 Monthly stock index levels for eight Asian markets 35
Table 3.1 Index Description 39
Table 4.1 Results of Summary Statistics 54
Table 4.2 Results of Duration dependence tests 75
Table 4.3 Results of the ADF and PP unit roots tests 81
Table 4.4 Results of Cointegration tests 85
Table 4.5 The summary of Appendix 1 89

Are Asian Stock Markets Characterized by Rational Speculative Bubbles?
1
Chapter 1 Introduction
1.1 Introduction
According to the dividend discount model (DDM) there is a long run relationship
between stock price and dividends (James and Farrell, 1985) given as follows:
Stock Price = Dividend per Share/ (Discount Rate – Dividend Growth Rate)
However, empirical evidence shows that sometimes the stock price deviates from
fundamental value, which can be explained by the presence of rational speculative
bubbles in the stock price (McQueen and Thorley, 1994). Rational speculative
bubbles occur when investors realise that stock prices are deviating from their
fundamental value, but they are still willing to pay a higher price for the stock because
they believe that the possible return derived from further increases in price more than
compensates them for the probability of a crash (Chan et al., 1998). This episode has
raised a problem for researchers and investors as to whether the stock market is
characterized by rational speculative bubbles rather than by fundamental factors alone.
Testing for the presence of rational speculative bubbles can be used by investors to
possibly predict market crashes, prompting them to change their investment strategies
in time. Therefore, testing for rational speculative bubbles in the stock market has
become an important task. Asian stock markets have experienced several apparent
boom and bust cycles in the last 20 years, which raises the question of whether they
were characterized by rational speculative bubbles during this period.
The characteristic found in markets traditionally believed to contain rational
speculative bubbles is that of a long sequence of increases in stock prices followed by
a dramatic price drop. The famous historical examples of rational speculative bubbles

Are Asian Stock Markets Characterized by Rational Speculative Bubbles?
2
include the Dutch Tulipmania (1634-1637), the Mississippi Bubble (1719-1720) and
the South Sea Bubble (1720) (McQueen and Thorley, 1994; Chan et al., 1998). Most
researchers and investors ascribe the stock price drops to bubble bursts. For example,
practitioners believe that the U.S. stock market was characterised by bubbles in the
mid-1980s, because the strong performance by U.S. stocks was followed by a
dramatic price drop in 1987. The situation of the Asian stock markets in the 1990s
was similar to that of the 1980s’ U.S. stock market, with the Asian stock prices
dropping dramatically after 1997 (Asian financial crisis). Most Asian countries were
the victims of a stock market bubble and many previous studies have tested whether
the stock price behaviours in these stock markets were consistent with the
characteristics of rational speculative bubbles. Two major tests are employed by these
researchers, which are the cointegration test and duration dependence test.
The cointegration test can be used to test the long-run relationship between security
prices and fundamental variables. If the stock price and fundamental variables are
cointegrated, it is viewed as evidence against the existence of rational speculative
bubbles. On the other hand, if there is no cointegration relationship between stock
price and fundamental variables, rational speculative bubbles must exist. However,
the cointegration method is inaccurate. Firstly, the cointegration test relies heavily on
the correct identification of controversial fundamental variables. Furthermore, the
cointegration test has low power when limited data spans are used. Therefore, the
duration dependence test, as a new testable implication of the rational speculative
bubbles model, was developed by McQueen and Thorley (1994). They suggest that
rational speculative bubbles occur when investors have already realized that stock
prices exceed fundamental values but are reluctant to liquidate their position because

Are Asian Stock Markets Characterized by Rational Speculative Bubbles?
3
they believe that the probability of a high return will adequately compensate them for
the probability of the bubble bursting. As the bubble expands, its innovation is
positive and small, compared to an infrequent, large, negative innovation when the
bubble bursts. Therefore, if the stock market is characterized by rational speculative
bubbles, there is a negative relationship between the probability that a positive run
will end and the length of the positive run, namely a negative duration dependence or
a decreasing hazard rate. The benefit of the duration dependence test over the
cointegration test is that it does not require correct identification of the observable
fundamental components. Therefore, the multivariate cointegration method is used
only as a complement to the duration dependence method in this research.
The aim of this research is to test for the presence of rational speculative bubbles in
Asian stock markets by means of cointegration and duration dependence tests.
1.2 Research Question
Garber (1990) showed three famous historical examples of bubbles: namely the Dutch
Tulipmania, the Mississippi Bubble and the South Sea Bubble. A long-run up in the
price of U.S. stocks followed by a dramatic price drop in 1987 is another example of
rational speculative bubbles in the U.S. stock market over the period from 1929 to
1987 (Blancard and Raymond, 2004). If the stock market is characterized by rational
speculative bubbles, it will exhibit a boom and bust cycle during a time period
(Jirasakuldech et al. 2008). Applying this definition, we find that certain periods in the
Asian stock market appear consistent with the presence of rational speculative bubbles.
For example, most major Asian stock markets had strong performances before 1997,

Are Asian Stock Markets Characterized by Rational Speculative Bubbles?
4
however, after the Asian financial crisis, stock prices dropped dramatically. In 2007,
most Asian stock markets were affected by the subprime loan financial crisis. The
empirical evidence above has sparked a renewed interest in the presence of rational
speculative bubbles in Asian stock markets and rigorous statistical tests are needed.
Therefore, the research question is whether Asian stock markets were characterized
by rational speculative bubbles over the sample period from 1991 to 2009.
1.3 Research importance, implications and contributions:
1.3.1 Research importance:
There is still a debate about whether or not rational speculative bubbles exist in Asian
stock markets. Chan et al. (1998) have employed the duration dependence test to
examine six Asian stock markets (Hong Kong, Japan, Korea, Malaysia, Thailand,
Taiwan) and found that although Asian stock markets exhibited some unusual
characteristics over the sample period from 1975 to 1994, these characteristics do not
conform to those of rational speculative bubbles. This finding conflicts with those of
Sarno and Taylor (1999), who report evidence of rational speculative bubbles in East
Asian stock markets (China, Indonesia, Malaysia, Philippines, Singapore, South
Korea, Taiwan and Thailand, in addition to Japan and Australia) during the sample
period from 1989 to 1997. Sarno and Taylor, however, employed the cointegration
method. The two studies used similar sample period, both including 1989 to 1994, but
their results are completely different. So far, there is still no authoritative evidence of
whether or not rational speculative bubbles existed in Asian stock markets. Therefore,
it is important to test the presence of rational speculative bubbles in Asian stock

Are Asian Stock Markets Characterized by Rational Speculative Bubbles?
5
markets and to use the duration dependence test, complemented by a cointegration test,
to confirm the findings of this research.
Testing whether stock prices deviate from fundamental values can imply a new
security pricing concept. According to a standard efficient market model, the stock
price should be characterized by fundamental values. Hence
*
t tp p=
tp : stock market price
*tp : fundamental value of the stock
However, West (1987) found that the stock market price can deviate from the fundamental value by the rational speculative bubble factor, tb . Therefore, the
following formula shows the new stock pricing concept:
*
t t tp p b= +
tb : Rational speculative bubble factor
We can see that testing for the presence of rational speculative bubbles in stock
markets is important. When the investors realize that rational speculative bubbles
exist in the stock market, they have to reprice the stock portfolio which they hold or
will purchase. Investors could reconsider their entire investment portfolio, whether it
is overvalued or undervalued. Therefore, testing for the presence of rational
speculative bubbles in stock markets can help investors to make better decisions in
terms of stock repricing.

Are Asian Stock Markets Characterized by Rational Speculative Bubbles?
6
The sample period of previous studies on Asian stock markets only included one
financial crisis, namely the Asian financial crisis, but this research sample period also
tests the subprime loan financial crisis. Furthermore, this research tests the relative
sensitivity of rational speculative bubbles’ effect on financial crises, whether or not
the stock market is still characterized by rational speculative bubbles after the
financial crisis breaks out.
This study will explore the sensitivity of duration dependence tests for rational
speculative bubbles to the use of weekly versus monthly returns. It can help both
researchers and investors to better understand the duration dependence test, and
improve the efficacy of its use in determining the existence of rational speculative
bubbles in stock markets.
1.3.2 Research implications:
Understanding whether or not Asian stock markets are characterized by rational
speculative bubbles can help investors, or practitioners, to allocate their investment
funds efficiently. If investors find that the stock market is booming, but the stock
prices deviate from fundamental values (dividends and earnings), or the changes in
stock prices exhibit negative duration dependence (decreased hazard rate) which
means that there is a negative relationship between the probability that a positive run
will end and the length of the positive run, this stock market is characterized by
rational speculative bubbles. If the stock market is characterized by rational
speculative bubbles, it will exhibit a boom and bust cycle during a time period.
Testing for the presence of rational speculative bubbles can be used by investors to

Are Asian Stock Markets Characterized by Rational Speculative Bubbles?
7
possibly predict market crashes, and consequently use short-selling to benefit from
declining stock prices. Even though, in a country like China, it is impossible to benefit
from declining prices due to the prohibition of short-selling, the prediction that a stock
market will crash can force investors to act rationally by selling their stocks, thereby
adjusting the share prices toward their fair value as well as causing the market to be
efficient.
This study also provides important implications for policy makers. The presence of
rational speculative bubbles indicates the imperfections of stock markets and leads the
financial system and the macro economy to be unstable. In such cases, policy makers
should stabilize the financial system and steer the economy away from these rational
speculative bubbles by increasing interest rates, restricting short-selling of stocks,
controlling inside trading activities and increasing brokerage fees.
1.3.3 Research contributions:
Some previous research shows evidence of the presence of rational speculative
bubbles in Asian stock markets, such as Sarno and Taylor (1999), but some others
imply different results, such as Chan et al. (1998). Therefore, testing for rational
speculative bubbles existence in Asian stock markets is important. Strong evidence of
the presence of rational speculative bubbles in some emerging stock markets was
found, namely China, Indonesia and Malaysia although not in Philippines. Also, no
evidence of the presence of rational speculative bubbles was found in developed stock
markets, such as Japan, Korea and Singapore. Therefore, it would appear that
emerging stock markets are more conducive to the presence of rational speculative

Are Asian Stock Markets Characterized by Rational Speculative Bubbles?
8
bubbles than developed stock markets. However, the question of whether or not
rational speculative bubbles existed in Asian stock markets is still largely unanswered.
McQueen and Thorley (1994) found that for such bubbles to be rational, the
bubbles must be positive and explosive and Jirasakuldech et al. (2008)confirmed
their result. Jirasakuldech et al. (2008)found the presence of rational speculative
bubbles in the SET index in the first sub-period, ending with the Asian financial crisis
in 1997, but not in the post-1997 sub-period. This research will include two financial
crises, which are the Asian financial crisis and subprime loan financial crisis. The
results of this research can contribute to previous studies in terms of whether or not
the stock market was still characterized by rational speculative bubbles after the
subprime loan financial crisis.
Harman and Zuehlke (2004) found that the results of duration dependence tests for
weekly and monthly data are different, which calls into question the efficacy of using
duration dependence test for rational speculative bubbles. This research will use the
Asian stock markets example to find out to which kind of data duration dependence
results are more sensitive. .
1.4 Research objectives
(1) Test for presence of rational speculative bubbles in seven stock markets, which
include Japan, Singapore, Korea, China, Indonesia, Malaysia and Philippines.
(2) Test if the presence of bubbles is sensitive to selected subperiods.

Are Asian Stock Markets Characterized by Rational Speculative Bubbles?
9
(3) Test if the presence of bubbles is sensitive to types of markets i.e. emerging versus
developed stock markets.
(4) Test the sensitivity of duration dependence tests for rational speculative bubbles to
the use of weekly versus monthly returns.
The first research objective can be separated into two independent steps. First, the
Johansen-Juselius method is employed to test the cointegration relationship between
stock prices and fundamental variables for each of the seven countries (Japan,
Singapore, Korea, China, Indonesia, Malaysia and Philippines). Second, the duration
dependence technique is employed as a complement to the cointegration to test the
presence of bubbles for the sample countries. The first objective is important for the
research, because it is the path to finding whether or not rational speculative bubbles
exist in Asian stock markets.
The second objective is to test if rational speculative bubbles are more apparent in the
period leading up to known crises in the past. The sample period was separated into
pre- and post- 1997 Asian financial crisis subperiods and pre- and post- 2007
subprime loan financial crisis subperiods, then each was tested for the presence of
rational speculative bubbles.
The second research objective is important because it can test the relative sensitivity
of rational speculative bubbles’ effect on a financial crisis: whether or not the stock
market is still characterized by rational speculative bubbles after the financial crisis
breaks out. It can help policy makers to better understand stock markets and macro

Are Asian Stock Markets Characterized by Rational Speculative Bubbles?
10
economy after a financial crisis so they can choose the best way to stabilise the
financial system.
The third objective is to determine if rational speculative bubbles are more prevalent
in emerging rather than developed markets. To address this objective, the seven
markets were sorted according to their stage of development. China, Indonesia,
Malaysia and Philippines belong to the emerging markets while Japan, Singapore and
Korea are developed markets. First, emerging and developed markets were compared
in terms of the presence of rational speculative bubbles. Second, whether the presence
of bubbles is sensitive to the type of market--- emerging versus developed stock
market – was tested. It is very useful for investors to understand stock markets in
terms of rational speculative bubbles. As investors can earn high returns while the
bubbles are explosive and can also use short-selling to benefit from declining stock
prices.
The fourth objective is to test the robustness of the results of the duration dependence
test when using weekly versus monthly data: to test if duration dependence results are
sensitive to the kind of data used.
1.5 Outline of the Thesis
This research consists of five chapters. Chapter One introduces the background of
rational speculative bubbles, the research importance and research objectives. Chapter
Two provides an overview of the empirical research relative to the research topic.
Chapter three describes the source of data and methodology used in this research

Are Asian Stock Markets Characterized by Rational Speculative Bubbles?
11
Chapter Four discusses the results obtained. Chapter Five gives the conclusion, results
implications, and research limitations of the study.

Are Asian Stock Markets Characterized by Rational Speculative Bubbles?
12
Chapter 2
Literature Review
2.1 Introduction
This chapter reviews previous studies which identify the evidence for rational
speculative bubbles in stock markets. The general rational speculative bubble model is
reviewed in section 2.2 which introduces negative skewness, leptokurosis, positive
autocorrelation, the cointegration test, duration dependence test and other methods. In
section 2.3, previous studies on rational speculative bubbles in Asian and international
stock markets are reviewed. Finally, section 2.4 provides the conclusions for this
chapter.
2.2 General rational speculative bubble model
2.2.1 Negative Skewness, Leptokurtosis and Positive Autocorrelation
The presence of rational speculative bubbles in stock markets can be inferred from
strong evidence of negative skewness (Evans, 1986), leptokurtosis and positive
autocorrelation (Blanchard and Watson, 1982). These empirical attributes of rational
speculative bubbles result from the two traditional characteristics of the bubbles; a
long run-up in stock prices followed by a rapid crash, the probability of the bubble
continuing must be greater than 1/2 (McQueen and Thorley, 1994).
Negative Skewness

Are Asian Stock Markets Characterized by Rational Speculative Bubbles?
13
Skewness is a measure of the asymmetry of the probability distribution of real- valued
random variables. Negative skewness indicates that the left tail is longer and the mass
of the distribution is concentrated on the right of the figure with relatively few low
values. Chan et al. (1998) suggest that the expected value of the total price innovation
should be zero in an efficient stock market. However, if rational speculative bubbles
exist in a stock market, the probability of an abnormal positive return should be
greater than 1/2 which means the positive returns should be more than negative
returns. Therefore, the skewness of stock returns should be negative if rational
speculative bubbles exist in a stock market.
Leptokurtosis
Kurtosis is a measure of the “peakedness” of the probability distribution of a real-
valued random variable. A distribution with positive excess kurtosis is called
leptokurtic. And has a more acute peak around the mean. Jirasakuldech et al. (2008)
suggest that leptokurtic stock returns imply that the stock price changes occasionally
deviate by large amounts, an indication of the possible presence of rational
speculative bubbles and stock price departures from fundamental values.
Positive Autocorrelation
Autocorrelation is a mathematical tool for finding repeating patterns. If a stock
historically has positively autocorrelated returns, it indicates that the stock price
increased a lot over past time and investors may reasonably expect upward
movements of this stock price in the future. This is also characteristic of rational
speculative bubbles; investors realize that stock prices exceed fundamental values, but

Are Asian Stock Markets Characterized by Rational Speculative Bubbles?
14
they still believe there is a good probability that the bubble will continue to expand
and yield a high return (McQueen and Thorley, 1994).
Many previous studies used negative skewness, leptokurtosis and positive
autocorrelation as a diagnostic test for rational speculative bubbles. Chan et al. (1998)
find consistent evidence of leptokurtic distributions signalling the presence of rational
speculative bubbles in Asian stock markets,such as Hong Kong, Japan, Korea,
Malaysia, Thailand and Taiwan. However there is mixed evidence when it comes to
negative skewness and positive autocorrelation as shown in the studies of
Jirasakuldech et al. (2008), McQueen and Thorley (1994), Jaradat (2009) and Zhang
(2008).
Jirasakuldech et al. (2008) found the presence of rational speculative bubbles in the
Thai stock market could be inferred from strong negative skewness (-0.8371 for the
full sample period from 1975 to 2006, -1.1381 for the Pre-Asian financial crisis sub-
period from 1975 to 1997), excess kurtosis (3.6794 for the full period, 5.4394 for the
sub-period) and positive autocorrelation (0.0897 full and 0.1080 Pre-Asian crisis) of
returns. McQueen and Thorley (1994) also show monthly returns for value-weighted
portfolios have negative skewness (-0.3690), excess kurtosis (6.7441) and positive
autocorrelation (0.10).
Unfortunately, negative skewness, leptokurtic and positive autocorrelation tests for
the presence of rational speculative bubbles are inaccurate. McQueen and Thorley
(1994) found that time-varying risk premiums could induce autocorrelation, skewness
could also result from asymmetric fundamental news and excess kurtosis could be a

Are Asian Stock Markets Characterized by Rational Speculative Bubbles?
15
consequence of the batched arrival of information. Jaradat (2009) found strong
evidence for the presence of rational speculative bubbles in the Jordanian stock
market over the sample period from 1992 to 2007 although the skewness of monthly
returns was positive (0.6648). This result is the same as Zhang (2008), who found that
rational speculative bubbles existed in the Chinese stock market over a sample period
from 1991 to 2001, even though the skewness of weekly returns were positive (2.73
for the Shanghai Exchange and 1.33 for the Shenzhen Exchange). The reason is
probably that the characteristic movement of the indices are to increase very fast and
decline slowly.
2.2.2 Cointegration test
A cointegration approach is used to test the long-run relationship between stock prices
and fundamental variables. The lack of a cointegration relationship between prices
and fundamental values implies that rational speculative bubbles exist in the stock
market.
Using U.S. data, Campbell and Shiller (1987) found no evidence of a cointegration
relationship between annual stock prices and dividends for the S&P 500 index over
their sample period from 1959 to 1983. Also, Sarno and Taylor (1999) employed
cointegration analysis when investigating the moral hazard problem, asset price
bubbles, and capital flows during the East Asian financial crisis with their results
strongly suggest the existence of bubbles in the East Asian stock markets; namely
China, Indonesia, Malaysia, Philippines, Singapore, South Korea , Taiwan, Thailand
and Japan. Blancard and Raymond (2004) used cointegration tests to examine the

Are Asian Stock Markets Characterized by Rational Speculative Bubbles?
16
presence of rational speculative bubbles in the five developed stock markets of France,
Germany, Japan, UK and USA. The result of this research confirmed disconnection
between stock prices and dividends over the sample period from 1973 to 2002,
indicating the probable presence of rational speculative bubbles in these markets.
Furthermore, their results did not change when an additional fundamental variable
(earnings) was included.
In their study, testing whether rational speculative bubbles existed in the Thai stock
market over the sample period from June 1975 to June 2006, Jirasakuldech et al.
(2008) employed the Johansen- Juselius multivariate cointegration vector
autoregression approach to test the long run relationship among stock price, dividends
and earnings. Their results indicate that the trace test and the maximum eigenvalue
test cannot reject the null hypothesis of no cointegration between stock prices and
dividends at traditional significance levels. The null hypothesis of no cointegration
among stock prices, dividends and earnings also cannot be rejected. These results
imply that Thai stock prices deviated from fundamental values and the Thai stock
market was probably characterized by rational speculative bubbles.
From 1965 to 1999, a sharp divergence of London Stock Exchange equity prices
from dividends had been noted. Brooks and Katsaris (2003) investigated whether this
situation could be explained by the existence of rational speculative bubbles in the
London stock market. The authors employed three different empirical methodologies:
variance bounds tests, bubble specification tests and cointegration tests. The results of
this research showed that the London Stock Exchange equity prices deviated
significantly from fundamental values during the late 1990’s, which could be
explained by the presence of rational speculative bubbles.

Are Asian Stock Markets Characterized by Rational Speculative Bubbles?
17
Lee (1996) tested whether the log of U.S. stock prices, dividends and earnings moved
together during the sample period from 1871 to 1992. He found that the three series
were cointegrated with a single cointegrating vector, showing that there was an
equilibrium force that tended to keep the log of U.S. stock prices, dividends and
earnings together during the sample period, thus meaning there were no rational
speculative bubbles in the U.S. stock market then. This force was particularly strong
between earnings and dividends.
In summary, although, according to previous studies, a cointegration test is a useful
approach for detecting the presence of rational speculative bubbles it has its
limitations. Firstly, the test relies heavily on the correct identification of controversial
fundamental variables and, secondly, the cointegration test has low power when a
limited data span is used. 1Therefore, the multivariate cointegration method is only
used in this study as a complement to the duration dependence method.
2.2.3. Duration dependence test
Fortunately, the cointegration test is not the only technique that can test for the
presence of rational speculative bubbles. The duration dependence test, developed by
McQueen and Thorley (1994), is another powerful tool. McQueen and Thorley (1994)
believe that rational speculative bubbles occur when investors realize that the stock
prices have already exceeded fundamental values, but still think there is a high
probability that the bubble will continue to expand and yield a high return, thus this
good probability of high returns will compensate these investors for the probability of
1 The limitations of the cointegration test will be more fully explained in Chapter 3 (Data and Methods).

Are Asian Stock Markets Characterized by Rational Speculative Bubbles?
18
a crash. Therefore, if rational speculative bubbles exist in a stock market there will be
a negative relationship between the probability that a positive run will end and the
length of the positive run. In other words, the changes in stock prices will exhibit
negative duration dependence or a decreasing hazard rate. McQueen and Thorley
(1994) tested the monthly returns of NYSE stock portfolios, with the result rejecting
the no-bubble hypothesis, based on duration dependence tests. This significant
evidence of negative duration dependence in runs of positive abnormal returns could
be attributed to rational speculative bubbles.
Chan et al. (1998) also used duration dependence tests in evaluating evidence for
speculative bubbles in six Asian stock markets (Hong Kong, Japan, Korea, Malaysia,
Thailand and Taiwan) and the U.S. stock market by testing monthly and weekly stock
market returns of the seven stock markets over a sample period from January 1975 to
April 1994. However, Chan et al.’s (1998) results contradict those of McQueen and
Thorley (1994) for the U.S. stock market and none of the seven markets was
completely consistent with the predictions of the rational speculative bubbles model.
McQueen and Thorley (1994) found the strong evidence of presence of rational
speculative bubbles in U.S. stock market over the sample period from 1927 to 1991,
but Chan et al. (1998) showed that there is no rational speculative bubble in U.S.
stock market from1975 to 1994.
In other testing for the presence of rational speculative bubbles, Jirasakuldech et al.
(2008) found the cointegration methodology to be inaccurate for the reasons already
mentioned; therefore they also employed the duration dependence test as a
complement. The result of the duration dependence test confirmed that the Thai stock
market was characterized by rational speculative bubbles. Furthermore, they found

Are Asian Stock Markets Characterized by Rational Speculative Bubbles?
19
evidence of the presence of rational speculative bubbles in the SET index during the
first pre-1997 Asian financial crisis subperiod but not in the Post- 1997 subperiod.
In summary, the duration dependence test for detecting the presence of rational
speculative bubbles was developed by McQueen and Thorley (1994). Unlike other
tests, such as cointegration, negative skewness, leptokurtic and positive
autocorrelation, the duration dependence test is unique to rational speculative bubbles.
This test also specifically addresses nonlinearity by allowing the parameter
(probabilities of ending a run) to vary, depending on the length of the run and on
whether the run is of positive or negative abnormal returns hence the results of
duration dependence tests are more reliable. Consequently, the duration dependence
test is the main test used in this research and cointegration, skewness, kurtosis and
autocoreelation tests are used as its complements.
2.3 Review of studies on rational speculative bubble in stock markets
2.3.1 Evidence of rational speculative bubbles in Asian stock markets.
Chan et al. (1998) employ two types of tests to evaluate the evidence of rational
speculative bubbles in six Asian stock markets, namely Hong Kong, Japan, Korea,
Malaysia, Thailand and Taiwan, and the U.S. stock market. They used two types of
tests, the duration dependence and conditional skewness tests, when examining both
monthly and weekly stock market returns over the sample period of January 1975 to
April 1994. Consistent with the predictions of the rational speculative bubble model,
the returns from the seven stock markets generally exhibited positive autocorrelation,
negative skewness and leptokurtosis. However, the results of duration dependence

Are Asian Stock Markets Characterized by Rational Speculative Bubbles?
20
tests contradicted the results of conditional skewness tests. For the runs of positive
monthly indices' returns, the log-logistic function parameters (β) from the duration
dependence test are negative in Hong Kong, South Korea, Malaysia and Thailand, but
none of the coefficients are significant. This means that even though the log-logistic
function parameter (β) is negative, there is still no evidence of rational speculative
bubbles in these stock markets. On the other hand, Malaysia’s stock returns exhibited
significant negative duration dependence in runs of negative monthly returns, yet
McQueen and Thorley (1994) suggest that rational speculative bubbles cannot be
negative. The evidence of negative duration dependence in Malaysia must therefore
be driven by some other reasons, but not by rational speculative bubbles. The results
of weekly returns are similar to monthly returns’, only Thailand’s positive weekly
returns showing a significant β (β is -0.278 and the p-value is 0.06), therefore Chan et
al. (1998) concluded that none of the six Asian stock markets nor the U.S. stock
market has return characteristics that completely conform to the predictions of the
rational speculative bubbles model.
Some evidence suggests that the increasing returns prior to the crash in the Hong
Kong, Malaysia and Thailand stock markets are consistent with the presence of
rational speculative bubbles, but these markets collapsed from their peaks over several
months, unlike the instantaneous crash predicted by the theory. On the other hand, the
U.S. stock market crashed very quickly after October 1987, but the returns prior to the
crash tapered off slowly, unlike the increasing returns prior to the crash suggested by
the rational speculative bubble theory. Finally, Chan et al. (1998) suggest that only
some marginal empirical evidence can support the presence of rational speculative
bubbles in Asian stock markets.

Are Asian Stock Markets Characterized by Rational Speculative Bubbles?
21
Subsequently, however, the results of Sarno and Taylor (1999) partly contradict those
of Chan et al. (1998). Sarno and Taylor (1999) employ cointegration tests and data on
monthly aggregate stock prices and dividends for eight East Asian countries, China,
Indonesia, Malaysia, Philippines, Singapore, South Korea, Taiwan and Thailand, to
test the existence of rational speculative bubbles from 1989 to 1997. Their results
imply the existence of rational speculative bubbles in these East Asian stock markets.
Consequently, the difference between the two studies raises the question of whether
the Asian stock markets are characterized by rational speculative bubbles. However,
the differing results could be due to the differing sample periods: Chan et al. (1998)’s
being from 1975 to 1994 and Sarno and Taylor (1999)’s from 1989 to 1997. It could
be said that Chan et al. (1998) missed the two most important years for Asian stock
markets: 1995 and 1996. Until 1997, Asian countries received more than half of the
total capital inflow of the whole world. The Asian economies maintained high interest
rates, and foreign investors looked to Asia for a high rate of return. As a result, Asian
economies attracted a large inflow of money and the asset price went up dramatically,
with the foreign debt to GDP ratio rising from 100% to 167% from 1993 to 1996. At
the same time, the GDP of Thailand, Malaysia, South Korea, China, Singapore and
Indonesia grew at growth rates between 8% and 12%, an achievement called the
“Asian economic miracle” by the IMF and the World Bank. Therefore, during 1995
and 1996, namely the pre-Asian financial crisis period, when the Asian economy and
Asian stock markets grew dramatically, rational speculative bubbles may have existed.
In another study, Zhang (2008) utilizes weekly composite closing index prices of the
Shanghai and Shenzhen Exchanges to test the existence of rational speculative
bubbles in the Chinese stock market over the sample period of 1991 to 2001. This
research focuses on the Chinese Shanghai Composite Index (SHG) and the Shenzhen

Are Asian Stock Markets Characterized by Rational Speculative Bubbles?
22
Composite Index (SHZ), as they represent the whole Mainland China stock market.
The positive autocorrelation and leptokurtosis of stock returns imply that China’s
stock market had clear characteristics conforming to evidence of rational speculative
bubbles. Consistent with the summary statistics and correlation coefficient test, the
results of duration dependence tests show that the probability of ending a run of
positive excess returns decrease with the length of the return, further implying that
rational speculative bubbles existed in Mainland China’s stock market over the
sample period from 1991 to 2001.
Zhang (2008)’s results support Sarno and Taylor (1999) in terms of China’s stock
market, but Lehkonen (2010) finds it hard to show a clear answer as to whether
rational speculative bubbles existed in the Chinese stock market. Lehkonen (2010)
investigates the weekly and monthly price indices of both Mainland China and Hong
Kong. The sample period of Shanghai A-shares, Shanghai B-shares, Shenzhen A-
shares and Shenzhen B-shares is from 1992 to 2008; and Hong Kong China
Enterprises (HKE) and China Affiliated Corporations (HKA) indices are sampled
from 1993 to 2008. The results of weekly data show that the Shanghai A-share index
has a significant negative β coefficient, at -0.620, for the sample period, and the null
hypothesis of a constant hazard rate is rejected at the 1% significance level, with the
p-value of 0.0001. This implies that rational speculative bubbles existed in the
Shanghai A-share index over the sample period from 1992 to 2008. The weekly data
results for Shanghai B-shares, Shenzhen A-shares and Shenzhen B-shares are similar
to those of the Shanghai A-shares. On the other hand, the results of weekly data for
the Hong Kong China Enterprises and China Affiliated Corporations indices are
insignificant at traditional significance levels. As for runs of abnormal negative

Are Asian Stock Markets Characterized by Rational Speculative Bubbles?
23
returns, the constant hazard rate hypothesis is not rejected for any of the markets. The
results of weekly data therefore imply that rational speculative bubbles existed in the
Mainland Chinese stock markets but monthly data lead to different conclusions. None
of the markets has a significant negative coefficient β and the null hypothesis of no
rational speculative bubbles cannot be rejected by monthly data in any of these
markets. Therefore, the final results do not show a clear answer as to the presence of
rational speculative bubbles in China’s stock market, but confirm that the duration
dependence test is sensitive to the use of weekly data versus monthly data, and the
reliability of the duration dependence test for rational speculative bubble detection is
questionable.
In the Malaysian stock market, Ali et al. (2009) and Mokhtar et al. (2006) both find
evidence of rational speculative bubbles, consistent with the results of Sarno and
Taylor (1999). Ali et al. (2009) test the linkage between stock overreaction behaviour
and financial rational speculative bubbles by using duration dependence tests.
Monthly market returns from the Kuala Lumpur Stock Exchange Composite Index
(KLSE CI), over a sample period between January 1987 and December 2006, show no
clear evidence of stock overreaction behaviour in the market. They also use the
abnormal continuously compounded real monthly returns of the Kuala Lumpur
Composite Index (KLCI) to test for the presence of rational speculative bubbles over
the sample period between January 1989 and December 2006 using duration
dependence tests. Their results indicate the absence of rational speculative bubbles in
the KLCI over the full sample period. Interestingly, when the authors separate the full
sample period into two sub-periods, evidence of stock overreaction behaviour
becomes significant in the pre-crisis sub-period and seems to diminish in the post-

Are Asian Stock Markets Characterized by Rational Speculative Bubbles?
24
crisis sub-period. Therefore there is significant evidence for the presence of rational
speculative bubbles in the post-crisis sub-period, but not in the pre-crisis sub-period.
The final conclusion of this study is that the evidence for rational speculative bubbles,
observed in the Malaysia stock market in the post crisis period, is actually due to
stock overreaction that took place in the market prior to the crisis.
Mokhtar et al. (2006) employ a duration dependence test to investigate the existence
of rational speculative bubbles in the KLCI over a sample period from January 1994
to December 2003. The study split the analysis into three sub-periods: before the
Asian financial crisis (1994-1996), during the Asian financial crisis (1997-1998) and
after the Asian financial crisis (1999-2003). This research revealed the existence of
rational speculative bubbles in Malaysia’s stock market before and after the Asian
financial crisis sub-periods.
Jirasakuldech et al. (2008) employ both multivariate cointegration and duration
dependence tests to examine whether the Thai equity market was characterized by
rational speculative bubbles over their sample period from June 1975 to June 2006.
Conducted using monthly closing prices, corresponding dividend yields and price
earnings ratios of the SET index, the results of cointegration tests for the full sample
period, and pre-1997 Asian Crisis sub-period, cannot reject the null hypothesis of no
cointegration between stock prices and dividends at traditional significance levels.
The use of earnings in addition to dividends does not improve the results, but, for the
post-1997 Asian Crisis sub-period, the λtrace and λmax test provide evidence of
cointegrated relationships between stock prices and fundamental factors. Therefore,
the results of the cointegration tests imply that rational speculative bubbles existed in
the Thai stock market from 1975 to 2006, especially before the Asian financial crisis

Are Asian Stock Markets Characterized by Rational Speculative Bubbles?
25
happened. The results of the duration dependence test are the same as those of the
cointegration tests and are also consistent with the results of Watanapalachaikul and
IsIam (2007). That rational speculative bubbles exist in the Thai stock market is close
to the results of Chan et al. (1998who do not reject the null hypothesis of no rational
speculative bubble in the Thai stock market at a 5% significance level, but reject it at
a 10% significance level (β is -0.278 and p-value is 0.06).
Elsewhere, Rangel and Pillay (2007) employ four different tests; namely excess
volatility tests, unit root/cointegration tests, duration dependence tests, and the
intrinsic bubbles model, to examine the presence of rational speculative bubbles in the
Singapore stock market from January 1975 to January 2007. Results of all four tests
indicate that rational speculative bubbles were present over this sample period,
consistent with the findings of Sarno and Taylor (1999).
In conclusion, some studies show evidence of the presence of rational speculative
bubbles in Asian stock markets, but others imply different results. Therefore, the
question of whether or not rational speculative bubbles existed in Asian stock markets
is still largely unanswered.
2.3.2 Evidence of rational speculative bubble in other international stock
markets.
McQueen and Thorley (1994) apply the duration dependence test to the New York
Stock Exchange (NYSE) over the sample period of 1927 to 1991, and find significant
evidence of a negative hazard function in runs of positive returns for both equally-
weighted and value-weighted portfolios. They also show strong evidence of the
presence of rational speculative bubbles in the New York Stock Exchange (NYSE)

Are Asian Stock Markets Characterized by Rational Speculative Bubbles?
26
over the same period. The results for runs of excessive monthly equally-weighted
portfolio returns show decreasing hazard rates of 0.542, 0.409 and 0.154, relative to
run lengths of 3, 4 and 5 months respectively. The log-logistic function parameter (β)
for the equally-weighted runs of positive abnormal returns is -0.238, which means that
the probability of ending a run of abnormal positive returns decreases with the length
of the run, as predicted by the rational speculative bubble model. For the equally-
weighted portfolio, the null hypothesis of no rational speculative bubble is rejected,
with a 0.05 p-value for runs of positive returns. However, for runs of negative
abnormal returns of the equally-weighted portfolio, the constant hazard rate is not
rejected at traditional significance levels; the p-value being 0.65. For the positive runs
of the value-weighted portfolio, hazard rates decrease from 0.525 to 0.222, relative to
run lengths of 2 months to 5 months respectively. β for the value-weighted runs of
positive abnormal returns is -0.303 and it is significant at a p-value of 0.03, however,
β at -0.118 for negative runs is still insignificant at a p-value of 0.52.
In another study, Jirasakuldech et al. (2006) test for the presence of rational
speculative bubbles in the equity REIT industry from 1973 to 2003. They employ
different bubble identification techniques, cointegration analysis and a duration
dependence test using the cointegration procedures, but found no evidence of rational
speculative bubbles in the REIT market. Furthermore, both the trace test and
maximum eigenvalue test reject the null hypothesis of no cointegration relationship
between REIT price index and macroeconomic fundamental variables, namely the
consumer price index, industrial production, the risk premium and federal funds rate,
at 1% significance levels over the full sample period (1973 to 2003), the first
subperiod (1973 to 1991) or the second subperiod (1991 to 2003). The results of the

Are Asian Stock Markets Characterized by Rational Speculative Bubbles?
27
duration dependence test show no evidence of negative duration dependence,
suggesting that the REIT market is not affected by rational speculative bubbles. The β
of negative runs is 0.2656 and β of positive runs is -0.1440, however, the p-value is
too big, at 0.4716it is insignificant. Applying the same tests, they found similar results
in the Russell 2000 index, both for the cointegration test and duration dependence test.
Neither show the presence of rational speculative bubbles in the index over the sample
period from 1980 to 2003.
In Finland, according to unit root tests and cointegration analysis, Junttila (2003) finds
some evidence of rational speculative bubbles in the Helsinki Stock Exchange using
monthly data. Juntilla (2003) reports their presence mainly in the information
technology (IT) sector from 1991 to 2000.
From 1993 to 1999, the Financial Times All Share Index offered investors a return of
more that 200 percent over the six year period, which raises a question as to whether
rational speculative bubbles existed in the London stock market. Therefore, Brooks
and Katsaris (2003) use FIAS Index monthly closing prices and a constructed FTAS
dividend index from January 1965 to March 1999 to perform the tests for whether
stock prices in the London stock market reflect their fundamental values. The results
of the cointegration test show that the long-run relationship between stock prices of
the FTAS Index and dividends did not hold in the late 1990s, implying that the FTAS
Index was not driven by market fundamentals, hence rational speculative bubbles
existed in the London stock market during the sample period.
Furthermore, Hassan and Yu (2006) employed the long-established cointegration test
and the duration dependence test to examine the existence of rational speculative

Are Asian Stock Markets Characterized by Rational Speculative Bubbles?
28
bubbles from 1996 to 2003 in the nine frontier emerging stock markets: Bangladesh,
Botswana, Coted’Ivoire, Ecuador, Ghana, Jamaica, Kenya, Mauritius, and Trinidad &
Tobago. The results of the cointegration test tend to support the existence of rational
speculative bubbles in the frontier emerging stock markets, but the duration
dependence test does not show strong evidence.
In the Middle East, Jaradat (2009) employs the duration dependence test to examine
the presence of rational speculative bubbles in the Jordanian equity market known as
the Amman Stock Exchange (ASE index), over a sample period from January 1992 to
May 2007. The ASE index has a significant negative β coefficient of -0.0924 on
positive returns, with the p-value of 0.001. This evidence of negative duration
dependence in runs of positive returns is consistent with the presence of rational
speculative bubbles in the Jordanian stock market, and also consistent with the results
of summary statistics for ASE index monthly returns which are characterized by a
positive autocorrelation, negative skewness and leptokurtosis.
2.4 Conclusions
In this chapter, general rational speculative bubble models were reviewed in section
2.2 and previous studies on the presence of rational speculative bubbles in stock
markets were also reviewed in section 2.3. In section 2.2, the usefulness of negative
skewness, leptokurtic, positive autocorrelation, cointegration tests and duration
dependence tests were also examined. Compared with other tests, the results of the
duration dependence test seem more reliable, consequently the duration dependence
test is the main test utilised in this research. In section 2.3 previous studies on rational

Are Asian Stock Markets Characterized by Rational Speculative Bubbles?
29
speculative bubbles in Asian stock markets and other international stock markets were
reviewed. Some studies provided strong evidence for the presence of rational
speculative bubbles in U.S., and European stock markets and some Asian stock
markets’ performance were consistent with their presence, especially during the pre-
1997 Asian financial crisis period. However, other studies had opposing results and,
since there are conflicting points of view, there is a need to investigate this issue
further.

Are Asian Stock Markets Characterized by Rational Speculative Bubbles?
30
Chapter 3
Data and Methods
3.1 Introduction
This chapter discusses the data and methods used in this study to test for the presence
of rational speculative bubbles. The research objectives and hypotheses are identified,
followed by a description of the Asian stock markets in the sample countries of Japan,
South Korea, Singapore, China, Indonesia, Malaysia and Philippines. The data
collection is also discussed in this chapter followed, finally, by the model testing
method.
3.2 Research Objectives
In the literature review section, it was found that the Asian stock markets experienced
several apparent boom and bust cycles, with a long term boom followed by a dramatic
drop, in recent years. These unusual characteristics are similar to those of rational
speculative bubbles, which raises the question whether or not rational speculative
bubbles exist in Asian stock markets.
The first research objective is to test for presence of rational speculative bubbles in
eight Asian stock markets in seven countries Japan, Singapore, Korea, China
(Shanghai and Shenzhen stock markets), Indonesia, Malaysia and Philippines. This
objective is addressed by two independent tests. First, a duration dependence test is
performed on both monthly and weekly real returns of the eight stock markets. If the
stock prices are affected by rational speculative bubbles, price changes will exhibit
negative duration dependence (a decreasing hazard rate) (McQueen and Thorley,

Are Asian Stock Markets Characterized by Rational Speculative Bubbles?
31
1994). Second, the Johansen-Juselius multivariate cointegration method (Johansen,
1998; Johansen and Juselius, 1992) is employed as a complement to the duration
dependence test to examine for the presence of bubbles in the sample markets. This
method tests the cointegration relationship among monthly stock prices, dividends and
earnings of value-weighted portfolios for each of the seven. The benefit of the
duration dependence test over the cointegration test is that it does not require the
correct identification of the observable fundamental components, therefore the
duration dependence test is the main methodology, and the Johansen-Juselius
multivariate cointegration test is the associate methodology.
The second research objective is to test for rational speculative bubbles over sub-
periods. As Jirasakuldech etc. (2008) found, no cointegration relationship exists
between stock price and fundamental variables for Thai stock market over the pre-
1997 Asian financial crisis subperiod. However, a cointegrated relationship does exist
over the post-1997 subperiod, indicating that rational speculative bubbles existed
before the Asian financial crisis, and disappeared thereafter. In this research, the
sample period is divided into four parts, which are: pre- and post- 1997 (1991-1997
and 1997-2001) Asian financial crisis subperiods and pre- and post- 2007 (2001-2007
and 2007-2009) subprime loan financial crisis subperiods. Testing for the presence of
rational speculative bubbles in each subperiod can measure the relative sensitivity of
our results to the presence of extraordinary events.
The third research objective is to test if the existence of rational speculative bubbles
depends on the type of market. Consequently, the seven countries are sorted into
emerging and developed markets; China, Indonesia, Malaysia and Philippines

Are Asian Stock Markets Characterized by Rational Speculative Bubbles?
32
belonging to emerging markets and Japan, Singapore and Korea belonging to
developed markets.
The fourth research objective is to test the robustness of the results of the duration
dependence test by using weekly rather than monthly data. Previous studies have
employed a number of methods to test for presence of rational speculative bubbles in
stock markets, with the duration dependence method shown to be quite powerful.
However, prior research has questioned the efficacy of using duration dependence
tests especially when using monthly data versus weekly data. Harman and Zuehlke
(2004) have explored the sensitivity of duration dependence tests for rational
speculative bubbles in terms of monthly versus weekly data. They found evidence
supporting rational speculative bubbles in the NYSE (New York Stock Exchange)
portfolio with monthly data; however, there was no evidence of rational speculative
bubbles with weekly data. Lehkonen (2010) found that the empirical evidence from
weekly data indicate rational speculative bubbles exist in Shanghai A share, Shanghai
B share, Shenzhen A share and Shenzhen B share markets, however, the monthly data
fail to yield evidence of rational speculative bubbles in any. Therefore, this research
objective tests the sensitivity of the duration dependence method of detecting rational
speculative bubbles in terms of monthly data versus weekly data use.
3.3 Research Hypotheses
The following research hypotheses are based on the research objectives.
The first research objective is to test for the presence of rational speculative bubbles
in eight Asian stock markets; Japan, Singapore, Korea, China (Shanghai and
Shenzhen stock markets), Indonesia, Malaysia and Philippines.

Are Asian Stock Markets Characterized by Rational Speculative Bubbles?
33
Hypothesis 1(Duration dependence test):
The null hypothesis is that the “hazard rate” is constant, which means that the
probability of a positive run’s ending is unrelated to prior runs, implying that no
rational speculative bubble exists in any of the sample Asian stock markets. The
alternative hypothesis is that the “hazard rate” is decreasing, which means that the
probability of a positive run’s ending should decrease with the length of the run,
implying that the rational speculative bubbles existed in each of the sample Asian
stock markets::
H0: β=0
H1: β<0
Hypothesis 2 (Cointegration test):
The cointegration test (Trace test) is employed as a complement to the duration
dependence technique to test the presence of rational speculative bubbles in the
sample markets. The null hypothesis is that the cointegrating vector (r) is zero, in
other words, the non-stationary variables, such as stock prices, dividends and earnings
are not cointegrated, implying the presence of rational speculative bubbles. The
alternative hypothesis is that the r is bigger than zero, in other words, the non-
stationary variables, such as stock prices, dividends and earnings are cointegrated,
implying that no rational speculative bubble exists in the sample:
H0: r=0
H1: r>0

Are Asian Stock Markets Characterized by Rational Speculative Bubbles?
34
Hypothesis 3:
The second research objective is to test the sensitivity of the results to the presence of
extraordinary events. The null hypothesis is that rational speculative bubbles exist in
Asian stock markets in the subperiods ending with the Asian financial crisis in 1997
and subprime loan financial crisis in 2007 respectively, but not in the post- 1997 and
post- 2007 subperiods. The alternative hypothesis is that rational speculative bubbles
exist in Asian stock markets in the post- 1997 and post- 2007 subperiods, but not in
the pre- 1997 and pre- 2007 subperiods.
Hypothesis 4:
The third research objective is to compare emerging and developed markets in terms
of the presence of rational speculative bubbles. The null hypothesis is that rational
speculative bubbles are more prevalent in emerging stock markets than in developed
stock markets.
Hypothesis 5:
The last research objective is to test the robustness of the duration dependence test
results using weekly data. The null hypothesis is that the duration dependence test for
rational speculative bubbles is more sensitive to the use of weekly data than monthly
data.

Are Asian Stock Markets Characterized by Rational Speculative Bubbles?
35
3.4 Background on Asian stock markets
The following graphs (Figure 1) show changes in the major Asian stock indices over
the sample period from 1991-2009 (Shanghai A share and Shenzhen A share are from
1992).
Figure 1: Monthly stock index levels for eight Asian markets
Shanghai A share Index Shenzhen A share Index
Indonesia (Jakarta Composite Index) Malaysia (Kuala Lumpur Composite Index)
01000200030004000500060007000
1‐02
‐199
2
2‐01
‐199
4
2‐11
‐199
5
2‐09
‐199
7
2‐07
‐199
9
2‐05
‐200
1
2‐03
‐200
3
2‐01
‐200
5
2‐11
‐200
6
2‐09
‐200
8
0200400600800
10001200140016001800
1‐11
‐199
2
1‐06
‐199
4
1‐01
‐199
6
1‐08
‐199
7
1‐03
‐199
9
1‐10
‐200
0
1‐05
‐200
2
2‐01
‐200
4
2‐08
‐200
5
2‐03
‐200
7
2‐10
‐200
8
0
500
1000
1500
2000
2500
3000
1‐01
‐199
1
2‐01
‐199
3
3‐01
‐199
5
4‐01
‐199
7
5‐01
‐199
9
6‐01
‐200
1
7‐01
‐200
3
8‐01
‐200
5
9‐01
‐200
7
10‐01‐20
09
0200400600800
1000120014001600
1‐01
‐199
1
1‐10
‐199
2
1‐07
‐199
4
1‐04
‐199
6
1‐01
‐199
8
1‐10
‐199
9
1‐07
‐200
1
1‐04
‐200
3
1‐01
‐200
5
1‐10
‐200
6
1‐07
‐200
8

Are Asian Stock Markets Characterized by Rational Speculative Bubbles?
36
Philippine (Philippine Composite Index) Japan (Nikkei 225 Index)
South Korea ( KOSPI) Singapore (ST Index)
The eight Asian markets experienced several apparent boom and bust cycles in the
last twenty years and were deeply affected by two financial crises, namely the Asian
financial crisis and Subprime loan financial crisis.
05001000150020002500300035004000
1‐01
‐199
1
2‐01
‐199
3
3‐01
‐199
5
4‐01
‐199
7
5‐01
‐199
9
6‐01
‐200
1
7‐01
‐200
3
8‐01
‐200
5
9‐01
‐200
7
10‐01‐20
090
5000
10000
15000
20000
25000
30000
1‐01
‐199
1
1‐08
‐199
2
1‐03
‐199
4
1‐10
‐199
5
1‐05
‐199
7
2‐01
‐199
9
2‐08
‐200
0
2‐03
‐200
2
2‐10
‐200
3
2‐05
‐200
5
3‐01
‐200
7
3‐08
‐200
8
0
500
1000
1500
2000
2500
1‐01
‐199
1
2‐01
‐199
3
3‐01
‐199
5
4‐01
‐199
7
5‐01
‐199
9
6‐01
‐200
1
7‐01
‐200
3
8‐01
‐200
5
9‐01
‐200
7
10‐01‐20
09
0
100
200
300
400
500
600
1‐01
‐199
1
1‐08
‐199
2
1‐03
‐199
4
1‐10
‐199
5
1‐05
‐199
7
2‐01
‐199
9
2‐08
‐200
0
2‐03
‐200
2
2‐10
‐200
3
2‐05
‐200
5
3‐01
‐200
7
3‐08
‐200
8

Are Asian Stock Markets Characterized by Rational Speculative Bubbles?
37
3.4.1 The Asian financial crisis
Until 1997, Asian countries have received more than half of total capital inflow from
the whole world. The Asian economies in particular maintained high interest rates,
and foreign investors paid more attention on Asia for a high rate of return. As a result,
Asian economies have attracted a large inflow of money and the asset price went up
dramatically, and foreign debt to GDP ratio rose from 100% to 167% from 1993 to
1996. At the same time, the GDP of Thailand, Malaysia, South Korea, China,
Singapore and Indonesia grew at a growth rates around 8% to 12%. This achievement
was called “Asian economic miracle” by the IMF and the World Bank.
The Asian financial crisis started in Thailand in July 1997, and raised fears across the
other Asian economies. The deepest effects of the crisis were felt in Indonesia, South
Korea and Thailand, although the Philippines, Malaysia and Hong Kong were also
hurt by the slump. China, Singapore and Japan were even less affected, but also
suffered from this event. Sharp reductions in stock market values were seen in Asian
capital markets. The main stock index of Indonesia, namely the Jakarta Stock
Exchange, reached an historic low in September 1997; the Seoul stock exchange fell
by 4% on 7 November , 7% on 8 November, and 7.2% on 24 November; while
the PSE Composite Index, the main index of the Philippine Stock Exchange, dropped
1000 points from a high of some 3000 points in the same year. The Kuala Lumpur
Composite Index lost more than 50%, from above 1,200 points to fewer than 600
points during May to December and the Straits Times Index dropped 60% in less than
one year. Between 20 October and 23 October, the Hang Seng Index dropped 23% in
only 4 days. (Radelet and Sache, 1998).

Are Asian Stock Markets Characterized by Rational Speculative Bubbles?
38
3.4.2 The Subprime loan financial crisis:
The Subprime loan financial crisis of 2007 was triggered by a liquidity shortfall in the
United States banking system. The U.S. housing bubble began in 2001, reached its
peak in 2005, and collapsed in 2007. The fallout affected financial institutions
globally, with problems regarding bank solvency, decline in credit availability, and
the damage to investor confidence impacting global stock markets, especially in Asia
(Bianco, 2008). As Figure 1 shows, all of the sample stock indices exhibited
significant growth, reflecting their attractiveness to both domestic and international
investors, from 2002. However, after the U.S. housing bubble burst and the Subprime
loan financial crisis occurred, in 2007, the asset prices of Asian stock markets dropped
dramatically.
3.5 Data Collection
All the data used in this research was obtained from the DataStream Database.
3.5.1 Data for duration dependence test
This study used both monthly and weekly stock price indices of eight Asian stock
markets, which include the developed markets of Japan, South Korea and Singapore;
and the emerging markets of China, Indonesia, Malaysia and Philippines. The data
series used from the stock price indices are described in the following table:

Are Asian Stock Markets Characterized by Rational Speculative Bubbles?
39
Table 3.1: Index Description
Developed Market Index Name
Japan Nikkei225 Index
South Korea Korea composite stock price index
Singapore Straits Times DS.-Calculated index
Emerging Market Index Name
China Shanghai A - Share Index
Shenzhen A – Share Index
Indonesia Jakarta Composite Index
Malaysia Kuala Lumpur Composite Index
Philippines Philippine Stock Exchange Index
All the stock price indices are inflation adjusted using monthly and weekly inflation
rates computed from Consumer Price Index (CPI) data, which can also be collected
from the DataStream Database. The inflation series is computed by taking the first
differences of the natural logarithm of the CPI.
Inflation rate= 100 * (Ln CPIt – Ln CPIt-1)

Are Asian Stock Markets Characterized by Rational Speculative Bubbles?
40
The data used for the duration dependence test is the continuously compounded real
return of stocks. The monthly or weekly closing prices are transformed into
continuously compounded monthly or weekly returns thus:
Rt = 100 * (Ln Pt – Ln Pt-1)
Where Pt is the index closing price for month t, and Pt-1 is the closing price for the
month preceding. The monthly or weekly returns are then converted to the monthly or
weekly real returns by following the formula:
( )( )
1 Return RealReturn 1
1 Inflation Rate+
= −+
Monthly data versus Weekly data:
Both monthly and weekly indices are examined by using duration dependence tests
for a number of reasons. Firstly, Chan et al. (1998) suggest that the bubble theory
does not give an indication as to the typical length of the rational speculative bubble.
Most of the literature implies that rational speculative bubbles may build up over a
number of months or years, however, none of the previous studies gives a specific or
typical length for this bubble. Secondly, the monthly data series should be relatively
shorter hence the use of weekly data series provides us with a longer data set. 2
However, McQueen and Thorley (1994) suggest that the signal-to-noise ratio in
weekly data series is higher than in monthly data series. This could cause bubble-
related runs to be interrupted by noise. The signal-to-noise ratio is a measure used to
quantify how much a signal has been corrupted by noise and in testing data for the
presence of bubbles; the noise refers to changes in fundamental prices. The volatility 2 As shown in table 4.17 and 4.18 (in Chapter 4 Results and Discussions), during the same sample period, the observations of monthly data are around 50 and for the weekly data are around 230.

Are Asian Stock Markets Characterized by Rational Speculative Bubbles?
41
of weekly fundamental price changes is higher than the volatility of monthly price
changes; therefore, the high signal-to-noise ratio is a weakness of weekly tests relative
to monthly tests. Finally, Harman and Zuehlke (2004) suggest that duration
dependence test results are sensitive to the use of either weekly or monthly returns
China A-Share and B-Share:
China’s stock market is a special case compared with other stock markets, as it has
two classes of shares, namely A-Share and B-Share. Both of them are traded on two
major Stock Exchanges, the Shanghai and Shenzhen Stock Exchanges. A-Shares
traded in Renminbi, the currency of mainland China, were open to domestic investors
and qualified foreign institutional investors; while the B-Shares, traded in U.S. dollars
and Hong Kong dollars, were originally designed for overseas investors. This research
will test the mainland China stock market, excluding the Hong Kong stock market. As
the A-Shares are dominated by mainland Chinese investors and the B-Shares are
dominated by foreign institutional investors (Tan et al. 2008), the A-Shares are more
representative of the mainland China stock market than the B-Shares. Therefore, this
research will only use the A-Share indices data from both Shanghai and Shenzhen.
The emerging Asia-pacific stock markets have short price histories for example,
China’s stock market only started from 1991. Therefore, this research will analyze the
data over the sample period from 1991 to 2009, a collection of 18 years of monthly
and weekly data.

Are Asian Stock Markets Characterized by Rational Speculative Bubbles?
42
3.5.2 Data for cointegration test
The monthly value-weighted stock prices, dividends and earnings are indices of all
individual stocks whose components are weighted according to the total market value
of their outstanding shares. All of the individual stock prices, dividends earnings and
market values are obtained from DataStream Database.
3.6 Testing Model Description
In this section, summary statistics, duration dependence methods and multivariate
cointegration, are discussed in respect of their suitability to test for the existence of
rational speculative bubbles in stock markets.
3.6.1 Summary Statistics
Summary statistics can be used to test for the presence of rational speculative bubbles.
The presence of rational speculative bubbles in stock market can be inferred from
evidence of negative skewness, excess kurtosis and positive autocorrelation of real
returns.
3.6.2 Multivariate cointegration test
The Johansen-Juselius multivariate cointegration vector autoregression approach is
used to examine the long-run relationship between stock prices and fundamental
values. This research will choose two fundamental variables, namely value-weighted
dividends, and earnings. Campbell et al. (1997) show that the use of dividends as a
fundamental variable comes directly from the present value model of stock prices.
Earnings are included as an additional fundamental variable in this study; because it is

Are Asian Stock Markets Characterized by Rational Speculative Bubbles?
43
also an important determinant of stock pricing, consistent with the suggestions of Lee
(1996) and Lim (2005), who suggest that in addition to dividends, earnings also play
an important role in pricing stocks. This study will examine the cointegration between
value-weighted prices and dividends. It will also examine the cointegration among
value-weighted prices, dividends and earnings.
However, the cointegration method has its limitations. First, the cointegration test
relies heavily on the correct identification of controversial fundamental variables.
Brooks and Katsaris (2003) suggest that lack of cointegration may be caused by
model misspecification through the exclusion or misidentification of significant
variables that affect stock prices. Johansen (1991) shows that the lack of a
cointegration relationship between stock prices and dividends may not be caused by
the presence of rational speculative bubbles, but by other factors, such as large, highly
persistent shocks in the systems, or a change in the economic regime which would
bias the cointegration test in favor of no cointegration relationship (Chow, 1998). The
empirical evidence of Campbell and Shiller (1987) support this conclusion. They test
the cointegration relationship between U.S. stock prices and discounted dividends and
find that this methodology is very sensitive to the discount rate used.
Secondly, the cointegration test has low power when a limited data span is used.
Pierse and Snell (1995) show that consumption and wealth in the UK are not
cointegrated based on the sample period over 1966 to 1981, but cointegrated after
updating the span to 1987. Although the cointegration test seems weak in detecting
the presence of rational speculative bubbles, it is still the best analytical tool available
for identifying the presence of a long run relationship between stock prices and

Are Asian Stock Markets Characterized by Rational Speculative Bubbles?
44
fundamental variables (Brooks and Katsaris, 2003). Therefore, the multivariate
cointegration method is used as a complement to the duration dependence method.
The relationship between the variables is expressed per the following equation:
1 2t t t tp d yα β β μ= + + +
where:
α is the constant term, 1 2, ,β β are the coefficient for the independent variables.
pt = the monthly value-weighted stock price
dt = the monthly value-weighted dividends
yt= the monthly value-weighted earnings
tμ = the error term
If the stock prices and fundamental variables are cointegrated, it will be viewed as
evidence against the presence of rational speculative bubbles. The Johansen-Juselius
test is based on the following vector autoregression or VAR model:
1 1 1 1...t t k t k t k tX X X Xμ ε− − − − −Δ = +Γ Δ +Γ Δ +Π +
where, Xt is a vector of non-stationary variables, Xt = [pt, dt, yt]. If the rank of Π or
the number of cointegrating vectors (r) is zero, then the variables in vector Xt are not
cointegrated. Before testing the cointegration relationship among the three variables,
the Augmented Dickey – Fuller (ADF) and Phillips – Perron (PP) unit root tests are
first applied to the time series of the log of value-weighted stock price, dividends and
earnings (Dickey and Fuller, 1979; Phillips and Perron, 1988). All of the three
variables must have unit root or non-stationarity for any of the variables in their
logarithm form at traditional levels of significance, before we can perform the
cointegration analysis.

Are Asian Stock Markets Characterized by Rational Speculative Bubbles?
45
The Johansen-Juselius test is used to examine the cointegration relationship among
the three variables, which employs the trace ( traceλ ) and the maximum eigenvalue test
( maxλ ) to determine the number of cointegrating vectors.
The trace statistic method examines the null hypothesis that r = 0, or no cointegration,
against the alternative hypothesis of r > 0, or at most r, cointegrating vectors.
1( ) ln(1 )
p
trace ii r
r Tλ λ= =
= − −∑
The maximum eigenvalue method examines the null hypothesis that the number of
cointegrating vectors is r, against the alternative hypothesis that there are r+1
cointegrating vectors.
max 1( , 1) ln(1 )rr r Tλ λ ++ = − −
3.6.3 Duration dependence test
The duration dependence test developed by McQueen and Thorley (1994) is
employed as a further test of the presence of rational speculative bubbles. The
advantage of this test is that it does not require correct identification of the observable
fundamental components.
Rational speculative bubbles occur when investors have already realized that stock
prices exceed fundamental values but are reluctant to liquidate their position because

Are Asian Stock Markets Characterized by Rational Speculative Bubbles?
46
they believe that the probability of a high return will exactly compensate them for the
probability of the bubble bursting. As the bubble expands, its innovation is positive
and small compared to an infrequent large negative innovation when the bubble bursts.
Therefore, if the stock market is characterized by rational speculative bubbles, there is
a negative relationship between the probability that a positive run will end and the
length of the positive run, namely negative duration dependence or a decreasing
hazard rate. The sample hazard rate for each run length i is computed as
( )i
ii i
NhM N
∧
=+
which is derived from maximising the log-likelihood function of the
hazard function with respect to hi:
1
( ) (1 ) (1 )t i i i i i ii
L S N Lnh M Ln h Q Ln hα
θ=
= + − + −∑ (1)
where:
L = the number of run lengths of positive and negative returns
Hi = sample hazard rate
Ni = the numbers of completed runs of length i
Mi = the numbers of completed runs with length greater than i
Qi = the numbers of partial runs with length greater than i
The following functional form of the hazard function has been employed to test the
null hypothesis of no rational speculative bubbles:
( ln )
11i ih
e α β− +=+
(2)

Are Asian Stock Markets Characterized by Rational Speculative Bubbles?
47
The null hypothesis of no rational speculative bubble is that β = 0. The alternative
suggests that the probability of a positive run ending should decrease with the run
length or that the value of the slope parameter,β is negative (decreasing hazard rates).
The test is performed by substituting equation (2) into (1) and maximizing the log
likelihood function with respect to α and β . Under the null hypothesis of no rational
speculative bubble, the likelihood ratio test (LRT) is asymptotically distributed 2χ
with one degree of freedom.
LRT = 2[Log unrestricted – Log restricted] --- 21χ
3.7 Conclusion
This chapter described the data, presented the research objectives and the methods
used to achieve those objectives. The chapter briefly outlined the duration dependence
test developed by McQueen and Thorley (1994) and multivariate cointegration test
attributed to Johansen and Juselius (1992).
Chapter 4 Results and Discussion

Are Asian Stock Markets Characterized by Rational Speculative Bubbles?
48
4.1 Introduction
Rosser (1997) shows that speculative bubbles can be divided into rational and
irrational speculative bubbles. Rational speculative bubbles occur when investors
realise that stock prices deviate from their fundamental value but they are still willing
to pay a higher price for the stock because they believe that the possible returns
derived from further increases in price more than compensates them for the
probability of a crash (McQueen and Thorley, 1994). The irrational speculative
bubbles occur when the speculation develops as buyers make money with the rising
prices (some displacement from the fundamentals) and euphoria emerges. The
irrational “outsiders” start buying more while the smarter “insiders” bail out, and, as
too many insiders get out, prices reach a peak and begin to drift downwards. During
the initial “period of distress”, outsiders continue to hang on and expectations undergo
a major change. Eventually, something triggers a panic, which could be some bad
news regarding the fundamentals.,the outsiders sell suddenly in a rush to get out, and
the price falls sharply (Charles Kindleberger, 1989). This research concentrates on the
rational speculative bubbles; however, irrational speculative bubbles can also lead the
stock market to boom and bust.
This chapter reports the results of summary statistics, duration dependence, unit root
and multivariate cointegration tests.
The results of summary statistics for the monthly and weekly real returns of eight
stock indices namely, Shanghai A-Share index, Shenzhen A-Share index, Jakarta
Composite Index, Kuala Lumpur Composite Index, Philippine Composite Index,
Nikkei 225 Index, Straits Times Index and Korea composite stock price Index, are

Are Asian Stock Markets Characterized by Rational Speculative Bubbles?
49
reported in section 4.2. The results of section 4.3, for the duration dependence test, are
based on the log-logistic regression estimates of the hazard function and, finally,
section 4.4 reports the results of the unit root and Multivariate cointegration tests for
monthly value-weighted portfolios as a complement to the duration dependence test.
4.2 Summary statistics
Table 4.1, Panels 1 to 16, report the summary statistics for the monthly and weekly
real returns of eight stock indices. There are five panels in each table: panel A refers
to the full sample period, panel B covers the pre-1997 Asian financial crisis period,
panel C covers the post-1997 Asian financial crisis period, panel D covers the pre-
2007 subprime loan financial crisis period, and panel E covers the post- 2007
subprime loan financial crisis period.
Summary statistics can be used to test for the presence of rational speculative bubbles
as the presence of rational speculative bubbles in a stock market can be inferred from
evidence of negative skewness, excess kurtosis and non-normality of real returns.
Negative skewness indicates that the tail on the left side of the probability density
function is longer than the right side, which means the series has relatively few low
values. The negative skewness of real stock returns implies that the numbers of
positive returns are more than negative returns, and the movement of the stock index
is increasing slowly and declining fast, a characteristic of the presence of rational
speculative bubbles. Kurtosis is a measure of the "peakedness" of the probability
distribution of a real-valued random variable and distributions with excess kurtosis
(kurtosis greater than 3) are called leptokurtic. Compared to a normal distribution, a
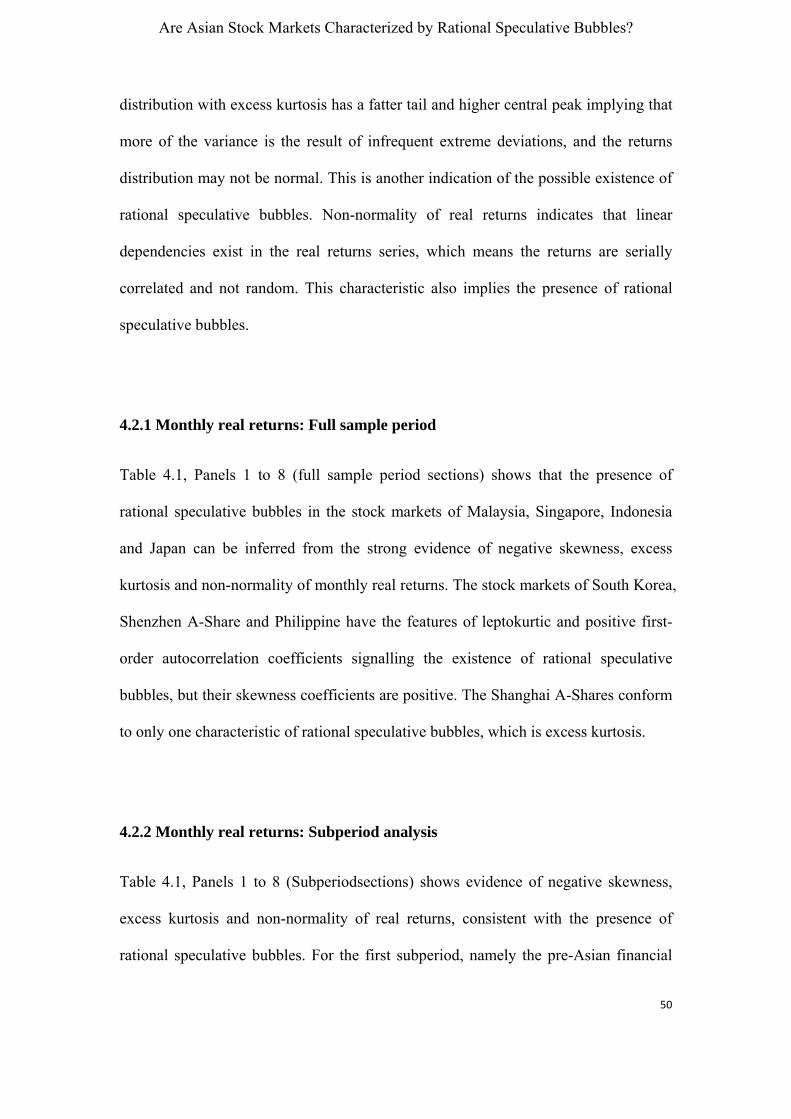
Are Asian Stock Markets Characterized by Rational Speculative Bubbles?
50
distribution with excess kurtosis has a fatter tail and higher central peak implying that
more of the variance is the result of infrequent extreme deviations, and the returns
distribution may not be normal. This is another indication of the possible existence of
rational speculative bubbles. Non-normality of real returns indicates that linear
dependencies exist in the real returns series, which means the returns are serially
correlated and not random. This characteristic also implies the presence of rational
speculative bubbles.
4.2.1 Monthly real returns: Full sample period
Table 4.1, Panels 1 to 8 (full sample period sections) shows that the presence of
rational speculative bubbles in the stock markets of Malaysia, Singapore, Indonesia
and Japan can be inferred from the strong evidence of negative skewness, excess
kurtosis and non-normality of monthly real returns. The stock markets of South Korea,
Shenzhen A-Share and Philippine have the features of leptokurtic and positive first-
order autocorrelation coefficients signalling the existence of rational speculative
bubbles, but their skewness coefficients are positive. The Shanghai A-Shares conform
to only one characteristic of rational speculative bubbles, which is excess kurtosis.
4.2.2 Monthly real returns: Subperiod analysis
Table 4.1, Panels 1 to 8 (Subperiodsections) shows evidence of negative skewness,
excess kurtosis and non-normality of real returns, consistent with the presence of
rational speculative bubbles. For the first subperiod, namely the pre-Asian financial

Are Asian Stock Markets Characterized by Rational Speculative Bubbles?
51
crisis subperiod, none of the eight stock markets has all three characteristics, while the
Malaysian and Philippine stock markets show evidence of negative skewness, excess
kurtosis and non-normality of monthly real returns in the post-Asian financial crisis
subperiod. Malaysia exhibits evidence of a bubble during the pre-subprime loan
financial crisis, while, during the post- subprime loan financial crisis subperiod, South
Korea, Philippines, Japan, Indonesia and Singapore stock markets have all three
characteristics signalling the presence of rational speculative bubbles.
4.2.3 Weekly real returns: Full sample period
For the full sample period of weekly real returns, (Table 4.1, Panels 9 to 16), only the
Singapore stock market has all three characteristics of rational speculative bubbles
returns. Furthermore, the first-order autocorrelation coefficients of South Korea,
Philippines and Indonesia are negative, conflicting with the features of rational
speculative bubbles. The Chinese stock markets, namely Shanghai A-share and
Shenzhen A-share, show evidence of excess kurtosis and non-normality of weekly
real returns, however, the skewness results are positivewhile Japan and Malaysia
exhibit only one feature that accords with the characteristics of rational speculative
bubbles, which is excess kurtosis.
4.2.4 Weekly real returns: Subperiod analysis

Are Asian Stock Markets Characterized by Rational Speculative Bubbles?
52
Table 4.1, Panels 9 to 16, shows the results of the sub-period analysis using weekly
returns. Panels 11 and 12 show that, for the pre-Asian financial crisis , the presence of
rational speculative bubbles in the Malaysian and Indonesian stock markets can be
inferred from the strong evidence of negative skewness, excess kurtosis and non-
normality of weekly real returns. None of the eight stock markets has all three
characteristics of presence of rational speculative bubble over the post-Asian financial
crisis subperiod. However, seven out of eight stock markets indicate the existence of
rational speculative bubbles over the pre-subprime loan financial crisis subperiod, all
except the Philippines. Furthermore, panels 10, 12, 15 and 16 shows that, for the post-
subprime loan financial crisis subperiod, Malaysia, Shenzhen A-share, South Korea
and Singapore stock markets have all three characteristics indicative of rational
speculative bubbles.
Summary
The full sample period analysis indicates the presence of rational speculative bubbles
in the stock markets of Malaysia, Singapore, Indonesia and Japan. The sub-period
analyses further indicate the presence of rational speculative bubbles in seven Asian
stock markets, those of China, Indonesia, Malaysia, Philippines, Japan, Korea and
Singapore, especially over the pre and post- subprime loan financial crisis sub-periods.
Therefore, the results of the summary statistics show strong evidence for the presence
of rational speculative bubbles in Asian stock markets over the sample period from
1991 to 2009.

Are Asian Stock Markets Characterized by Rational Speculative Bubbles?
53
This result is consistent with Chan et al. (1998), who reported that, for monthly
returns, Hong Kong, Japan, Malaysia, Thailand and Taiwan have negative skewness,
although South Korea exhibits positive skewness. All countries are leptokurtic and all,
except South Korea, exhibit positive first-order autocorrelation. Overall, the
consistent evidence of negative skewness, leptokurtosis and autocorrelation point to
the potential for rational speculative bubbles. Meanwhile, the Singaporean stock
market is consistent with Rangel (2007), who reported it exhibiting negative skewness
and leptokurtosis, while the Chinese stock markets are consistent with Lehkonen
(2010) and Zhang (2008) since both of them reported these markets exhibiting
positive skewness, leptokurtosis and positive first-order autocorrelation.

Are Asian Stock Markets Characterized by Rational Speculative Bubbles?
54
Table 4.1 Results of Summary Statistics (Panel 1)
Shanghai A-Share index real returns, monthly
Full sample period Subperiod 03/1992-12/2009 03/1992-09/1997 10/1997-06/2001 7/2001-11/2007 12/2007-12/2009 Observations 214 67 45 77 25 Mean 0.011350 0.021657 0.013118 0.012245 -0.022208 Maximum 1.016292 1.016292 0.164672 0.249818 0.143234 Minimum -0.461122 -0.461122 -0.129884 -0.120690 -0.289008 Standard Deviation 0.143014 0.219101 0.064135 0.076739 0.147781 Skewness 1.805501 1.603961 0.155466 0.666709 -0.709611 Kurtosis 15.45375 8.540332 2.859112 3.399615 1.963627 Jarque-Bera 1499.206 114.4194 0.218490 6.216776 3.216936 ρ 1 -0.037 -0.051 0.024 0.265 -0.268 ρ 2 0.088 0.034 0.089 0.041 0.386 ρ 3 -0.094 -0.113 -0.247 0.103 -0.069 ρ 4 -0.087 -0.207 -0.084 0.302 0.302 ρ 5 -0.086 -0.111 -0.171 0.136 -0.008 ρ 6 -0.042 -0.045 -0.072 0.080 -0.079 ρ12 -0.095 -0.068 -0.072 -0.026 -0.168 Q(6) 7.6155 5.4096 5.6780 16.339 9.6905 Q(12) 22.405 11.706 10.771 36.844 13.256 Notes:
1. All returns are continuously compounded. Monthly real returns in local currency are nominal returns less monthly inflation rates.
2. T is the number of monthly observations. Numbers in parentheses below the skewness and excess kurtosis coefficients are asymptotic standard errors,
(6/T)¹/² and (24/T) ¹/², respectively.
3. ρt is the sample autocorrelation at lag t.
4. Q(6) and Q(12) are the Ljung-Box portmanteau test statistics, identifying the presence of six-order and twelve-order autocorrelation, distributed as χ² with 6 and 12 degrees of freedom, and p-valuesare the marginal significance levels of the Ljung-Box test .

Are Asian Stock Markets Characterized by Rational Speculative Bubbles?
55
Table 4.1 (Panel 2)
Shenzhen A-Share index real returns, monthly
Full sample period Subperiod 12/1992-12/2009 12/1992-05/1997 06/1997-06/2001 07/2001-10/2007 11/2007-12/2009 Observations 205 54 49 76 26 Mean 0.008765 0.015311 0.007270 0.010575 -0.007305 Maximum 0.380431 0.380431 0.194666 0.229020 0.188516 Minimum -0.330526 -0.249451 -0.134418 -0.133816 -0.330526 Standard Deviation 0.110287 0.140617 0.073266 0.083533 0.160370 Skewness 0.046727 0.456143 0.501208 0.476318 -0.742416 Kurtosis 4.112496 3.279135 3.062209 2.677036 2.206494 Jarque-Bera 10.64617 2.047912 2.059443 3.204101 3.070576 ρ 1 0.047 0.112 -0.011 0.302 -0.251 ρ 2 0.116 -0.017 0.101 0.092 0.398 ρ 3 0.101 0.283 -0.213 0.166 -0.057 ρ 4 0.094 -0.027 -0.058 0.296 0.217 ρ 5 -0.023 -0.103 -0.103 0.112 0.030 ρ 6 0.069 0.220 0.012 0.129 -0.131 ρ12 0.012 0.135 -0.032 0.028 -0.061 Q(6) 8.4291 9.2482 3.8055 19.804 8.9551 Q(12) 12.643 12.435 5.5660 34.365 11.346 Notes:
1. All returns are continuously compounded. Monthly real returns in local currency are nominal returns less monthly inflation rates.
2. T is the number of monthly observations. Numbers in parentheses below the skewness and excess kurtosis coefficients are asymptotic standard errors, (6/T)¹/² and (24/T) ¹/², respectively.
3. ρt is the sample autocorrelation at lag t.
4. Q(6) and Q(12) are the Ljung-Box portmanteau test statistics identifying the presence of six-order and twelve-order autocorrelation., distributed as χ² with 6 and 12 degrees of freedom, and p-values arethe marginal significance levels of the Ljung-Box test.

Are Asian Stock Markets Characterized by Rational Speculative Bubbles?
56
Table 4.1 (Panel 3)
Indonesia (Jakarta Composite Index) real returns, monthly
Full sample period Subperiod 02/1991-12/2009 02/1991-07/1997 08/1997-08/2001 09/2001-12/2007 01/2008-12/2009 Observations 227 78 49 76 24 Mean -0.000809 0.000727 -0.026319 0.016886 -0.009748 Maximum 0.286522 0.166262 0.286522 0.130416 0.167736 Minimum -0.401982 -0.197198 -0.401982 -0.131489 -0.304383 Standard Deviation 0.089032 0.070640 0.130004 0.060353 0.107334 Skewness -0.818110 0.029186 -0.552965 -0.353723 -0.507832 Kurtosis 6.451037 3.304888 4.555683 2.796015 3.821830 Jarque-Bera 137.9675 0.313183 7.438269 1.716619 1.706977 ρ 1 0.229 0.234 0.092 0.222 0.480 ρ 2 0.000 0.047 -0.112 -0.013 0.186 ρ 3 0.051 0.058 -0.005 0.021 0.204 ρ 4 0.102 -0.043 0.114 0.023 0.204 ρ 5 0.002 -0.072 0.052 -0.061 -0.173 ρ 6 0.048 -0.120 0.284 -0.203 -0.204 ρ12 -0.074 -0.137 0.004 -0.070 -0.108 Q(6) 15.680 6.7480 6.6772 7.7679 12.193 Q(12) 20.708 13.729 8.9986 8.9736 17.177 Notes:
1. All returns are continuously compounded. Monthly real returns in local currency are nominal returns less monthly inflation rates.
2. T is the number of monthly observations. Numbers in parentheses below the skewness and excess kurtosis coefficients are asymptotic standard errors, (6/T)¹/² and (24/T) ¹/², respectively.
3. ρt is the sample autocorrelation at lag t.
4. Q(6) and Q(12) are the Ljung-Box portmanteau test statistics identifying the presence of six-order and twelve-order autocorrelation., distributed as χ² with 6 and 12 degrees of freedom, and p-values are the marginal significance levels of the Ljung-Box test.

Are Asian Stock Markets Characterized by Rational Speculative Bubbles?
57
Table 4.1 (Panel 4)
Malaysia (Kuala Lumpur Composite Index) real returns, monthly
Full sample period Subperiod 02/1991-12/2009 02/1991-06/1997 07/1997-09/2001 10/2001-01/2008 02/2008-12/2009 Observations 227 77 51 76 23 Mean 0.001691 0.007329 -0.011593 0.007789 -0.007878 Maximum 0.334583 0.231861 0.334583 0.096243 0.111799 Minimum -0.386219 -0.159910 -0.386219 -0.116479 -0.114452 Standard Deviation 0.079253 0.062472 0.135618 0.040047 0.055030 Skewness -0.275717 0.201694 -0.019950 -0.290816 0.179793 Kurtosis 7.841069 4.612226 3.731687 3.654177 2.623974 Jarque-Bera 224.5411 8.861405 1.141037 2.426436 0.259419 ρ 1 0.104 -0.123 0.133 0.126 0.541 ρ 2 0.145 0.259 0.120 -0.066 0.355 ρ 3 -0.119 -0.216 -0.149 -0.037 0.414 ρ 4 -0.061 -0.019 -0.182 0.093 0.382 ρ 5 -0.071 -0.224 -0.105 0.029 0.220 ρ 6 -0.074 -0.109 -0.072 -0.147 -0.099 ρ12 -0.066 -0.008 -0.075 -0.004 -0.175 Q(6) 13.978 15.774 5.8696 4.3205 22.336 Q(12) 36.509 25.109 16.730 7.8052 33.723 Notes:
1. All returns are continuously compounded. Monthly real returns in local currency are nominal returns less monthly inflation rates.
2. T is the number of monthly observations. Numbers in parentheses below the skewness and excess kurtosis coefficients are asymptotic standard errors, (6/T)¹/² and (24/T) ¹/², respectively.
3. ρt is the sample autocorrelation at lag t.
4. Q(6) and Q(12) are the Ljung-Box portmanteau test statistics identifying the presence of six-order and twelve-order autocorrelation., distributed as χ² with 6 and 12 degrees of freedom, and p-values are the marginal significance levels of the Ljung-Box test.

Are Asian Stock Markets Characterized by Rational Speculative Bubbles?
58
Table 4.1 (Panel 5)
Philippine (Philippine Composite Index) real returns, monthly
Full sample period Subperiod 02/1991-12/2009 02/1991-06/1997 07/1997-06/2001 07/2001-11/2007 12/2007-12/2009 Observations 227 77 48 77 25 Mean 0.001758 0.012267 -0.018835 0.008780 -0.012703 Maximum 0.336165 0.316255 0.336165 0.174086 0.151137 Minimum -0.294769 -0.181687 -0.294769 -0.127652 -0.233525 Standard Deviation 0.083648 0.087363 0.107300 0.056872 0.085746 Skewness 0.183939 0.536180 0.321242 0.179879 -0.382872 Kurtosis 5.222854 4.254827 4.882329 3.102218 3.729643 Jarque-Bera 48.01441 8.741255 7.911897 0.448765 1.165355 ρ 1 0.109 -0.041 0.208 0.077 0.173 ρ 2 0.074 0.102 -0.082 0.101 0.269 ρ 3 -0.049 -0.083 -0.111 -0.068 0.130 ρ 4 -0.044 -0.168 -0.221 0.046 0.262 ρ 5 0.011 0.112 -0.078 -0.140 -0.045 ρ 6 -0.023 -0.190 0.005 -0.016 0.036 ρ12 0.073 0.007 0.091 0.027 -0.003 Q(6) 5.1811 8.0545 6.2211 3.5381 5.7998 Q(12) 11.048 15.790 7.8631 9.3306 7.3330 Notes:
1. All returns are continuously compounded. Monthly real returns in local currency are nominal returns less monthly inflation rates.
2. T is the number of monthly observations. Numbers in parentheses below the skewness and excess kurtosis coefficients are asymptotic standard errors, (6/T)¹/² and (24/T) ¹/², respectively.
3. ρt is the sample autocorrelation at lag t.
4. Q(6) and Q(12) are the Ljung-Box portmanteau test statistic identifying the presence of six-order and twelve-order autocorrelation., distributed as χ² with 6 and 12 degrees of freedom, and p-valuesare the marginal significance levels of the Ljung-Box test.

Are Asian Stock Markets Characterized by Rational Speculative Bubbles?
59
Table 4.1 (Panel 6)
Japan (Nikkei 225 Index) real returns, monthly
Full sample period Subperiod 02/1991-12/2009 02/1991-06/1997 07/1997-05/2001 06/2001-11/2007 12/2007-12/2009 Observations 227 77 47 78 25 Mean -0.004184 -0.002942 -0.007082 0.002157 -0.022349 Maximum 0.158875 0.158875 0.132587 0.103377 0.136211 Minimum -0.275359 -0.153868 -0.124536 -0.137075 -0.275359 Standard Deviation 0.062119 0.063364 0.063491 0.050161 0.085604 Skewness -0.328207 0.181108 -0.022929 -0.309598 -0.776827 Kurtosis 3.895111 2.802127 2.318112 2.870612 4.362137 Jarque-Bera 11.65363 0.546553 0.914686 1.300467 4.447144 ρ 1 0.095 0.011 -0.070 0.202 0.293 ρ 2 -0.074 -0.226 -0.025 0.143 -0.120 ρ 3 0.104 0.148 -0.016 0.118 0.151 ρ 4 0.076 0.111 0.076 -0.028 0.186 ρ 5 -0.008 0.024 0.248 -0.086 -0.324 ρ 6 -0.168 -0.218 -0.244 0.059 -0.440 ρ12 -0.030 -0.208 0.078 -0.062 0.138 Q(6) 13.840 11.078 7.3147 7.1523 15.085 Q(12) 14.838 18.689 10.763 11.029 18.294 Notes:
1. All returns are continuously compounded. Monthly real returns in local currency are nominal returns less monthly inflation rates.
2. T is the number of monthly observations. Numbers in parentheses below the skewness and excess kurtosis coefficients are asymptotic standard errors, (6/T)¹/² and (24/T) ¹/², respectively.
3. ρt is the sample autocorrelation at lag t.
4. Q(6) and Q(12) are the Ljung-Box portmanteau test statistics identifying the presence of six-order and twelve-order autocorrelation., distributed as χ² with 6 and 12 degrees of freedom, and p-values are the marginal significance levels of the Ljung-Box test.

Are Asian Stock Markets Characterized by Rational Speculative Bubbles?
60
Table 4.1 (Panel 7)
Singapore (Straits Times Index) real returns,monthly
Full sample period Subperiod 02/1991-12/2009 02/1991-06/1997 07/1997-05/2001 06/2001-11/2007 12/2007-12/2009 Observations 227 77 47 78 25 Mean 0.003481 -0.002942 -0.007082 0.002157 -0.022349 Maximum 0.217075 0.158875 0.132587 0.103377 0.136211 Minimum -0.204630 -0.153868 -0.124536 -0.137075 -0.275359 Standard Deviation 0.062608 0.063364 0.063491 0.050161 0.085604 Skewness -0.109764 0.181108 -0.022929 -0.309598 -0.776827 Kurtosis 4.883660 2.802127 2.318112 2.870612 4.362137 Jarque-Bera 34.01564 0.546553 0.914686 1.300467 4.447144 ρ 1 0.137 0.011 -0.070 0.202 0.293 ρ 2 0.178 -0.226 -0.025 0.143 -0.120 ρ 3 -0.045 0.148 -0.016 0.118 0.151 ρ 4 0.132 0.111 0.076 -0.028 0.186 ρ 5 -0.099 0.024 0.248 -0.086 -0.324 ρ 6 0.036 -0.218 -0.244 0.059 -0.440 ρ12 0.089 -0.208 0.078 -0.062 0.138 Q(6) 18.773 11.078 7.3147 7.1523 15.085 Q(12) 27.356 18.689 10.763 11.029 18.294 Notes:
1. All returns are continuously compounded. Monthly real returns in local currency are nominal returns less monthly inflation rates.
2. T is the number of monthly observations. Numbers in parentheses below the skewness and excess kurtosis coefficients are asymptotic standard errors, (6/T)¹/² and (24/T) ¹/², respectively.
3. ρt is the sample autocorrelation at lag t.
4. Q(6) and Q(12) are the Ljung-Box portmanteau test statistics identifying the presence of six-order and twelve-order autocorrelation., distributed as χ² with 6 and 12 degrees of freedom, and p-valuesare the marginal significance levels of the Ljung-Box test.

Are Asian Stock Markets Characterized by Rational Speculative Bubbles?
61
Table 4.1 (Panel 8)
South Korea (Korea composite stock price Index) real returns, monthly
Full sample period Subperiod 02/1991-12/2009 02/1991-06/1997 07/1997-06/2001 07/2001-11/2007 12/2007-12/2009 Observations 227 77 48 77 25 Mean 0.000374 -0.003209 -0.007605 0.013531 -0.013796 Maximum 0.344956 0.206885 0.344956 0.176214 0.187940 Minimum -0.281790 -0.118302 -0.281790 -0.156927 -0.240957 Standard Deviation 0.087895 0.064963 0.136299 0.065865 0.091286 Skewness 0.243439 0.478551 0.480852 -0.181468 -0.312095 Kurtosis 4.478668 3.044923 2.981924 2.931430 3.419232 Jarque-Bera 22.92237 2.945456 1.850406 0.437694 0.588925 ρ 1 0.156 -0.040 0.254 0.097 0.075 ρ 2 -0.044 -0.001 -0.117 0.011 0.062 ρ 3 0.044 -0.062 0.033 0.155 0.102 ρ 4 -0.052 -0.076 -0.074 -0.194 0.297 ρ 5 -0.019 -0.131 0.110 -0.098 -0.254 ρ 6 0.090 0.138 0.169 -0.000 -0.182 ρ12 -0.080 -0.032 -0.170 -0.058 0.060 Q(6) 9.0624 4.0245 6.6566 6.6959 6.7790 Q(12) 12.260 13.217 9.5222 15.379 8.1821 Notes:
1. All returns are continuously compounded. Monthly real returns in local currency are nominal returns less monthly inflation rates.
2. T is the number of monthly observations. Numbers in parentheses below the skewness and excess kurtosis coefficients are asymptotic standard errors, (6/T)¹/² and (24/T) ¹/², respectively.
3. ρt is the sample autocorrelation at lag t.
4. Q(6) and Q(12) are the Ljung-Box portmanteau test statistics identifying the presence of six-order and twelve-order autocorrelation., distributed as χ² with 6 and 12 degrees of freedom, and p-valuesare the marginal significance levels of the Ljung-Box test.

Are Asian Stock Markets Characterized by Rational Speculative Bubbles?
62
Table 4.1 (Panel 9)
Shanghai A-Share index real returns, weekly
Full sample period Subperiod 14/01/1992-01/12/2009 14/01/1992-22/07/1997 29/07/1997-26/06/2001 03/07/2001-20/11/2007 27/11/2007-01/12/2009 Observations 934 289 205 334 106 Mean 0.002654 0.005098 0.003033 0.002447 -0.004091 Maximum 0.809146 0.809146 0.126790 0.112412 0.112079 Minimum -0.363312 -0.363312 -0.137306 -0.142288 -0.178350 Standard Deviation 0.063752 0.098964 0.034656 0.034220 0.056045 Skewness 2.754292 2.374882 -0.161653 -0.159960 -0.370370 Kurtosis 39.51853 21.60436 6.544143 4.248176 2.874317 Jarque-Bera 53080.29 4439.551 108.1843 23.10574 2.493173 ρ 1 0.081 0.104 -0.045 0.008 0.062 ρ 2 0.021 0.034 -0.073 0.056 -0.093 ρ 3 0.047 0.030 0.128 0.108 -0.010 ρ 4 0.035 0.044 -0.036 0.042 0.025 ρ 5 -0.059 -0.087 -0.063 -0.017 0.094 ρ 6 -0.025 -0.031 -0.051 0.129 -0.183 ρ12 -0.057 -0.074 -0.034 -0.090 0.096 Q(6) 13.629 6.8234 6.6466 11.406 6.2851 Q(12) 19.288 9.6143 7.5898 17.220 16.888
Notes:
1. All returns are continuously compounded. Weekly real returns in local currency are nominal returns less monthly inflation rates.
2. T is the number of monthly observations. Numbers in parentheses below the skewness and excess kurtosis coefficients are asymptotic standard errors, (6/T)¹/² and (24/T) ¹/², respectively.
3. ρt is the sample autocorrelation at lag t.
4. Q(6) and Q(12) are the Ljung-Box portmanteau test statistics identifying the presence of six-order and twelve-order autocorrelation., distributed as χ² with 6 and 12 degrees of freedom, and p-values are the marginal significance levels of the Ljung-Box test.

Are Asian Stock Markets Characterized by Rational Speculative Bubbles?
63
Table 4.1 (Panel 10)
Shenzhen A-Share index real returns, weekly
Full sample period Subperiod 13/10/1992-01/12/2009 13/10/1992-22/07/1997 29/07/1997-26/06/2001 03/07/2001-20/11/2007 27/11/2007-01/12/2009 Observations 895 250 205 334 106 Mean 0.001776 0.001870 0.002492 0.001921 -0.000283 Maximum 0.398706 0.398706 0.143447 0.125629 0.143368 Minimum -0.260484 -0.260484 -0.149889 -0.196742 -0.201386 Standard Deviation 0.054881 0.076325 0.038328 0.039402 0.063610 Skewness 0.155325 0.424103 -0.045051 -0.215702 -0.656732 Kurtosis 9.028693 7.144263 6.522771 5.263049 3.389763 Jarque-Bera 1358.970 186.3997 106.0707 73.86272 8.290544 ρ 1 0.057 0.089 -0.031 0.032 0.049 ρ 2 -0.035 -0.069 -0.058 0.008 0.037 ρ 3 0.090 0.102 0.140 0.070 0.001 ρ 4 -0.036 -0.029 -0.099 0.052 -0.080 ρ 5 0.002 -0.047 -0.047 0.041 0.129 ρ 6 -0.008 0.013 -0.049 0.100 -0.216 ρ12 0.038 0.084 -0.089 -0.096 0.114 Q(6) 12.564 6.6726 8.0932 6.9685 8.3577 Q(12) 16.403 13.245 11.625 13.195 28.529
Notes:
1. All returns are continuously compounded. Weekly real returns in local currency are nominal returns less monthly inflation rates.
2. T is the number of monthly observations. Numbers in parentheses below the skewness and excess kurtosis coefficients are asymptotic standard errors, (6/T)¹/² and (24/T) ¹/², respectively.
3. ρt is the sample autocorrelation at lag t.
4. Q(6) and Q(12) are the Ljung-Box portmanteau test statistics identifying the presence of six-order and twelve-order autocorrelation., distributed as χ² with 6 and 12 degrees of freedom, and p-valuesare the marginal significance levels of the Ljung-Box test.
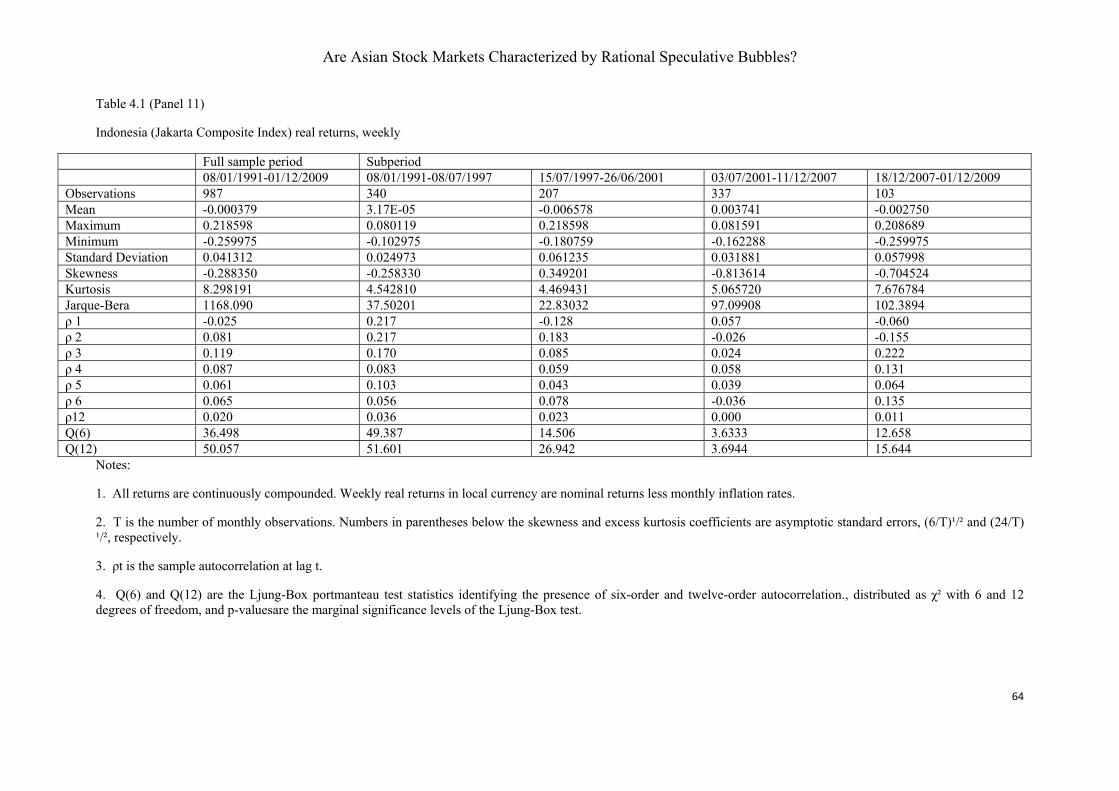
Are Asian Stock Markets Characterized by Rational Speculative Bubbles?
64
Table 4.1 (Panel 11)
Indonesia (Jakarta Composite Index) real returns, weekly
Full sample period Subperiod 08/01/1991-01/12/2009 08/01/1991-08/07/1997 15/07/1997-26/06/2001 03/07/2001-11/12/2007 18/12/2007-01/12/2009 Observations 987 340 207 337 103 Mean -0.000379 3.17E-05 -0.006578 0.003741 -0.002750 Maximum 0.218598 0.080119 0.218598 0.081591 0.208689 Minimum -0.259975 -0.102975 -0.180759 -0.162288 -0.259975 Standard Deviation 0.041312 0.024973 0.061235 0.031881 0.057998 Skewness -0.288350 -0.258330 0.349201 -0.813614 -0.704524 Kurtosis 8.298191 4.542810 4.469431 5.065720 7.676784 Jarque-Bera 1168.090 37.50201 22.83032 97.09908 102.3894 ρ 1 -0.025 0.217 -0.128 0.057 -0.060 ρ 2 0.081 0.217 0.183 -0.026 -0.155 ρ 3 0.119 0.170 0.085 0.024 0.222 ρ 4 0.087 0.083 0.059 0.058 0.131 ρ 5 0.061 0.103 0.043 0.039 0.064 ρ 6 0.065 0.056 0.078 -0.036 0.135 ρ12 0.020 0.036 0.023 0.000 0.011 Q(6) 36.498 49.387 14.506 3.6333 12.658 Q(12) 50.057 51.601 26.942 3.6944 15.644
Notes:
1. All returns are continuously compounded. Weekly real returns in local currency are nominal returns less monthly inflation rates.
2. T is the number of monthly observations. Numbers in parentheses below the skewness and excess kurtosis coefficients are asymptotic standard errors, (6/T)¹/² and (24/T) ¹/², respectively.
3. ρt is the sample autocorrelation at lag t.
4. Q(6) and Q(12) are the Ljung-Box portmanteau test statistics identifying the presence of six-order and twelve-order autocorrelation., distributed as χ² with 6 and 12 degrees of freedom, and p-valuesare the marginal significance levels of the Ljung-Box test.

Are Asian Stock Markets Characterized by Rational Speculative Bubbles?
65
Table 4.1 (Panel 12)
Malaysia (Kuala Lumpur Composite Index) real returns, weekly
Full sample period Subperiod 08/01/1991-01/12/2009 08/01/1991-29/07/1997 05/08/1997-26/06/2001 03/07/2001-30/10/2007 06/11/2007-01/12/2009 Observations 987 343 203 332 109 Mean 0.000347 0.001081 -0.002872 0.002121 -0.001364 Maximum 0.285299 0.107643 0.285299 0.059263 0.087327 Minimum -0.210479 -0.143936 -0.210479 -0.127656 -0.106676 Standard Deviation 0.035344 0.029133 0.058944 0.020587 0.029226 Skewness 0.143651 -0.221828 0.437894 -0.892863 -0.597564 Kurtosis 12.22985 6.053454 6.798801 8.705010 5.128339 Jarque-Bera 3503.283 136.4593 129.1821 492.8584 26.56346 ρ 1 -0.018 0.008 -0.060 0.005 0.097 ρ 2 0.005 -0.007 -0.000 0.047 -0.031 ρ 3 0.082 -0.022 0.157 -0.054 -0.021 ρ 4 -0.006 -0.065 -0.013 0.029 0.043 ρ 5 0.060 0.014 0.080 0.069 0.080 ρ 6 0.044 0.062 0.020 -0.065 0.190 ρ12 -0.061 -0.111 -0.086 0.002 0.107 Q(6) 12.585 3.0750 7.3945 5.0340 6.3047 Q(12) 25.569 11.408 13.970 8.2589 8.8167 Notes:
1. All returns are continuously compounded. Weekly real returns in local currency are nominal returns less monthly inflation rates.
2. T is the number of monthly observations. Numbers in parentheses below the skewness and excess kurtosis coefficients are asymptotic standard errors, (6/T)¹/² and (24/T) ¹/², respectively.
3. ρt is the sample autocorrelation at lag t.
4. Q(6) and Q(12) are the Ljung-Box portmanteau test statistics identifying the presence of six-order and twelve-order autocorrelation., distributed as χ² with 6 and 12 degrees of freedom, and p-valuesare the marginal significance levels of the Ljung-Box test.
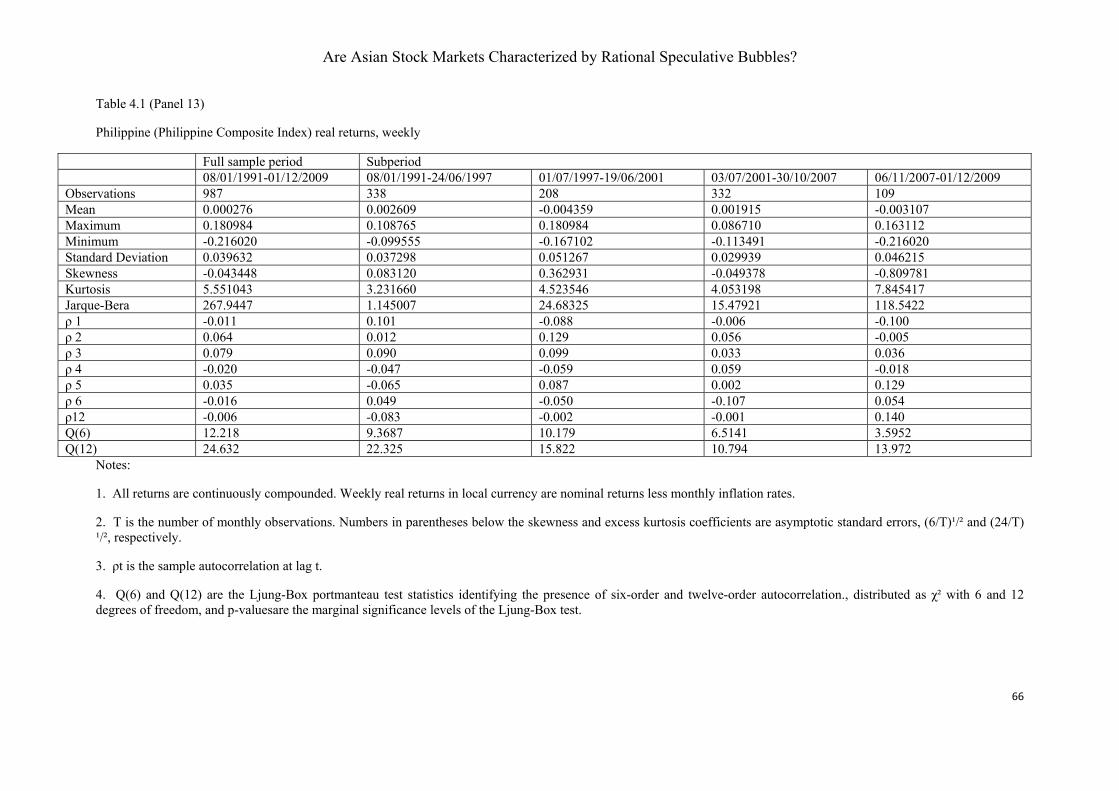
Are Asian Stock Markets Characterized by Rational Speculative Bubbles?
66
Table 4.1 (Panel 13)
Philippine (Philippine Composite Index) real returns, weekly
Full sample period Subperiod 08/01/1991-01/12/2009 08/01/1991-24/06/1997 01/07/1997-19/06/2001 03/07/2001-30/10/2007 06/11/2007-01/12/2009 Observations 987 338 208 332 109 Mean 0.000276 0.002609 -0.004359 0.001915 -0.003107 Maximum 0.180984 0.108765 0.180984 0.086710 0.163112 Minimum -0.216020 -0.099555 -0.167102 -0.113491 -0.216020 Standard Deviation 0.039632 0.037298 0.051267 0.029939 0.046215 Skewness -0.043448 0.083120 0.362931 -0.049378 -0.809781 Kurtosis 5.551043 3.231660 4.523546 4.053198 7.845417 Jarque-Bera 267.9447 1.145007 24.68325 15.47921 118.5422 ρ 1 -0.011 0.101 -0.088 -0.006 -0.100 ρ 2 0.064 0.012 0.129 0.056 -0.005 ρ 3 0.079 0.090 0.099 0.033 0.036 ρ 4 -0.020 -0.047 -0.059 0.059 -0.018 ρ 5 0.035 -0.065 0.087 0.002 0.129 ρ 6 -0.016 0.049 -0.050 -0.107 0.054 ρ12 -0.006 -0.083 -0.002 -0.001 0.140 Q(6) 12.218 9.3687 10.179 6.5141 3.5952 Q(12) 24.632 22.325 15.822 10.794 13.972
Notes:
1. All returns are continuously compounded. Weekly real returns in local currency are nominal returns less monthly inflation rates.
2. T is the number of monthly observations. Numbers in parentheses below the skewness and excess kurtosis coefficients are asymptotic standard errors, (6/T)¹/² and (24/T) ¹/², respectively.
3. ρt is the sample autocorrelation at lag t.
4. Q(6) and Q(12) are the Ljung-Box portmanteau test statistics identifying the presence of six-order and twelve-order autocorrelation., distributed as χ² with 6 and 12 degrees of freedom, and p-valuesare the marginal significance levels of the Ljung-Box test.

Are Asian Stock Markets Characterized by Rational Speculative Bubbles?
67
Table 4.1 (Panel 14)
Japan (Nikkei 225 Index) real returns, weekly
Full sample period Subperiod 08/01/1991-01/12/2009 08/01/1991-29/07/1997 05/08/1997-26/06/2001 03/07/2001-11/12/2007 18/12/2007-01/12/2009 Observations 987 343 204 337 103 Mean -0.000982 -0.000702 -0.002160 0.000644 -0.004902 Maximum 0.181452 0.134329 0.112736 0.105884 0.181452 Minimum -0.199463 -0.086072 -0.079364 -0.078833 -0.199463 Standard Deviation 0.032010 0.028992 0.032240 0.028574 0.047972 Skewness 0.048508 0.416890 0.306050 -0.286996 0.017821 Kurtosis 6.022124 5.075899 3.510891 3.463208 6.470188 Jarque-Bera 375.9913 71.52331 5.403250 7.639081 51.68657 ρ 1 -0.027 0.035 -0.034 0.023 -0.153 ρ 2 -0.026 -0.008 -0.060 -0.077 0.037 ρ 3 0.050 0.042 0.004 0.009 0.139 ρ 4 -0.013 0.016 -0.002 -0.009 -0.069 ρ 5 -0.010 -0.089 0.009 0.014 0.016 ρ 6 -0.029 -0.091 -0.054 -0.022 0.059 ρ12 0.022 -0.030 -0.005 0.026 0.131 Q(6) 4.9694 6.8538 1.6327 2.4931 5.6805 Q(12) 11.102 12.024 4.6029 5.0923 10.989
Notes:
1. All returns are continuously compounded. Weekly real returns in local currency are nominal returns less monthly inflation rates.
2. T is the number of monthly observations. Numbers in parentheses below the skewness and excess kurtosis coefficients are asymptotic standard errors, (6/T)¹/² and (24/T) ¹/², respectively.
3. ρt is the sample autocorrelation at lag t.
4. Q(6) and Q(12) are the Ljung-Box portmanteau test statistics identifying the presence of six-order and twelve-order autocorrelation., distributed as χ² with 6 and 12 degrees of freedom, and p-valuesare the marginal significance levels of the Ljung-Box test.

Are Asian Stock Markets Characterized by Rational Speculative Bubbles?
68
Table 4.1 (Panel 15)
Singapore (Straits Times Index) real returns, weekly
Full sample period Subperiod 08/01/1991-01/12/2009 08/01/1991-29/07/1997 05/08/1997-26/06/2001 03/07/2001-30/10/2007 06/11/2007-01/12/2009 Observations 987 343 204 331 109 Mean -0.000141 -0.000849 0.000369 0.001689 -0.004422 Maximum 0.129952 0.065538 0.129952 0.068193 0.117889 Minimum -0.151649 -0.070295 -0.116111 -0.143257 -0.151649 Standard Deviation 0.029356 0.021368 0.037845 0.023952 0.044114 Skewness -0.175328 -0.199650 0.188096 -0.702529 -0.112237 Kurtosis 5.820278 3.472969 3.604374 6.649761 4.364621 Jarque-Bera 332.1637 5.475717 4.307701 210.9428 8.686304 ρ 1 0.026 -0.058 -0.036 0.078 0.114 ρ 2 -0.000 0.015 -0.004 0.015 -0.033 ρ 3 0.110 0.059 0.164 -0.067 0.198 ρ 4 0.027 0.039 -0.092 0.027 0.160 ρ 5 0.036 -0.012 0.039 0.038 0.048 ρ 6 0.038 0.067 0.021 0.009 0.093 ρ12 0.021 -0.059 0.022 0.028 0.032 Q(6) 16.093 4.5660 8.0434 4.3929 10.287 Q(12) 27.040 9.8968 13.053 8.2035 15.821
Notes:
1. All returns are continuously compounded. Weekly real returns in local currency are nominal returns less monthly inflation rates.
2. T is the number of monthly observations. Numbers in parentheses below the skewness and excess kurtosis coefficients are asymptotic standard errors, (6/T)¹/² and (24/T) ¹/², respectively.
3. ρt is the sample autocorrelation at lag t.
4. Q(6) and Q(12) are the Ljung-Box portmanteau test statistics identifying the presence of six-order and twelve-order autocorrelation., distributed as χ² with 6 and 12 degrees of freedom, and p-valuesare the marginal significance levels of the Ljung-Box test.

Are Asian Stock Markets Characterized by Rational Speculative Bubbles?
69
Table 4.1 (Panel 16)
South Korea (Korea composite stock price Index) real returns, weekly
Full sample period Subperiod 08/01/1991-01/12/2009 08/01/1991-08/07/1997 15/07/1997-19/06/2001 26/06/2001-11/12/2007 18/12/2007-01/12/2009 Observations 987 340 206 338 103 Mean -5.16E-06 -0.000857 -0.001897 0.002825 -0.002697 Maximum 0.173272 0.120963 0.173272 0.087249 0.144285 Minimum -0.191121 -0.077947 -0.191121 -0.108369 -0.179722 Standard Deviation 0.043071 0.031372 0.067072 0.032454 0.045790 Skewness -0.192983 0.418372 -0.089651 -0.472019 -0.390963 Kurtosis 4.935810 4.143957 2.868925 3.301260 5.054906 Jarque-Bera 160.2366 28.45769 0.423414 13.82932 20.74611 ρ 1 -0.022 0.011 -0.071 0.031 0.030 ρ 2 0.018 -0.015 0.065 0.021 -0.152 ρ 3 0.035 0.043 0.062 -0.047 0.006 ρ 4 0.021 -0.035 0.009 0.018 0.148 ρ 5 0.073 -0.068 0.153 -0.004 0.059 ρ 6 -0.018 0.028 -0.042 0.001 -0.017 ρ12 -0.002 -0.014 -0.040 0.053 0.112 Q(6) 8.1217 3.0941 8.1355 1.3469 5.3728 Q(12) 11.323 4.1739 8.6409 5.8311 19.721
Notes:
1. All returns are continuously compounded. Weekly real returns in local currency are nominal returns less monthly inflation rates.
2. T is the number of monthly observations. Numbers in parentheses below the skewness and excess kurtosis coefficients are asymptotic standard errors, (6/T)¹/² and (24/T) ¹/², respectively.
3. ρt is the sample autocorrelation at lag t.
4. Q(6) and Q(12) are the Ljung-Box portmanteau test statistics identifying the presence of six-order and twelve-order autocorrelation., distributed as χ² with 6 and 12 degrees of freedom, and p-valuesare the marginal significance levels of the Ljung-Box test.

Are Asian Stock Markets Characterized by Rational Speculative Bubbles?
70
4.3 Duration dependence
In this research, only the positive, not negative, runs are used for duration dependence tests as
McQueen and Thorley (1994) show that, for bubbles to be rational, the bubbles must be
positive, and the expected value of the bubble should be increasing to compensate the
investor for the possibility of a crash. Formerly, rational speculative bubbles only appeared
in runs of positive abnormal returns a finding supported by Jirasakuldech et al. (2008),
implying that rational speculative bubbles cannot occur in runs of negative abnormal returns.
The evidence from the Thai stock market alone can hardly support the existence of rational
speculative bubbles in negative returns.
The following results refer to the log-logistic regression estimates of the hazard function. The
null hypothesis, that no rational speculative bubbles exist in stock markets, implies a constant
hazard rate (β=0). The alternative hypothesis implies a negative hazard rate (β<0) for runs of
positive returns. The p-value, the marginal significance level, which is the probability of
obtaining the calculated value of the likelihood ratio test (LRT is 10%.
4.3.1 Monthly returns: Full sample period
The positive runs of monthly returns for the full sample period are reported in Table 4.2,
Panel 1. A total of 50 runs for Indonesia, 55 runs for Japan, 46 runs for Korea, 53 runs for
Malaysia, 56 runs for Philippine, 52 runs for Shanghai, 45 runs for Shenzhen and 48 runs for
Singapore were documented. The longest positive run lasts 10 months and occurs once only
in the Shenzhen A-Share stock market. The second longest positive runs last 9 months. They
occur once each in the stock markets of Japan, Korea and Singapore, and 24 times in
Indonesia. One characteristic of a rational speculative bubble is that the hazard rate should be

Are Asian Stock Markets Characterized by Rational Speculative Bubbles?
71
a declining function of the length of positive runs; otherwise, the bubble cannot be sustained.
For the full sample period, there is no discernible decreasing pattern in hazard rates in
positive runs of the stock indices. This implies that no rational speculative bubbles are
evident in any stock markets over the full sample period when we analyse monthly returns.
Consistent with the rational speculative bubble model prediction, the runs of positive returns
yield point estimates of β that are negative in Indonesia, Japan, Shanghai, Shenzhen and
Singapore, however, none of the p- values are lower than 10%, which imply that none of the
coefficients are significant. This result fails to reject the null hypothesis of no rational
speculative bubble at traditional significance levels, which means no rational speculative
bubble existed in any of the stock markets studied when using monthly data over the full
sample period.
4.3.2 Weekly returns: Full sample period
The duration dependence test results for positive runs of weekly returns for the full sample
period are reported in Table 4.2, Panel 2. There are a total of 221 runs for Indonesia, 248 for
Japan, 245 for Korea, 227 for Malaysia, 238 for Philippine, 213 for Shanghai, 218 for
Shenzhen and 244 for Singapore. The longest positive returns run lasts 13 weeks, and it
occurs once in the Shenzhen A-Share stock market. As noted earlier, a declining hazard rate
is one characteristic of a rational speculative bubble and, or the positive runs of weekly, full
sample period data , the sample hazard rates of Indonesia, Shanghai A-Share and Shenzhen
A- share markets are decreasing. The decreasing hazard rates for lengths 1 to 5 of Indonesia
are 0.4842, 0.4123, 0.4030, 0.4000 and 0.3333, respectively for the Shanghai A-Share are
0.4930, 0.4722, 0.3860, 0.2857 and 0.2000, respectively and of the Shenzhen A-Share are
0.5183, 0.4571, 0.3860 and 0.2857, respectively. For the other stock markets there are no

Are Asian Stock Markets Characterized by Rational Speculative Bubbles?
72
discernible decreasing hazard rates. Therefore, using weekly data, our results indicate the
presence of rational speculative bubbles only in the stock markets of Indonesia and China
over the full sample period. Though the β of all stock markets are negative, consistent with
the rational speculative bubble model prediction, only the coefficients of Indonesia, Shanghai
and Shenzhen are statistically significant. This result is consistent with the earlier observation
of decreasing hazard rates in the stock markets of Indonesia and China.
Now for the sub-period analysis.
4.3.3 Monthly returns: sub-period analysis
Table 4.2, Panel 3, shows that, for the pre-Asian financial crisis subperiod (1991-1997), the
runs of positive returns yield point estimates of β that are negative in Malaysia (β=-0.31352)
and Shenzhen (β=-0.05311), consistent with the rational speculative bubble model prediction,
For the post-Asian financial crisis subperiod (1998-2001), β is negative in Indonesia, Japan,
Malaysia and Singapore, at -0.84681, -0.44267, -0.39236 and -0.52867 respectively. In the
pre-subprime loan financial crisis subperiod, only the β of the China stock markets, Shanghai
A-share (β=-0.03088) and Shenzhen A-share (β=-0.36299) are negative, while,for the post-
subprime loan financial crisis subperiod, βis negative in Indonesia, Shanghai, Shenzhen and
Singapore, -1.22916, -0.85848, -0.98315 and -0.29851 respectively. Though the β estimates
are negative, none of them are statistically significant; hence the null hypothesis of no
rational speculative bubble at traditional significance levels is not rejected. Therefore, for all
subperiods, none of the stock markets have returns characteristics completely conforming to
the rational speculative bubbles model using monthly data.

Are Asian Stock Markets Characterized by Rational Speculative Bubbles?
73
4.3.4 Weekly returns: sub-period analysis
Table 4.2, Panel 4, shows that, for Indonesia and Shanghai, the β coefficients are significantly
negative, at -0.42708 and -0.56492 respectively, over the pre-Asian financial crisis subperiod
(1991-1997). The empirical evidence rejects the null hypothesis of no rational speculative
bubbles in the stock markets of Indonesia and China during this subperiod at 10% and 5%
significance levels respectively. Over the pre-subprime loan financial crisis subperiod (2002-
2007), both Shanghai and Shenzhen have characteristics that completely conform to the
predictions of the rational speculative bubbles model. The β coefficients of Shanghai and
Shenzhen are -0.45598 and -0.55943, with corresponding p-values of 0.0039 and 0.0125
therefore, rational speculative bubbles existed in the Chinese stock market over the pre-
subprime loan financial crisis subperiod (2002-2007). The Malaysian stock market also has
negative β coefficients over the post-Asian financial crisis (1998-2001) and pre-subprime
loan financial crisis subperiods (2002-2007) at -0.54013 and -0.21222 respectively, but the p-
values are high and fail to reject the null hypothesis of no rational speculative bubble at
traditional significance levels. Chan et al. (1998) contend that duration dependence tests may
lack power when used over short sample periods, therefore, these two subperiods were
connected together and the sample period from 1998 to 2007 was tested. The empirical
results suggest the presence of rational speculative bubbles in the Malaysian stock market
over the sample period from 1998 to 2007withthe β coefficient at -0.3479 statistically
significant at the 10% level.
In summary, monthly and weekly returns, over the full and subperiods for the stock markets
of Indonesia, Japan, Korea, Malaysia, Philippine, Shanghai, Shenzhen and Singapore from
1991 to 2009were examined. No rational speculative bubbles were detected in any of the
eight stock markets over the full or any of the sub-periods when monthly returns were used.

Are Asian Stock Markets Characterized by Rational Speculative Bubbles?
74
The results were different however, when weekly returns were utilised. For the weekly, full
sample period, we find that rational speculative bubbles existed in the stock markets of
Indonesia and China (Shanghai and Shenzhen). The results of the sub-period analysis also
indicate their presence in the Indonesian stock market over the pre-Asian financial crisis
subperiod (1991-1997), the Chinese stock market over both the pre-Asian financial crisis
subperiod (1991-1997) and the pre-subprime loan financial crisis subperiod (2002-2007), and
in Malaysia over the sample period from 1997 to 2007.
The results of Chinese stock markets is consistent with Zhang (2008), Lehkonen (2010) and
Haque et al. (2008), which imply that rational speculative bubbles existed in this market. All
three studies employed the duration dependence test, with sample periods from 1991 to 2001,
1992 to 2008 and 1991 to 2007 respectively. Rational speculative bubbles existence in China,
Indonesia and Malaysia is also consistent with Sarno and Taylor (1999), who employed
cointegration tests and found strong evidence of their presence in Asian stock markets over
the sample period from 1989 to 1997. Furthermore, these results are also consistent with
Mokhtar et al. (2006) and Ali et al. (2009) in terms of the Malaysian stock market, with both
studies employing duration dependence tests and reporting evidence of rational speculative
bubbles in Malaysia over the periods from 1999 to 2003 and 1987 to 1997 respectively.

Are Asian Stock Markets Characterized by Rational Speculative Bubbles?
75
Table 4.2 Results of Duration dependence tests (Panel 1)
Tests of duration dependence for positive runs of monthly indices’ returns for the full period (1991-2009)
Country Indonesia Japan Korea Malaysia Philippine Shanghai Shenzhen Singapore Run Length
Actual Run Counts
Sample Hazard Rates
Actual Run Counts
Sample Hazard Rates
Actual Run Counts
Sample Hazard Rates
Actual Run Counts
Sample Hazard Rates
Actual Run Counts
Sample Hazard Rates
Actual Run Counts
Sample Hazard Rates
Actual Run Counts
Sample Hazard Rates
Actual Run Counts
Sample Hazard Rates
1 24 0.4800 29 0.5273 16 0.3478 25 0.4717 26 0.4643 29 0.5577 23 0.5111 24 0.5000 2 9 0.3462 16 0.6154 15 0.5000 9 0.3214 12 0.4000 5 0.2174 8 0.3636 5 0.2083 3 9 0.5294 4 0.4000 6 0.4000 9 0.4737 11 0.6111 9 0.5000 7 0.5000 9 0.4737 4 2 0.2500 2 0.3333 5 0.5556 3 0.3000 5 0.7143 3 0.3333 2 0.2857 4 0.4000 5 2 0.3333 1 0.3333 2 0.5000 4 0.5714 2 1.0000 3 0.5000 0 0.0000 1 0.1667 6 1 0.2500 2 0.6667 1 0.5000 2 0.6667 1 0.3333 0 0.0000 2 0.4000 7 2 0.6667 0 0.0000 0 0.0000 1 1.0000 1 0.5000 3 0.6000 0 0.0000 8 1 1.0000 0 0.0000 0 0.0000 1 1.0000 1 0.5000 2 0.6667 9 24 0.4800 1 1.0000 1 1.0000 0 0.0000 1 1.0000 10 1 1.0000 Total 50 55 46 53 56 52 45 48 Log-logistic test
α -0.17166 0.20087 -0.5228 0.27139 0.28014 0.008687 -0.01868 -0.2024 β -0.14474 -0.27972 0.339278 0.036843 0.555493 -0.30725 -0.43886 -0.27192 LRT of H0: β=0 0.2390 0.7838
1.1107
0.0145
2.2331
1.0420
2.4372
0.9578
( p-value) 0.6249 0.3760
0.2919
0.9041
0.1351
0.3074
0.1185
0.3278
Notes:
1. The sample hazard rate, / represents the conditional probability that a run ends at i, given that it lasts until i, where is the count of runs of length i and is the count of runs with a length greater than i.
2. The log-logistic function is 1 1⁄ . β is the hazard rate which is estimated using the log it regression, where the independent variable is the log of the current length of the run and the dependent variable is either 1 if the run ends or 0 if it does not end in the next period.
3. The LRT (likelihood ratio test) of the null hypothesis, H1: β = 0, of no duration dependence (constant hazard rate) follows the χ²(1) distribution. 4. The P-value is the marginal significance level, which is the probability of obtaining that value of the LRT, or higher, under the null hypothesis.

Are Asian Stock Markets Characterized by Rational Speculative Bubbles?
76
Table 4.2 (Panel 2) Tests of duration dependence for positive runs of weekly indices’ returns for the full period (1991-2009) Country Indonesia Japan Korea Malaysia Philippine Shanghai Shenzhen Singapore Run Length
Actual Run Counts
Sample Hazard Rates
Actual Run Counts
Sample Hazard Rates
Actual Run Counts
Sample Hazard Rates
Actual Run Counts
Sample Hazard Rates
Actual Run Counts
Sample Hazard Rates
Actual Run Counts
Sample Hazard Rates
Actual Run Counts
Sample Hazard Rates
Actual Run Counts
Sample Hazard Rates
1 107 0.4842 129 0.5202 115 0.4694 107 0.4714 122 0.5126 105 0.4930 113 0.5183 131 0.5369 2 47 0.4123 61 0.5126 67 0.5154 54 0.4500 59 0.5086 51 0.4722 48 0.4571 48 0.4248 3 27 0.4030 30 0.5172 32 0.5079 29 0.4394 24 0.4211 22 0.3860 22 0.3860 34 0.5231 4 16 0.4000 11 0.3929 11 0.3548 14 0.3784 11 0.3333 10 0.2857 10 0.2857 10 0.3226 5 8 0.3333 9 0.5294 9 0.4500 7 0.3043 12 0.5455 5 0.2000 10 0.4000 12 0.5714 6 6 0.3750 5 0.6250 4 0.3636 4 0.2500 7 0.7000 8 0.4000 8 0.5333 4 0.4444 7 2 0.2000 2 0.6667 4 0.5714 8 0.6667 3 1.0000 5 0.4167 4 0.5714 3 0.6000 8 2 0.2500 1 1.0000 0 0.0000 3 0.7500 3 0.4286 1 0.3333 0 0.0000 9 4 0.6667 2 0.6667 0 0.0000 1 0.2500 0 0.0000 1 0.5000 10 1 0.5000 0 0.0000 0 0.0000 1 0.3333 1 0.5000 0 0.0000 11 0 0.0000 1 1.0000 0 0.0000 1 0.5000 0 0.0000 0 0.0000 12 1 1.0000 1 1.0000 1 1.0000 0 0.0000 1 1.0000 13 1 1.0000 Total 221 248 245 227 238 213 218 244 Log-logistic test
α -0.09387 0.068596 -0.06625 0.11663 0.026118 -0.01703 0.044013 0.097074 β -0.26994 -0.02154 -0.05585 -0.16384 -0.07468 -0.36095 -0.32708 -0.23204 LRT of H0: β=0 4.0593 0.0176
0.1493
1.3875
0.2230
7.2064
5.2823
2.4698
( p-value) 0.0440 0.8943
0.6992
0.2388
0.6367
0.0073
0.0215
0.1161
Notes:
1. The sample hazard rate, / represents the conditional probability that a run ends at i, given that it lasts until i, where is the count of runs of length i and is the count of runs with a length greater than i.
2. The log-logistic function is 1 1⁄ . β is the hazard rate which is estimated using the log it regression, where the independent variable is the log of the current length of the run and the dependent variable is either 1 if the run ends or 0 if it does not end in the next period.
3. The LRT (likelihood ratio test) of the null hypothesis, H1: β = 0, of no duration dependence (constant hazard rate) follows the χ²(1) distribution. 4. The p-value is the marginal significance level, which is the probability of obtaining that value of the LRT, or higher, under the null hypothesis.

Are Asian Stock Markets Characterized by Rational Speculative Bubbles?
77
Table 4.2 (Panel 3) Tests of duration dependence for positive runs of monthly indices’ returns for sub-periods Indonesia Japan Korea Malaysia Philippine Shanghai Shenzhen Singapore 1991-1997
α -0.4947 0.50644 -0.1985 0.006562 -0.39061 -0.08908 0.027139 -0.25341 β 0.511646 2.381218 0.575137 -0.31352 0.869177 0.117231 -0.05311 0.270081 LRT 0.7373 3.0687 0.7265 0.4122 1.7131 0.0688 0.0126 0.1946 p - value 0.3905 0.0798 0.3940 0.5209 0.1906 0.7931 0.9106 0.6591
1998-2001 α 1.113205 0.488211 -0.70736 0.365165 0.351353 0.414888 -0.3828 0.489063 β -0.84681 -0.44267 0.727433 -0.39236 -0.32962 -0.3243 0.179172 -0.52867 LRT 0.6741 0.3446 0.7941 0.4310 0.1599 0.3248 0.1246 0.5750 p - value 0.4116 0.5572 0.3729 0.5115 0.6892 0.5687 0.7240 0.4483
2002-2007 α -1.35115 -0.56713 -1.06046 -0.83989 -0.36268 -0.37313 -0.11542 -1.93937 β 0.510639 0.059812 0.35422 0.563952 0.5304 -0.03088 -0.36299 0.622871 LRT 1.1668 0.0162 0.5483 1.1639 0.7969 0.0067 1.1054 1.5188 p - value 0.2801 0.8987 0.4590 0.2807 0.3720 0.9348 0.2931 0.2178
2008-2009 α 0.890085 -0.74855 -1.02139 -1.22568 -1.10348 0.626966 0.51478 0.318147 β -1.22916 0.068134 1.32522 0.949599 1.892696 -0.85848 -0.98315 -0.29851 LRT 1.2510 0.0041 1.3978 0.7055 1.9281 1.7618 1.6785 0.0674 p - value 0.2634 0.9487 0.2371 0.4009 0.1650 0.1844 0.1951 0.7952
Notes:
1. The log-logistic function is 1 1⁄ . β is the hazard rate which is estimated using the log it regression where the independent variable is the log of the current length of the run and the dependent variable is either 1, if the run ends,or 0, if it does not end in the next period.
2. The LRT (likelihood ratio test) of the null hypothesis, H1: β = 0, of no duration dependence (constant hazard rate) follows the χ²(1) distribution.
3. The p-value is the marginal significance level, which is the probability of obtaining that value of the LRT or higher under the null hypothesis.

Are Asian Stock Markets Characterized by Rational Speculative Bubbles?
78
Table 4.2 (Panel 4) Tests of duration dependence for positive runs of weekly indices’ returns for sub-periods
Indonesia Japan Korea Malaysia Philippine Shanghai Shenzhen Singapore 1991-1997
α -0.06359 0.271575 0.046151 -0.31126 -0.0772 0.123926 0.157734 0.216664 β -0.42708 -0.30337 0.005392 0.037624 0.105562 -0.56492 -0.42952 -0.24484 LRT 3.4558 1.2353 0.0004 0.0255 0.1523 5.9286 2.3492 0.8707 p - value 0.0630 0.2664 0.9844 0.8732 0.6964 0.0149 0.1253 0.3508
1998-2001 α 0.202392 0.141309 -0.12204 0.384873 0.174027 -0.30057 -0.2534 0.156889 β 0.255737 -0.07564 0.294122 -0.54013 -0.08751 0.029121 0.130231 -0.4282 LRT 0.3527 0.0432 0.7039 2.6310 0.0509 0.0088 0.1705 2.1062 p - value 0.5526 0.8354 0.4015 0.1042 0.8216 0.9253 0.6797 0.1467
2002-2007 α -0.37766 -0.31912 -0.15972 -0.21155 0.097248 0.030968 0.228603 -0.13993 β -0.18976 0.224088 -0.26462 -0.21222 -0.26455 -0.45598 -0.55943 -0.04263 LRT 0.8418 0.7946 1.5183 0.8985 1.0574 8.3520 6.2353 0.0289 p - value 0.3589 0.3727 0.2179 0.3432 0.3038 0.0039 0.0125 0.8651
2008-2009 α -0.30705 0.32422 -0.40679 -0.4558 -0.29281 -0.12598 -0.38806 0.3045 β 0.458229 -0.11489 1.383604 0.321495 0.118261 -0.02143 -0.00591 -0.18476 LRT 0.7715 0.0453 4.2865 0.4595 0.0680 0.0025 0.0002 0.1105 p - value 0.3798 0.8314 0.0384 0.4979 0.7943 0.9601 0.9883 0.7396
1997-2007 α 0.021484 β -0.3479 LRT 3.5837 p - value 0.0584
Notes:
1. The log-logistic function is 1 1⁄ . β is the hazard rate which is estimated using the log it regression where the independent variable is the log of thecurrent length of the run and the dependent variable is either 1, if the run ends, or 0, if it does not end in the next period.
2. The LRT (likelihood ratio test) of the null hypothesis, H1: β = 0, of no duration dependence (constant hazard rate) follows the χ²(1) distribution. 3. The p-value is the marginal significance level, which is the probability of obtaining that value of the LRT or higher under the null hypothesis.

Are Asian Stock Markets Characterized by Rational Speculative Bubbles?
79
4.4 Results of the unit root and Multivariate cointegration tests
The time series properties of monthly stock price indices, dividends and earnings for value-
weighted portfolios were examined via unit root and cointegration analysis from 1991 to
2009. The Augmented Dickey-Fuller (ADF) and Phillips-Perron (PP) tests are used to test for
unit roots, and the Johansen-Juselius multivariate cointegration vector autoregression
approach is used to test the long-run relationship between stock prices and fundamental
variables.
4.4.1 The unit root test
Both ADF and PP tests are performed on the model with and without a trend. The 4 lag
length in the ADF and PP regressions is the highest significant lag order from either the
autocorrelation function or the partial autocorrelation function of the first differenced series,
chosen by the Akaike Information Criterion (AIF). As shown in Table 4.3, the results of the
ADF test, based on the monthly full sample period data, cannot reject the null hypothesis of a
unit root or non-stationary for most of the variables in their logarithmic form at traditional
levels of significance, except for stock prices for China and Singapore which reject the null
hypothesis at a 5% significance level, while Chinese dividends and Korean stock prices reject
the null hypothesis at the 10% significance level. After a trend is added to the model, most of
the variables are still non-stationary at traditional significance levels; however, the results for
Indonesian earnings, China dividends and Singaporean stock reject the null hypothesis at a 1%
significance level. with China stock prices and Indonesia dividends rejecting it at 5% and 10%
significance levels respectively. The results of the PP tests with no trend model cannot reject
the null hypothesis for most of the variables at traditional levels of significance, either. Only
the earnings of the Indonesian stock market and stock prices of Singapore’s stock market

Are Asian Stock Markets Characterized by Rational Speculative Bubbles?
80
reject the null hypothesis at 1% and 5% significance levels, respectively. After a trend is
added to the PP test, most of the variables still get unit roots at traditional significance levels,
however, the results of Indonesia dividends, China dividends, earnings and Singapore stock
prices reject the null hypothesis at the 10% significance level, and Indonesia earnings reject
at a 1% significance level.
The cointegration test only can be used for non-stationary variables. Table 4.3 shows that
monthly stock prices, dividends and earnings are non-stationary variables, which means that
the cointegration test can be used for these data.

Are Asian Stock Markets Characterized by Rational Speculative Bubbles?
81
Table 4.3 Results of the ADF and PP unit roots tests
The ADF and PP unit roots tests for variables used in the study
Full period (1991-2009)
Markets Variables ADF PP No Trend Trend No Trend Trend pt -0.5896 -2.0614 -0.6198 -2.1535 Indonesia dt -1.2984 -3.2419 -1.2903 -3.3700* yt -1.0146 -4.5405*** -5.4601*** -12.2781*** pt -3.2837** -3.6571** -2.5126 -2.8489 China dt -2.6714* -4.7710*** -2.1733 -3.3490* yt -2.5170 -3.1000 -2.4622 -3.2968* pt -1.9726 -2.3804 -1.5137 -1.9310 Malaysia dt -2.1398 -2.0728 -1.9769 -1.9205 yt -2.1650 -2.4556 -2.0073 -2.2947 pt -1.0461 -2.2665 -1.6322 -2.5319 Philippine dt -0.4118 -1.6884 -0.4227 -1.7464 yt -0.8206 -1.8513 -0.7431 -1.4937 pt -1.0678 -1.6366 -1.1637 -1.8388 Japan dt -0.9731 -2.3544 -0.9819 -2.5281 yt -1.2661 -1.3031 -1.2559 -1.4054 pt -2.7042* -2.6447 -2.3247 -2.2876 Korea dt -2.3942 -2.3964 -2.1390 -2.1312 yt -1.9651 -2.0247 -2.0440 -2.0163 pt -3.3676** -4.1261*** -2.9084** -3.3285* Singapore dt -0.5810 -2.5047 -0.5893 -2.5204 yt -1.1730 -2.9414 -1.2865 -3.0618 Notes:
(1) The 4 lag length in the ADF and PP regressions is the highest significant lag order from either the autocorrelation function or the partial autocorrelation function of the first differenced series.
(2) pt, dt and yt denote the log of monthly stock price indices, dividends and earnings for value-weighted portfolios from 1991-2009, respectively.
(3) Corresponding critical values for models with no trend for the ADF and PP unit root tests are -3.45, -2.86 and -2.57 at 1%, 5% and 10% significance levels respectively.
(4) Corresponding critical values for models with trends for the ADF and PP unit root tests are -3.98, -3.42 and -3.13 at 1%, 5% and 10% significance levels respectively.
(5) ***,** and * indicate significance at the 1%, 5% and 10% levels respectively.

Are Asian Stock Markets Characterized by Rational Speculative Bubbles?
82
4.4.2 Multivariate cointegration tests
Full sample period analysis:
Following the unit root tests, cointegration analysis was performed. The results of the
cointegration tests for the monthly full sample period are reported in Table 4.4, where Panel
A shows the cointegration relationship between value-weighted stock prices and value-
weighted dividends; panel B shows the relationship between value-weighted stock price and
value-weighted earnings; and panel C shows the relationship among valued-weighted stock
price, value-weighted dividends and value-weighted earnings.
The value-weighted stock prices, dividends and earnings are the indices whose components
are weighted according to the total market value of their outstanding shares. The
mathematical formula is expressed as follows:
Value-weighted stock price = ∑P M∑M
Value-weighted dividend = ∑D M∑M
Value-weighted earning = ∑E M∑M
where:
Mt = Individual stock market value
Pt = Individual stock price
Dt = Individual stock dividend
Et = Individual stock earning

Are Asian Stock Markets Characterized by Rational Speculative Bubbles?
83
The results of the cointegration tests indicate the presence of rational speculative bubbles in
Indonesia and Japan. As shown in Table 4.4 (Japan), the Trace test and Max-eigenvalue test
cannot reject the null hypothesis of no cointegration between pt, dt and yt; pt and yt ; nor pt and
dt for Japan at traditional significance levels. Panel C of Table 4.4 (Indonesia) shows both
Trace and Max-eigenvalue tests indicate that one cointegration equation exists, between pt, dt
and yt , at 5% and 1% significance levels however, Panel A and Panel B of Table 4.4
(Indonesia) indicate that there is no cointegrated relationship between pt and yt ,nor between
pt and dt in Indonesia at traditional significance levels. This evidence suggests that
Indonesian and Japanese stock prices deviated from fundamental values, indicating the
presence of rational speculative bubbles
The Trace test and Max-eigenvalue test provide evidence of a cointegrated relationship
between stock prices and fundamental factors in China and Singapore. As shown in Table 4.4
(China), the λtrace and λmax statistics reject the null hypothesis of no cointegration between pt,
dt and yt; pt and yt ; and dt and yt in China at both 5% and 1% significance levels. Panel B and
panel C of Table 4.4 (Singapore) indicate that pt and yt, and pt, dt and yt are cointegrated at
both 5% and 1% significance levels While Panel A shows that the λtrace and λmax statistics
reject the null hypothesis of no cointegration between pt and dt at 5%, but not at 1%
significance level. These results indicate the absence of rational speculative bubbles in China
and Singapore.
None of the Malaysian, Philippine or Korean stock markets has the characteristics that
completely conform to or contradict the prediction of the rational speculative bubbles model,
which is that stock prices deviate from fundamental values. Therefore, the Trace test and
Max-eigenvalue test cannot provide strong evidence whether or not rational speculative
bubbles exist in Malaysia, Philippines or Korea. As shown in panel A of Table 4.4 (Malaysia),

Are Asian Stock Markets Characterized by Rational Speculative Bubbles?
84
λtrace and λmax statistics indicate that pt deviates from dt in the long run relationship in
Malaysia, however, panels B and C show evidence rejecting the null hypothesis of no
cointegration between pt, dt and yt, and pt and yt at both 5% and 1% significance levels.
Therefore, the cointegration results for Malaysia are inconclusive. For the Philippines, Panel
A and panel B of Table 4.4 (Philippines) show evidence sufficient to reject the null
hypothesis of no cointegration relationship between pt and dt, but cannot reject the null
hypothesis of no cointegration between pt and yt, at either 5% or 1% significance levels.. As
shown in panel C of Table 4.4 (Philippines), pt, dt and yt are cointegrated at the 5%
significance level, but not at 1%, therefore, the cointegration results for the Philippines are
also inconclusive. Finally, for the Korean stock market, the results reported in panel B of
Table 4.4 (Korea) cannot reject the null hypothesis of no cointegration relationship between
pt and yt at either 5% or 1% significance levels. Furthermore, as shown on panel A and panel
C, the results of Trace tests and Max-eigenvalue tests contradict each other therefore, the
cointegration test cannot provide strong evidence whether or not rational speculative bubbles
exist in the stock markets of Malaysia, the Philippines and Korea.

Are Asian Stock Markets Characterized by Rational Speculative Bubbles?
85
Table 4.4 Results of Cointegration tests (China)
China (value weight portfolio) full sample, monthly
H0 λtrace λ Trace statistics H0 λmax λ Max statistics
CV (5%) CV (1%) CV (5%) CV (1%)
Panel A: Cointegration between pt and dt
r=0 22.76 15.49 19.49 r=0 or r=1 20.48 14.26 18.52
r≤1 2.27 3.84 6.63 r=1 or r=2 2.27 3.84 6.63
Panel B: Cointegration between pt and yt
r=0 21.27 15.49 19.49 r=0 or r=1 11.26 14.26 18.52
r≤1 10.01 3.84 6.63 r=1 or r=2 10.01 3.84 6.63
Panel C: Cointegration between pt, dt and yt
r=0 60.57 29.80 35.46 r=0 or r=1 46.61 21.03 25.86
r≤1 13.96 15.49 19.94 r=1 or r=2 10.44 14.26 18.52
r≤2 3.51 3.84 6.63 r=2 or r=3 3.51 3.84 6.63
Table 4.4 (Indonesia)
Indonesia (value weight portfolio) full sample, monthly
H0 λtrace λ Trace statistics H0 λmax λ Max statistics
CV (5%) CV (1%) CV (5%) CV (1%)
Panel A: Cointegration between pt and dt
r=0 13.02 15.49 19.49 r=0 or r=1 13.01 14.26 18.52
r≤1 0.01 3.84 6.63 r=1 or r=2 0.01 3.84 6.63
Panel B: Cointegration between pt and yt
r=0 7.68 15.49 19.49 r=0 or r=1 7.60 14.26 18.52
r≤1 0.09 3.84 6.63 r=1 or r=2 0.09 3.84 6.63
Panel C: Cointegration between pt, dt and yt
r=0 36.17 29.80 35.46 r=0 or r=1 26.42 21.03 25.86
r≤1 9.74 15.49 19.94 r=1 or r=2 9.69 14.26 18.52
r≤2 0.06 3.84 6.63 r=2 or r=3 0.06 3.84 6.63

Are Asian Stock Markets Characterized by Rational Speculative Bubbles?
86
Table 4.4 (Japan)
Japan (value weight portfolio) full sample, monthly
H0 λtrace λ Trace statistics H0 λmax λ Max statistics
CV (5%) CV (1%) CV (5%) CV (1%)
Panel A: Cointegration between pt and dt
r=0 3.95 15.49 19.49 r=0 or r=1 3.06 14.26 18.52
r≤1 0.90 3.84 6.63 r=1 or r=2 0.90 3.84 6.63
Panel B: Cointegration between pt and yt
r=0 4.85 15.49 19.49 r=0 or r=1 3.48 14.26 18.52
r≤1 1.37 3.84 6.63 r=1 or r=2 1.37 3.84 6.63
Panel C: Cointegration between pt, dt and yt
r=0 17.38 29.80 35.46 r=0 or r=1 12.39 21.03 25.86
r≤1 4.99 15.49 19.94 r=1 or r=2 3.79 14.26 18.52
r≤2 1.20 3.84 6.63 r=2 or r=3 1.20 3.84 6.63
Table 4.4 (Malaysia)
Malaysia (value weight portfolio) full sample, monthly
H0 λtrace λ Trace statistics H0 λmax λ Max statistics
CV (5%) CV (1%) CV (5%) CV (1%)
Panel A: Cointegration between pt and dt
r=0 7.72 15.49 19.49 r=0 or r=1 5.47 14.26 18.52
r≤1 2.26 3.84 6.63 r=1 or r=2 2.26 3.84 6.63
Panel B: Cointegration between pt and yt
r=0 23.02 15.49 19.49 r=0 or r=1 18.82 14.26 18.52
r≤1 4.20 3.84 6.63 r=1 or r=2 4.20 3.84 6.63
Panel C: Cointegration between pt, dt and yt
r=0 35.82 29.80 35.46 r=0 or r=1 28.35 21.03 25.86
r≤1 7.41 15.49 19.94 r=1 or r=2 5.48 14.26 18.52
r≤2 1.98 3.84 6.63 r=2 or r=3 1.98 3.84 6.63

Are Asian Stock Markets Characterized by Rational Speculative Bubbles?
87
Table 4.4 (Philippines)
Philippines (value weight portfolio) full sample, monthly
H0 λtrace λ Trace statistics H0 λmax λ Max statistics
CV (5%) CV (1%) CV (5%) CV (1%)
Panel A: Cointegration between pt and dt
r=0 21.36 15.49 19.49 r=0 or r=1 21.22 14.26 18.52
r≤1 0.14 3.84 6.63 r=1 or r=2 0.14 3.84 6.63
Panel B: Cointegration between pt and yt
r=0 10.51 15.49 19.49 r=0 or r=1 10.05 14.26 18.52
r≤1 0.46 3.84 6.63 r=1 or r=2 0.46 3.84 6.63
Panel C: Cointegration between pt, dt and yt
r=0 30.31 29.80 35.46 r=0 or r=1 21.82 21.03 25.86
r≤1 8.49 15.49 19.94 r=1 or r=2 8.45 14.26 18.52
r≤2 0.04 3.84 6.63 r=2 or r=3 0.04 3.84 6.63
Table 4.4 (Singapore)
Singapore (value weight portfolio) full sample, monthly
H0 λtrace λ Trace statistics H0 λmax λ Max statistics
CV (5%) CV (1%) CV (5%) CV (1%)
Panel A: Cointegration between pt and dt
r=0 16.37 15.49 19.49 r=0 or r=1 16.13 14.26 18.52
r≤1 0.24 3.84 6.63 r=1 or r=2 0.24 3.84 6.63
Panel B: Cointegration between pt and yt
r=0 23.07 15.49 19.49 r=0 or r=1 21.65 14.26 18.52
r≤1 1.42 3.84 6.63 r=1 or r=2 1.42 3.84 6.63
Panel C: Cointegration between pt, dt and yt
r=0 37.70 29.80 35.46 r=0 or r=1 24.65 21.03 25.86
r≤1 13.05 15.49 19.94 r=1 or r=2 12.77 14.26 18.52
r≤2 0.28 3.84 6.63 r=2 or r=3 0.28 3.84 6.63

Are Asian Stock Markets Characterized by Rational Speculative Bubbles?
88
Table 4.4 (Korea)
Korea (value weight portfolio) full sample, monthly
H0 λtrace λ Trace statistics H0 λmax λ Max statistics
CV (5%) CV (1%) CV (5%) CV (1%)
Panel A: Cointegration between pt and dt
r=0 20.13 15.49 19.49 r=0 or r=1 12.43 14.26 18.52
r≤1 7.70 3.84 6.63 r=1 or r=2 7.70 3.84 6.63
Panel B: Cointegration between pt and yt
r=0 13.52 15.49 19.49 r=0 or r=1 9.34 14.26 18.52
r≤1 4.17 3.84 6.63 r=1 or r=2 4.18 3.84 6.63
Panel C: Cointegration between pt, dt and yt
r=0 33.38 29.80 35.46 r=0 or r=1 14.75 21.03 25.86
r≤1 18.62 15.49 19.94 r=1 or r=2 10.46 14.26 18.52
r≤2 8.16 3.84 6.63 r=2 or r=3 8.16 3.84 6.63
Notes:
(1) All variables are inflation adjusted. (2) pt, dt and yt denote the log of monthly stock price indices, dividends and earnings for
value-weighted portfolios from 1991-2009 respectively. (3) r denotes the number of cointegrating vectors. (4) The optimal lag lengths for VAR were chosen based on lag exclusion tests and
Akaike’s Information Criteria. (5) H0 is the null hypothesis that there exist, at most, r cointegration vectors in the system. (6) The cointegration tests are estimated under the assumption of trends in data and an
intercept but no trends in the cointegrating equation. (7) CV (5%) and CV (1%) are the critical values of the trace statistics and maximum
eigenvalue statistics for the cointegration tests.
Sub-period analysis

Are Asian Stock Markets Characterized by Rational Speculative Bubbles?
89
Table 4.5 (The summary of Appendix 1)
China Indonesia Japan Korea Malaysia Philippine Singapore
1991-1997 Y Y Y Y Y Y Y
1998-2001 Y Y Y Y Y Y Y
2002-2007 Y Y Y Y Y Y Y
2008-2009 N Y Y Y N Y Y
Where:
Y: Rational speculative bubbles existed in stock market.
N: Rational speculative bubbles did not exist in stock market.
Table 4.5 shows the summary result of the multivariate cointegration sub-period tests using
monthly data. For the first three sub-periods, namely the pre-Asian financial crisis sub-
period (1991-1997), post-Asian financial crisis sub-period (1998-2001) and pre-subprime
loan financial crisis sub-period (2002-2007), rational speculative bubbles existed in all seven
stock markets. The results for the post-subprime loan financial crisis sub-period (2008-2009)
indicate the presence of rational speculative bubbles in Indonesia, Japan, Korea, Philippine
and Singapore, but not in China and Malaysia.
In summary, the results of full sample period cointegration tests indicate the presence of
rational speculative bubbles in Indonesia and Japan over the period from 1991 to 2009, while
suggesting the absence of rational speculative bubbles in China and Singapore. However the
tests are inconclusive for Malaysia, the Philippines and Korea. The results of sub-period tests
indicate the presence of rational speculative bubbles in all stock markets for all sub-periods,
Are Asian Stock Markets Characterized by Rational Speculative Bubbles?
90
except Chinese and Malaysian stock markets over the post-subprime loan financial crisis sub-
period (2008-2009).
The results of sub-period analysis are different from the full sample period, which may be
due to rational speculative bubbles being short-run bubbles. Jaradat (2009) shows that stock
prices can be driven higher when a few uninformed traders cause a stock price to rise above
its fundamental value. Other rational traders then buy the stock, with the assumption that the
price will rise and they can sell it before the stock price drops. This speculative behaviour
drives the stock price away from its fundamental value, resulting in a short-run rational
speculative bubble which ultimately ruptures when the price returns to its fundamental value.
This viewpoint is consistent with Kirman and Teyssiere (2005), who suggest that the
underlying reasons for the short run bubbles are that there are switches in expectations caused
by individuals changing their forecasting rules. The tendency is for these changes to be self
reinforcing so, when the expectations change from positive to negative, the investors start to
sell the stock and markets start to drop. Therefore, a rational speculative bubble cannot exist
in a stock market forever thus must be a short run bubble.
The results of the full sample period cointegration tests are close to those of Chan et al.
(1998), who employ the duration dependence test to find the absence of rational speculative
bubbles in Japan, Korea and Malaysia over the sample period from 1975 to 1994 (20 years).
Furthermore, the results of sub-period tests are similar to Sarno and Taylor (1999), finding no
cointegration relationship between stock prices and dividends in China, Indonesia, Malaysia,
Philippine, Singapore, Korea and Japan over the sample period from 1989 to 1997 (9 years).
Comparing the results of Chan et al. (1998) and Sarno and Taylor (1999), we can see that
rational speculative bubbles exist in the short-run (9 years) rather than in the long-run (20

Are Asian Stock Markets Characterized by Rational Speculative Bubbles?
91
years). This is consistent with the current study’s finding that the rational speculative bubble
is a short-run bubble.

Are Asian Stock Markets Characterized by Rational Speculative Bubbles?
92
4.5 Conclusion
Comparing the results of the three types of tests, the duration dependence test is more
accurate in identifying rational speculative bubbles that other tests, such as the cointegration
test, skewness, kurtosis and autocorrelation. As previously discussed, the cointegration
method has two limitations. Relying heavily on the correct identification of controversial
fundamental variablesand and having low power when using limited data span. McQueen and
Thorley (1994) show the weaknesses of skewness, kurtosis and autocoreelation as skewness
could result from asymmetric fundamental news, leptokurtosis could be a consequence of the
batched arrival of information and autocorrelation could be induced by time-varying risk
premiums. Therefore, it appears that the results of the duration dependence test are more
reliable which is why it was chosen as the main test for this research study.
The presence of rational speculative bubbles in stock markets can also be inferred from
evidence of negative skewness, excess kurtosis and non-normality of real returns as reported
in the summary statistics. The summary statistics results of this research are similar to the
results of Chan et al. (1998), indicating that rational speculative bubbles may exist in Asian
stock markets, namely China, Indonesia, Malaysia, Philippine, Japan, Korea and Singapore.
For duration dependence tests the null hypothesis of no rational speculative bubble implies a
constant hazard rate (β=0). Using monthly data, the duration dependence tests indicate no
evidence of rational speculative bubbles in all eight stock markets considered in this study,
whether is for the full sample period or in sub-periods. However, the use of weekly data
indicates the presence of rational speculative bubbles in Indonesia, Malaysia, and China
(Shanghai and Shenzhen) for the full sample period. Further, the weekly sub-period tests
show that rational speculative bubbles existed in the Indonesian stock market over the pre-
Asian financial crisis subperiod (1991-1997), in the Chinese stock markets over both the pre-

Are Asian Stock Markets Characterized by Rational Speculative Bubbles?
93
Asian financial crisis subperiod (1991-1997) and the pre-subprime loan financial crisis
subperiod (2002-2007), and in Malaysia over the sample period from 1997 to 2007.
Therefore, based on duration dependence tests employing weekly data, rational speculative
bubbles existed in the Chinese, Indonesian and Malaysian stock markets, but not in Japan,
Singapore, Korea and Philippines. This result is consistent with Zhang (2008), Lehkonen
(2010) and Haque et al. (2008), who all imply that rational speculative bubbles existed in the
Chinese stock market. All three studies employed the duration dependence test, with sample
periods from 1991 to 2001, 1992 to 2008 and 1991 to 2007 respectively. The duration
dependence test results of the current study are partly consistent with to Sarno and Taylor
(1999), who find strong evidence of the presence of rational speculative bubbles in China,
Indonesia, Malaysia, Philippines, Singapore, Korea and Japan over the sample period from
1989 to 1997. However, the current finding is that rational speculative bubbles existed in the
Chinese, Indonesian and Malaysian stock markets, but not in Japan, Singapore, Korea and the
Philippines. This is also consistent with Mokhtar et al. (2006) and Ali et al. (2009) in terms of
Malaysian stock market. Both studies employed duration dependence tests and report
evidence of rational speculative bubbles in Malaysia over the period from 1999 to 2003 and
1987 to 1997 respectively.
The results of the unit root and multivariate cointegration tests support the conclusion that
rational speculative bubbles exist in the stock markets of Indonesia and Japan while
indicating the absence of rational speculative bubbles in China and Singapore. However the
tests are inconclusive for Malaysia, Philippines and Korea. In addition, the results of the
cointegration sub-period tests indicate that rational speculative bubbles may exist in all Asian
stock markets examined, namely China, Indonesia, Malaysia, Philippine, Japan, Korea and
Singapore. The results of the cointegration full sample period tests is close to those of Chan
et al. (1998), which employed the duration dependence test to find the absence of rational

Are Asian Stock Markets Characterized by Rational Speculative Bubbles?
94
speculative bubbles in Japan, Korea and Malaysia from 1975 to 1994 while the sub-period
test results are similar to Sarno and Taylor (1999), finding no cointegration relationship
between stock prices and dividends in China, Indonesia, Malaysia, Philippine, Singapore,
Korea and Japan over the period from 1989 to 1997.
In summary, the results of duration dependence test show strong evidence for the presence of
rational speculative bubbles in the Chinese, Indonesian and Malaysian stock markets. This
result is consistent with those of summary statistics and cointegration tests. Therefore, the
conclusion may be drawn that rational speculative bubbles existed in the Chinese, Indonesian
and Malaysian stock markets over the sample period from 1991 to 2009. The subperiod
analyses show evidence of the presence of rational speculative bubbles in the Chinese stock
market over both pre-Asian financial crisis and pre-subprime loan financial crisis sub-periods,
in the Indonesian stock markets over the pre-Asian financial crisis sub-period and in the
Malaysian stock market over the pre-subprime loan financial crisis sub-period.
According to Figure 1 in chapter 3, the Japanese stock market trended downwards over the
period from 1991 to 2009; therefore, there was no bubble in the Japanese stock market over
the sample period. However, the long sequence of increases in stock prices from 2002,
followed by a dramatic price drop in 2007 in the Singaporean, Philippine and South Korean
stock markets would seem to indicate the presence of bubbles. According to the current
results, there were no rational speculative bubbles in these stock markets from 1991 to 2009,
therefore the boom and bust cycles in the three stock markets could be attributed to irrational
speculative bubbles with positive feedback, noise trader and herd behaviour as their possible
causes.

Are Asian Stock Markets Characterized by Rational Speculative Bubbles?
95
Chapter 5
Conclusions, Limitations and Future Research Directions
5.1 Introduction
This chapter summarizes the findings of this study on the detection of rational speculative
bubbles in the Asian stock market (Japan, Singapore, Korea, China, Indonesia, Malaysia and
Philippines). Section 5.2 gives an overview of the study while sections 5.3 and 5.4 discuss the
results and implications of the study. The conclusion of the study is provided in section 5.5
followed by the limitations of the research in Section 5.6. Finally, section 5.7 gives
recommendations for future research.
5.2 Overview of the study
Empirical evidence shows that sometimes stock prices deviate from fundamental values,
which can be explained by the presence of rational speculative bubbles. Stock markets
traditionally believed to contain rational speculative bubbles typically exhibit a long sequence
of increases in stock prices followed by a dramatic price drop (McQueen and Thorley, 1994).
Asian stock markets have experienced several boom and bust cycles in the last 20 years,
which would appear consistent with the presence of rational speculative bubbles, therefore
this research investigates whether Asian stock markets were characterized by rational
speculative bubbles during the last 20 years.
Prior studies have tested the presence of rational speculative bubbles in the Asian stock
markets, for example, Chan et al. (1998) and Sarno and Taylor (1999). However, the results
of these studies contradict each other. So far, there is still no conclusive evidence of whether
or not rational speculative bubbles exist in Asian stock markets over the chosen sample
period from 1991 to 2009. The first research objective is to test for presence of rational

Are Asian Stock Markets Characterized by Rational Speculative Bubbles?
96
speculative bubbles in the Asian stock markets over this period. Furthermore, the second
research objective is to test for rational speculative bubbles over sub-periods, namely, pre-
and post- 1997 (1991-1997 and 1997-2001) the Asian financial crisis sub-periods and pre-
and post- 2007 (2001-2007 and 2007-2009) the Subprime loan financial crisis sub-periods.
The third objective is to test if the presence of bubbles is sensitive to types of markets---
emerging versus developed stock market while the fourth objective is to test the robustness of
the results of the duration dependence test when using weekly rather than monthly data.
This research used both monthly and weekly stock price indices of eight Asian stock markets,
all inflation adjusted using monthly and weekly inflation rates computed from the Consumer
Price Index (CPI) data for Summary Statistics and a duration dependence test. The monthly
value-weighted stock prices, dividends and earnings are also used by this research in
cointegration tests. Three methods were employed to detect for the presence of rational
speculative bubbles: a) the use of summary statistics, b) duration dependence tests, and c)
cointegration tests. Summary statistics can be used to test for the presence of rational
speculative bubbles as this can be inferred from evidence of negative skewness, excess
kurtosis and positive autocorrelation of real returns. The duration dependence test for rational
speculative bubbles, developed by McQueen and Thorley (1994), tests for another
characteristic, the presence of a negative relationship between the probability that a positive
run will end and the length of the positive run, i.e., negative duration dependence or a
decreasing hazard rate, while the cointegration approach is used to examine the long-run
relationship between stock prices and fundamental values. If stock prices and fundamental
values are not cointegrated, rational speculative bubbles can be said to exist in the stock
market.

Are Asian Stock Markets Characterized by Rational Speculative Bubbles?
97
5.3 Results of this study
5.3.1 Result for objective one
Many previous studies tested the presence of rational speculative bubbles in Asian stock
markets, but there is still a debate about whether or not they exist thus, the first research
objective is to test for the presence of rational speculative bubbles in the Asian stock markets,
namely Japan, Singapore, Korea, China, Indonesia, Malaysia and Philippines between 1991
and 2009. The results of duration dependence tests show strong evidence of the presence
rational speculative bubbles in the Chinese, Indonesian and Malaysian stock markets
consistent with summary statistics and cointegration test results. Therefore, we conclude that
rational speculative bubbles existed in the Chinese, Indonesian and Malaysian stock markets,
but not in Japanese, Singaporean, Korean and Philippine stock markets over the period from
1991 to 2009.
Many previous studies tested the presence of rational speculative bubbles in Asian stock
market, but there is still a debate about whether or not rational speculative bubbles exist in
Asian stock markets. Our results indicate that rational speculative bubbles exist in some of
Asian stock markets, such as Indonesia, Malaysia and China, but not in the others, such as
Japan, Korea, Singapore and Philippines over the period from 1991-2009.
5.3.2 Result for objective two
The second research objective tests for rational speculative bubbles over sub-periods, namely,
the pre- and post- 1997 (1991-1997 and 1997-2001) Asian financial crisis sub-periods and
the pre- and post- 2007 (2001-2007 and 2007-2009) Subprime loan financial crisis sub-
periods. The subperiod analysis shows evidence of rational speculative bubbles in the
Chinese stock market over both the pre-Asian financial crisis and the pre-subprime loan
Are Asian Stock Markets Characterized by Rational Speculative Bubbles?
98
financial crisis sub-periods; in the Indonesian stock market over the pre-Asian financial crisis
sub-period; and in the Malaysian stock market over the pre-Subprime loan financial crisis
sub-period.
5.3.3 Result for objective three
The third objective is to test if bubbles are more prevalent in emerging, relative to developed,
markets. The eight markets are sorted according to their stage of development: China,
Indonesia, Malaysia and Philippines belonging to the emerging markets while Japan,
Singapore and Korea belong to developed markets. The results of this research indicate
evidence of rational speculative bubbles in the emerging stock markets of China, Indonesia,
and Malaysia, but not in the Philippines. No rational speculative bubbles were detected in the
developed stock markets of Japan, Singapore and Korea. It therefore appears that rational
speculative bubbles are more prevalent in emerging stock markets than developed stock
markets.
5.3.4 Result for objective four
The fourth research objective is to test the robustness of the results of the duration
dependence test when using weekly rather than monthly data. The results of this research
show stronger evidence of rational speculative bubbles in the Chinese, Indonesian and
Malaysian stock markets using weekly data, rather than monthly data. Therefore, the
conclusion is that weekly data is more sensitive than monthly data to duration dependence
tests.

Are Asian Stock Markets Characterized by Rational Speculative Bubbles?
99
5.4 Research implications
First, understanding whether or not stock markets are characterized by rational speculative
bubbles can help policy makers to better understand stock markets and the macro economy as
their presence indicates imperfections in the stock market and causes the financial system and
the macro economy to be unstable. In such cases, policy makers should seek to stabilize the
financial system and steer the economy away from these bubbles. Some ways of reducing
rational speculative bubbles in the stock market include raising interest rates, restricting
short-selling of stocks, controlling inside trading activities and increasing brokerage fees.
Secondly, it appears that rational speculative bubbles always exist in pre-financial crisis sub-
periods, which means rational speculative bubbles can be found before stock market crashes.
This study only used data when market boomed, without including the data when market
crashed. Therefore, investors could possibly predict market crashes before a financial crisis
occurs, which is very important for two main reasons. First, investors could use short-selling
to benefit from declining stock prices and second, even though in countries like China it is
impossible to benefit from declining prices due to the prohibition of short-selling,
information that a stock market will crash can force investors to act rationally by selling their
stocks and adjust the share prices toward their fair value, as well as causing the market to be
efficient.
Additionally, the finding of this research that rational speculative bubbles are more prevalent
in emerging stock markets than developed stock markets is also very important to both
investors and policy makers. It means that investors should pay more attention to identifying
rational speculative bubbles when investing in emerging stock markets. When such bubbles
burst, the stock market will crash, which is very dangerous for investors. However, by short-
selling stocks, investors could also earn high returns when the bubble explodes and stock

Are Asian Stock Markets Characterized by Rational Speculative Bubbles?
100
prices crash. Moreover, policy makers of emerging countries should pay more attention to
rational speculative bubbles in their stock markets and should stabilize the financial system to
steer the economy away from them.
Finally, if investors or policy makers want to test for the presence of rational speculative
bubbles in a stock market using duration dependence tests, they should understand that the
results of weekly data are more reliable than monthly data.
5.5 Conclusion
In conclusion, the results of this research indicate that rational speculative bubbles existed in
the Chinese, Indonesian and Malaysian stock markets, but not in the Japanese, Korean,
Singaporean and Philippine stock markets, over the sample period from 1991 to 2009. The
sub-period analysis showed evidence of rational speculative bubbles in the Chinese stock
market over both the pre-Asian financial crisis and pre-Subprime loan financial crisis sub-
periods, in the Indonesian stock markets over the pre-Asian financial crisis sub-period and in
the Malaysian stock market over the pre-Subprime loan financial crisis sub-period.
The results of this research are consistent with Sarno and Taylor (1999), Zhang (2008),
Lehkonen (2010), Ali et al. (2009) and Mokhtar et al. (2006). Sarno and Taylor (1999) found
evidence of rational speculative bubbles China, Indonesia, Malaysia, Philippines, Singapore,
South Korea, Taiwan and Thailand over their sample period from 1989 to 1997. Zhang (2008)
and Lehkonen (2010) showed evidence of rational speculative bubbles in the Chinese stock
market over the sample periods from 1991 to 2001and 1992 to 2008, while, in the Malaysian
stock market, Ali et al. (2009) and Mokhtar et al. (2006) both found evidence of rational
speculative bubbles from 1989 to 2006 and 1994 to 2003. The results of this research also
show that rational speculative bubbles are more prevalent in emerging rather than developed
stock markets. A better understanding of whether or not stock markets are characterized by

Are Asian Stock Markets Characterized by Rational Speculative Bubbles?
101
rational speculative bubbles can help investors or practitioners to allocate their investment
efficiently and can also help policy makers to better understand stock markets and the macro
economy.
Another important finding of this research is that rational speculative bubbles were found to
exist in the pre-financial crisis sub-periods. Therefore, it might be possible to predict market
crashes by identifying their presence.
The last finding of this research is that the duration dependence test is more sensitive to the
use of weekly data than monthly data. Results showed that no rational speculative bubble
existed in seven sample countries using monthly data, but evidence was found of rational
speculative bubbles in the Chinese, Malaysian and Indonesian stock markets using weekly
data. This finding confirms the conclusion of Harman and Zuehlke (2004) and Lehkonen
(2010) that the duration dependence test is more sensitive to the use of weekly data than
monthly data.
5.6 Limitations
5.6.1 Length of full sample period
As the emerging Asia-pacific stock markets have short price histories, for example, China’s
stock market only started from 1991, this research only analyzes data over the sample period
from 1991 to 2009, a collection of just 19 years data. Compared with the previous studies, for
example, McQueen and Thorley (1994) who employ the duration dependence test to the New
York Stock Exchange (NYSE) over a sample period from 1927 to 1991, our research sample
period is short.

Are Asian Stock Markets Characterized by Rational Speculative Bubbles?
102
5.6.2 Length of post-Subprime loan financial crisis sub-period
Compared with previous studies, this research has extended the sample period to 2009 and
thus is the first study to test the presence of rational speculative bubbles over the Subprime
loan financial crisis period, which is a very important contribution of this research. However,
the post-Subprime loan financial crisis sub-period analysed is only from 2008 to 2009 .and
we could obtain only minimal data observations over such a short sub-period. This is the
main weakness of this research.
5.6.3 Sub-period analysis by cointegration test
The Johansen-Juselius multivariate cointegration vector autoregression approach is used to
examine the long-run relationship between stock prices and fundamental values. The full
sample period was separated into the pre- and post- 1997 Asian financial crisis sub-periods
and the pre- and post- 2007 Subprime loan financial crisis sub-periods. Consequently, the
pre-1997 Asian financial crisis sub-period is from 1991 to 1997 (seven years), the post- 1997
Asian financial crisis sub-period is from 1998 to 2001 (four years), the pre-2007 Subprime
loan financial crisis sub-period is from 2002 to 2007 (six years) and the post- 2007 Subprime
loan financial crisis sub-period is from 2008 to 2009 (two years). For testing the long run
relationships, the pre-1997 Asian financial crisis sub-period of seven years and pre-2007
Subprime loan financial crisis sub-period of six years are suitable. However, the post- 1997
Asian financial crisis sub-period of four years and post- 2007 Subprime loan financial crisis
sub-period of two years is too short for meaningful cointegration tests. This is the reason why
cointegration tests could only be used as a complement to the duration dependence tests.
5.7 Future research directions

Are Asian Stock Markets Characterized by Rational Speculative Bubbles?
103
Examining the research limitations, the major problem with this research is the length of the
sample period. Future research could and should choose stock markets which have longer
price histories. Furthermore, if future researchers want to test for rational speculative bubbles
over the Subprime loan financial crisis period, they still need to wait for another two or three
years, until they can collect more post-crisis data.

Are Asian Stock Markets Characterized by Rational Speculative Bubbles?
104
Reference:
Ali, N., Nassir, A., Hassan, T., Abidin, S.Z., 2009. Stock Overreaction and Financial Bubbles: Evidence from Malaysia. Journal of Money, Investment and Banking 11, 90-101.
Bianco, Katalina M., 2008. The Subprime Lending Crisis: Causes and Effects of the Mortgage Meltdown, CCH Mortgage Compliance Guide and Bank Digest.
http://www.business.cch.com/bankingfinance/focus/news/Subprime_WP_rev.pdf
Binswanger, M., 2004. How important are fundamentals?-Evidence from a structural VAR model for the stock markets in the US, Japan and Europe. Journal of International Financial Markets, Institutions and Money 14, 185-201.
Blanchard, O.J., Watson, M.W., 1982. Bubbles, rational expectations, and financial markets. NBER Working Paper Series 945, 1-30.
Blanchard, O.J., Watson, M.W., 1982. Bubbles, rational expectations, and financial markets. In: Wachtel, P. (Ed), Crisis in the economic and Financial System. Lexington Books, Lexington, Massachusetts, PP. 295-315.
Blancard, G.C., Raymond, H., 2004. Empirical evidence on periodically collapsing stock price bubbles. Applied Economics Letters 11, 61-69.
Brooks, C., Katsaris, A., 2003. Rational speculative bubbles: an empirical investigation of the London Stock Exchange. Bulletin of Economic Research 55 (4), 319-346.
Campbell, J.Y., Lo, A.W., Mackinlay, A.C., 1997. The Econometrics of Financial Markets. Princeton University Press, Princeton, NJ.
Campbell, J.Y., Shiller, R.J., 1998. Stock prices, earnings and expected dividends. Journal of Finance 43, 661-676.
Campbell, J.Y., Shiller, R.J., 1987. Cointegration and tests of present value models. Journal of Political Economy 95, 1062-1088.
Chan, K., McQueen, G., Thorley, S., 1998. Are there rational speculative bubble in Asian stock markets? Pacific-Basin Finance Journal 6, 125-151.
Chow, Y.F., 1998. Regime switching and cointegration tests of the efficiency of futures markets. Journal of Futures Markets 18, 871-901.
Cunado, J., L.A., Gil-Alana, L.A., Perez de Gracia, F., 2005. A test for rational bubble in the NASDAQ stock index: A fractionally integrated approach, Journal of Banking & Finance 29, 2633-2654.

Are Asian Stock Markets Characterized by Rational Speculative Bubbles?
105
Evans, G.W., 1986. A test for speculative bubbles in the sterling dollar exchange rate: 1981-1984. The American Economic Review 76, 621-636.
Garber, P., 1990. Famous First Bubbles. Journal of Economic Perspectives 4, 35-54.
Harman,Y.S., Zuehlke, T.W., 2004. Duration dependence testing for speculative bubbles. Journal of Economics and Finance 28,147-154.
Hassan, M., Yu, J. (2006). Rational speculative bubbles in the frontier emerging stock markets. Under review at Journal of Empirical Finance: Working Paper.
Hassan, M., Yu, J. (2007). Rational Speculative Bubbles: An empirical investigation of the Middle East and North African stock markets. Networks Financial Institute: Working Paper.
James, L., Farrell, Jr., 1985. The Dividend Discount Model: A Primer. Financial Analysts Journal 41, 16-25.
Jaradat, M.A., (2009). An empirical investigation of rational speculative bubbles in the Jordanian stock market: A nonparametric approach. International Management Review, 5(2).
Jirasakuldech, B., Emekter, R., & Rao, R. (2008). Do Thai stock prices deviate from fundamental values? Pacific-Basin Finance Journal, 16, 298-315.
Jirasakuldech, B., Compbell, R.D., Knight, J,R. (2006). Are There Rational Speculative Bubbles in REIRs? J Real Estate Finan Econ, 32, 105-127.
Jirasakuldech, B., Zorn, T. S. (2002). Financial disclosure and speculative bubbles: an international comparison. Presented at Financial Management Association.
Johansen, S., 1988. Statistical analysis of cointegration Vetors. Journal of Economics Dynamics & Control 12, 231-254.
Johansen, S., 1991. Estimation and hypothesis testing of cointegrating vectors in Gaussian vector autoregressive models. Econometrica 59, 1551-1580.
Johansen, S., Juselius, K., 1992. Testing Structural hypothesis in a multivariate cointegration analysis of the PPP and UIP for the UK. Journal of Econometrics 53, 211-244.
Junttila, J., (2003). Detecting speculative bubbles in an IT-intensive stock market. J Econ Finance, 27, 166-189.
Lee, B.S., 1996. Comovements of earnings, dividends, and stock prices. Journal of Empirical Finance, 3, 327-346.
Lehkonen, H., (2010). Bubble in China. International Review of Financial Analysis, 19,113-117.
Lim, G.C., 2005. Bounded dividends, earnings and fundamental stock value. Empirical Economics 30, 411-426.

Are Asian Stock Markets Characterized by Rational Speculative Bubbles?
106
McQueen, G., Thorley, S. (1994). Bubbles, stock returns and duration dependence. Journal of Financial an Qualitative Analysis, 29, 196-197.
Mokhtar, S.H., Nassir, A.M., Hassan, T. (2006). Detecting Rational Speculative Bubbles in the Malaysian Stock Market. International Research Journal of Finance and Economics, 6, 102-115.
Pierse, R.G., Snell, A.J., 1995. Temporal aggregation and the power of tests for a unit root. Journal of Econometrics 65, 333-345.
Radelet, S., Sachs, J., 1998. The East Asian Financial Crisis: Diagnosis, Remedies, Prospects. Brookings Papers on Economic Activity 1998, 1-90.
Rangel, G., Pillay, S.S. (2007). Evidence of bubbles in the Singaporean stock market. Singapore Economic Review conference 2007 (August), JEL Classification : C51, G14.
Sarno, L., Taylor, M.P., 1999. Moral hazard, asset price bubbles, capital flows, and the East Asian crisis: the first tests. Journal of International Money and Finance 18, 637-657.
Tan, L., Chiang, T.C., Mason, J.R., Nelling, E., 2008. Herding behaviour in Chinese stock markets: An examination of A and B shares. Pacific-Basin Finance Journal 16, 61-77.
Watanapalachaikul, S., IsIam, S.M.N. (2007). Rational Speculative Bubbles in the Thai Stock Market: Econometric Tests and Implications. Review of Pacific Basin Financial Markets and Policies. 10 (1), 1-13.
West, K.D. (1987). A Specification Test for Speculative Bubbles. Quarterly Journal of Economics 102, 553-580.
Zhang, B. (2008). Duration dependence test for rational bubbles in Chinese stock market. Applied Economics Letters, 15(8), 635-639.

Are Asian Stock Markets Characterized by Rational Speculative Bubbles?
107
Appendix: 1
China (value weight portfolio) sub-period, monthly (1991-1997)
H0 λtrace λ Trace statistics H0 λmax λ Max statistics
CV (5%) CV (1%) CV (5%) CV (1%)
Panel A: Cointegration between pt and dt
r=0 12.80 15.49 19.49 r=0 or r=1 10.41 14.26 18.52
r≤1 2.39 3.84 6.63 r=1 or r=2 2.39 3.84 6.63
Panel B: Cointegration between pt and yt
r=0 18.06 15.49 19.49 r=0 or r=1 11.16 14.26 18.52
r≤1 6.90 3.84 6.63 r=1 or r=2 6.90 3.84 6.63
Panel C: Cointegration between pt, dt and yt
r=0 23.97 29.80 35.46 r=0 or r=1 12.38 21.03 25.86
r≤1 11.69 15.49 19.94 r=1 or r=2 9.28 14.26 18.52
r≤2 2.41 3.84 6.63 r=2 or r=3 2.41 3.84 6.63
China (value weight portfolio) sub-period, monthly (1998-2001)
H0 λtrace λ Trace statistics H0 λmax λ Max statistics
CV (5%) CV (1%) CV (5%) CV (1%)
Panel A: Cointegration between pt and dt
r=0 5.14 15.49 19.49 r=0 or r=1 3.33 14.26 18.52
r≤1 1.81 3.84 6.63 r=1 or r=2 1.81 3.84 6.63
Panel B: Cointegration between pt and yt
r=0 7.61 15.49 19.49 r=0 or r=1 7.23 14.26 18.52
r≤1 0.39 3.84 6.63 r=1 or r=2 0.39 3.84 6.63
Panel C: Cointegration between pt, dt and yt
r=0 19.44 29.80 35.46 r=0 or r=1 15.80 21.03 25.86
r≤1 3.64 15.49 19.94 r=1 or r=2 3.44 14.26 18.52
r≤2 0.20 3.84 6.63 r=2 or r=3 0.20 3.84 6.63
China (value weight portfolio) sub-period, monthly (2002-2007)

Are Asian Stock Markets Characterized by Rational Speculative Bubbles?
108
H0 λtrace λ Trace statistics H0 λmax λ Max statistics
CV (5%) CV (1%) CV (5%) CV (1%)
Panel A: Cointegration between pt and dt
r=0 8.35 15.49 19.49 r=0 or r=1 7.59 14.26 18.52
r≤1 0.76 3.84 6.63 r=1 or r=2 0.76 3.84 6.63
Panel B: Cointegration between pt and yt
r=0 7.79 15.49 19.49 r=0 or r=1 6.30 14.26 18.52
r≤1 1.50 3.84 6.63 r=1 or r=2 1.50 3.84 6.63
Panel C: Cointegration between pt, dt and yt
r=0 27.38 29.80 35.46 r=0 or r=1 14.97 21.03 25.86
r≤1 12.41 15.49 19.94 r=1 or r=2 10.14 14.26 18.52
r≤2 2.27 3.84 6.63 r=2 or r=3 2.27 3.84 6.63
China (value weight portfolio) sub-period, monthly (2008-2009)
H0 λtrace λ Trace statistics H0 λmax λ Max statistics
CV (5%) CV (1%) CV (5%) CV (1%)
Panel A: Cointegration between pt and dt
r=0 19.50 15.49 19.49 r=0 or r=1 12.69 14.26 18.52
r≤1 6.81 3.84 6.63 r=1 or r=2 6.81 3.84 6.63
Panel B: Cointegration between pt and yt
r=0 26.39 15.49 19.49 r=0 or r=1 18.64 14.26 18.52
r≤1 7.75 3.84 6.63 r=1 or r=2 7.75 3.84 6.63
Panel C: Cointegration between pt, dt and yt
r=0 35.80 29.80 35.46 r=0 or r=1 17.98 21.03 25.86
r≤1 17.82 15.49 19.94 r=1 or r=2 11.82 14.26 18.52
r≤2 6.00 3.84 6.63 r=2 or r=3 6.00 3.84 6.63
Indonesia (value weight portfolio) sub-period, monthly (1991-1997)
H0 λtrace λ Trace statistics H0 λmax λ Max statistics
CV (5%) CV (1%) CV (5%) CV (1%)

Are Asian Stock Markets Characterized by Rational Speculative Bubbles?
109
Panel A: Cointegration between pt and dt
r=0 12.49 15.49 19.49 r=0 or r=1 10.05 14.26 18.52
r≤1 2.44 3.84 6.63 r=1 or r=2 2.44 3.84 6.63
Panel B: Cointegration between pt and yt
r=0 8.09 15.49 19.49 r=0 or r=1 7.19 14.26 18.52
r≤1 0.90 3.84 6.63 r=1 or r=2 0.90 3.84 6.63
Panel C: Cointegration between pt, dt and yt
r=0 34.87 29.80 35.46 r=0 or r=1 27.75 21.03 25.86
r≤1 7.12 15.49 19.94 r=1 or r=2 6.25 14.26 18.52
r≤2 0.87 3.84 6.63 r=2 or r=3 0.87 3.84 6.63
Indonesia (value weight portfolio) sub-period, monthly (1998-2001)
H0 λtrace λ Trace statistics H0 λmax λ Max statistics
CV (5%) CV (1%) CV (5%) CV (1%)
Panel A: Cointegration between pt and dt
r=0 13.53 15.49 19.49 r=0 or r=1 12.46 14.26 18.52
r≤1 1.06 3.84 6.63 r=1 or r=2 1.06 3.84 6.63
Panel B: Cointegration between pt and yt
r=0 5.52 15.49 19.49 r=0 or r=1 4.04 14.26 18.52
r≤1 1.21 3.84 6.63 r=1 or r=2 1.21 3.84 6.63
Panel C: Cointegration between pt, dt and yt
r=0 18.61 29.80 35.46 r=0 or r=1 12.75 21.03 25.86
r≤1 5.86 15.49 19.94 r=1 or r=2 4.07 14.26 18.52
r≤2 1.79 3.84 6.63 r=2 or r=3 1.79 3.84 6.63
Indonesia (value weight portfolio) sub-period, monthly (2002-2007)
H0 λtrace λ Trace statistics H0 λmax λ Max statistics
CV (5%) CV (1%) CV (5%) CV (1%)
Panel A: Cointegration between pt and dt
r=0 5.53 15.49 19.49 r=0 or r=1 5.74 14.26 18.52

Are Asian Stock Markets Characterized by Rational Speculative Bubbles?
110
r≤1 0.05 3.84 6.63 r=1 or r=2 0.55 3.84 6.63
Panel B: Cointegration between pt and yt
r=0 25.77 15.49 19.49 r=0 or r=1 25.53 14.26 18.52
r≤1 0.24 3.84 6.63 r=1 or r=2 0.24 3.84 6.63
Panel C: Cointegration between pt, dt and yt
r=0 36.57 29.80 35.46 r=0 or r=1 26.51 21.03 25.86
r≤1 10.06 15.49 19.94 r=1 or r=2 10.04 14.26 18.52
r≤2 0.02 3.84 6.63 r=2 or r=3 0.02 3.84 6.63
Indonesia (value weight portfolio) sub-period, monthly (2008-2009)
H0 λtrace λ Trace statistics H0 λmax λ Max statistics
CV (5%) CV (1%) CV (5%) CV (1%)
Panel A: Cointegration between pt and dt
r=0 6.51 15.49 19.49 r=0 or r=1 6.28 14.26 18.52
r≤1 0.23 3.84 6.63 r=1 or r=2 0.23 3.84 6.63
Panel B: Cointegration between pt and yt
r=0 7.78 15.49 19.49 r=0 or r=1 6.78 14.26 18.52
r≤1 0.99 3.84 6.63 r=1 or r=2 0.99 3.84 6.63
Panel C: Cointegration between pt, dt and yt
r=0 18.93 29.80 35.46 r=0 or r=1 12.86 21.03 25.86
r≤1 6.07 15.49 19.94 r=1 or r=2 4.99 14.26 18.52
r≤2 1.08 3.84 6.63 r=2 or r=3 1.08 3.84 6.63
Japan (value weight portfolio) sub-period, monthly (1991-1997)
H0 λtrace λ Trace statistics H0 λmax λ Max statistics
CV (5%) CV (1%) CV (5%) CV (1%)
Panel A: Cointegration between pt and dt
r=0 3.39 15.49 19.49 r=0 or r=1 3.37 14.26 18.52
r≤1 0.02 3.84 6.63 r=1 or r=2 0.02 3.84 6.63
Panel B: Cointegration between pt and yt

Are Asian Stock Markets Characterized by Rational Speculative Bubbles?
111
r=0 8.70 15.49 19.49 r=0 or r=1 7.75 14.26 18.52
r≤1 0.95 3.84 6.63 r=1 or r=2 0.95 3.84 6.63
Panel C: Cointegration between pt, dt and yt
r=0 16.29 29.80 35.46 r=0 or r=1 11.54 21.03 25.86
r≤1 4.75 15.49 19.94 r=1 or r=2 4.64 14.26 18.52
r≤2 0.12 3.84 6.63 r=2 or r=3 0.12 3.84 6.63
Japan (value weight portfolio) sub-period, monthly (1998-2001)
H0 λtrace λ Trace statistics H0 λmax λ Max statistics
CV (5%) CV (1%) CV (5%) CV (1%)
Panel A: Cointegration between pt and dt
r=0 11.63 15.49 19.49 r=0 or r=1 8.96 14.26 18.52
r≤1 2.68 3.84 6.63 r=1 or r=2 2.68 3.84 6.63
Panel B: Cointegration between pt and yt
r=0 6.66 15.49 19.49 r=0 or r=1 5.57 14.26 18.52
r≤1 1.08 3.84 6.63 r=1 or r=2 1.08 3.84 6.63
Panel C: Cointegration between pt, dt and yt
r=0 19.26 29.80 35.46 r=0 or r=1 12.26 21.03 25.86
r≤1 6.61 15.49 19.94 r=1 or r=2 5.65 14.26 18.52
r≤2 0.96 3.84 6.63 r=2 or r=3 0.96 3.84 6.63
Japan (value weight portfolio) sub-period, monthly (2002-2007)
H0 λtrace λ Trace statistics H0 λmax λ Max statistics
CV (5%) CV (1%) CV (5%) CV (1%)
Panel A: Cointegration between pt and dt
r=0 10.12 15.49 19.49 r=0 or r=1 10.04 14.26 18.52
r≤1 0.08 3.84 6.63 r=1 or r=2 0.08 3.84 6.63
Panel B: Cointegration between pt and yt
r=0 5.59 15.49 19.49 r=0 or r=1 3.19 14.26 18.52
r≤1 2.40 3.84 6.63 r=1 or r=2 2.40 3.84 6.63

Are Asian Stock Markets Characterized by Rational Speculative Bubbles?
112
Panel C: Cointegration between pt, dt and yt
r=0 15.38 29.80 35.46 r=0 or r=1 10.53 21.03 25.86
r≤1 4.85 15.49 19.94 r=1 or r=2 3.56 14.26 18.52
r≤2 1.29 3.84 6.63 r=2 or r=3 1.29 3.84 6.63
Japan (value weight portfolio) sub-period, monthly (2008-2009)
H0 λtrace λ Trace statistics H0 λmax λ Max statistics
CV (5%) CV (1%) CV (5%) CV (1%)
Panel A: Cointegration between pt and dt
r=0 11.70 15.49 19.49 r=0 or r=1 10.08 14.26 18.52
r≤1 0.87 3.84 6.63 r=1 or r=2 0.87 3.84 6.63
Panel B: Cointegration between pt and yt
r=0 9.26 15.49 19.49 r=0 or r=1 9.13 14.26 18.52
r≤1 0.13 3.84 6.63 r=1 or r=2 0.13 3.84 6.63
Panel C: Cointegration between pt, dt and yt
r=0 19.60 29.80 35.46 r=0 or r=1 12.02 21.03 25.86
r≤1 7.58 15.49 19.94 r=1 or r=2 6.83 14.26 18.52
r≤2 0.75 3.84 6.63 r=2 or r=3 0.75 3.84 6.63
Korea (value weight portfolio) sub-period, monthly (1991-1997)
H0 λtrace λ Trace statistics H0 λmax λ Max statistics
CV (5%) CV (1%) CV (5%) CV (1%)
Panel A: Cointegration between pt and dt
r=0 11.52 15.49 19.49 r=0 or r=1 9.88 14.26 18.52
r≤1 1.65 3.84 6.63 r=1 or r=2 1.65 3.84 6.63
Panel B: Cointegration between pt and yt
r=0 9.42 15.49 19.49 r=0 or r=1 7.12 14.26 18.52
r≤1 2.30 3.84 6.63 r=1 or r=2 2.30 3.84 6.63
Panel C: Cointegration between pt, dt and yt
r=0 23.06 29.80 35.46 r=0 or r=1 11.61 21.03 25.86

Are Asian Stock Markets Characterized by Rational Speculative Bubbles?
113
r≤1 11.45 15.49 19.94 r=1 or r=2 8.63 14.26 18.52
r≤2 2.82 3.84 6.63 r=2 or r=3 2.82 3.84 6.63
Korea (value weight portfolio) sub-period, monthly (1998-2001)
H0 λtrace λ Trace statistics H0 λmax λ Max statistics
CV (5%) CV (1%) CV (5%) CV (1%)
Panel A: Cointegration between pt and dt
r=0 11.42 15.49 19.49 r=0 or r=1 8.08 14.26 18.52
r≤1 3.34 3.84 6.63 r=1 or r=2 3.34 3.84 6.63
Panel B: Cointegration between pt and yt
r=0 5.80 15.49 19.49 r=0 or r=1 4.68 14.26 18.52
r≤1 1.11 3.84 6.63 r=1 or r=2 1.11 3.84 6.63
Panel C: Cointegration between pt, dt and yt
r=0 29.24 29.80 35.46 r=0 or r=1 19.01 21.03 25.86
r≤1 10.24 15.49 19.94 r=1 or r=2 9.07 14.26 18.52
r≤2 1.16 3.84 6.63 r=2 or r=3 1.16 3.84 6.63
Korea (value weight portfolio) sub-period, monthly (2002-2007)
H0 λtrace λ Trace statistics H0 λmax λ Max statistics
CV (5%) CV (1%) CV (5%) CV (1%)
Panel A: Cointegration between pt and dt
r=0 12.09 15.49 19.49 r=0 or r=1 8.20 14.26 18.52
r≤1 3.90 3.84 6.63 r=1 or r=2 3.90 3.84 6.63
Panel B: Cointegration between pt and yt
r=0 9.20 15.49 19.49 r=0 or r=1 6.81 14.26 18.52
r≤1 2.40 3.84 6.63 r=1 or r=2 2.39 3.84 6.63
Panel C: Cointegration between pt, dt and yt
r=0 29.72 29.80 35.46 r=0 or r=1 18.31 21.03 25.86
r≤1 11.42 15.49 19.94 r=1 or r=2 8.27 14.26 18.52
r≤2 3.15 3.84 6.63 r=2 or r=3 3.15 3.84 6.63

Are Asian Stock Markets Characterized by Rational Speculative Bubbles?
114
Korea (value weight portfolio) sub-period, monthly (2008-2009)
H0 λtrace λ Trace statistics H0 λmax λ Max statistics
CV (5%) CV (1%) CV (5%) CV (1%)
Panel A: Cointegration between pt and dt
r=0 9.93 15.49 19.49 r=0 or r=1 9.17 14.26 18.52
r≤1 0.76 3.84 6.63 r=1 or r=2 0.76 3.84 6.63
Panel B: Cointegration between pt and yt
r=0 18.31 15.49 19.49 r=0 or r=1 17.46 14.26 18.52
r≤1 0.85 3.84 6.63 r=1 or r=2 0.85 3.84 6.63
Panel C: Cointegration between pt, dt and yt
r=0 35.08 29.80 35.46 r=0 or r=1 19.24 21.03 25.86
r≤1 15.82 15.49 19.94 r=1 or r=2 13.10 14.26 18.52
r≤2 2.74 3.84 6.63 r=2 or r=3 2.74 3.84 6.63
Malaysia (value weight portfolio) sub-period, monthly (1991-1997)
H0 λtrace λ Trace statistics H0 λmax λ Max statistics
CV (5%) CV (1%) CV (5%) CV (1%)
Panel A: Cointegration between pt and dt
r=0 11.04 15.49 19.49 r=0 or r=1 10.39 14.26 18.52
r≤1 0.65 3.84 6.63 r=1 or r=2 0.65 3.84 6.63
Panel B: Cointegration between pt and yt
r=0 7.47 15.49 19.49 r=0 or r=1 6.27 14.26 18.52
r≤1 1.20 3.84 6.63 r=1 or r=2 1.20 3.84 6.63
Panel C: Cointegration between pt, dt and yt
r=0 19.51 29.80 35.46 r=0 or r=1 12.54 21.03 25.86
r≤1 6.96 15.49 19.94 r=1 or r=2 6.00 14.26 18.52
r≤2 0.96 3.84 6.63 r=2 or r=3 0.96 3.84 6.63

Are Asian Stock Markets Characterized by Rational Speculative Bubbles?
115
Malaysia (value weight portfolio) sub-period, monthly (1998-2001)
H0 λtrace λ Trace statistics H0 λmax λ Max statistics
CV (5%) CV (1%) CV (5%) CV (1%)
Panel A: Cointegration between pt and dt
r=0 15.44 15.49 19.49 r=0 or r=1 9.30 14.26 18.52
r≤1 6.14 3.84 6.63 r=1 or r=2 6.14 3.84 6.63
Panel B: Cointegration between pt and yt
r=0 11.82 15.49 19.49 r=0 or r=1 7.07 14.26 18.52
r≤1 4.77 3.84 6.63 r=1 or r=2 4.77 3.84 6.63
Panel C: Cointegration between pt, dt and yt
r=0 25.64 29.80 35.46 r=0 or r=1 10.13 21.03 25.86
r≤1 15.51 15.49 19.94 r=1 or r=2 9.09 14.26 18.52
r≤2 6.42 3.84 6.63 r=2 or r=3 6.42 3.84 6.63
Malaysia (value weight portfolio) sub-period, monthly (2002-2007)
H0 λtrace λ Trace statistics H0 λmax λ Max statistics
CV (5%) CV (1%) CV (5%) CV (1%)
Panel A: Cointegration between pt and dt
r=0 11.93 15.49 19.49 r=0 or r=1 11.35 14.26 18.52
r≤1 0.58 3.84 6.63 r=1 or r=2 0.58 3.84 6.63
Panel B: Cointegration between pt and yt
r=0 7.17 15.49 19.49 r=0 or r=1 6.80 14.26 18.52
r≤1 0.37 3.84 6.63 r=1 or r=2 0.37 3.84 6.63
Panel C: Cointegration between pt, dt and yt
r=0 20.89 29.80 35.46 r=0 or r=1 12.51 21.03 25.86
r≤1 8.83 15.49 19.94 r=1 or r=2 7.22 14.26 18.52
r≤2 1.16 3.84 6.63 r=2 or r=3 1.16 3.84 6.63
Malaysia (value weight portfolio) sub-period, monthly (2008-2009)
H0 λtrace λ Trace statistics H0 λmax λ Max statistics

Are Asian Stock Markets Characterized by Rational Speculative Bubbles?
116
CV (5%) CV (1%) CV (5%) CV (1%)
Panel A: Cointegration between pt and dt
r=0 16.30 15.49 19.49 r=0 or r=1 12.69 14.26 18.52
r≤1 3.61 3.84 6.63 r=1 or r=2 3.61 3.84 6.63
Panel B: Cointegration between pt and yt
r=0 30.42 15.49 19.49 r=0 or r=1 17.95 14.26 18.52
r≤1 12.67 3.84 6.63 r=1 or r=2 12.47 3.84 6.63
Panel C: Cointegration between pt, dt and yt
r=0 49.64 29.80 35.46 r=0 or r=1 23.07 21.03 25.86
r≤1 26.57 15.49 19.94 r=1 or r=2 14.60 14.26 18.52
r≤2 11.97 3.84 6.63 r=2 or r=3 11.97 3.84 6.63
Philippine (value weight portfolio) sub-period, monthly (1991-1997)
H0 λtrace λ Trace statistics H0 λmax λ Max statistics
CV (5%) CV (1%) CV (5%) CV (1%)
Panel A: Cointegration between pt and dt
r=0 14.55 15.49 19.49 r=0 or r=1 10.71 14.26 18.52
r≤1 3.84 3.84 6.63 r=1 or r=2 3.84 3.84 6.63
Panel B: Cointegration between pt and yt
r=0 14.22 15.49 19.49 r=0 or r=1 12.11 14.26 18.52
r≤1 2.11 3.84 6.63 r=1 or r=2 2.11 3.84 6.63
Panel C: Cointegration between pt, dt and yt
r=0 28.59 29.80 35.46 r=0 or r=1 20.95 21.03 25.86
r≤1 7.64 15.49 19.94 r=1 or r=2 5.51 14.26 18.52
r≤2 2.13 3.84 6.63 r=2 or r=3 2.13 3.84 6.63
Philippine (value weight portfolio) sub-period, monthly (1998-2001)
H0 λtrace λ Trace statistics H0 λmax λ Max statistics
CV (5%) CV (1%) CV (5%) CV (1%)
Panel A: Cointegration between pt and dt

Are Asian Stock Markets Characterized by Rational Speculative Bubbles?
117
r=0 8.91 15.49 19.49 r=0 or r=1 7.71 14.26 18.52
r≤1 0.48 3.84 6.63 r=1 or r=2 0.48 3.84 6.63
Panel B: Cointegration between pt and yt
r=0 6.26 15.49 19.49 r=0 or r=1 3.61 14.26 18.52
r≤1 3.06 3.84 6.63 r=1 or r=2 3.06 3.84 6.63
Panel C: Cointegration between pt, dt and yt
r=0 15.85 29.80 35.46 r=0 or r=1 9.46 21.03 25.86
r≤1 6.40 15.49 19.94 r=1 or r=2 4.73 14.26 18.52
r≤2 1.67 3.84 6.63 r=2 or r=3 1.67 3.84 6.63
Philippine (value weight portfolio) sub-period, monthly (2002-2007)
H0 λtrace λ Trace statistics H0 λmax λ Max statistics
CV (5%) CV (1%) CV (5%) CV (1%)
Panel A: Cointegration between pt and dt
r=0 7.05 15.49 19.49 r=0 or r=1 6.61 14.26 18.52
r≤1 0.43 3.84 6.63 r=1 or r=2 0.43 3.84 6.63
Panel B: Cointegration between pt and yt
r=0 13.22 15.49 19.49 r=0 or r=1 12.89 14.26 18.52
r≤1 0.33 3.84 6.63 r=1 or r=2 0.33 3.84 6.63
Panel C: Cointegration between pt, dt and yt
r=0 30.77 29.80 35.46 r=0 or r=1 19.02 21.03 25.86
r≤1 11.75 15.49 19.94 r=1 or r=2 11.18 14.26 18.52
r≤2 0.57 3.84 6.63 r=2 or r=3 0.57 3.84 6.63
Philippine (value weight portfolio) sub-period, monthly (2008-2009)
H0 λtrace λ Trace statistics H0 λmax λ Max statistics
CV (5%) CV (1%) CV (5%) CV (1%)
Panel A: Cointegration between pt and dt
r=0 25.72 15.49 19.49 r=0 or r=1 23.16 14.26 18.52
r≤1 2.55 3.84 6.63 r=1 or r=2 2.55 3.84 6.63

Are Asian Stock Markets Characterized by Rational Speculative Bubbles?
118
Panel B: Cointegration between pt and yt
r=0 12.34 15.49 19.49 r=0 or r=1 11.94 14.26 18.52
r≤1 0.40 3.84 6.63 r=1 or r=2 0.40 3.84 6.63
Panel C: Cointegration between pt, dt and yt
r=0 39.06 29.80 35.46 r=0 or r=1 25.18 21.03 25.86
r≤1 13.88 15.49 19.94 r=1 or r=2 13.52 14.26 18.52
r≤2 0.35 3.84 6.63 r=2 or r=3 0.35 3.84 6.63
Singapore (value weight portfolio) sub-period, monthly (1991-1997)
H0 λtrace λ Trace statistics H0 λmax λ Max statistics
CV (5%) CV (1%) CV (5%) CV (1%)
Panel A: Cointegration between pt and dt
r=0 10.46 15.49 19.49 r=0 or r=1 6.56 14.26 18.52
r≤1 3.90 3.84 6.63 r=1 or r=2 3.90 3.84 6.63
Panel B: Cointegration between pt and yt
r=0 7.54 15.49 19.49 r=0 or r=1 4.63 14.26 18.52
r≤1 2.90 3.84 6.63 r=1 or r=2 2.90 3.84 6.63
Panel C: Cointegration between pt, dt and yt
r=0 15.65 29.80 35.46 r=0 or r=1 9.32 21.03 25.86
r≤1 6.32 15.49 19.94 r=1 or r=2 4.62 14.26 18.52
r≤2 1.70 3.84 6.63 r=2 or r=3 1.70 3.84 6.63
Singapore (value weight portfolio) sub-period, monthly (1998-2001)
H0 λtrace λ Trace statistics H0 λmax λ Max statistics
CV (5%) CV (1%) CV (5%) CV (1%)
Panel A: Cointegration between pt and dt
r=0 8.24 15.49 19.49 r=0 or r=1 6.50 14.26 18.52
r≤1 1.74 3.84 6.63 r=1 or r=2 1.74 3.84 6.63
Panel B: Cointegration between pt and yt
r=0 14.89 15.49 19.49 r=0 or r=1 10.55 14.26 18.52

Are Asian Stock Markets Characterized by Rational Speculative Bubbles?
119
r≤1 4.34 3.84 6.63 r=1 or r=2 4.34 3.84 6.63
Panel C: Cointegration between pt, dt and yt
r=0 30.11 29.80 35.46 r=0 or r=1 18.12 21.03 25.86
r≤1 11.99 15.49 19.94 r=1 or r=2 9.45 14.26 18.52
r≤2 2.54 3.84 6.63 r=2 or r=3 2.54 3.84 6.63
Singapore (value weight portfolio) sub-period, monthly (2002-2007)
H0 λtrace λ Trace statistics H0 λmax λ Max statistics
CV (5%) CV (1%) CV (5%) CV (1%)
Panel A: Cointegration between pt and dt
r=0 8.64 15.49 19.49 r=0 or r=1 8.30 14.26 18.52
r≤1 0.34 3.84 6.63 r=1 or r=2 0.34 3.84 6.63
Panel B: Cointegration between pt and yt
r=0 8.63 15.49 19.49 r=0 or r=1 8.63 14.26 18.52
r≤1 0.33 3.84 6.63 r=1 or r=2 0.33 3.84 6.63
Panel C: Cointegration between pt, dt and yt
r=0 18.54 29.80 35.46 r=0 or r=1 10.98 21.03 25.86
r≤1 7.56 15.49 19.94 r=1 or r=2 7.55 14.26 18.52
r≤2 0.02 3.84 6.63 r=2 or r=3 0.02 3.84 6.63
Singapore (value weight portfolio) sub-period, monthly (2008-2009)
H0 λtrace λ Trace statistics H0 λmax λ Max statistics
CV (5%) CV (1%) CV (5%) CV (1%)
Panel A: Cointegration between pt and dt
r=0 14.52 15.49 19.49 r=0 or r=1 11.63 14.26 18.52
r≤1 2.89 3.84 6.63 r=1 or r=2 2.89 3.84 6.63
Panel B: Cointegration between pt and yt
r=0 10.77 15.49 19.49 r=0 or r=1 9.21 14.26 18.52
r≤1 1.56 3.84 6.63 r=1 or r=2 1.56 3.84 6.63
Panel C: Cointegration between pt, dt and yt

Are Asian Stock Markets Characterized by Rational Speculative Bubbles?
120
r=0 26.00 29.80 35.46 r=0 or r=1 12.22 21.03 25.86
r≤1 13.78 15.49 19.94 r=1 or r=2 8.74 14.26 18.52
r≤2 5.04 3.84 6.63 r=2 or r=3 5.04 3.84 6.63
Notes:
(1) All variables are inflation adjusted. (2) pt, dt and yt denotes the log of monthly stock price indices, dividend and earnings
for value-weight portfolios from 1991-1997, respectively. (3) r denotes the number of cointegrating vectors. (4) The optimal lag lengths for VAR were chosen based on lag exclusion test and
Akaike’s Information Criteria. (5) H0 is the null hypothesis that there exist at most r cointegration vectors in the
system. (6) The cointegration tests are estimated under the assumption of trend in data and an
intercept but no trend in the cointegrating equation. (7) CV (5%) and CV (1%) are the critical values of the trace statistics and maximum
eigenvalue statistics for the cointegration tests.

Are Asian Stock Markets Characterized by Rational Speculative Bubbles?
121