are bilateral remittances countercyclical? implications for dutch disease and currency unions...
Post on 21-Dec-2015
220 views
TRANSCRIPT

1
Are Bilateral Are Bilateral Remittances Remittances
Countercyclical? Countercyclical? Implications for Dutch Disease and Implications for Dutch Disease and
Currency UnionsCurrency Unions
Jeffrey FrankelJeffrey FrankelHarpel Professor, Harvard Kennedy School, and CIDHarpel Professor, Harvard Kennedy School, and CID
Presented May 26, 2009, at a panel on Presented May 26, 2009, at a panel on “Macroeconomic Impacts of Migration and “Macroeconomic Impacts of Migration and
Remittances,”Remittances,” at conference on at conference on Immigration and Global Immigration and Global
Development: Research Lessons Development: Research Lessons on How Immigration and Remittances Affect on How Immigration and Remittances Affect
Prosperity Around the WorldProsperity Around the World,,co-hosted by Center for International Development at co-hosted by Center for International Development at
Harvard University Harvard University and the Center for Global Development in Washington DC.and the Center for Global Development in Washington DC.
2
Importance of Importance of remittancesremittances
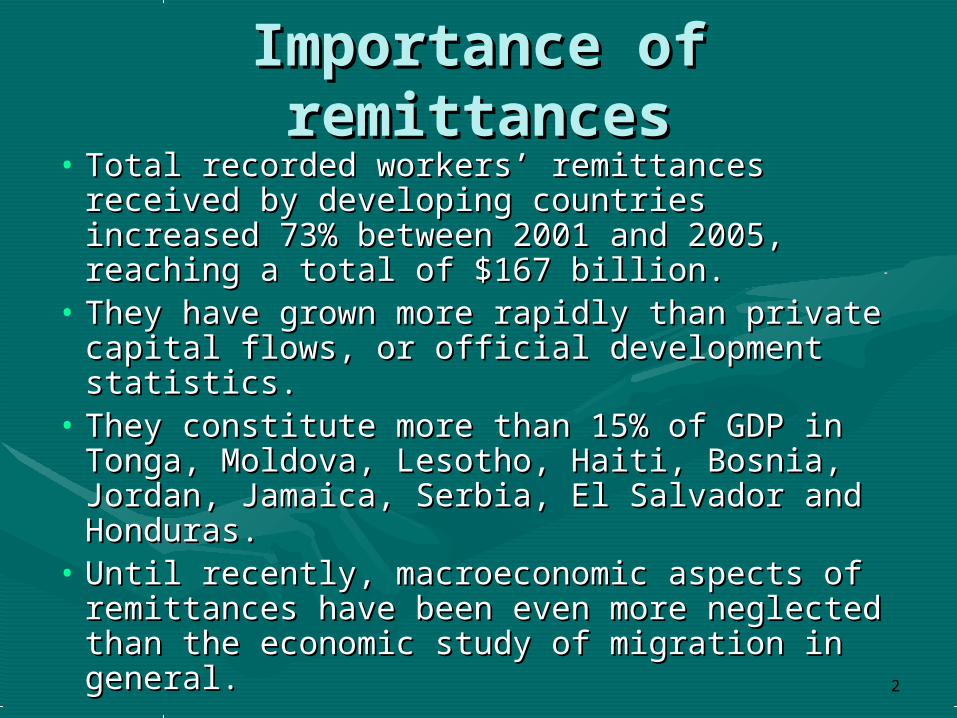
• Total recorded workers’ remittances received Total recorded workers’ remittances received by developing countries increased 73% by developing countries increased 73% between 2001 and 2005, reaching a total of between 2001 and 2005, reaching a total of $167 billion.$167 billion.
• They have grown more rapidly than private They have grown more rapidly than private capital flows, or official development statistics. capital flows, or official development statistics.
• They constitute more than 15% of GDP in They constitute more than 15% of GDP in Tonga, Moldova, Lesotho, Haiti, Bosnia, Tonga, Moldova, Lesotho, Haiti, Bosnia, Jordan, Jamaica, Serbia, El Salvador and Jordan, Jamaica, Serbia, El Salvador and Honduras. Honduras.
• Until recently, macroeconomic aspects of Until recently, macroeconomic aspects of remittances have been even more neglected remittances have been even more neglected than the economic study of migration in than the economic study of migration in general.general.

3
Hypothesis: Remittances can Hypothesis: Remittances can play play
the stabilizing role that the stabilizing role that capital flowscapital flows
are in theory supposed to playare in theory supposed to play• In theory, In theory, capital flowscapital flows should should bring a variety of benefitsbring a variety of benefits: : – smoothing short-term income smoothing short-term income
disturbances,disturbances,– financing high-return investment financing high-return investment
opportunities in low K/L countriesopportunities in low K/L countries•and so substituting for labor flows to and so substituting for labor flows to
high K/L countries or factor-based trade, high K/L countries or factor-based trade, – and disciplining policies and and disciplining policies and
institutions in the recipient country.institutions in the recipient country.

4
•In practice, however, capital flows fail In practice, however, capital flows fail to deliver on this promise:to deliver on this promise:– Rather, private capital flows are often Rather, private capital flows are often
procyclicalprocyclical::
• pouring in during boom times and disappearing in pouring in during boom times and disappearing in recessions. recessions.
• Commodity-producer procyclicality: part of the Dutch Commodity-producer procyclicality: part of the Dutch Disease. Disease.
– Rather than flowing on average from high K/L Rather than flowing on average from high K/L countries to low, capital often “flows uphill.”countries to low, capital often “flows uphill.”
– Rather than rewarding countries that follow Rather than rewarding countries that follow sound economic policies, financial markets sound economic policies, financial markets often abet irresponsible budget deficits, often abet irresponsible budget deficits, • including among autocratic and kleptocratic rulers.including among autocratic and kleptocratic rulers.
5
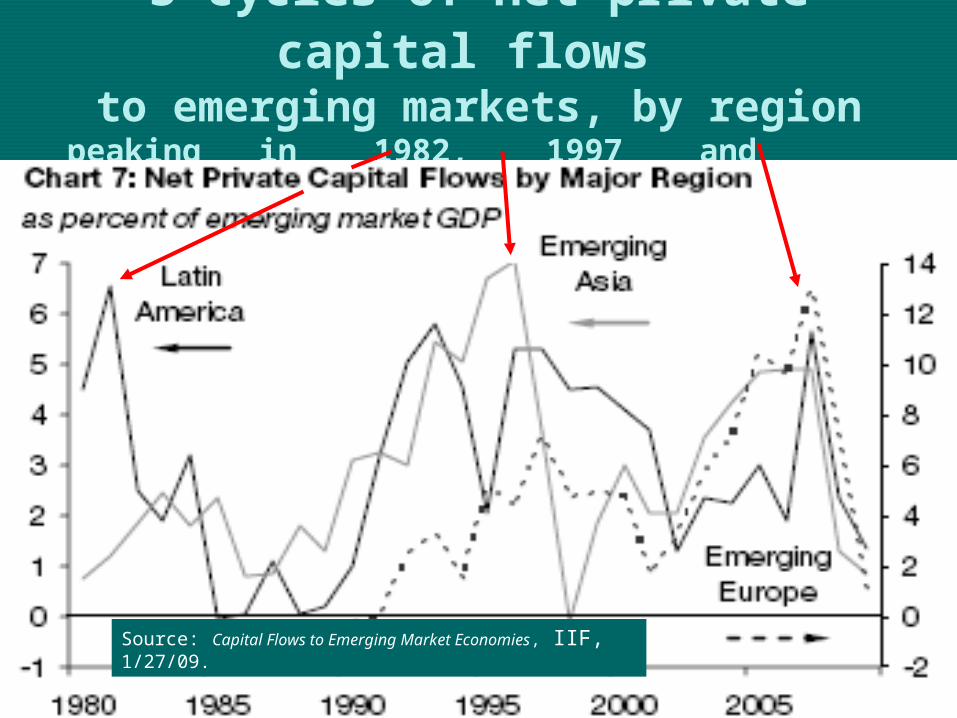
3 cycles of net private capital flows
to emerging markets, by regionpeaking in 1982, 1997 and 2008
Source: Capital Flows to Emerging Market Economies, IIF, 1/27/09.
6
Brief summaryBrief summaryof remittances literatureof remittances literature
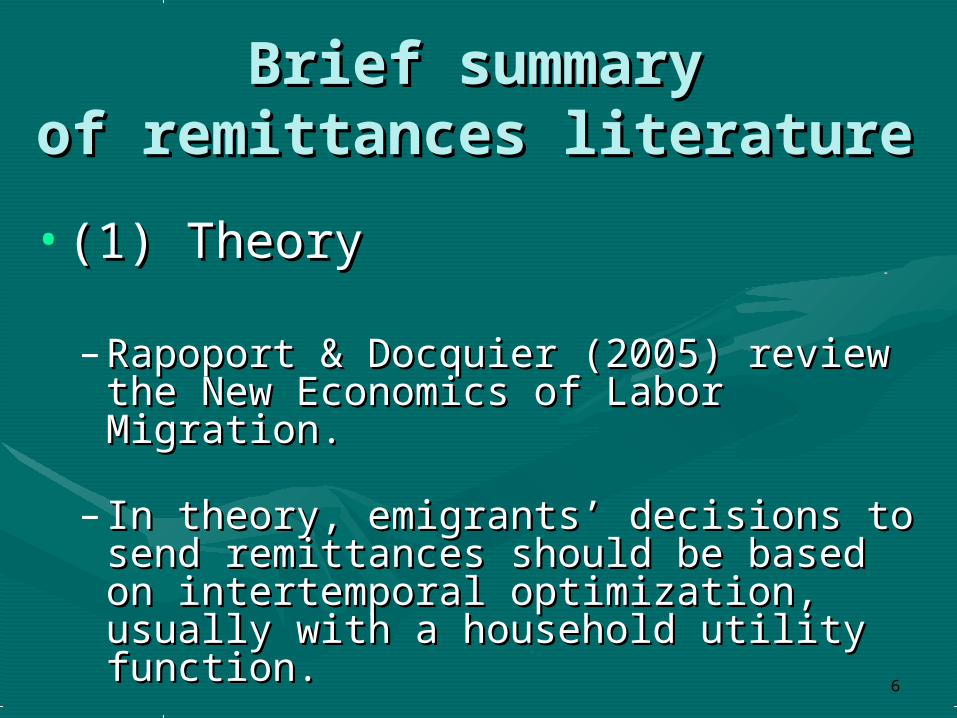
•(1) Theory(1) Theory
– Rapoport & Docquier (2005) review Rapoport & Docquier (2005) review the New Economics of Labor the New Economics of Labor Migration.Migration.
– In theory, emigrants’ decisions to In theory, emigrants’ decisions to send remittances should be based on send remittances should be based on intertemporal optimization, usually intertemporal optimization, usually with a household utility function.with a household utility function.
7
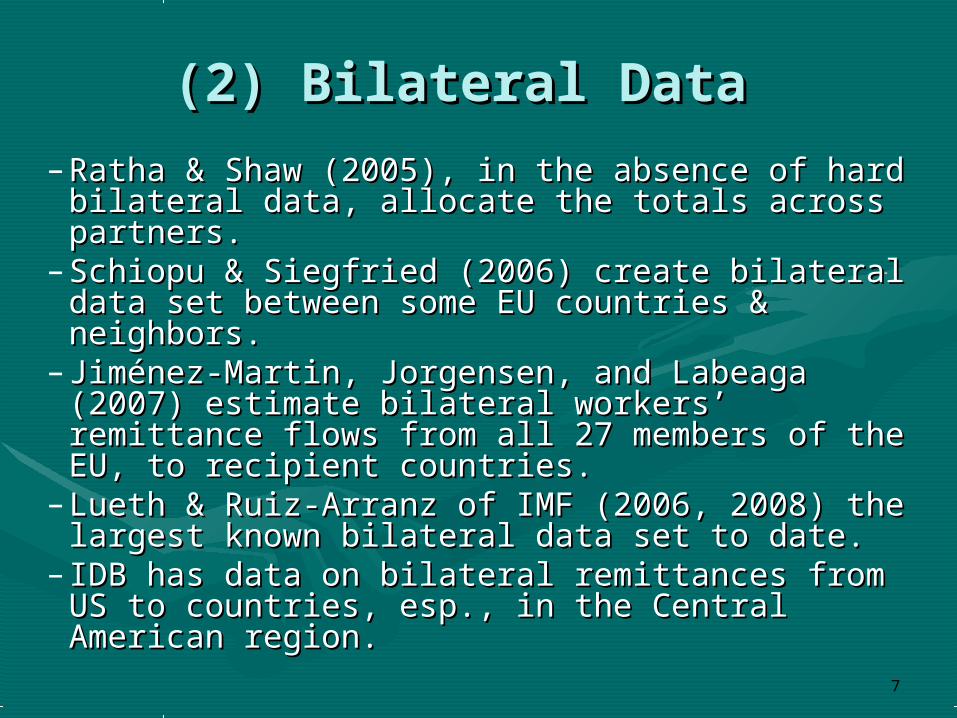
(2) Bilateral Data(2) Bilateral Data – Ratha & Shaw (2005), in the absence of hard Ratha & Shaw (2005), in the absence of hard
bilateral data, allocate the totals across bilateral data, allocate the totals across partners.partners.
– Schiopu & Siegfried (2006) create bilateral Schiopu & Siegfried (2006) create bilateral data set between some EU countries & data set between some EU countries & neighbors.neighbors.
– Jiménez-Martin, Jorgensen, and Labeaga Jiménez-Martin, Jorgensen, and Labeaga (2007) estimate bilateral workers’ remittance (2007) estimate bilateral workers’ remittance flows from all 27 members of the EU, to flows from all 27 members of the EU, to recipient countries. recipient countries.
– Lueth & Ruiz-Arranz of IMF (2006, 2008) the Lueth & Ruiz-Arranz of IMF (2006, 2008) the largest known bilateral data set to date.largest known bilateral data set to date.
– IDB has data on bilateral remittances from US IDB has data on bilateral remittances from US to countries, esp., in the Central American to countries, esp., in the Central American region.region.
8
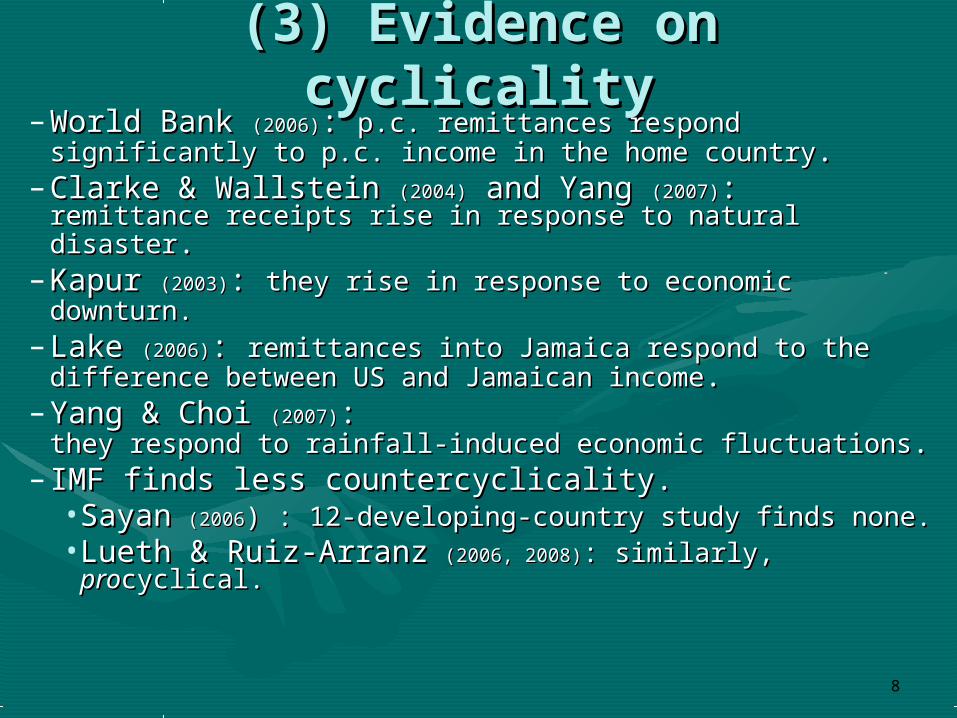
(3) Evidence on cyclicality(3) Evidence on cyclicality– World Bank World Bank (2006)(2006): : p.c. remittances respond p.c. remittances respond
significantly to p.c. income in the home countrysignificantly to p.c. income in the home country..– Clarke & Wallstein Clarke & Wallstein (2004)(2004) and Yang and Yang (2007)(2007)::
remittance receipts rise in response to natural disasterremittance receipts rise in response to natural disaster. .
– Kapur Kapur (2003)(2003): : they rise in response to economic they rise in response to economic downturn.downturn.
– Lake Lake (2006)(2006): : remittances into Jamaica respond to the remittances into Jamaica respond to the difference between US and Jamaican incomedifference between US and Jamaican income..
– Yang & Choi Yang & Choi (2007)(2007): : they respond to rainfall-induced economic fluctuationsthey respond to rainfall-induced economic fluctuations..
– IMF finds less countercyclicality.IMF finds less countercyclicality.•SayanSayan (2006(2006) : 12-developing-country study finds none.) : 12-developing-country study finds none.•Lueth & Ruiz-ArranzLueth & Ruiz-Arranz (2006, 2008)(2006, 2008): similarly, : similarly,
proprocyclical.cyclical.

9
(4) Why does the question (4) Why does the question of remittance cyclicality of remittance cyclicality
matter?matter?• (i) It is especially important because (i) It is especially important because
governments in remittance-receiving governments in remittance-receiving countries often reflexively treat them as a countries often reflexively treat them as a source of foreign exchange to be source of foreign exchange to be “harnessed” for national development, “harnessed” for national development, – rather than letting recipients spend it on rather than letting recipients spend it on
“unproductive” uses such as imports of “unproductive” uses such as imports of consumer goods. consumer goods.
– This thinking is common even among This thinking is common even among benevolent governments, let alone the benevolent governments, let alone the rhetoric of kleptocracies. rhetoric of kleptocracies.

10
Applicability, Applicability, continuedcontinued
• (ii) The Dutch Disease.(ii) The Dutch Disease.– On the one hand, Martin (1990): On the one hand, Martin (1990):
steady flow of remittances can undermine the steady flow of remittances can undermine the incentive for governments to create a sound incentive for governments to create a sound institutional framework,institutional framework,– a sort of natural resource curse for – a sort of natural resource curse for remittances. remittances.
– Amuendo-Dorantes & Pozo (2004): Amuendo-Dorantes & Pozo (2004): a rise in remittances to LACA countries leads a rise in remittances to LACA countries leads to real appreciation, a prime symptom of Dutch to real appreciation, a prime symptom of Dutch Disease.Disease.
– On the other hand, Rajan & Subramanian On the other hand, Rajan & Subramanian (2005): although the Dutch Disease analogy (2005): although the Dutch Disease analogy does extend to foreign aid (leading to real does extend to foreign aid (leading to real appreciation & slow growth), it does appreciation & slow growth), it does notnot extend to remittances.extend to remittances.

11
Applicability, Applicability, concludedconcluded• (iii) Optimum Currency Area criterion(iii) Optimum Currency Area criterion
– The OCA question:The OCA question:• For what countries do the benefits of adopting a For what countries do the benefits of adopting a
common currency outweigh the costs? common currency outweigh the costs? – e.g., facilitating trade & other international transactionse.g., facilitating trade & other international transactions– Vs. losing the freedom to run one’s own monetary policy.Vs. losing the freedom to run one’s own monetary policy.
– The textbook answer:The textbook answer:• A country with few asymmetric shocks, so it seldom A country with few asymmetric shocks, so it seldom
needs a monetary policy different from that of the needs a monetary policy different from that of the anchor country; oranchor country; or
• A country that has cushions against asymmetric A country that has cushions against asymmetric shocks: shocks: labor mobility, fiscal transfers, capital flows...labor mobility, fiscal transfers, capital flows...
– My claim: remittances belong on the list My claim: remittances belong on the list • assuming countercyclicality.assuming countercyclicality.
– Singer (2008): remittances are, and should be, Singer (2008): remittances are, and should be,
a determinant of the currency decision.a determinant of the currency decision.
12
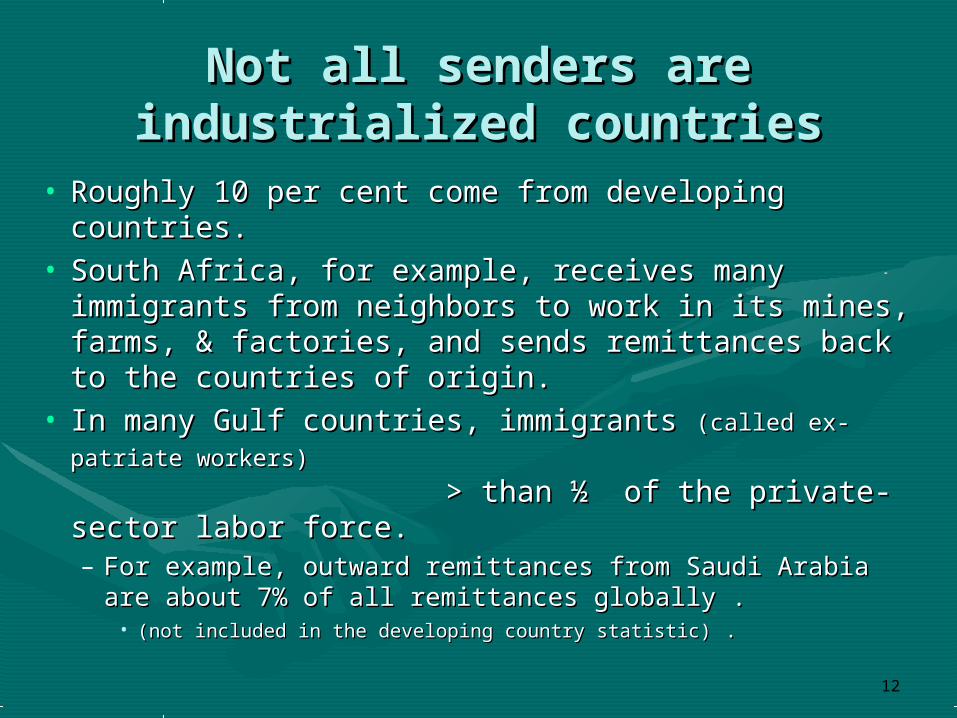
Not all senders are Not all senders are industrialized countriesindustrialized countries
• Roughly 10 per cent come from developing Roughly 10 per cent come from developing countries. countries.
• South Africa, for example, receives many South Africa, for example, receives many immigrants from neighbors to work in its mines, immigrants from neighbors to work in its mines, farms, & factories, and sends remittances back to farms, & factories, and sends remittances back to the countries of origin. the countries of origin.
• In many Gulf countries, immigrants In many Gulf countries, immigrants (called ex-patriate (called ex-patriate
workers)workers) > than ½ of the private-sector labor > than ½ of the private-sector labor force. force. – For example, outward remittances from Saudi Arabia are For example, outward remittances from Saudi Arabia are
about 7% of all remittances globally .about 7% of all remittances globally .• (not included in the developing country statistic)(not included in the developing country statistic) . .

13
The hypothesis is that The hypothesis is that remittances respond not just remittances respond not just
inversely to income inversely to income in the receiving country, but in the receiving country, but
also positively to sending-also positively to sending-country income.country income.• One would need to control for sender-country One would need to control for sender-country
income even if only the coefficient of income even if only the coefficient of recipient-country income were of interest.recipient-country income were of interest.– It should be in the equation in theory.It should be in the equation in theory.– Omitting it in practice often produces the wrong Omitting it in practice often produces the wrong
sign.sign.
• But cyclicality with respect to sender-country But cyclicality with respect to sender-country income is also of interest in its own right:income is also of interest in its own right:

14
South Africa and the Gulf are South Africa and the Gulf are two places where the Dutch two places where the Dutch
Disease and OCA motivations Disease and OCA motivations are particularly relevant.are particularly relevant.
• When mineral proces are low, it is useful to When mineral proces are low, it is useful to South Africa to have the “unilateral South Africa to have the “unilateral transfers” deficit in the balance of transfers” deficit in the balance of payments automatically moderate.payments automatically moderate.
• When mineral prices are When mineral prices are high high (e.g. 2003-(e.g. 2003-
2008),2008), outward remittances provide a brake outward remittances provide a brake on reserve inflows and inflation – a on reserve inflows and inflation – a particularly important point in these two particularly important point in these two regions debating regional monetary unions.regions debating regional monetary unions.
15
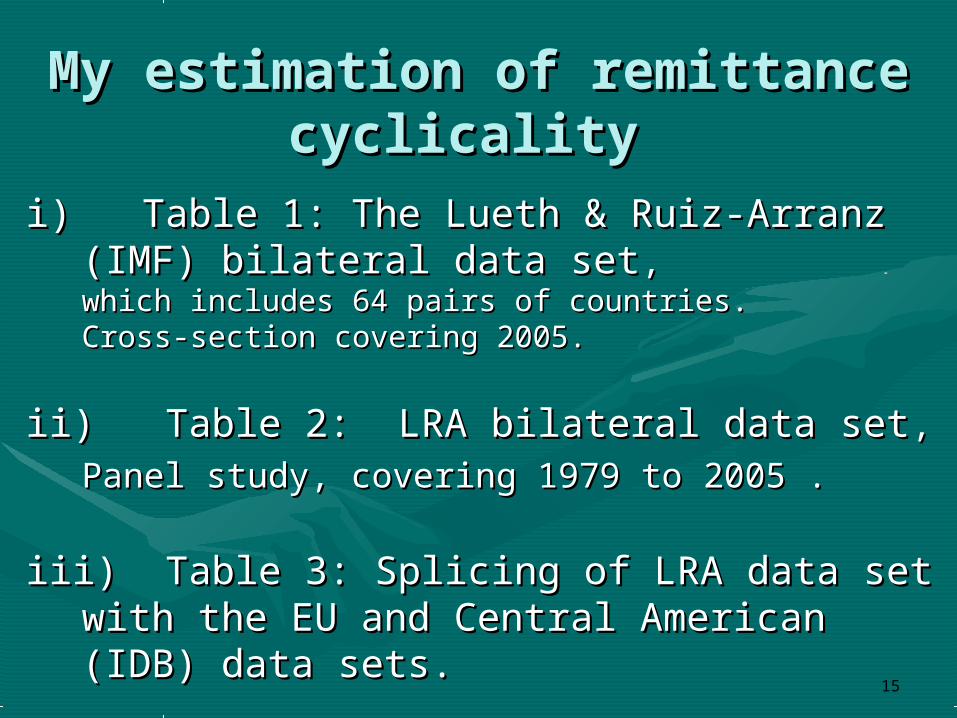
My estimation of remittance My estimation of remittance cyclicality cyclicality
i) Table 1: The Lueth & Ruiz-Arranz i) Table 1: The Lueth & Ruiz-Arranz (IMF) bilateral data set(IMF) bilateral data set, , which includes 64 pairs of countries. which includes 64 pairs of countries. Cross-section covering 2005.Cross-section covering 2005.
ii) Table 2: LRA bilateral data setii) Table 2: LRA bilateral data set, ,
Panel study, covering 1979 to 2005 .Panel study, covering 1979 to 2005 .
iii) Table 3: Splicing of LRA data set with iii) Table 3: Splicing of LRA data set with the EU and Central American (IDB) the EU and Central American (IDB) data sets.data sets.
16
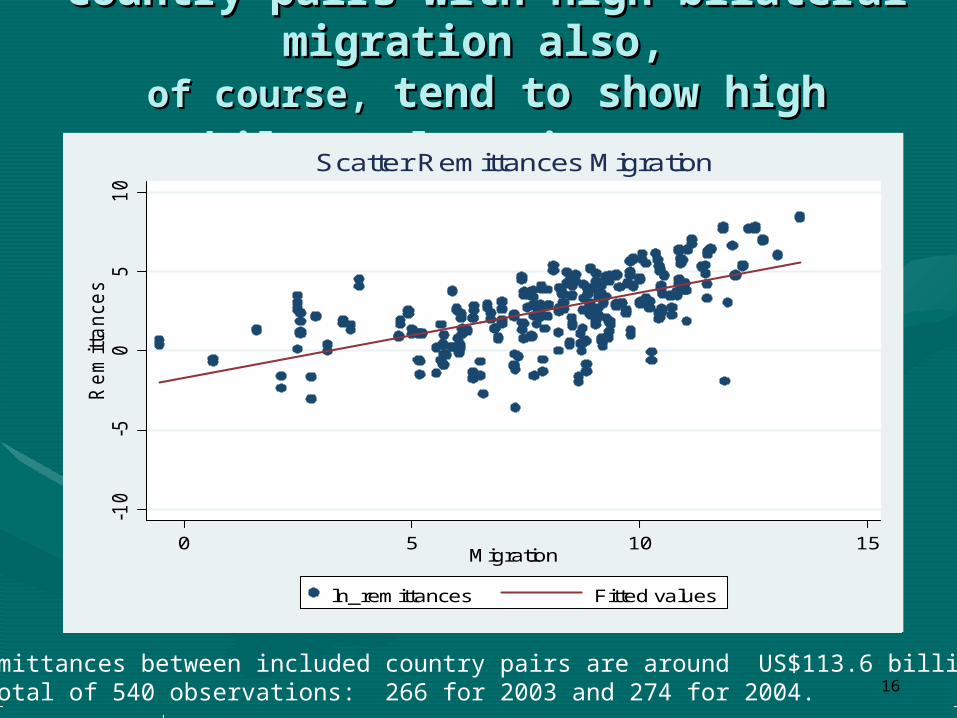
Country-pairs with high bilateral Country-pairs with high bilateral migration also, migration also,
of course, of course, tend to show high bilateral tend to show high bilateral remittancesremittances..
Remittances between included country pairs are around US$113.6 billion. Total of 540 observations: 266 for 2003 and 274 for 2004.
-10
-50
510
Re
mitta
nce
s
0 5 10 15Migration
ln_remittances Fitted values
Scatter Remittances Migration
17
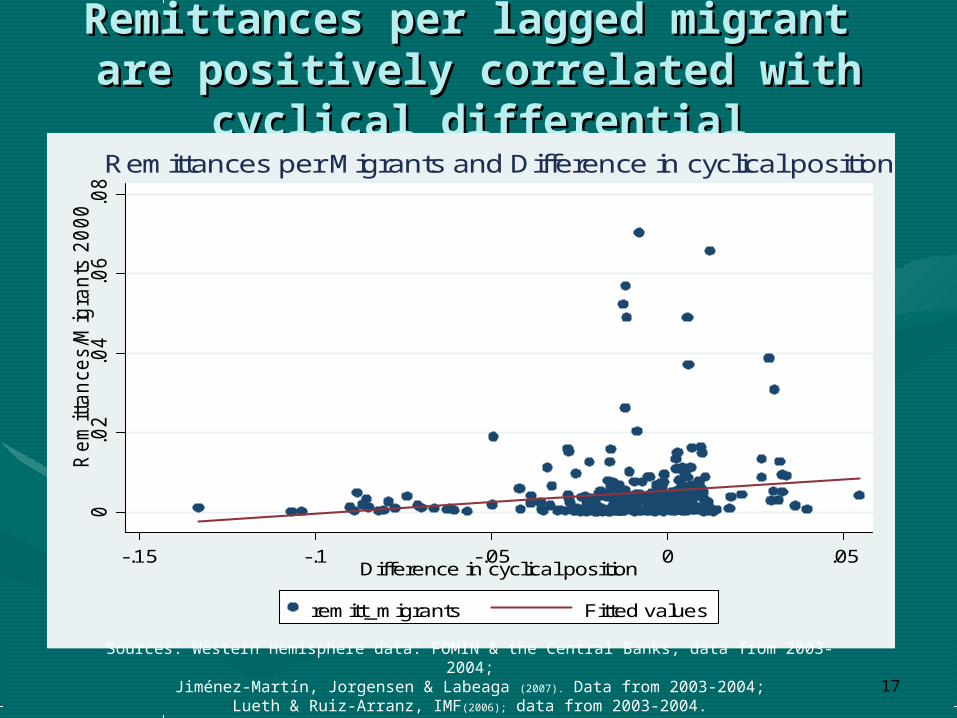
Remittances per lagged migrant Remittances per lagged migrant are positively correlated with are positively correlated with
cyclical differentialcyclical differential0
.02
.04
.06
.08
Rem
itta
nces/M
igra
nts
20
00
-.15 -.1 -.05 0 .05Difference in cyclical position
remitt_migrants Fitted values
Remittances per Migrants and Difference in cyclical position
Sources: Western Hemisphere data: FOMIN & the Central Banks, data from 2003-2004;Jiménez-Martín, Jorgensen & Labeaga (2007). Data from 2003-2004;
Lueth & Ruiz-Arranz, IMF(2006); data from 2003-2004.
18
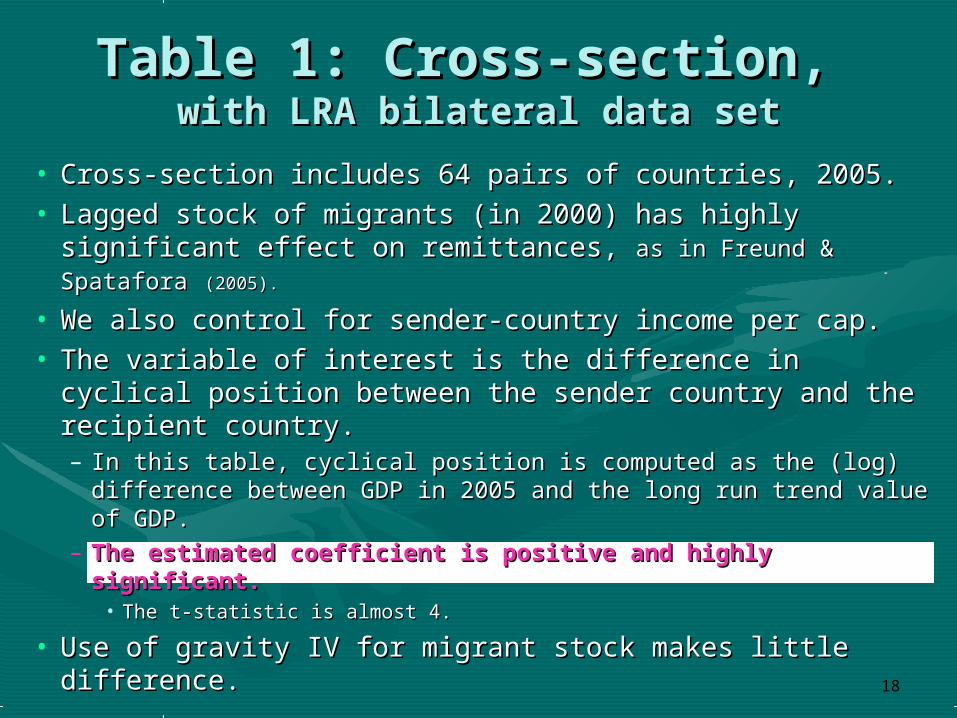
Table 1: Cross-section, Table 1: Cross-section, with LRA bilateral data setwith LRA bilateral data set
• Cross-section includes 64 pairs of countries, 2005.Cross-section includes 64 pairs of countries, 2005.• Lagged stock of migrants (in 2000) has highly significant Lagged stock of migrants (in 2000) has highly significant
effect on remittances, effect on remittances, as in Freund & Spataforaas in Freund & Spatafora (2005).(2005). • We also control for sender-country income per cap.We also control for sender-country income per cap.• The variable of interest is the difference in cyclical The variable of interest is the difference in cyclical
position between the sender country and the recipient position between the sender country and the recipient country. country. – In this table, cyclical position is computed as the (log) In this table, cyclical position is computed as the (log)
difference between GDP in 2005 and the long run trend value of difference between GDP in 2005 and the long run trend value of GDP. GDP.
– The estimated coefficient is positive and highly The estimated coefficient is positive and highly significant.significant. • The t-statistic is almost 4. The t-statistic is almost 4.
• Use of gravity IV for migrant stock makes little Use of gravity IV for migrant stock makes little difference.difference.
19
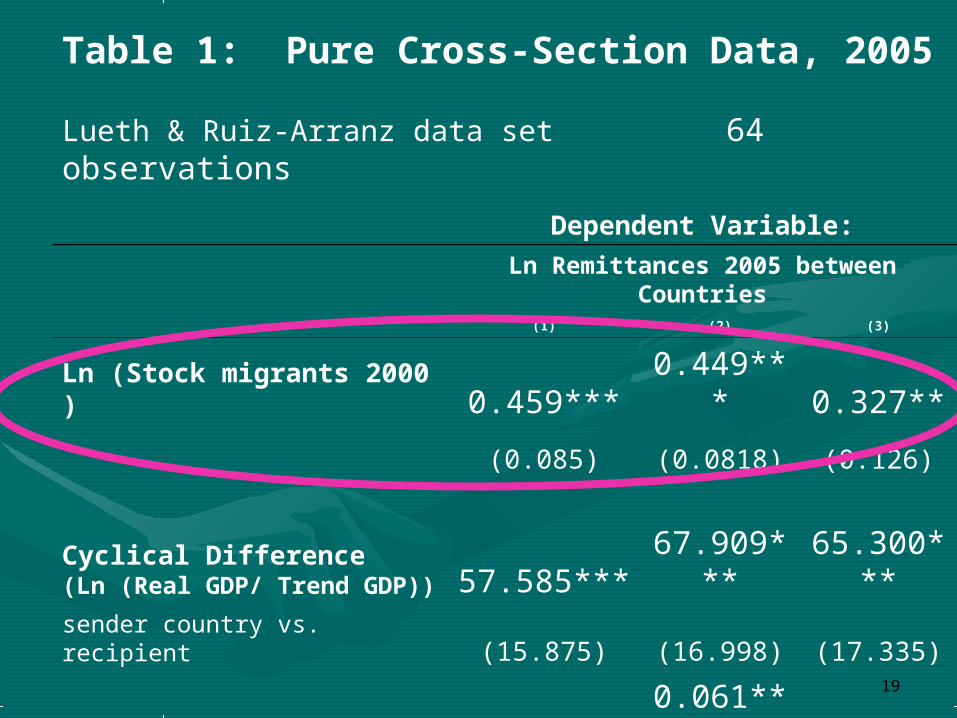
Table 1: Pure Cross-Section Data, 2005 Lueth & Ruiz-Arranz data set 64 observations
Dependent Variable: Ln Remittances 2005 between Countries (1) (2) (3)
Ln (Stock migrants 2000 ) 0.459*** 0.449*** 0.327**
(0.085) (0.0818) (0.126)
Cyclical Difference (Ln (Real GDP/ Trend GDP)) 57.585*** 67.909***
65.300***
sender country vs. recipient (15.875) (16.998) (17.335)
Sender GDP per capita 0.061*** 0.062**
(0.023) (0.024)Estimation Method OLS OLS 2SLS
R2 0.373 0.448 0.4259
20
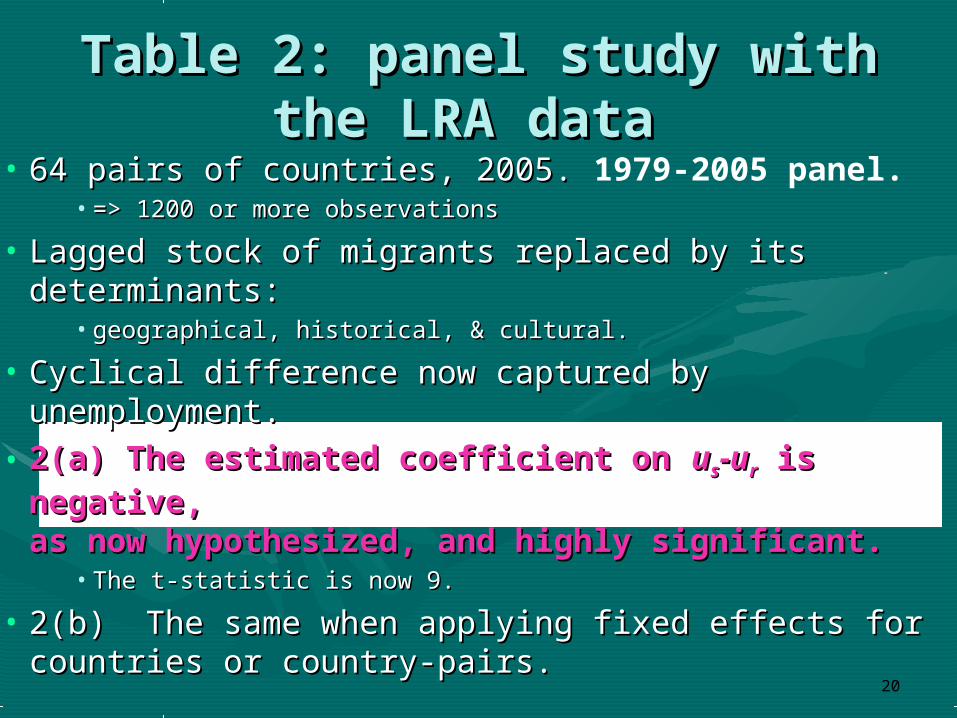
Table 2: panel study with the Table 2: panel study with the LRA data LRA data
• 64 pairs of countries, 2005. 64 pairs of countries, 2005. 1979-2005 panel. • => 1200 or more observations=> 1200 or more observations
• Lagged stock of migrants replaced by its Lagged stock of migrants replaced by its determinants:determinants:
• geographical, historical, & cultural.geographical, historical, & cultural.
• Cyclical difference now captured by unemployment.Cyclical difference now captured by unemployment.
• 2(a) The estimated coefficient on 2(a) The estimated coefficient on uuss-u-urr is is negative, negative, as now hypothesized, and highly significant.as now hypothesized, and highly significant.
• The t-statistic is now 9.The t-statistic is now 9.
• 2(b) The same when applying fixed effects for 2(b) The same when applying fixed effects for countries or country-pairs.countries or country-pairs.
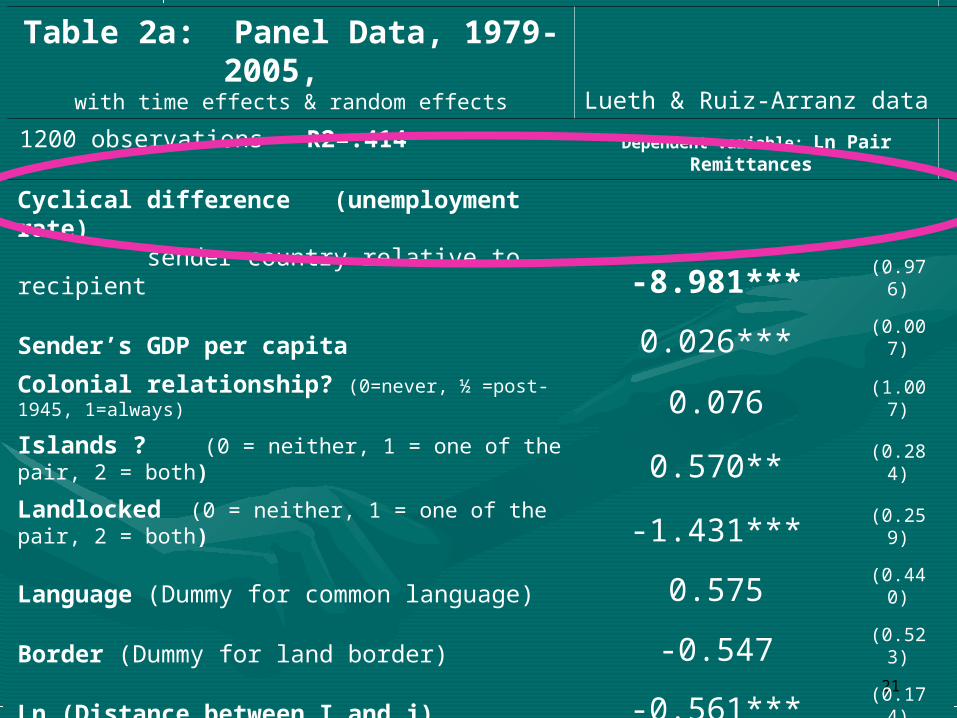
21
Table 2a: Panel Data, 1979-2005,
with time effects & random effects Lueth & Ruiz-Arranz data
1200 observations R2=.414
Dependent variable: Ln Pair Remittances
Cyclical difference (unemployment rate) sender country relative to recipient -8.981*** (0.976)
Sender’s GDP per capita 0.026*** (0.007)
Colonial relationship? (0=never, ½ =post-1945, 1=always) 0.076 (1.007)
Islands ? (0 = neither, 1 = one of the pair, 2 = both) 0.570** (0.284)
Landlocked (0 = neither, 1 = one of the pair, 2 = both) -1.431*** (0.259)
Language (Dummy for common language) 0.575 (0.440)
Border (Dummy for land border) -0.547 (0.523)
Ln (Distance between I and j) -0.561*** (0.174)
Ln (Product Population i and j) 0.609*** (0.078)
22
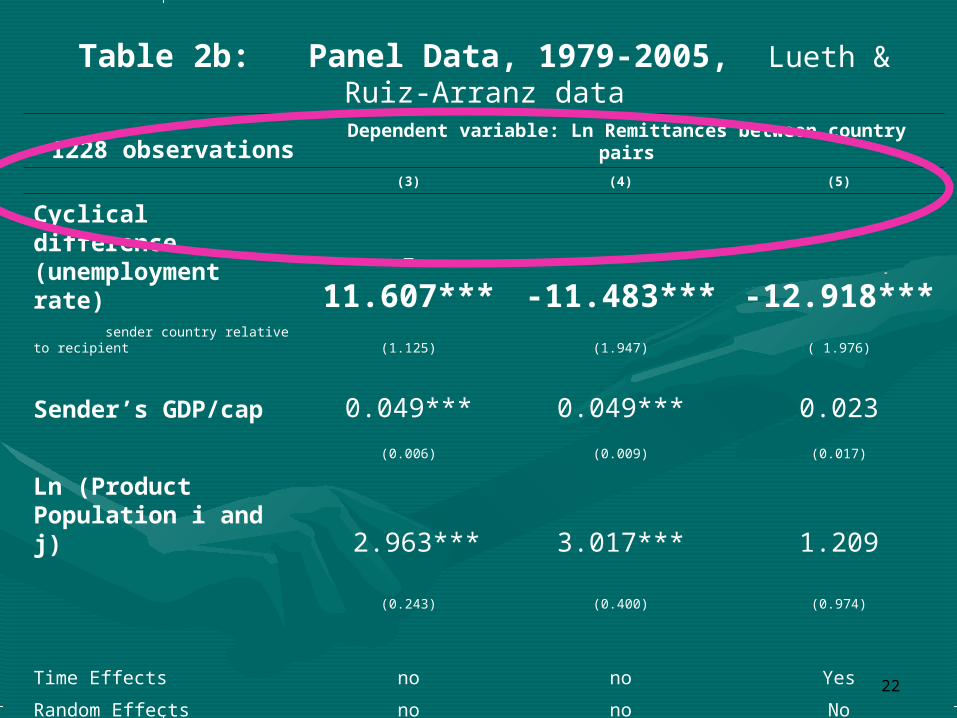
Table 2b: Panel Data, 1979-2005, Lueth & Ruiz-Arranz data 1228 observations Dependent variable: Ln Remittances between country pairs
(3) (4) (5)
Cyclical difference
(unemployment rate) -11.607*** -11.483*** -12.918*** sender country relative to recipient (1.125) (1.947) ( 1.976)
Sender’s GDP/cap 0.049*** 0.049*** 0.023
(0.006) (0.009) (0.017)
Ln (Product Population i and j) 2.963*** 3.017*** 1.209
(0.243) (0.400) (0.974)
Time Effects no no Yes
Random Effects no no No
Fixed Effects for Countries yes no No
Fixed Effects for Country Pair no yes Yes
R2 0.696 0.304 0.331
Constants not reported. Standard errors in parenthesis. Significance * 10% level, ** 5% level, & *** 1% level
23
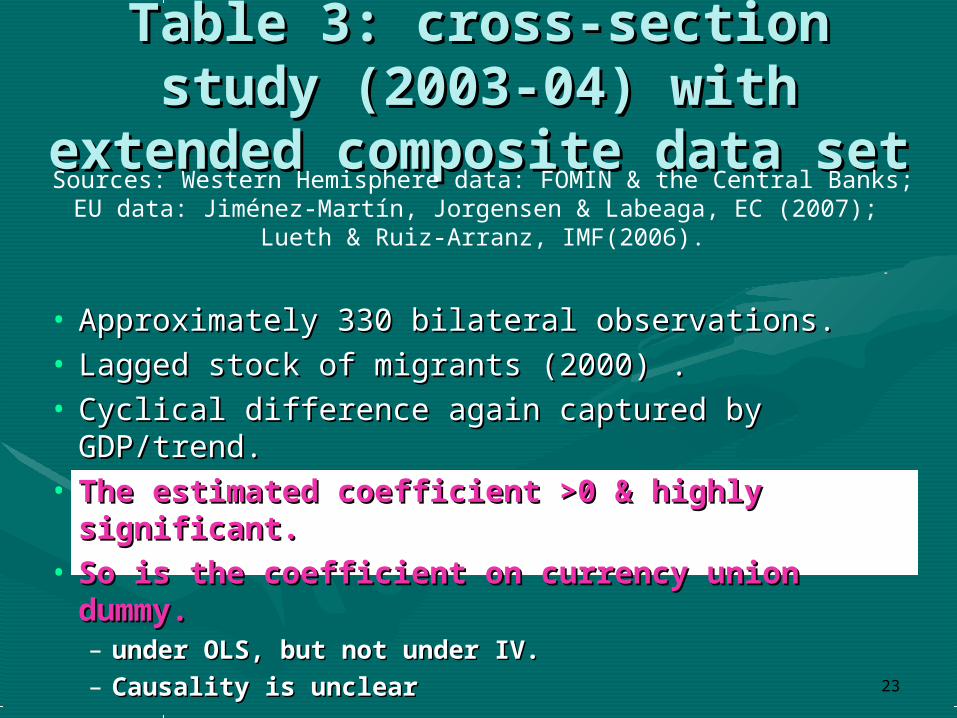
Table 3: cross-section study Table 3: cross-section study (2003-04) with extended (2003-04) with extended
composite data set composite data set
• Approximately 330 bilateral observations.Approximately 330 bilateral observations.• Lagged stock of migrants (2000) .Lagged stock of migrants (2000) .• Cyclical difference again captured by GDP/trend.Cyclical difference again captured by GDP/trend.• The estimated coefficient >0 & highly The estimated coefficient >0 & highly
significant.significant.• So is the coefficient on currency union So is the coefficient on currency union
dummy.dummy.– under OLS, but not under IV.under OLS, but not under IV.– Causality is unclearCausality is unclear
Sources: Western Hemisphere data: FOMIN & the Central Banks;EU data: Jiménez-Martín, Jorgensen & Labeaga, EC (2007);
Lueth & Ruiz-Arranz, IMF(2006).
24
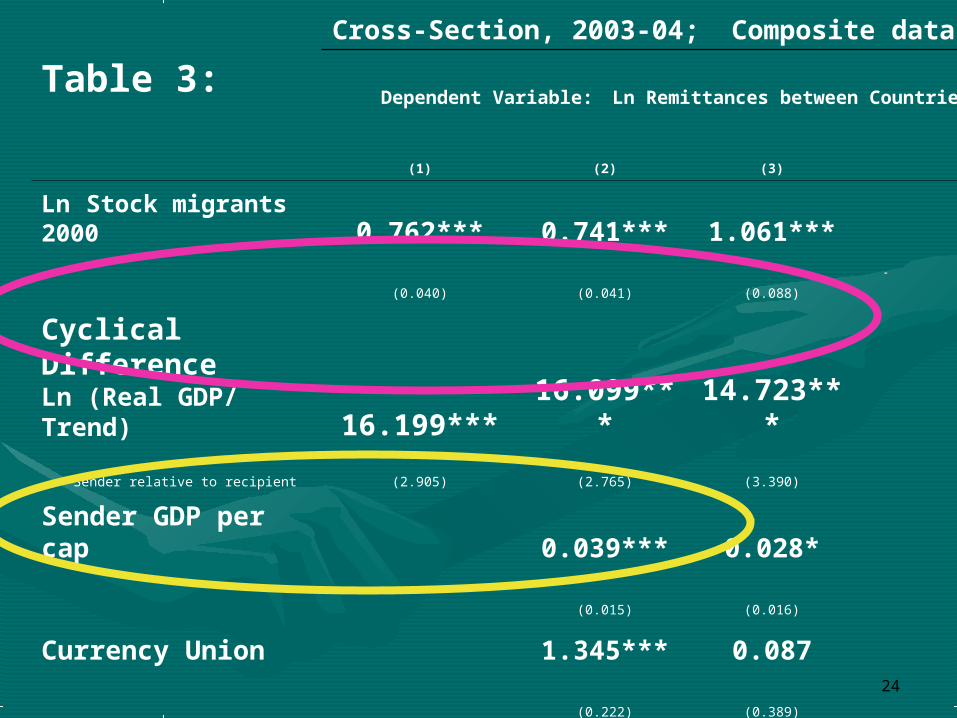
Table 3:
Cross-Section, 2003-04; Composite data set
Dependent Variable: Ln Remittances between Countries
(1) (2) (3)
Ln Stock migrants 2000 0.762*** 0.741*** 1.061***
(0.040) (0.041) (0.088)
Cyclical Difference Ln (Real GDP/ Trend) 16.199*** 16.099*** 14.723***
Sender relative to recipient (2.905) (2.765) (3.390)
Sender GDP per cap 0.039*** 0.028*
(0.015) (0.016)
Currency Union 1.345*** 0.087
(0.222) (0.389)
Estimation Method OLS OLS 2SLS
Instrumental variables
border/language/islands/colonial
Observations 331 328 328
R2 0.526 0.546 0.463
Statistical significance: * 10% level, ** 5% level, *** 1% levelThree sources of remittance data for 2003-04: Central America data; EU data; IMF data: Lueth & Ruiz-Arranz.

25
To summarize the findings,
• splicing together a larger bilateral data set from three data sets used by others,
• has allowed a moderately strong verdict on the question of cyclicality.
• It runs contrary to the analogy with capital flows /the Dutch Disease:
• Remittances respond positively to the cyclical position in the sending country and negatively to the cyclical position in the receiving country.
26
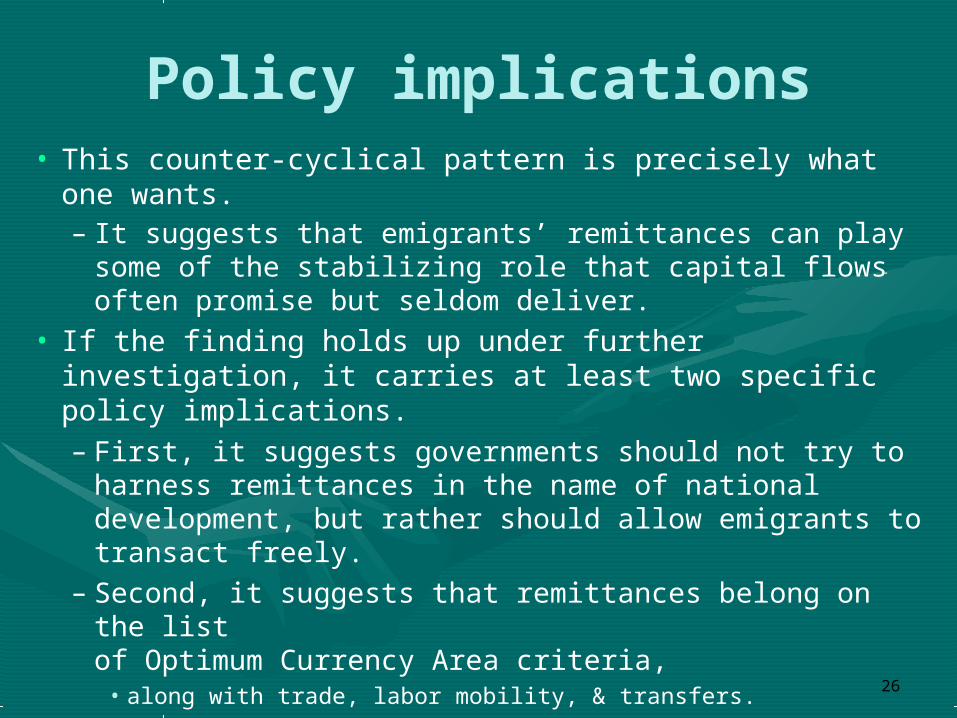
Policy implications• This counter-cyclical pattern is precisely what one
wants. – It suggests that emigrants’ remittances can play
some of the stabilizing role that capital flows often promise but seldom deliver.
• If the finding holds up under further investigation, it carries at least two specific policy implications. – First, it suggests governments should not try to
harness remittances in the name of national development, but rather should allow emigrants to transact freely.
– Second, it suggests that remittances belong on the list of Optimum Currency Area criteria, • along with trade, labor mobility, & transfers.

27
AcknowledgementsAcknowledgements
• I wish to thank Olga Romero for dedicated I wish to thank Olga Romero for dedicated research assistance; research assistance;
• Erik Lueth and Marta Ruiz-Arranz for Erik Lueth and Marta Ruiz-Arranz for generously making data available, generously making data available,
• Maurice Kugler & Hillel Rapoport for Maurice Kugler & Hillel Rapoport for comments; comments;
• and Robert Hildreth, and Robert Hildreth, the Center for International Development, the Center for International Development, and the MacArthur Foundation for support.and the MacArthur Foundation for support.

Jeffrey FrankelJames W. Harpel Professor of Capital Formation &
GrowthHarvard Kennedy School
http://ksghome.harvard.edu/~jfrankel/index.htm
Blog: http://content.ksg.harvard.edu/blog/jeff_frankels_weblog/
29
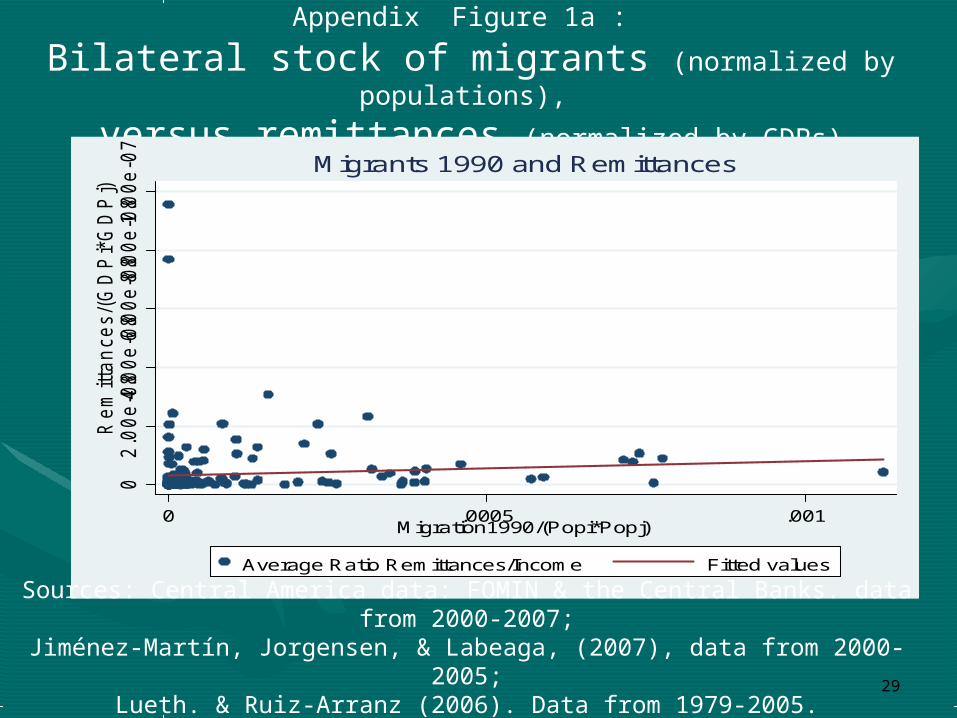
Appendix Figure 1a : Bilateral stock of migrants (normalized by populations),
versus remittances (normalized by GDPs)
02
.00e
-08
4.0
0e
-08
6.0
0e
-08
8.0
0e
-08
1.0
0e
-07
Rem
itta
nces/(
GD
Pi*
GD
Pj)
0 .0005 .001Migration1990/(Popi*Popj)
Average Ratio Remittances/Income Fitted values
Migrants 1990 and Remittances
Sources: Central America data: FOMIN & the Central Banks. data from 2000-2007;Jiménez-Martín, Jorgensen, & Labeaga, (2007), data from 2000-2005;
Lueth. & Ruiz-Arranz (2006). Data from 1979-2005.
30
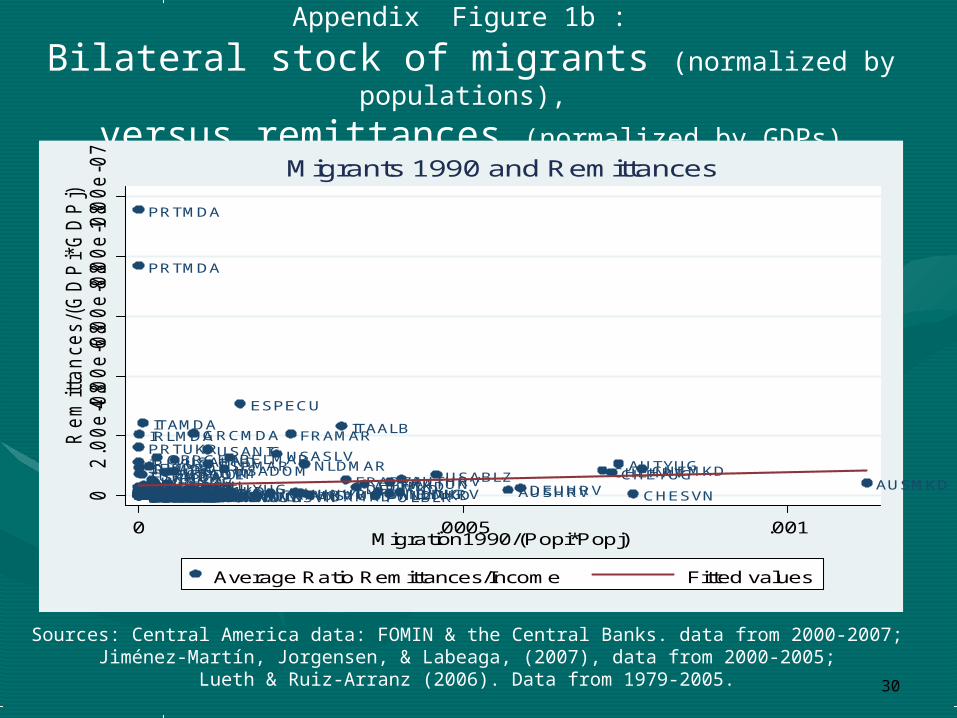
Appendix Figure 1b : Bilateral stock of migrants (normalized by populations),
versus remittances (normalized by GDPs)
Sources: Central America data: FOMIN & the Central Banks. data from 2000-2007;Jiménez-Martín, Jorgensen, & Labeaga, (2007), data from 2000-2005;
Lueth & Ruiz-Arranz (2006). Data from 1979-2005.
USABLZUSACRI
USADOMUSASLV
USAGTMUSAHND
USANIC
USAPANBELCOLBELECUBELISR
BELMAR
BELPERBELTUNFRADZA
FRAMAR
FRATUNDEULBNDEUMARDEUTUNDEUUKRGRCBLRGRCEGYGRCISRGRCJORGRCLBNGRCUKRHUNISRHUNUKRIRLBLRIRLBRA
IRLMDA
IRLUKR
ITAALB
ITAARGITABRAITACOLITAECUITAEGYITAMARITAPERITAUKRITAVEN
NLDMAR
POLBLRPOLSYRPRTBRAPRTGEO
PRTMDA
PRTMAR
PRTUKR
PRTVENESPARG
ESPBOL
ESPBRAESPBGR
ESPCOLESPDOM
ESPECU
ESPMAR
ESPPERESPROMESPUSAGBRBGD
GBRCHN
GBRGHA
GBRNGAGBRPAK AUSHRVAUSMKD
AUSSVNAUSTHAAUSPHL AUSYUGAUTHRVAUTMKDAUTMDAAUTSVNAUTPHL
AUTYUG
BELHRVBELMKDBELSVNBELPHL CANHRVCANMKDCANYUGCANSVNCANPHLDNKHRVDNKMKDDNKTHADNKPHLFRAHRVFRAKAZFRAMKDFRAMDAFRAYUGFRASVNFRAPHL DEUHRVDEUKAZDEUMKDDEUMDADEUYUG
DEUSVNDEUTHADEUPHLGRCMKD
GRCMDA
GRCYUGGRCPHL HUNHRVHUNYUG
HUNSVNIRLHRV
IRLMDA
IRLYUG
IRLPHLITAHRVITAMKD
ITAMDA
ITAYUGITASVNITAPHLJPNIDNJPNKAZJPNTHAJPNPHLPRK/KORIDNPRK/KORKAZPRK/KORTHAPRK/KORPHLLUXHRV
LUXSVN NLDHRVNLDMKDNLDSVNNLDTHANLDPHLNZLTHANORHRVNORMKDNORTHANORPHL
PRTMDA
ESPHRVESPMKD
ESPMDA
ESPPHLSWEHRVSWEMKD SWEYUGSWESVNSWETHASWEPHL
CHEHRVCHEMKDCHEYUG
CHESVNCHETHACHEPHLTURKAZ TURMKD
TURMDA
GBRBGDGBRHRVGBRKAZGBRMKDGBRMDAGBRPHLGBRYUGGBRSVNGBRTHAUSABGDUSAHRVUSAKAZUSAMKDUSAMDAUSAYUGUSASVNUSATHAUSAPHL
02
.00e
-08
4.0
0e
-08
6.0
0e
-08
8.0
0e
-08
1.0
0e
-07
Rem
itta
nces/(
GD
Pi*
GD
Pj)
0 .0005 .001Migration1990/(Popi*Popj)
Average Ratio Remittances/Income Fitted values
Migrants 1990 and Remittances
31
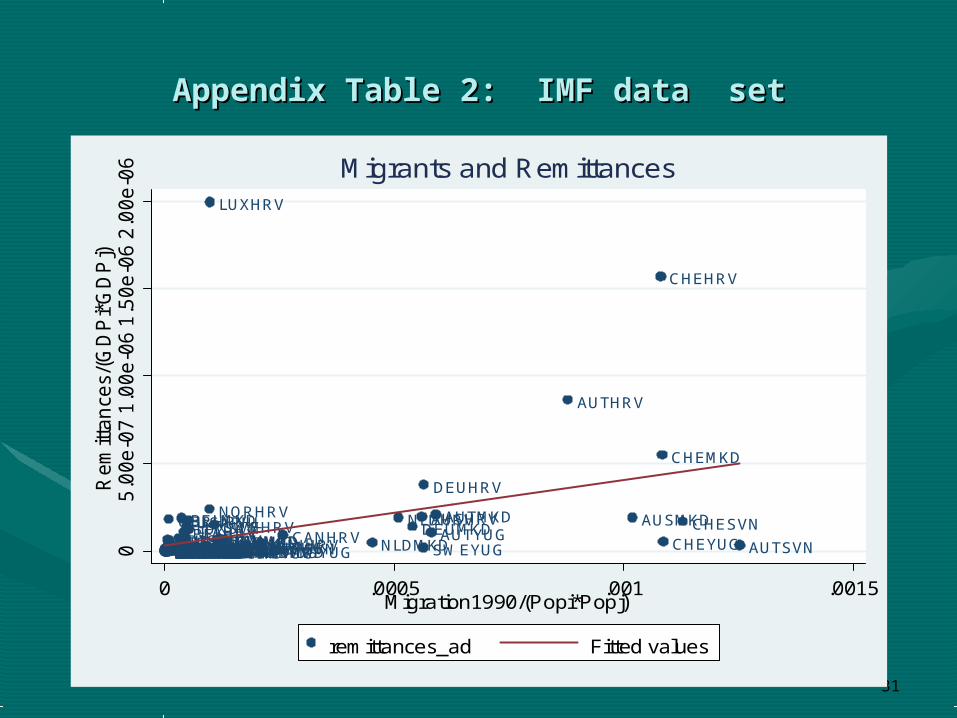
Appendix Table 2: IMF data setAppendix Table 2: IMF data set
AUSHRV AUSMKD
AUSPHLAUSPHLAUSSVNAUSTHA AUSYUG
AUTHRV
AUTMKD
AUTPHLAUTPHL AUTSVNAUTYUGBELHRV
BELMKD
BELPHLBELPHLBELSVNCANHRV
CANMKDCANPHLCANPHLCANSVNCANYUG
CHEHRV
CHEMKD
CHEPHLCHEPHL
CHESVN
CHETHA CHEYUG
DEUHRV
DEUMKD
DEUPHLDEUPHL DEUSVNDEUTHA DEUYUGDNKHRVDNKMKDDNKPHLDNKPHLDNKTHAESPHRVESPPHLESPPHLFRAHRVFRAMKDFRAPHLFRAPHLFRASVNFRAYUGGBRBGDGBRBGD
GBRHRV
GBRMKDGBRPHLGBRPHLGBRSVNGBRTHAGBRYUGGRCMKDGRCPHLGRCPHLGRCYUG HUNHRVHUNSVNHUNYUGIRLHRVIRLPHLIRLPHLIRLYUG
ITAHRVITAMKDITAPHLITAPHLITASVNITAYUGJPNPHL
LUXHRV
LUXSVN NLDHRV
NLDMKDNLDPHLNLDPHLNLDSVNNLDTHA
NORHRV
NORMKDNORPHLNORPHLNORTHANZLTHAPRK/KORPHLPRK/KORPHLPRK/KORTHA
SWEHRVSWEMKD
SWEPHLSWEPHLSWESVNSWETHA SWEYUGTURMKDUSABGDUSABGDUSAHRVUSAMKD
USAPHL
USAPHLUSASVNUSATHAUSAYUG05
.00e
-07
1.0
0e
-06
1.5
0e
-06
2.0
0e
-06
Rem
ittan
ces/
(GD
Pi*
GD
Pj)
0 .0005 .001 .0015Migration1990/(Popi*Popj)
remittances_ad Fitted values
Migrants and Remittances