are deregulated electricity market and climate policy ... · pdf fileeuropean states thus take...
TRANSCRIPT

Acknowledgements
The authors would like to address special thanks to the interviewed experts for their time and precious
insights: Christophe Bonnery, Dominique Finon, Laurent Joudon, Francois Lévêque, Jean-Eudes Moncomble,
Jacques Percebois, Didier Sire, Thomas Veyrenc.
Introduction Electricity market liberalization processes were pioneered in particular by the United Kingdom, which was a
model or at least an example for the European Union to the create a single liberalized European electricity
market in 1996. In the meantime, the European Union has committed to high GHG emissions reductions
through common initiatives such as the EU-ETS in 2005, the first Climate and Energy Package in 2008, and
more recently the NDC submitted to COP21, and national initiatives, e.g. the definition of a carbon price in
UK or the Energy Transition Law in France. The case of Europe is particularly interesting in that it is tightly
bound to US shale gas revolution. While the US have no carbon market or carbon pricing system at federal
level, they have achieved emissions reductions thanks to shale gas replacing coal power generation: CO2
emissions from coal power decreased by 12% between 2010 and 2013 (IEA 2015; IEA 2012). On the other
hand, in Europe, where the EU-ETS was meant to be a leading example for climate action worldwide, power
companies imported cheap coal from the US and coal power generation rose by 5% during the same period, as
well as the associated CO2 emissions (IEA 2015; IEA 2012). This underlines a paradox between stated
objectives and actual achievements within EU.
At the same time, in Japan, the Electricity Market Reform has taken new steps by recently opening the
residential sector to retail competition in April 2016. Japan is also bound, after the Paris agreement in 2015 at
the COP21, to implement an ambitious GHG emissions reduction plan containing major energy savings (e.g. a
17% reduction of electricity demand) and low-carbon energy objectives, in particular a new electricity mix
target for 2030 with at least 44% low carbon electricity (renewables and nuclear). Against this background,
there are concerns regarding the compatibility between market liberalization objectives and national emissions
targets, as the Japanese Electricity Market Reform aims at establishing cheaper electricity prices and a market-
driven electricity sector.
In this paper, we aim at analysing the articulation of electricity market liberalization and climate policy in the
European experience and extract lessons for Japanese case. To do so, we conducted a review of the literature
and a series of semi-directive interviews with 8 experts from academia and electricity industry. The paper is
organized as follows: Section 1 explains the principles and goals of the electricity market liberalization and
climate policy in Europe, first as separate policies and then as a combined policy package. Section 2 assesses
the current results of policies implemented so far within the EU and identifies major issues linked with the
interaction of liberalization and climate policy. Section 3 presents the main recommendations from literature
and experts; last, Section 4 extracts lessons learned for the Japanese case.
Are Deregulated Electricity Market and Climate Policy compatible?
Lessons from overseas, from Europe to Japan
Bianka Shoai-Tehrani,
Systems Analysis Group, Research Institute of Innovative Technology for the Earth (RITE), 9-2 Kizugawadai,
Kizugawa-shi, Kyoto, 619-0292 JAPAN, +81-774-75-2304, [email protected]
Pascal Da Costa,
Laboratoire Genie Industriel, CentraleSupélec, Université Paris-Saclay, Grande Voie des Vignes 92290
Chatenay-Malabry, France., [email protected]
Keigo Akimoto,
Systems Analysis Group, Research Institute of Innovative Technology for the Earth (RITE), 9-2 Kizugawadai,
Kizugawa-shi, Kyoto, 619-0292 JAPAN, +81-774-75-2304, [email protected]
Yasuhide Nakagami,
Systems Analysis Group, Research Institute of Innovative Technology for the Earth (RITE), 9-2 Kizugawadai,
Kizugawa-shi, Kyoto, 619-0292 JAPAN, +81-774-75-2304, [email protected]
1 Principles and Goals of electricity market reform and climate
policy This section presents the principles and goals of the two policies under study in this paper: the EU electricity
market liberalization process on the one hand, and the EU climate policy on the other hand, as they emerged
as completely separate policies, with no reflection on how to articulate with one another.
The first two subsections presents the roots of each policy and first implementations, while the third one
presents the recently adopted combined policy package aiming at reconciling them.
1.1 Theoretical movement for liberalization and first policies for EU electricity
market
The ex-ante electricity sector in Europe consists of mainly monopolies or very integrated sectors. Such a
structure was inherited from the massive nationalization and integration movement in the post-Second World
War period. In France, nationalization of power company is voted in 1946, which leads to the creation of
Electricité de France (EDF) (Beltran and Bungener 1987). In the United Kingdom, nationalization is also
decided according to the Electricity Act voted in 1947. The British Energy Authority is created in 1948 and
becomes the Central Electricity Generating Board (CEGB) in 1957 (Grand and Veyrenc 2011). Italy also
chooses to nationalize the electricity sector in the Constitution in 1946, but national operator Enel is created
only in 1962 (Grand and Veyrenc, 2011) due to industrial reluctance in the sector: nationalization indeed
means that Enel has to absorb the 1270 historical power operators. The process will be completed in 1995
(Enel website). In these three countries, the electricity sector has thus become a state monopoly. Governments
have direct control over pricing and technology choices. The situation in Germany and Spain is different: they
do not create state monopolies nor centralized planning (Grand and Veyrenc 2011; Ibeas Cubillo 2011). Their
electricity industry corresponds to an integrated model. The German electricity sector keeps its structure
including local and regional companies, due to the particular structure of federal German state itself – being
divided in powerful Länder. Yet the sector is very integrated on both vertical and horizontal scales through
numerous exclusivity contracts between power generators and grids, generators and distributors, but also from
generator to generator. In the end the electricity sector in Germany is not submitted to competition and prices
are controlled indirectly by the 1935 Energy Act. Technology choices are adopted at a federal level. In Spain,
where regions are powerful although it is not a federal state, electricity sector integration happens through the
coordination of private companies by themselves (Ibeas Cubillo 2011). In 1944, 18 electricity companies
create the Asociación Española de l’Industria Electrica (UNESA), in order to promote a real national
electricity grid by developing more interconnections to ensure better supply (Asociasion espanola de la
industria Electrica 2013). Like in Germany, the Spanish government controls prices indirectly through the
unified limited rates system established in 1951 that sets maximum prices and regular tariff harmonization in
the different areas of the country.
European states thus take control of the power industry either through a monopoly called “natural monopoly”
by economic theory, either through an integrated model where potential entrants and prices are influenced by
the state. However, the efficiency of such a model starts to be questioned in economic literature around the
1960s, as studies empirically identify their negative effects. Such effects are, among others: a tendency to
overcapitalize (Averch and Johnson 1962), a lack of efficiency (Leibenstein 1966), a risk of regulatory capture
(Buchanan 1975; Peltzman 1976; Stiglitz 1976). The concept of ‘natural monopoly’ is questioned in grid
sectors like the electricity sector or the telecommunication sector; it is argued that, except from purely grid-
management related activities, competition should be introduced for the benefit of the consumer (Baumol
1977; Kahn and Eads 1971; Sharkey and Reid 1983). As a result, the United Kingdom is the first country in
Europe to reform their electricity market in the 1980s (Glachant 2000).
In parallel, as a follow-up of the political construction of EU initiated in the 1950s, several European
Communities for trade and economy are created, which leads to the adoption of the Single European Act in
1986. In 1996, the EU decides upon the creation of a single European electricity market with the EU Directive
on common rules for the internal market in electricity (European Commission 1996).
The creation of such a market has two goals: lower electricity prices thanks to competition and improve
system optimization by broadening the perimeter for resources (Grand and Veyrenc 2011). According to a
study by consulting firm Booz and Pr Newbery, EU net economic benefits from completion of the internal
market were assessed to be in the range of 16-40 billion € per year (D. Newbery et al. 2013). Regarding the
implementation, each member state can choose whatever measures they see fit to meet the objectives, since,
according to the Lisbon Treaty, the European Commission has no authority on their national energy policies.
They can choose whether to open the market to new entrants, or stop controlling prices, or create an
independent regulator for every activity open to competition, etc. (D. Newbery 2002; Perrot 2002). While the
past British model defines the ideal case for a smooth liberalization process: a unitary state dismantling a
national monopoly (Glachant 2000), it is far from being a standard model within Europe both from an
institutional and industrial point of view. Before the reform, European countries with different characteristics
(federal or regional states, monopolies or oligopolies) are to implement the reform within the common
framework build by the European Commission. Given the heterogeneity of institutions, markets and industries
in different European countries and given also the flexibility of European Commission Directives, results end
up being very unequal. In reaction to this issue, a mention of energy issues was added to the Lisbon Treaty in
2009, stating that that EU’s members state countries should aim to behave in a solidary way with EU energy
market objectives (Delbeke and Vis 2015).
1.2 EU Climate Policy
The EU Climate Policy started as a part of environmental policy, within the Single European Act of 1986. The
EU environmental policy grew more and more detailed over the years to become a set of EU legislation on
environmental protection of air quality, water, waste, biodiversity (Delbeke and Vis 2015). There are two
reasons for environmental questions to be treated at EU level: they often involve cross-border related issues,
such as river pollution or air pollution; moreover, as EU internal trade was intensifying over the 1980s and
1990s, short-terms distortions were identified as a result of differences between national environmental
policies, which called for harmonization. As greenhouse gas emissions issues started to rise in the early 1990s,
there was a proposal for a carbon and energy tax in 1992 that was eventually abandoned after a decade of
negotiations. Instead, the EU agreed upon choosing an overall limit of emissions: a ‘cap’, for a cap-and-trade
system of carbon pricing. The EU-15 agreed upon 19% reduction over 1990-2012 period under the Kyoto
Protocol, and the European Union Emissions Trading Scheme (EU-ETS) was created in 2005. Another reason
for the success of the trading scheme over the tax scheme is that within EU negotiations, trading could be
agreed through a qualified majority, whereas a carbon tax required unanimity (IPCC 2014). Three phases have
occurred so far : Phase I from 2005 to 2007, Phase II from 2008 to 2012, and Phase III starting in 2013 to end
in 2020, each phase evolving based on the previous’ phase experience regarding targets, allowances and
auctions volumes. The EU released the First Climate and Energy Package in 2009, with targets for 2020: 20%
GHG emissions reduction, 20% renewable energy share in primary energy mix, 20% energy efficiency
improvement. The Second Climate and Energy Package with 2030 targets released in 2014 comprised the
objectives submitted to the COP21 in 2015: 40% GHG emissions reductions (compared to 1990 levels), 27%
renewable energy share in primary energy mix, 27% energy efficiency improvement (European Commission
2015b; UNFCC 2015).
1.3 Towards a combined policy package
It is only very recently that the European objectives have started to evolve towards a combined policy package
regrouping European Commission directives on internal electricity market, EU-ETS, climate energy packages
in order to ensure compatibility and complementarity. The 2014 EC Internal Market Progress Report mentions
that market integration will serve variable renewable integration. From February 2015, there is now, as an
objective for 2019, the creation of an ‘Energy Union’ (European Commission 2015a; M. Newbery 2015). It
aims at a new governance for the energy sector, acknowledging that climate action and energy sector
governance are directly linked. In particular, there is an urgent need to reconcile the contradiction between the
energy market liberalization policy that focuses on competition and promotes less intervention from the states,
and increasing government interventionism for climate policy purposes (Keay and Buchan 2016). The ‘Energy
Union’ includes general geopolitical objectives, climate objectives and market integration objectives.
Geopolitical objectives aim at diversifying energy sources, and reducing import dependency of EU. Climate
objectives consist in binding gas reduction target: -40% in 2030 compared to 1990 levels as in the Second
Energy Package released in 2014 and as in the NDCs submitted to the UNFCCC for the COP21(UNFCC
2015; European Commission 2015b). It also includes the same EU-wide binding renewable energy target
(27%), objectives to improve energy efficiency, and to reform the EU-ETS. In order to promote market
integration and competition within the market, but also to improve security of supply and reduce CO2
emissions, the plan for the ‘Energy Union’ also plans to invest 647 million € in ‘Projects of Common interest’
that are mainly energy infrastructure; the target being that 70% should be completed in 2020 (European
Commission 2014b).
2 Assessment of situation in Europe considering those
objectives The current situation shows that liberalization did not bring cheaper electricity supply for retail customers
while causing significant losses to major power companies, and that although 2020 targets are about to be met,
climate policies seem to have a limited impact, given that EU-ETS failed to prevent gas to coal switch in
Europe after shale gas revolution in the US.
2.1 Current state of policy implementation and targets achievements
2.1.1 Market liberalization
Market integration
Regarding market integration, the EC identifies positive trends in current single market progress (European
Commission 2014b), such as the creation of the Agency for the Cooperation of Energy Regulators (ACER)
and European Networks of Transmission Systems Operators (ENTSOs), or the fact that market coupling
progresses: in February 2014, 14 Member States had established day ahead market coupling, and in May
2014, the South West market was coupled with North West. The unbundling of transmission system operators
(TSOs) from vertically integrated energy groups can be considered globally a success, as 96 of about 100
transmission systems in European are now compliant with EU legislation. Connection was achieved between
Estonia and Finland, UK and Ireland; electricity interconnector between Sweden and Lithuania is under
construction. However, the unbundling did not trigger the hoped for increase in cross-border infrastructure, as
current interconnections are assessed to be insufficient. The EC has now set a target of a minimum of 15% of
installed electricity capacity, arguing that interconnections will help market integration as well as emissions
reductions and energy efficiency. Priorities are set on North-South electricity interconnections in Western
Europe, such as improving the connection of Ireland, UK or the Iberian Peninsula with the continent, North-
South electricity interconnections in Central Eastern and South Eastern Europe, the Baltic region, and to build
offshore grid in the North Sea for offshore and onshore renewable integration. In total, 132 ‘Projects of
Common Interest’ (PCIs) in electricity are being funded, but currently, only one project has already been
completed, while seven projects have entered the construction phase (European Commission 2014b).
Market structure
Regarding market structure, we observe that the current oligopoly stands from historical monopolies
mentioned in Section 1 with few new entrants. Since the first directive of electricity market reform, there were
two types of new entrants:
- The first type are the new entrants around 2005, mostly based on CCGT technology, as it was the
most profitable investment given wholesale prices at the time. These new entrants really are the result
of liberalization.
- The second type are the new entrants based on renewable technologies and driven by FiT and other
support schemes. These new entrants are out-of-market new entrants.
However, if we observe companies’ movements between concentration and actor multiplication, we can see
that new entrants of medium and small sizes mostly tend to be bought by historical majors, and in particular,
cross-border new entrants tend to return to their historical market: French operator EDF had bought a share of
EnBW in Germany but ended up selling it to the Baden-Wurtenberg; Italian operator Enel had entered the
Romanian market but finally left it, as French company Engie did in Slovakia. The main exception is the UK
where the major companies, the ‘big six’, include French, Spanish and German operators. As a result, the EU
market is still concentrated around historical operators.
Prices
According to recent EC reports (European Commission 2014a; European Commission 2014b): ‘in the EU on
average, household electricity prices have risen 4% a year for the last five years (2008-2012). In most Member
States, this is an increase above inflation […] For industry, retail electricity prices rose by approximately 3.5%
a year in the same period – above inflation in half of Member States’. But ‘in contrast to these retail
developments, in the period 2008-2012 wholesale electricity prices declined by between 35% and 45% on the
major European wholesale electricity benchmarks (with huge disparities among countries and sectors) […]
While the EC interprets these trends as a result of competition, but also of ‘increasing renewable sources able
to produce at zero marginal costs as well as the economic downturn’, most of the literature assesses that the
role of competition was actually negligible (IPCC 2014).
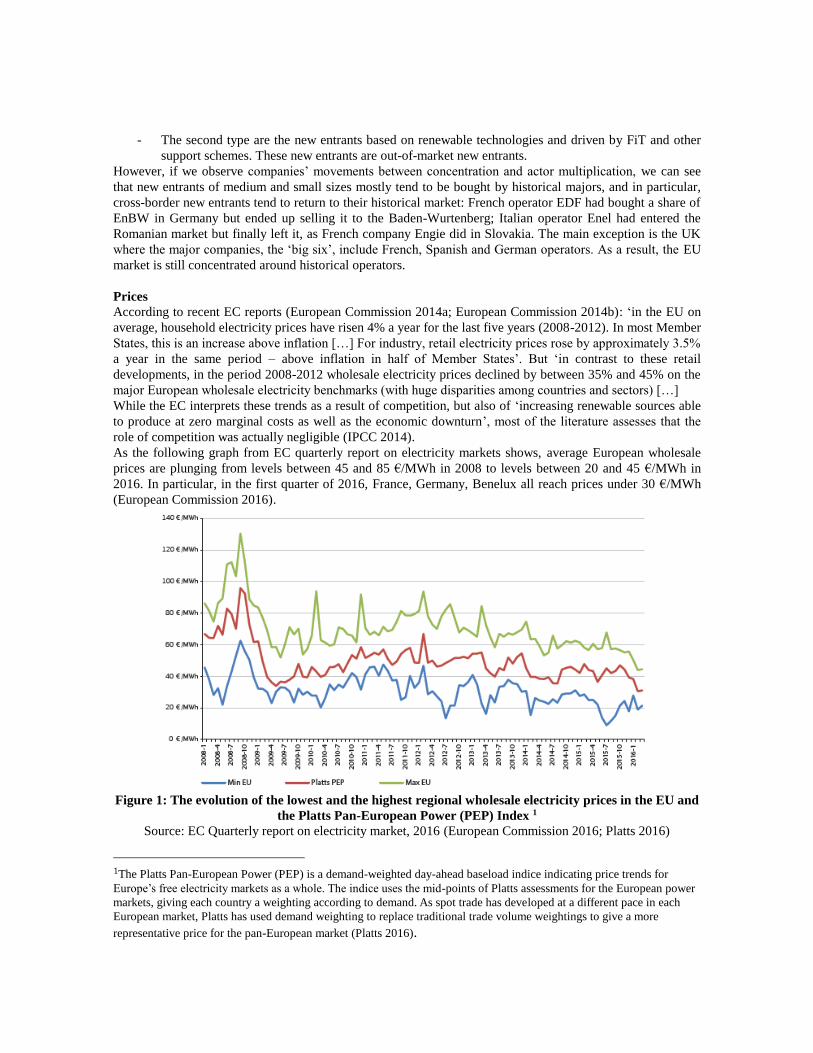
As the following graph from EC quarterly report on electricity markets shows, average European wholesale
prices are plunging from levels between 45 and 85 €/MWh in 2008 to levels between 20 and 45 €/MWh in
2016. In particular, in the first quarter of 2016, France, Germany, Benelux all reach prices under 30 €/MWh
(European Commission 2016).
Figure 1: The evolution of the lowest and the highest regional wholesale electricity prices in the EU and
the Platts Pan-European Power (PEP) Index 1
Source: EC Quarterly report on electricity market, 2016 (European Commission 2016; Platts 2016)
1The Platts Pan-European Power (PEP) is a demand-weighted day-ahead baseload indice indicating price trends for
Europe’s free electricity markets as a whole. The indice uses the mid-points of Platts assessments for the European power
markets, giving each country a weighting according to demand. As spot trade has developed at a different pace in each
European market, Platts has used demand weighting to replace traditional trade volume weightings to give a more
representative price for the pan-European market (Platts 2016).
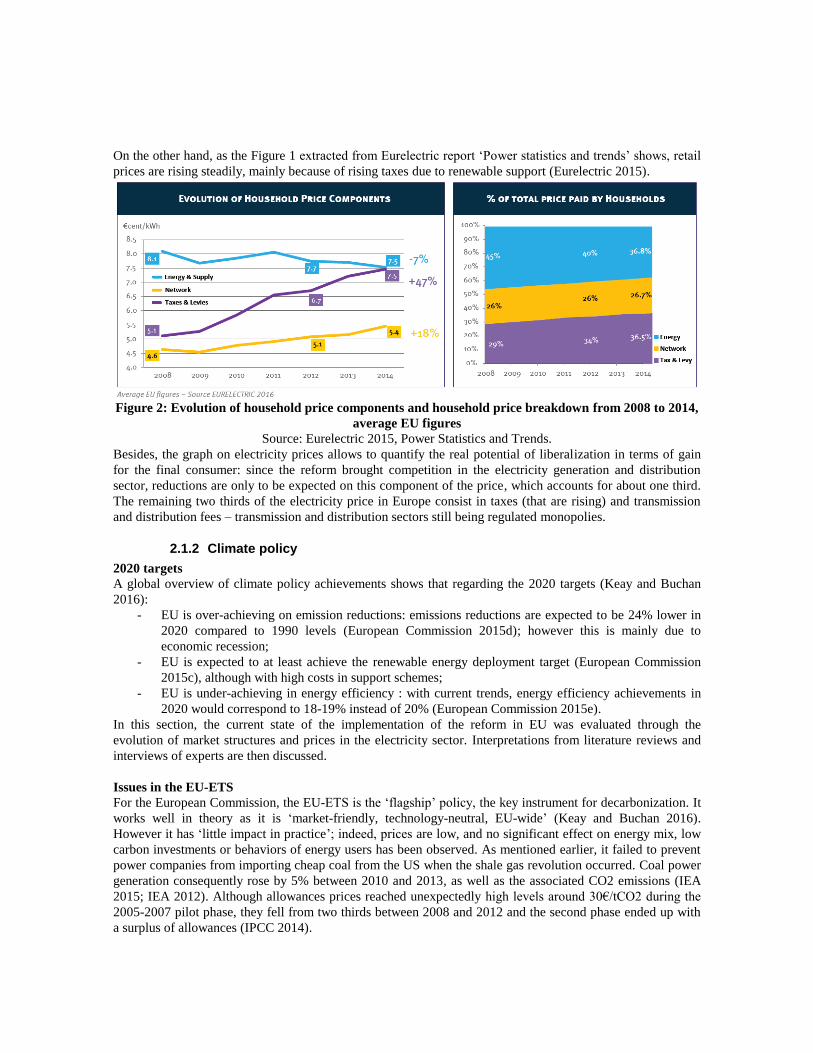
On the other hand, as the Figure 1 extracted from Eurelectric report ‘Power statistics and trends’ shows, retail
prices are rising steadily, mainly because of rising taxes due to renewable support (Eurelectric 2015).
Figure 2: Evolution of household price components and household price breakdown from 2008 to 2014,
average EU figures
Source: Eurelectric 2015, Power Statistics and Trends.
Besides, the graph on electricity prices allows to quantify the real potential of liberalization in terms of gain
for the final consumer: since the reform brought competition in the electricity generation and distribution
sector, reductions are only to be expected on this component of the price, which accounts for about one third.
The remaining two thirds of the electricity price in Europe consist in taxes (that are rising) and transmission
and distribution fees – transmission and distribution sectors still being regulated monopolies.
2.1.2 Climate policy
2020 targets
A global overview of climate policy achievements shows that regarding the 2020 targets (Keay and Buchan
2016):
- EU is over-achieving on emission reductions: emissions reductions are expected to be 24% lower in
2020 compared to 1990 levels (European Commission 2015d); however this is mainly due to
economic recession;
- EU is expected to at least achieve the renewable energy deployment target (European Commission
2015c), although with high costs in support schemes;
- EU is under-achieving in energy efficiency : with current trends, energy efficiency achievements in
2020 would correspond to 18-19% instead of 20% (European Commission 2015e).
In this section, the current state of the implementation of the reform in EU was evaluated through the
evolution of market structures and prices in the electricity sector. Interpretations from literature reviews and
interviews of experts are then discussed.
Issues in the EU-ETS
For the European Commission, the EU-ETS is the ‘flagship’ policy, the key instrument for decarbonization. It
works well in theory as it is ‘market-friendly, technology-neutral, EU-wide’ (Keay and Buchan 2016).
However it has ‘little impact in practice’; indeed, prices are low, and no significant effect on energy mix, low
carbon investments or behaviors of energy users has been observed. As mentioned earlier, it failed to prevent
power companies from importing cheap coal from the US when the shale gas revolution occurred. Coal power
generation consequently rose by 5% between 2010 and 2013, as well as the associated CO2 emissions (IEA
2015; IEA 2012). Although allowances prices reached unexpectedly high levels around 30€/tCO2 during the
2005-2007 pilot phase, they fell from two thirds between 2008 and 2012 and the second phase ended up with
a surplus of allowances (IPCC 2014).
It is assessed that the carbon price should reach at least 100 €/tonCO2 to trigger the desired effects, but such
levels would inacceptable for several countries, e.g. Poland and their 83% coal (Keay and Buchan 2016).
There are several reasons for such little impact (Robinson 2015). First, governments introduced multiple
mechanisms that undermined the EU-ETS, such as FiT and support schemes, mandatory targets for renewable
share, policies for energy efficiency, or the additional carbon floor price in the UK. All these mechanisms
reduced the demand for emission allowances and lowered carbon price. Moreover, the EU allocated too many
permits at the beginning of the phase, which is linked with the fact that the EU-ETS was not designed to deal
with the economic recession that unexpectedly lowered emissions and thus demand for allocation permits.
2.2 The root of the ‘missing money’: the combined effect of renewable
support and liberalization
Major power companies have dangerous financial difficulties as the low level of wholesale prices do not allow
them to recover variable and even fixed costs, which causes them to suffer from stranded costs and
impairments. About 70 GW of coal and gas power plants were shut down between 2010 and 2014, with
important acceleration over time: 3 GW per year in 2010 and 2011, 10 GW in 2012, almost 30 GW per year
in 2013 and 2014 (Robinson 2015).
There are several roots of this missing money problem that were identified and discussed through literature
review and experts interviews.
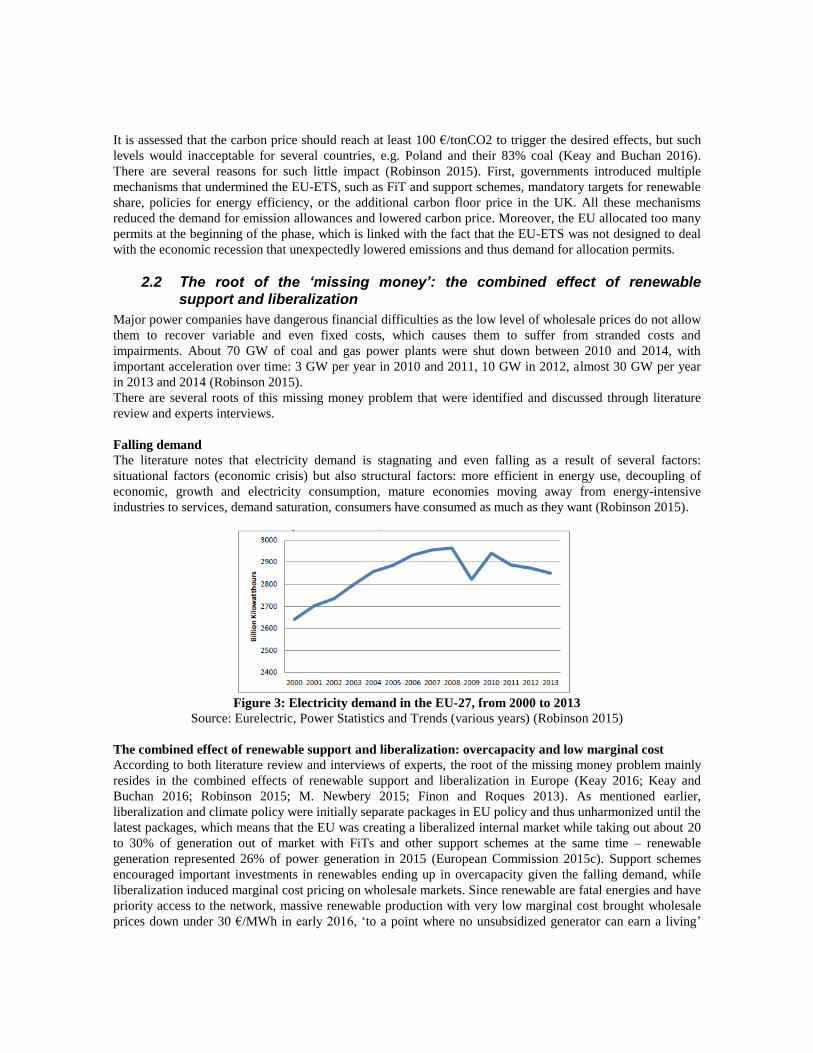
Falling demand
The literature notes that electricity demand is stagnating and even falling as a result of several factors:
situational factors (economic crisis) but also structural factors: more efficient in energy use, decoupling of
economic, growth and electricity consumption, mature economies moving away from energy-intensive
industries to services, demand saturation, consumers have consumed as much as they want (Robinson 2015).
Figure 3: Electricity demand in the EU-27, from 2000 to 2013
Source: Eurelectric, Power Statistics and Trends (various years) (Robinson 2015)
The combined effect of renewable support and liberalization: overcapacity and low marginal cost
According to both literature review and interviews of experts, the root of the missing money problem mainly
resides in the combined effects of renewable support and liberalization in Europe (Keay 2016; Keay and
Buchan 2016; Robinson 2015; M. Newbery 2015; Finon and Roques 2013). As mentioned earlier,
liberalization and climate policy were initially separate packages in EU policy and thus unharmonized until the
latest packages, which means that the EU was creating a liberalized internal market while taking out about 20
to 30% of generation out of market with FiTs and other support schemes at the same time – renewable
generation represented 26% of power generation in 2015 (European Commission 2015c). Support schemes
encouraged important investments in renewables ending up in overcapacity given the falling demand, while
liberalization induced marginal cost pricing on wholesale markets. Since renewable are fatal energies and have
priority access to the network, massive renewable production with very low marginal cost brought wholesale
prices down under 30 €/MWh in early 2016, ‘to a point where no unsubsidized generator can earn a living’

(Keay and Buchan 2016), a feeling largely shared by interviewed experts. Renewables reduce power
companies’ revenues while increasing some of their costs: in addition to lower average wholesale price, peak
prices are lower – yet peak sales are usually a source of profit for baseload and semi-baseload power plants.
The overcapacity in Europe resulted in less demand for conventional thermal plants, increasing their average
costs. Intermittency causes new system costs, as investments are needed in network for off-shore wind, in local
distribution for distributed solar: network tariffs rose by 18% between 2008 and 2014 for residential
consumers (Eurelectric 2015). As a consequence, energy-only markets are assessed to be unable to remunerate
the fixed costs of power stations; moreover, it induces that there is no exit plan for support schemes.
Moreover there are additional problems linked with massive renewable investment and ‘missing money’
problem for thermal power plants. There is a phenomenon of cannibalism for renewable investment and
especially PV investment: for such investment, the additional capacity will produce more electricity at the
same peak period (at noon for PV for instance). There is thus less and less value to invest in such additional
capacity, as it tends to increase the burden of intermittency-related issues and thus system costs.
The role of autoconsumption and curtailment
According to (Robinson 2015), in addition to the issues identified above, rising retail prices due to renewable
support lower the demand as it encourages savings, efficiency, auto-consumption - a trend that only EV
development would change, although high retail prices discourage EV deployment and thus compromises the
decarbonization of transportation. However, such an interpretation is questionable as it supposes that
electricity demand is price-elastic. The price elasticity of electricity demand cannot really be measured in
Europe since electricity prices are capped to a level of 3000 €/MWh. However, experts tend to say that there
is little elasticity for electricity demand, and high retail prices do not affect electricity consumption on the
short-term. On the long term though, there could be observable effects such as fuel switch for heating for
instance. Besides, this interpretation also supposes that autoconsumption is getting more and more attractive.
Indeed, the literature analyses the potential for autoconsumption causing the death spiral of utilities (Sioshansi
2014), and there were mentions that rooftop PV had reached grid parity in several countries (such as Italy).
But concretely, it actually is an artificial grid parity, as it means that the cost for auto-consumption is equal to
market electricity prices including high taxes, which in no way means that generation costs are equal.
Autoconsumption is still assessed to be far from competitive worldwide, even in areas with the highest
electricity prices (Khalilpour and Vassallo 2015). It develops unequally within Europe, meeting little success
in France or UK, but developing in Scandinavian countries and Germany. For such countries, this aspect could
thus potentially become an issue in the future.
In the end, major utilities are facing a critical “missing money” problem, trapped in a vicious circle that does
not allow them to paying fixed costs; the system is thus unable to phase out of support schemes and shift to
clean energy investments only, and retail customers do not benefit from low wholesale market, as summarized
on Figure 4 below.
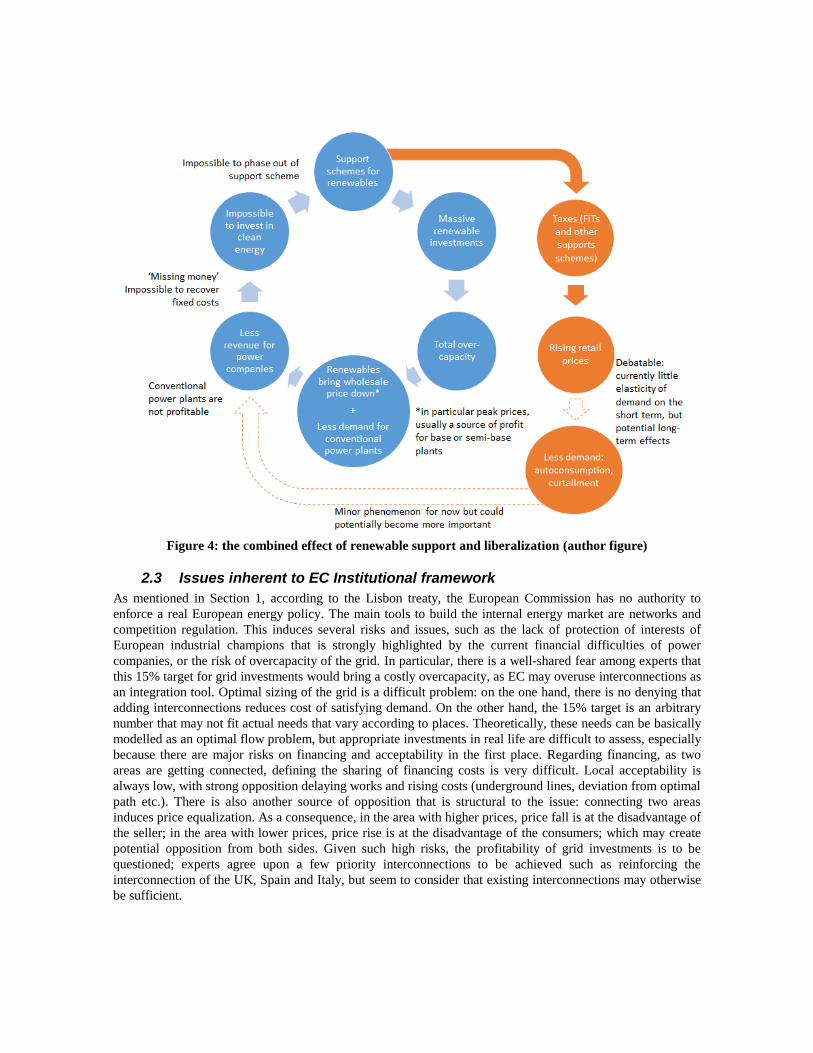
Figure 4: the combined effect of renewable support and liberalization (author figure)
2.3 Issues inherent to EC Institutional framework
As mentioned in Section 1, according to the Lisbon treaty, the European Commission has no authority to
enforce a real European energy policy. The main tools to build the internal energy market are networks and
competition regulation. This induces several risks and issues, such as the lack of protection of interests of
European industrial champions that is strongly highlighted by the current financial difficulties of power
companies, or the risk of overcapacity of the grid. In particular, there is a well-shared fear among experts that
this 15% target for grid investments would bring a costly overcapacity, as EC may overuse interconnections as
an integration tool. Optimal sizing of the grid is a difficult problem: on the one hand, there is no denying that
adding interconnections reduces cost of satisfying demand. On the other hand, the 15% target is an arbitrary
number that may not fit actual needs that vary according to places. Theoretically, these needs can be basically
modelled as an optimal flow problem, but appropriate investments in real life are difficult to assess, especially
because there are major risks on financing and acceptability in the first place. Regarding financing, as two
areas are getting connected, defining the sharing of financing costs is very difficult. Local acceptability is
always low, with strong opposition delaying works and rising costs (underground lines, deviation from optimal
path etc.). There is also another source of opposition that is structural to the issue: connecting two areas
induces price equalization. As a consequence, in the area with higher prices, price fall is at the disadvantage of
the seller; in the area with lower prices, price rise is at the disadvantage of the consumers; which may create
potential opposition from both sides. Given such high risks, the profitability of grid investments is to be
questioned; experts agree upon a few priority interconnections to be achieved such as reinforcing the
interconnection of the UK, Spain and Italy, but seem to consider that existing interconnections may otherwise
be sufficient.
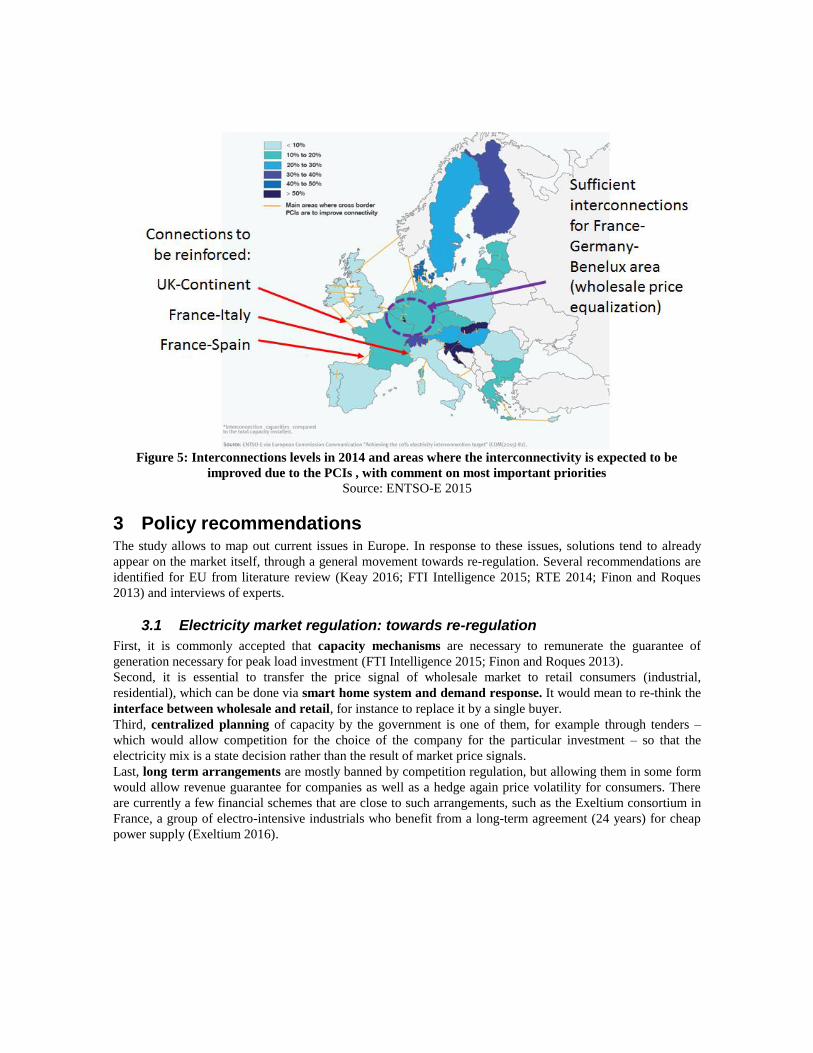
Figure 5: Interconnections levels in 2014 and areas where the interconnectivity is expected to be
improved due to the PCIs , with comment on most important priorities
Source: ENTSO-E 2015
3 Policy recommendations The study allows to map out current issues in Europe. In response to these issues, solutions tend to already
appear on the market itself, through a general movement towards re-regulation. Several recommendations are
identified for EU from literature review (Keay 2016; FTI Intelligence 2015; RTE 2014; Finon and Roques
2013) and interviews of experts.
3.1 Electricity market regulation: towards re-regulation
First, it is commonly accepted that capacity mechanisms are necessary to remunerate the guarantee of
generation necessary for peak load investment (FTI Intelligence 2015; Finon and Roques 2013).
Second, it is essential to transfer the price signal of wholesale market to retail consumers (industrial,
residential), which can be done via smart home system and demand response. It would mean to re-think the
interface between wholesale and retail, for instance to replace it by a single buyer.
Third, centralized planning of capacity by the government is one of them, for example through tenders –
which would allow competition for the choice of the company for the particular investment – so that the
electricity mix is a state decision rather than the result of market price signals.
Last, long term arrangements are mostly banned by competition regulation, but allowing them in some form
would allow revenue guarantee for companies as well as a hedge again price volatility for consumers. There
are currently a few financial schemes that are close to such arrangements, such as the Exeltium consortium in
France, a group of electro-intensive industrials who benefit from a long-term agreement (24 years) for cheap
power supply (Exeltium 2016).
3.2 Climate policy instruments: carbon floor price and market-friendly support
schemes
In response to the fact the EU-ETS offered too many emissions allowances in previous phases, which was
identified as one of the causes for low carbon prices, a stability reserve will be implemented from 2019,
allowing to freeze a certain proportion of allowance if needed (European Commission 2015d).
A carbon floor price around 30 €/tCO2 would allow to shift from coal to gas by changing the merit order as a
first step towards a steadily rising carbon price to direct low-carbon investments. It would cut emissions by
15% a year, while increasing the gas share to 40% in European power generation. On the longer term, a 100
€/tCO2 price would allow 30% emissions cuts per year (RTE and ADEME 2016). In practice, the UK has
already adopted a carbon floor price starting at a level of 18£/tCO2 and planning to reach 30£/tCO2 in
2020(Government of UK 2014). However adopting such a policy at a national level without guarantee of
harmonization within the EU represents a risk in terms of competitiveness. Several countries are considering a
carbon floor price; among them, France has recently given serious considerations to the implementation of a
carbon floor price from year 2017, which would be relatively easy as it would have little effect on the
country’s economy given the low share of fossil fuels in the mix. Moreover, according to the latest
declarations, such a carbon floor price would be implemented only for coal-fired plants which would limit
even more its effect as France has only four coal power plants, two of them belonging to German operator
E.On (Barroux 2016; Le Monde 2016).
Last, market-friendly renewable support such as Contract for Difference or Feed-in-Premium instead of
Feed-in-Tariffs would allow to expose producers to market prices in order to prevent overcapacity, while still
protecting them from to important variations. The figure below explains the functioning of these three
renewable support schemes.
Figure 6: Functioning of different renewable support schemes
(FTI Intelligence 2015)
While Feed-in Tariff provides constant revenue, Feed-in Premium add a premium to the producer’s revenue,
which thus follows market variations. Contract for Difference are an alternative between Feed-in Tariff and
Feed-in Premium. The revenue of the producer is compensated according to two prices: the reference price
and the strike price. The reference price correspond to the average market price on a given period (annual
average price, seasonal average price or even hourly price according to cases) and is thus follows market
though usually with less volatility. When reference price is below a negotiated ‘strike price’, the revenue of
the producer is compensated to reach the level of the strike price. On the other hand, when the reference price
is superior to the strike price, the difference is paid back by the generator. A more detailed figure for CfD is
shown below.
Figure 7: Functioning of Contract for Difference, detailed graph
(Government of UK 2015)
A simplified version of CfD consists in taking the market price as the reference price.
Although these support schemes are market-friendlier than FiT, they may still at some point be ineffective to
prevent overcapacity as they protect the producer anyway.
3.3 Tackling upcoming issues: investment and pricing for transport and
distribution systems
Transmission and distribution management, in terms of both investment and pricing, are foreseen to be the
next essential issues (Jamme 2016; Creti 2016; Roques and Verhaeghe 2016; Meeus 2016; Galland 2016;
Thouvenin 2016; Schwarz 2016). Both market liberalization and renewable integration require reinforcement
of the grid, in transmission as well as distribution, as they will require more and more flexibility. Large-scale
wind and upcoming nation-wide capacity mechanisms call for more transportation capacity, while recent
massive PV and small renewable investments demand new infrastructure for distribution grid. While the
network used to be conceived and designed from power plants to end-use consumers, that is to say from
transmission to distribution, from Extra-High Voltage towards Low Voltage, the opposite need appeared: from
residential customers to main grid. For such ‘prosumers’ (consumers and producers at the same time), since
only net subtracted electricity is billed, fixed costs of the distribution and transmission network are not rightly
remunerated. A benchmark of current pricing practices for distribution shows that fixed costs are not properly
remunerated in most European countries, which is problematic for investments – except for the Netherlands,
Spain and Sweden, where fixed costs account for over 75% of the tariff (Roques and Verhaeghe 2016). There
is thus a need to reconsider pricing (Galland 2016), but also to design incentives such as storage premium so
that prosumers can contribute to grid support. Beyond investment and pricing, alternative regulations should
be considered to adapt the system to customers’ new needs: for instance to design small-scale capacity
mechanisms at city levels or neighborhood levels, managed by distribution operators rather than nation-wide
capacity mechanisms managed by transportation operators (Meeus 2016; Creti 2016).
4 Lessons learned for the case of Japan
4.1 Japanese liberalization context compared with EU context
Throughout its history, the Japanese electricity sectors has already known concentration and de-concentration
movements. It starts to be concentrated early as 50% of electricity generation concentrated in the hands of 5
major companies in 1929 already. A state-owned monopoly regrouping power generation and transmission,
Nihon Hatsusoden Co, is established in 1939, while nine distribution companies are created in 1942, one for
each region of Japan: Hokkaido, Tohoku, Hokuriku, Kanto, Chubu, Kansai, Chugoku, Shikoku, and Kyushu.
After World War II, contrary to Europe, there is a movement of de-concentration of the economy, with the
establishment of the Commission for the democratization of electricity business in 1948, which leads to the
division of the electricity monopoly into nine private electricity companies that are regional monopolies in
1951. The Okinawa power company is created in 1972, resulting in the current electricity sector with 10
regional monopolies. One technical particularity of the electricity system of Japan is the presence of two grids
with difference frequencies: western Japan built a 60Hz grid based on the American system while eastern
Japan built a 50 Hz based on the German system (Asano and Goto 2013).
The principles and goals of the Japanese Electricity Market Reform are explicated by the Ministry of
Economy, Trade and Industry (METI) as the following ones (METI, Agency for Natural Resources and
Energy 2015):
- Given the lack of system of transmit electricity beyond regions, it aims at ensuring stable supply by
expanding scope of supply (whole country instead of region)
- Given the current state of little competition and strong price control, it aims at cheap electricity prices
through competition
- Given the inertia of the system, it aims at stimulating changes in the energy mix especially regarding
renewables deployment
- It aims at expanding choices for consumers and business opportunities
Concretely, the liberalization process had started in 1995; it has recently regained importance after the
Fukushima disaster, as it made it necessary to reconsider electricity policy to deal with issues of energy mix
choices and high energy prices (Asano and Goto 2013).
In terms of implementing the reform, Japan is a unitary state, very centralized (similar to France or UK rather
than Spain or Germany); although the electricity sector is divided in 10 regional monopolies, the regions
corresponding to each monopoly have no political power (the country is divided in prefectures). Local power
is sometimes represented in power companies’ shareholding structure through the main cities of regions: for
instance, about 10% of Kansai EPCO is detained by Osaka City, about 50% of TEPCO by a Tokyo Municipal
Entity created after the Fukushima accident. On the companies’ side, the ten Japanese EPCOs have formed the
Federation of Electric Power Companies (FEPC) to negotiate with the government and have three
representative firms as their opinion leader, that are located in Tokyo, Osaka and Nagoya, the three cities with
largest population and electricity demand. In this regard, and adding to the fact that this oligopoly was
historically a monopoly, the electricity sector is more centralized than it seems. Moreover, since Japanese
trade corporations located in Tokyo purchase most of fuels for the electric power companies, there is
practically no difference in fuel cost among firms. Last, operation and cost structure are always monitored by
Japanese government so labour and capital structures are the same among companies: in the end, there are thus
little regional differences (Goto, Inoue, and Sueyoshi 2013). Despite being a regional oligopoly, the
institutional framework and historical heritage makes the electricity sector of Japan very homogenous
compared to the EU or even to federal European countries such as Germany or Spain, whose electricity sector
seems to have a similar structure to the Japanese one at first glance.

4.2 Climate Policy in Japan
In Japan, the latest climate policy and energy policy packages were carefully designed to be consistent with
each other in view of the submission of the Nationally Determined Contribution (NDC) for the COP21.
First, the Strategic Energy Plan was elaborated in April 2014, based on the ‘3E+S’ principles: energy security,
economic efficiency, environment, and safety, with the following targets (METI/ANRI 2015):
- The self-energy sufficiency ratio should be higher than prior to the Great East Japan Earthquake
(around 25% in primary energy)
- The electricity cost should be reduced compared to the current level.
- Greenhouse gas emissions should be reduced as to make Japan a leading example for the rest of the
world and with levels at least equivalent to those of the EU and the U.S.
The electricity mix is shown respectively in Figure 8. In the estimation, the government assumed the GDP
growth of 1.7% per year between 2013 and 2030. A significant improvement of energy efficiency is expected
in the energy mix: a cut of 17% in electricity consumption compared to baseline (196.1 TWh).
- Figure 8: Electricity mix in 2030 (METI/ANRI 2015)
The NDC was then determined in accordance with the energy mix: a 26% emission reduction by 2030
compared to 2013 levels which corresponds to a 25.4% reduction compared to 2005 (the emissions target in
2030 is 1.042 GtCO2eq.). In order to ensure the achievability of the NDC, the government elaborated the
breakdown targets by bottom-up calculation based on the energy mix with concrete policies, measures and
individual technologies, as shown in Table 1 below.
Table 1: Expected energy-related CO2 emissions by sector for achieving the INDC (METI/ANRI 2015)
2005 2013 2030
Industry 457 429 401
Commercial and other 239 279 168
Residential 180 201 122
Transport 240 225 163
Energy conversion 104 101 73
Energy-related CO2 Total 1219 1235 927
[Value: million t-CO2] Note: Emissions by sector include indirect emissions (e.g., electricity consumptions). Emissions from energy conversion
is those of own use and losses in energy conversion.
The government intends to promote renewable energies via FiT and energy efficiency of fossil fuel power in
order to achieve both a reduction in CO2 emissions and electricity costs, as shown on Figure 9.
Figure 9: Structure of national expenses for electricity in 2013 and 2030 (METI/ANRI 2015)
4.3 Applicable recommendations for Japan
Japan can be compared to the EU as whole, since in both cases, the reform aims at integrating separate
markets; comparisons with each member countries are also relevant when it comes to national policy
implementation. As it is one country, Japan avoids European complexity and its particular institutional
framework. From this point of view, the reform implementation is expected to be much easier. As mentioned
in Subsection 4.1, despite an oligopolistic structure, the situation of Japan’s electricity sector is more similar
to the one of the UK or France that are centralized countries. Theoretically, this could favour a smooth
implementation of the reform (Glachant 2000). In practice, it could actually have the opposite effect, like in
the case of France, where the historical monopoly remains in the dominant position and competition is quasi
non-existent. The monopolistic aspect of the 10 utilities and the strong cooperation through the Federation
may induce a risk of similar inertia.
On the other hand, the presence of two transmission systems with different frequencies is a major technical
hurdle to market integration, and to the development of trading activities between regions to improve
economic efficiency of Japanese grid and regional interconnection.
As the description of market reform policy and energy climate policy shows, the re-regulation movement is
pre-existing in Japan, the energy mix being decided by the government (though without stating the way of
achieving it), making the centralized planning recommendation less relevant for Japan than Europe.
On the other hand, since high FiTs for renewables have been implemented up to now, the risk for overcapacity
and related vicious circle resulting from renewable support and liberalization exists. Besides, such risks on
revenue are the main fears of power companies regarding electricity market reform (JEPIC 2016).
Ancitipating protection of power companies, that is to say designing guarantee mechanisms for remuneration
for fixed costs for producers and TSOs such as capacity mechanisms, rationalizing renewable support to avoid
overcapacity are thus a relevant recommendations.
Conclusion In a nutshell, through the comparison between EU and Japan regarding their ongoing electricity market
reforms as they take place within very different environments, this paper discusses the level of government
intervention that is desirable in a post-reform electricity sector and sorts out existing policy instruments to
reconcile requirements for a liberalized market and an effective climate policy. The main lesson for Japan is
that they have a chance to implement from the beginning the so-far identified solutions for smooth articulation
between climate objectives and efficient liberalization: existing planning and control is likely to limit free
market ups and downs and protect national electricity sector more than in the EU; however recommendations
for fixed costs remuneration are thus an issue to tackle through capacity mechanisms of other solutions.
References Asano, Hiroshi, and Mika Goto. 2013. “Chapter 23 - After Fukushima: The Evolution of Japanese Electricity
Market.” In Evolution of Global Electricity Markets, edited by Fereidoon P. Sioshansi, 715–38. Boston:
Academic Press.
Asociasion espanola de la industria Electrica. 2013. “UNESA - Historia.” UNESA.
Averch, Harvey, and Leland Johnson. 1962. “Behavior of the Firm under Regulatory Constraints.” Americain
Economic Review, no. 52: 1052–69.
Barroux, Rémi. 2016. “Pourquoi François Hollande propose un « prix plancher du carbone ».” Le Monde.fr,
April 26, sec. Planète.
Baumol, William J. 1977. “On the Proper Cost Tests for Natural Monopoly in a Multiproduct Industry.”
American Economic Review 67 (5): 809–22.
Beltran, Alain, and Martine Bungener. 1987. “Itinéraire D’un Ingénieur.” Vingtième Siècle. Revue D’histoire
15 (1): 59–68.
Buchanan, James M. 1975. The Limits of Liberty: Between Anarchy and Leviathan. University of Chicago
Press.
Creti, Anne. 2016. “Economic Criteria for Tarification - in the Synthesis Report of the Conference on Grid
Tarification (AEE, CGEMPE, CGR, CEEM).”
Delbeke, Jos, and Peter Vis, eds. 2015. EU Climate Policy Explained. London ; New York, NY: Routledge.
Eurelectric. 2015. “Power Statistics and Trends.”
European Commission. 1996. EUR-Lex - 31996L0092 - EN.
———. 2014a. “Energy Prices and Costs in Europe.”
———. 2014b. “Single Market Progress Report.”
———. 2015a. “A Framework Strategy for a Resilient Energy Union with a Forward-Looking Climate
Change Policy.”
———. 2015b. “Intended Nationally Determined Contribution of the EU and Its Member States.”
———. 2015c. “Renewable Energy Progress Report.”
———. 2015d. “State of the Energy Union - Climate Action Progress Report, Including the Report on the
Functioning of the European Carbon Market and the Report on the Review of Directive 2009/31/EC on the
Geological Storage of Carbon Dioxide.”

———. 2015e. “State of the Energy Union - Energy Efficiency Report - Assessment of the Progress Made by
Member States towards the National Energy Efficiency Targets for 2020 and towards the Implementation of
the Energy Efficiency Directive 2012/27/EU as Required by Article 24 (3) of Energy Efficiency Directive
2012/27/EU.”
———. 2016. “Quarterly Report on European Electricity Markets.”
Exeltium. 2016. “The Project.” Exeltium. Accessed August 18.
Finon, Dominique, and Fabien Roques. 2013. “European Electricity Market Reforms: The ‘Visible Hand’ of
Public Coordination.” Economics of Energy & Environmental Policy 2 (2). doi:10.5547/2160-5890.2.2.6.
FTI Intelligence. 2015. “Toward the Target Model 2.0.”
Galland, Jean-Baptiste. 2016. “The Distributor’s Point of View - in the Synthesis Report of the Conference on
Grid Tarification (AEE, CGEMPE, CGR, CEEM).”
Glachant, Jean-Michel. 2000. “Les pays d’Europe peuvent-ils reproduire la réforme électrique de
l’Angleterre? Une analyse institutionnelle comparative.” Économie & prévision 145 (4): 157–68.
Goto, Mika, Tomohiro Inoue, and Toshiyuki Sueyoshi. 2013. “Structural Reform of Japanese Electric Power
Industry: Separation between Generation and Transmission & Distribution.” Energy Policy 56 (May): 186–
200.
Government of UK. 2014. “Carbon Price Floor: Reform. Business Tax – Policy Paper.”
———. 2015. “UK Offshore Wind: Opportunities for Trade and Investment - GOV.UK.”
Grand, Emmanuel, and Thomas Veyrenc. 2011. L’Europe de L’électricité et Du Gaz. Econometrica.
Ibeas Cubillo, Diego. 2011. “Review of the History of the Electric Supply in Spain from the Beginning up to
Now.” Bachelor Thesis.
IEA. 2012. World Energy Outlook 2012.
———. 2015. World Energy Outlook 2015. Organization for Economic Co-operation and Development.
IPCC. 2014. “Climate Change 2014: Mitigation of Climate Change. Contribution of Working Group III to the
Fifth Assessment Report of the Intergovernmental Panel on Climate Change, Chapter 14: Regional
Development and Cooperation.” Cambridge University Press, Cambridge, United Kingdom and New York,
NY, USA.
Jamme, Dominique. 2016. “Issues in the Tarification of Electricity Grid (TURPE) - in the Synthesis Report of
the Conference on Grid Tarification (AEE, CGEMPE, CGR, CEEM).”
JEPIC. 2016. “Symposium: ‘Upcoming Issues for Post-Liberalization Electricity Market’ 「全面自由化後の
電力市場と今後の課題」 - in Japanese.”
Kahn, Alfred E., and George Eads. 1971. “A. E. Kahn: The Economics of Regulation.” The Bell Journal of
Economics and Management Science 2 (2): 678.
Keay, Malcolm. 2016. Electricity Markets Are Broken: Can They Be Fixed? Oxford Institute for Energy
Studies.
Keay, Malcolm, and David Buchan. 2016. “Europe’s Energy Union - a Problem of Governance.” Oxford
Institute for Energy Studies. Accessed April 26.
Khalilpour, Rajab, and Anthony Vassallo. 2015. “Leaving the Grid: An Ambition or a Real Choice?” Energy
Policy 82 (July): 207–21.
Le Monde. 2016. “Le prix plancher du CO2 en France ne concernera que les centrales électriques au
charbon.” Le Monde.fr, July 11, sec. Planète.
Leibenstein, Harvey. 1966. “Allocative Efficiency vs. ‘X-Efficiency.’” The American Economic Review 56:
392–415.
Meeus, Leonardo. 2016. “Evolution of Regulation for New Services and Uses - in the Synthesis Report of the
Conference on Grid Tarification (AEE, CGEMPE, CGR, CEEM).”
METI, Agency for Natural Resources and Energy. 2015. “Electricity Market Reform in Japan.”
METI/ANRI. 2015. “Long-Term Energy Supply and Demand Outlook.”
Newbery, David. 2002. “Problems of Liberalising the Electricity Industry.” European Economic Review 46
(4–5): 919–27.
Newbery, David, G. Strbac, D. Pudjianto, P. Noël, Booz & Co., and LeighFisher. 2013. “Benefits Of An
Integrated European Energy Market Final Report for DG ENER.”
Newbery, Mark. 2015. European Energy Handbook 2015: A Survey of Current Issues in the European
Energy Sector.
Peltzman, Sam. 1976. “Toward a More General Theory of Regulation.” The Journal of Law and Economics
19 (2): 211.
Perrot, Anne. 2002. “Les Frontières Entre Régulation Sectorielle et Politique de La Concurrence.” Revue
Française D’économie 16 (4): 81–112.
Platts. 2016. “European Electricity Assessments and Indices.”
Robinson, David. 2015. The Scissors Effect: How Structural Trends and Government Intervention Are
Damaging Major European Electricity Companies and Affecting Consumers. Oxford Institute for Energy
Studies.
Roques, Fabien, and Charles Verhaeghe. 2016. “Benchmark of Tarification for Distribution Grid - in the
Synthesis Report of the Conference on Grid Tarification (AEE, CGEMPE, CGR, CEEM).”
RTE. 2014. “French Capacity Market - Report Accompanying the Draft Rules.”
RTE, and ADEME. 2016. “CO2 Price Effect on Power Generation Mix (Effets Prix Du CO2 Sur Mix
Électrique).”
Schwarz, Virgnie. 2016. “Tariffs as Energy Policy Instruments- in the Synthesis Report of the Conference on
Grid Tarification (AEE, CGEMPE, CGR, CEEM).”
Sharkey, William, and Gavin C. Reid. 1983. “The Theory of Natural Monopoly.” The Economic Journal 93
(372): 929.
Sioshansi, Fereidoon P. 2014. “Introduction: The Rise of Decentralized Energy.” In Distributed Generation
and Its Implications for the Utility Industry, edited by Fereidoon P. Sioshansi, xxxiii–li. Boston: Academic
Press.
Stiglitz, Joseph E. 1976. “Monopoly and the Rate of Extraction of Exhaustible Resources.” American
Economic Review 66 (4): 655–61.
Thouvenin, Vincent. 2016. “The Transmission Operator’s Point of View - in the Synthesis Report of the
Conference on Grid Tarification (AEE, CGEMPE, CGR, CEEM).”
UNFCC. 2015. “INDCs as Communicated by Parties.”