are employee stock options liabilities or equity? · are employee stock options liabilities or ......
TRANSCRIPT

Are Employee Stock Options Liabilities or Equity?
Mary E. Barth Stanford University
Leslie D. Hodder Indiana University
Stephen R. Stubben The University of North Carolina at Chapel Hill
October 2011
We wish to thank Patrick Hopkins, Jim Wahlen, Michael Kirschenheiter, Stephen Penman, and workshop participants at The Wharton School of the University of Pennsylvania, Florida International University, Harvard University, Oklahoma University, Singapore Management University, and Brigham Young University for helpful discussions and comments. Leslie Hodder gratefully acknowledges financial support from Ernst and Young, LLC.

Are Employee Stock Options Liabilities or Equity?
Abstract
This study seeks to determine whether employee stock options have characteristics of liabilities
or equity, which is an open financial reporting question. As predicted, we find that common
equity risk and expected return are negatively associated with the extent to which a firm has
outstanding employee stock options, which is inconsistent with the options having characteristics
of liabilities. We also find that the association is less negative for firms that reprice options and
firms that have longer-term options, which indicates that some employee stock options have
characteristics that make them more similar to debt. In addition, we find that the sensitivity of
employee stock option value to changes in asset value mirrors that of common equity value and
is opposite to that of debt value. The evidence also reveals that, unlike liabilities, employee
stock options have substantially higher risk and expected return than common equity. Our
findings are not consistent with classifying employee stock options as liabilities for financial
reporting purposes; rather, the options act as a second type of equity. Our analyses and findings
suggest a classification scheme for claims against the firm—namely, classify as liabilities
(equity) claims that increase (decrease) common equity risk and expected return.

1
Are Employee Stock Options Liabilities or Equity?
I. INTRODUCTION
We address whether employee stock options have characteristics of liabilities or of
equity. In particular, we seek to understand the relation between employee stock options and the
risk of and expected return on common equity. This understanding is important in assessing the
role of employee stock options in the capital structure of the firm, and is relevant to the debate
about whether employee stock options should be classified as liabilities or equity for financial
reporting purposes. Our tests focus on the signs of the associations between the risk of and
expected return on the firm’s common equity and the extent to which a firm has outstanding
employee stock options. Finance theory predicts that leverage increases the risk of and expected
return on common equity. Thus, if the associations between employee stock options and
common equity risk and return are positive, we infer that employee stock options have
characteristics of liabilities. If the associations are negative, we infer the opposite. We find that
the extent to which a firm has outstanding employee stock options is significantly negatively
related to both common equity risk and the expected return on common equity, which is
inconsistent with employee stock options having characteristics of liabilities.
Our study is relevant to the current financial reporting debate about what characteristics
should distinguish liabilities and equity for financial reporting purposes. Thus far, the Financial
Accounting Standards Board (FASB) and the International Accounting Standards Board (IASB)
have been unable to develop a clear principle that distinguishes liabilities from equity for
financial reporting. There is no debate about whether existing common stock should be
classified as equity and straight debt should be classified as liabilities. However, equity for
financial reporting need not be limited to existing common equity. The debate is about whether
2
financial instruments embodying other types of claims against the firm’s assets should be
classified as other types of equity or as liabilities and, if so, what characteristics of those
instruments are relevant to determining the classification.
The FASB’s current Conceptual Framework defines equity as the residual of assets minus
liabilities, where liabilities are present obligations, the settlement of which requires a transfer of
the firm’s assets. However, this characterization of liabilities is subject to criticism because
determining whether a present obligation exists is subjective, and because the form of settlement
is subject to structuring. For these reasons, a growing body of literature and the FASB’s
Preliminary Views on how to account for financial instruments with characteristics of equity
advocate classifying all claims other than common stock as liabilities. This is referred to as the
“basic ownership” approach because it would classify only basic ownership instruments, i.e.,
common stock, as equity and classify all other claims as liabilities. Under the basic ownership
approach, most preferred stock and contingent claims—including employee stock options—
would be classified as liabilities, unless they are specifically exempted from the approach. In
part because of this, there has been resistance to adopting the basic ownership approach. We
inform this debate by showing that the relation between a financial claim and the risk of and
expected return on existing common equity—for which there is no financial reporting
classification debate— can be used to distinguish liabilities from equity.
Our predictions and tests are based on warrant pricing theory. Although the value of
employee stock options is commonly estimated using option pricing models, employee stock
options are warrants. For our study, a key difference between warrants and options is that the
two types of instruments differ with respect to the entity responsible for their settlement. In
particular, whereas warrants are claims against and settled by the firm, options on a firm’s shares
3
are claims against other entities that wrote options on a firm’s shares. Because warrants are
issued and settled by the firm, the issuance of warrants—e.g., employee stock options—should
affect the risk of and expected return on all existing equity claims. Theory predicts that the
issuance of warrants decreases the expected risk of and return on the firm’s common equity,
which is consistent with employee stock options de-levering the firm’s common equity, not
levering it as do liabilities. This is not true of options on the firm’s shares written by other
entities, which have no effect on the firm’s capital structure.
Although finance theory outlines the implications of employee stock options for common
equity risk and expected return, empirical tests of these implications are absent from the
literature. We fill this void by testing the relations between common equity risk and expected
return and the extent to which the firm has employee stock options outstanding. First, we test
whether common equity risk is positively or negatively associated with the extent to which a
firm has employee options outstanding. We use two measures of common equity risk—realized
common equity volatility and common equity volatility implied by the prices of a firm’s traded
options. Following prior research, our tests include controls for leverage, credit risk, firm size,
earnings, change in earnings, and analyst forecasts of earnings growth. In addition, because
riskier firms might issue more options and because options can provide incentives for risk-
taking, we also include controls for a firm’s propensity to issue options and for subsequent risky
investment. Second, we test whether the expected return on common equity is positively or
negatively associated with the extent to which a firm has employee options outstanding. Our
measure of expected return is an estimate of expected cost of capital based on the Fama-French
and momentum factors. Following prior literature, our expected return tests include controls for

4
leverage, firm size, equity book-to-market ratio, beta, momentum, analyst forecasts of earnings
growth, and dispersion in analyst forecasts.
We find that common equity risk is significantly negatively associated with the extent to
which the firm has outstanding employee stock options, using both measures of equity risk. Also
consistent with finance theory, we find that the relation between employee stock options and the
risk of common equity is significantly less negative for firms with longer option terms and for
firms that reprice options. These findings indicate that options with these attributes affect
common equity more like debt than options without these attributes. For firms with longer-term
options, the relation between employee stock options and common equity risk is significantly
negative, which indicates that these options have characteristics of equity and, thus, are only
somewhat more like debt than shorter-term options. However, for firms that reprice options, the
relation between options and common equity risk is not negative, which indicates that these
options do not have characteristics of equity. These findings reveal that employee stock options
can have terms that negate the equity-like characteristics of warrants.
We also find that the expected return on common equity is significantly negatively
associated with the extent to which the firm has outstanding employee stock options. These
findings support the predictions of finance theory and indicate that employee stock options de-
lever a firm’s common equity, not lever it. Therefore, our findings suggest it would be
inappropriate to classify employee stock options as liabilities for financial reporting purposes.
We next provide evidence on the sensitivity to changes in the value of the firm’s assets of
the value of employee stock options, the value of debt, and the value of common equity. Finance
theory predicts that debt and equity values respond differently to changes in asset value. In
particular, theory predicts that the elasticity of debt value to changes in asset value is concave,

5
whereas that of common equity value is convex. Thus, as the value of a firm’s assets exceeds the
value of its debt by a larger margin, the sensitivity of debt value to changes in asset value
approaches zero and the sensitivity of equity value to changes in asset value approaches one. To
assess the elasticity of employee stock option values, we use a recently developed warrant
pricing model. Our empirical tests reveal that the sensitivity of employee stock option values to
changes in asset value is convex, similar to that of common equity value. In contrast but
consistent with theory, our empirical tests show that the sensitivity of liability values to changes
in asset value is concave. These findings confirm the inferences from our primary tests that
employee stock options share the risk and return characteristics of common equity, but do not
share these characteristics of liabilities.
We use our estimates of expected common equity return and parameter estimates from
the warrant pricing model to estimate the expected return on employee stock options. We find
that the expected return on options averages approximately 70% more than the expected return
on common equity. These findings indicate that employee stock options are substantially more
risky than non-option equity, which also is inconsistent with the options sharing the
characteristics of liabilities.
The remainder of the paper proceeds as follows. Section II discusses the background for
our inquiry and related research, and Section III outlines our research design. Section IV
describes our data and presents our findings relating to equity risk and expected return. Section
V presents evidence on how the values of debt, employee stock options, and non-option equity
respond to changes in asset value, and estimates of the expected return on employee stock
options. Section VI summarizes and concludes.

6
II. BACKGROUND AND RELATED RESEARCH
Capital structure effects of employee stock options
Although the value of employee stock options is commonly estimated using option
pricing models, the terms of employee stock options differ from those of traditional options as
specified in these models. Employee stock options are warrants that firms issue to employees as
compensation for services. Warrants are call options on the firm’s assets, not on its existing
common equity. Warrants have a fixed strike price and maturity and are settled on exercise
when the warrant holder conveys the strike price to the firm and the firm issues additional shares
of stock to the warrant holder. Warrant exercise increases the firm’s cash and, because warrant
holders only exercise warrants when they are in the money, dilutes its existing common equity.
In contrast, options are written and exercised outside of the firm. Thus, option exercise does not
affect the firm’s assets, liabilities, or equity. In addition, whereas options can be traded,
employees cannot sell or otherwise transfer employee stock options. Each of these differences
can cause option values and employee stock option, i.e., warrant, values to diverge.1
That the exercise of employee stock options modifies the capital structure of the firm is
obvious. Option exercise causes the firm to issue new shares of common stock and to receive the
strike price in cash, thereby increasing both the number of common shares outstanding and the
total assets of the firm. Less obvious are the capital structure modifications that occur when the
firm issues the options. Finance theory shows that issuing warrants increases the expected value
In addition,
warrants have implications for capital structure that options do not.
1 Li and Wong (2005) estimates that the value of employee stock options is overstated by 6% when option pricing models are used. In section V, we also find that employee stock option value estimates are overstated when option pricing models are used, although our mean overstatement is larger—50%, i.e., 4% of market value of common equity compared to 6%. The difference in overstatement estimates may be attributable to sample period or estimation method. The Li and Wong (2005) sample period is 1996 through 2001, whereas ours is 2004 through 2009, which likely includes years of greater equity volatility that affects option values. Our estimation method differs from that in Li and Wong (2005) in that we jointly estimate the volatilities and values of employee stock options and common equity.

7
of the firm’s assets and decreases the expected risk of and return on the firm’s equity (e.g., Daves
and Ehrhardt 2007). This occurs for three reasons. First, employees pay for the options with
their services, leaving additional cash in the firm that can be used for other purposes.2
Because our interest is in determining whether employee stock options have
characteristics of liabilities, our tests focus on the third capital structure effect. In particular, if
employee stock options are associated with lower risk of and expected return on common equity,
then we infer that the options do not have characteristics of liabilities.
Second,
the expected exercise price of the options is anticipated by the firm and its claimants from the
date the firm issues the options. Therefore, the expected value of the firm’s assets increases with
the number of employee stock options issued; employee stock options are an additional,
potentially dilutive claim against this larger expected asset base. Third, the issuance of employee
stock options decreases the expected risk of, and thus the expected return on, existing common
equity. A decrease in common equity risk and expected return is consistent with the options
having a de-levering effect on the firm’s common equity. Intuitively, this is what would occur if
the firm sold a fraction of its risky assets at current value and invested the proceeds in a riskless
bond. When the firm receives the bond proceeds at maturity, it will purchase additional risky
assets at their value at that time. In this way, equity holders are insulated from asset risk between
the options’ issue date and exercise date.
Liabilities and equity in financial reporting
Although liabilities and equity are distinct financial statement elements, there is a lack of
consensus among accountants as to whether and how to draw a line between liabilities and 2 Option compensation procures labor resources that are provided over the vesting service period. This is a key factor in the FASB’s decision to require the grant-date value of options to be recognized as an expense over the vesting period. In addition, options affect the incentives of employees. We focus on the direct capital structure effects of options, rather than on the incentive effects. However, our tests include controls for possible risk-taking incentive effects.

8
equity, and which type of claim is embodied in employee stock options. Achieving consensus on
the distinction between liabilities and equity—and, thus, determining which claims of the firm
are classified in which category—is crucial for the current financial reporting model. The
identification of liabilities is important for assessing solvency. In addition, the distinction
between liabilities and equity has a direct subsequent effect on net income—after initial
recognition, changes in the recognized amounts of liabilities are recognized in comprehensive
income but corresponding changes in equity are not.3
Early accounting theorists present conflicting views of liabilities and equity. Sprague
(1907) advances a proprietary theory of the firm in which the separation of liabilities from equity
is necessary to assess solvency and determine profitability. In contrast, Paton (1962) suggests
that debt and equity claims are inherently indistinguishable because all claimants participate to
some extent in the risks and rewards of the firm. Assuming the profitability of operations is
unaffected by financing decisions, Paton (1962) reasons that the classification of claims into debt
and equity is arbitrary and largely irrelevant as long as operating profit, which excludes all
capital financing costs, is separately identified. The current financial reporting model is more
For example, if employee stock options
were classified as liabilities, then changes in the value of the options are candidates for
recognition as expenses. If they are classified as equity, then changes in their values are not
candidates for expense recognition. Without a clear distinction between the two claims
classifications, perhaps the most fundamental financial reporting amount—earnings—is ill-
defined.
3 Debt capital maintenance costs are recognized in comprehensive income as interest expense. Changes in the recognized amounts of liabilities that result in expense recognition include, but are not limited to, accretion of issue discount, amortization of issue premium, remeasurement to fair value, and settlement or cancellation at amounts that differ from recognized liability amounts at the time of settlement. Because current accounting theory and concepts provide that equity capital maintenance costs are not recognized as expenses, similar or corresponding equity events do not result in expense recognition.

9
consistent with the former view; liabilities are separately defined and net income reflects the cost
of debt capital, but not the cost of equity capital.
However, the lack of consensus about characteristics that distinguish liabilities and equity
is reflected in current accounting standards relating to financial instruments, which include over
60 pieces of literature that have been called “inconsistent…(and) difficult to understand and
apply” (FASB 2007, iii). The FASB’s current Conceptual Framework defines liabilities as
probable future sacrifices of the firm’s assets arising from a present obligation (FASB 1985,
para. 35). This definition rests primarily on two factors: the existence of a present obligation and
the requirement to transfer the firm’s assets in settlement. However, this definition of liabilities
is subject to criticism because determining whether a present obligation exists is subjective, and
because the form of settlement is subject to structuring. For these reasons, a growing body of
literature advocates changing the definition of liabilities to include all claims other than common
stock (e.g., Kirschenheiter et al. 2004; Ohlson and Penman 2005).
In a move toward this definition, the FASB released Preliminary Views: Financial
Instruments with Characteristics of Equity (“Preliminary Views,” FASB 2007) to solicit
comments on its proposal that a basic ownership approach to equity classification would improve
financial reporting. The Preliminary Views notes that distinguishing liabilities from equity by
applying the current definition of liabilities is subjective, particularly to complex instruments
with contingent settlement outcomes. For example, under current requirements, a written call
option is classified as a liability if it must be settled with cash, but is classified as equity if it can
be settled with shares. In contrast to current Generally Accepted Accounting Principles (GAAP),
the basic ownership approach would classify as equity only common stock, i.e., there would be
only one type of equity. As a result, preferred stock, options, and other contingent claims would

10
be classified as liabilities under the FASB’s proposed basic ownership approach, rather than as
different types of equity.
The basic ownership approach arguably is less subjective and easier to apply than the
current definition of liabilities because it obviates the need (1) to identify the essential
characteristics of liabilities and (2) to determine whether particular instruments have such
characteristics. Under the basic ownership approach, liabilities comprise any claim that is not
the basic ownership interest, irrespective of whether the claim embodies a present obligation.
However, defining equity as only basic ownership interests means that liabilities would be the
residual category for claims against the firm’s assets. This is in contrast to the current definition
of equity as the residual of assets minus liabilities, and could lead to a classification system that
fails to reflect appropriately those characteristics of non-basic ownership claims that affect the
risk of and expected return on the basic ownership interests.
Consistent with these concerns, critics of the basic ownership approach to equity
classification believe that classifying as liabilities both present obligations and non-obligating
financing instruments would result in a heterogeneous class of liabilities and “an artificially
narrow set of equities that will decrease the usefulness of the balance sheet, both for assessing a
firm’s solvency, and for valuing its residual claims” (FASAC, 2001, page 388).4
4 Consistent with this view, Terando et al. (2007) presents empirical evidence that market participants differentially value share puts based on their solvency characteristics.
These critics
believe that the decision-usefulness of liability and equity classification derives from defining
and identifying liabilities, not from defining and identifying the most basic ownership interest.
This need to identify liabilities is consistent with the theoretical finance literature that
models risk of and expected return on common equity as a function of financial leverage
(Hamada 1969; Rubinstein 1973). The importance of leverage is demonstrated by the model in

11
Robichek and Myers (1966), among others, which shows that leverage can have a negative effect
on common equity value when bankruptcy is possible, or when leverage affects future
investment and growth. These studies conceptualize liabilities in terms of unavoidable
obligations to surrender firm assets in particular states of the world, and suggest that
distinguishing obligations from other claims is important for financial statement analysis and
assessing the risk and value of common equity.
The possibility that financing constraints and bankruptcy costs can affect the value of
equity is inconsistent with Paton’s (1962) view of the entity, which is based largely on the
premise that operating and financing decisions are independent and that financing decisions are
irrelevant for valuation of the firm. We posit that if finance theory is empirically descriptive,
then reporting liabilities separately from equity and disaggregating claims using a classification
scheme based on their identifiable risk and return characteristics should be useful to investors for
valuing common equity and for assessing its risk and expected return.
With regard to classification, several studies view employee stock options as more akin to
liabilities than to equity (e.g., Clark 1993; Balsam 1994; Hull and White 2003; Kirschenheiter et
al. 2004; Maines et al. 2004; Ohlson and Penman 2005; Sacho and Oberholster 2005; Landsman
et al. 2006). Some of these studies contend that the current financial reporting conceptual
framework requires options to be classified as liabilities because options reflect claims of
potential owners rather than existing owners (e.g., Clark 1993). Others contend that the issuance
of options creates a conditional obligation to issue common stock for less than its market value in
some potential future states of the world, that these conditional obligations are sufficiently
“present” to meet the definition of a liability, and that value estimates derived from valuation
12
models are the most appropriate measures of these obligations at any reporting date
(Kirschenheiter 2004; Ohlson and Penman 2005).
However, the more prevalent rationale for classifying employee stock options as
liabilities is the perspective that the exercise of options results in a “windfall gain” to option
holders that the firm should recognize as an expense. Because changes in the value of equity are
not recognized in net income, this perspective suggests that recognition in net income of changes
in option value subsequent to the grant date requires the options to be classified as liabilities.
Inferring liability or equity classification from desired effects on net income would be a new
approach to determining financial statement element classification.5 Hull and White (2003)
takes this perspective to an extreme and expresses the view that liability or equity classification
is entirely irrelevant for employee stock options, but that “proper accounting” requires expense
recognition of changes in the option value subsequent to grant.6
Little extant empirical research attempts to identify the characteristics of employee stock
options that are relevant for determining the appropriate classification of the options in the
statement of financial position. Li and Wong (2005) and Landsman et al. (2006) document that
employee stock options must be considered when using a residual income model to estimate the
value of common equity. This is because net income accrues for the combined benefit of
employee stock option holders and common equity holders, and failure to account for the
fraction of income accruing for the benefit of option holders causes the residual income model to
overstate the estimated value of equity. Li and Wong (2005) approaches the problem by using
total residual income to estimate the combined value of employee stock options and common
5 For example, preferred stock is classified as equity. Preferred dividends are recognized as an expense in determining net income available to common equity holders, but not in determining net income. 6 Exercise date value of employee stock options is frequently accepted as the “real cost” of compensation. For example, Core, Guay, and Larcker (2008) finds that negative press coverage about potentially excessive executive compensation focuses more on the proceeds from option exercises than on grant-date values.

13
equity and then subtracting the option value estimated from a warrant pricing model to derive an
estimate of common equity value.
Landsman et al. (2006) evaluates the relative explanatory power of alternative “pro-
forma” methods of accounting for employee stock options, and finds that subtracting option
value from total residual income over the term of the options increases the cross-sectional
explanatory power of the residual income model for common equity value.7
Although both Li and Wong (2005) and Landsman et al. (2006) document the importance
of separately considering employee stock option value when valuing common equity, neither
directly addresses the classification of employee stock options as liabilities or equity based on
the relation between the options and the risk and return characteristics of common equity.
Similar to Kirschenheiter et al. (2004), Landsman et al. (2006) infers liability classification from
the apparent need to account for the value of employee stock options when valuing common
equity. In contrast, we posit that classification in the statement of financial position should
derive from capital structure effects, including risk and return.
Landsman et al.
(2006) concludes that employee stock options should be classified as liabilities and changes in
option value each period should be included in net income. However, as Aboody (2006) points
out, the residual income model cannot be used to assess the efficacy of alternative methods of
accounting because if the residual income model is applied correctly, one should always be able
to recover the value of common equity. Thus, Landsman et al. (2006) can be viewed as a
comparison of hypothetical valuation errors that would occur if investors failed in specified ways
to correctly incorporate available information when applying the residual income model.
8
7 Subtracting estimated option value from total residual income implicitly assumes that the estimated option value equals the expected present value of residual income accruing to option holders.
8 That the residual income model is equivocal with respect to liability or equity classification can be illustrated by considering a firm with common equity and traded warrants. For residual income to explain the current value of the

14
We contribute to the debate about the appropriate classification of employee stock
options by identifying empirically those characteristics that differentiate liabilities from common
equity. We show that employee stock options are negatively associated with common equity risk
and the expected return on common equity. That is, we show that the effects of employee stock
options on common equity risk and expected return are opposite to those of debt—debt is
positively associated with common equity risk and expected return. These findings suggest that
options should not be classified as liabilities.
Relation between warrants and equity risk and return
Modigliani and Miller (1958) shows that in the absence of taxes and transaction costs,
although total firm value is independent of leverage, the cost of equity varies positively with the
debt-to-equity ratio. That is, Modigliani and Miller (1958) shows that a firm’s equity risk
increases when it issues debt, and the expected return on equity reflects a risk premium
commensurate with this increased risk. Extending the work of Modigliani and Miller (1958,
1963), Hamada (1972) empirically shows that, in the cross-section, realized equity returns are
increasing in leverage.9
However, the theoretical effects of contingent claims on common equity risk and return
are not as straightforward as are the effects of straight debt. Ingersoll (1977) models the value of
convertible debt as a combination of the values of straight debt and a warrant with an exercise
price equal to the amount of implied straight debt. One implication of Ingersoll’s (1977) model
is that the net effect of convertible debt on common equity risk is a product of two countervailing
warrants without error, the value of common equity must be deducted from residual income. However, we do not view this implying that common equity should be classified as a liability when a firm has traded warrants. 9 More recent studies testing the relation between leverage and equity returns report contradictory results. For example, Penman et al. (2007) finds that leverage is negatively related to realized equity returns and Korteweg (2004) finds that equity factor loadings decrease after equity-for-debt exchanges. Empirical deviations from Modigliani and Miller (1958) are collectively referred to as the “leverage puzzle”.

15
forces: common equity risk increases with the implied amount of straight debt and decreases
with the implied amount of the warrant. Galai and Schneller (1978) extends Ingersoll (1977) and
develops a structural model for separately pricing warrants on levered common equity.
Consistent with Ingersoll’s (1977) analysis, Galai and Schneller’s (1978) model predicts that the
issuance of warrants decreases the risk of and expected return on the firm’s common equity.
Consistent with Modigliani and Miller’s (1958) result for debt, warrant valuation models assume
that the issuance of warrants does not result in a change to common equity value (Ukhov 2004;
Daves and Ehrhardt 2007). Because warrants are settled by the firm receiving cash and issuing
stock, the issuance of warrants at their current value is equivalent to the contingent sale of a
fraction of the firm at its current value in return for a riskless receivable.10
Appendix A presents a numerical example to illustrate the implications of this theoretical
literature. Intuitively, common equity risk decreases as warrants outstanding increase because by
issuing warrants the firm effectively sells a portion of the upside asset return potential for its
current value.
11 This transfer truncates both tails of the return distribution for common equity,
thereby reducing the variance of its return. As Figure 1 in Appendix A shows, assuming there is
no uncertainty, the issuance of warrants is identical to a stock subscription, and neither the value
of nor the expected return on existing equity changes. However, as Figure 2 in Appendix A
shows, in the more realistic case of uncertainty, although the value of existing common equity
does not change when a firm issues warrants, the risk of and expected return on existing common
equity both decrease.12
10 By focusing our tests on common equity risk and expected return, we implicitly assume that the Modigliani and Miller (1958) capital structure irrelevance proposition holds, at least on average.
That is, the issuance of warrants de-levers common equity.
11 In the example, this value is $9.00. 12 The deductibility of employee stock option intrinsic value for tax purposes can provide tax benefits relative to other types of financing. As with debt tax shields, these stock option tax benefits potentially further reduce the cost of financing with options. We leave to future research the analysis of the relation between employee stock option tax benefits and the value of and expected return on common equity.

16
Empirical estimation of Galai and Schneller’s (1978) model parameters requires
knowledge of the value of the firm’s assets and the variance of the assets’ return, both of which
are unobservable. Largely as a result of the identification problem this lack of observability
poses, the empirical validity of Galai and Schneller’s (1978) pricing model remains an open
question (e.g., Noreen and Wolfson 1981; Galai 1989). As a solution to the identification
problem, Ukhov (2004) develops an algorithm using only observable inputs for pricing warrants
on levered common equity and for determining the variance of the warrants’ return. The Ukhov
(2004) algorithm can be solved numerically, and provides a mechanism for computing the price
and the variance of each of class of claims for a firm with a complex capital structure. More
recently, as Appendix B explains, Daves and Ehrhardt (2007) shows how to compute the
expected return on various capital structure components using observable data. We use the
Daves and Ehrhardt (2007) methodology to compute the value of and expected return on
employee stock options in Section V.
Despite the theoretical basis for expecting that warrants de-lever common equity, the
association between warrants and the risk of and expected return on common equity have not
been established empirically. The theoretical models are based on assumptions, which may not
be descriptively valid, particularly for employee stock options. For example, employee stock
options frequently are issued to insiders who may have the ability to influence the firm to amend
their option contracts after issuance. Such implicit contractual terms may create contracts that do
not meet the definition of a warrant. Repricing the options is an example of such an option
contract amendment because repricing negates the fixed strike price feature of a warrant. In
addition, the warrant models assume markets are complete, and the inability of employees to sell
their options is a form of market incompleteness with unclear implications for the models’

17
predictions. Moreover, distributional assumptions underlying the models’ predictions might not
be descriptive (Galai 1989). Therefore, testing the predictions of the models is necessary if the
theoretical effects of warrants on common equity are to be used as a basis for their financial
statement classification.13
We contribute to this literature by testing the predictions of the warrant valuation models
as they relate to employee stock options. That is, in contrast to debt, employee stock options are
predicted to be negatively associated with the risk of and expected return on common equity.
We also provide evidence on how changes in the values of employee stock options and common
equity correspond to changes in the firm’s asset value, and on the magnitude of the expected
returns on these two types of claims. Consistent with the models’ predictions, we find that as the
firm’s distance to default increases, the sensitivities of common equity and employee stock
option values to changes in asset value increases, and the sensitivity of debt value to changes in
asset value decreases. That is, common equity and employee stock option values are convex in
asset value, and liability values are concave. We also find that the expected return on employee
stock options is on average 70% greater than the expected return on common equity, which is
inconsistent with employee stock options being a claim against a firm’s assets with higher
priority than common equity.
III. RESEARCH DESIGN Common equity risk
We first test whether common equity risk is negatively associated with the extent of
outstanding employee stock options, as predicted by finance theory. To do so, we estimate
equation (1), using two measures of equity risk, RISK. 13 For example, evidence from empirical validation of the Black-Scholes (1973) option pricing model indicates that the model is generally descriptive. However, market prices frequently deviate from those predicted by the model (see Mayhew 1995 for discussion). In general, the model does not perform well for options that are far out of the money.
18
ttttt
tttttt
RDCHANGEPROPENSITYGROWTHEARNCHANGEEARNSIZECREDITRISKLEVERAGEOPTIONSRISK
εββββββββββ
++++++++++=+
__ 9876
5432101 (1)
Our first measure of RISK is the annualized standard deviation of the logarithm of monthly stock
returns, EQUITYVOL. The second is equity volatility implied by the prices of a firm’s traded
options, IMPLIEDVOL. Specifically, IMPLIEDVOL is the average of the implied volatilities
from the firm’s call and put options with the longest maturity and strike price closest to the
firm’s stock price. Because not all firms have traded options, we estimate equation (1) using
IMPLIEDVOL as the measure of equity risk based on a smaller sample. We estimate
EQUITYVOL using returns over year t + 1, and IMPLIEDVOL at the end of year t. We measure
all other variables in equation (1), and equation (2) below, at the end of year t or during year t,
depending on the nature of the variable.
Our primary interest is in the coefficient on the extent to which the firm has outstanding
employee options, i.e., β1, the coefficient on OPTIONS. OPTIONS is the number of employee
stock options outstanding divided by the sum of common shares outstanding and employee stock
options outstanding. We predict a negative coefficient on OPTIONS if employee options
decrease the risk of common equity.
Equation (1) includes several variables as controls for factors known to be associated
with equity risk. We include LEVERAGE, the ratio of current plus long-term debt to the sum of
debt and the market value of common equity, as a control for the amount of straight debt in the
firm’s capital structure. Consistent with Modigliani and Miller (1958), we expect that equity risk
is positively associated with leverage. Because leverage is only one component of default risk,
we also include CREDITRISK as a control for credit risk. CREDITRISK is the firm’s fitted bond
rating estimated from a bond rating regression (Barth, Beaver, and Landsman 1998; Barth,

19
Hodder, and Stubben 2008).14 Specifically, we estimate the relation between a firm’s credit
rating and financial statement variables, i.e., assets, return on assets, leverage, and indicator
variables for whether a firm pays dividends, has subordinated debt, and reports negative
earnings, for the subsample of firms with credit ratings.15
Prior research finds a negative relation between firm size and equity risk (Pastor and
Veronesi 2003). Thus, we include in equation (1) SIZE, which is the natural logarithm of the
market value of equity, and expect it has a negative association with equity risk. Hanlon,
Rajgopal, and Shevlin (2004) finds that operating performance is negatively associated with
equity volatility in the cross-section. Thus, we include in equation (1) earnings, EARN, and
change in earnings, CHANGE_EARN, as controls for operating performance. EARN is annual
income before extraordinary items divided by total assets, and CHANGE_EARN is the change in
EARN from year t – 1 to year t. We expect EARN is negatively associated with equity risk. We
do not predict the sign of the association for CHANGE_EARN; CHANGE_EARN may reflect
operating performance that is negatively associated with equity risk or short-term growth that is
positively associated with equity risk.
We then apply the estimated
coefficients from this relation to the financial statements amounts of the sample firms to obtain
fitted values for credit risk. We expect that credit risk is positively associated with equity risk.
Because higher long-term growth typically is associated with higher risk and can provide
opportunities for managers to profit from equity-based compensation, we include GROWTH, the
last consensus long-term earnings growth forecast, in equation (1) as a control for growth. In
addition, Core and Guay (2001) finds that firms with more growth opportunities grant options
14 Our tabulated findings are based on estimating the bond rating regression pooling observations over time. Estimating the regression separately year by year does not alter our inferences. 15 During our sample period, recognition of stock-based compensation expense became mandatory. Thus, to mitigate the potential for confounded coefficient estimates, we calculate return on assets using net income before stock-based compensation expense.

20
more frequently, suggesting GROWTH is likely to be positively correlated with OPTIONS.
Thus, failure to include a control for growth could bias the coefficient on OPTIONS. We expect
GROWTH is positively associated with equity risk.
Firms select whether to issue employee stock options, and there is evidence that firms
with greater operating risk and more growth opportunities are more likely to issue options.
Although we include GROWTH as a control for firms’ propensity to issue options, and SIZE and
CHANGE_EARN can reflect operating risk, there could be other factors associated with
OPTIONS and RISK that are not captured by these variables. Thus, we include in equation (1)
PROPENSITY as a control for firms’ propensity to issue options. We measure PROPENSITY
based on Core and Guay (2001). In particular, we estimate year by year the relation between
OPTIONS and the natural logarithm of the sum of market value of equity and book value of debt,
the natural logarithm of the number of employees, equity volatility, the book-to-market ratio,
research and development expense divided by total assets, and industry effects.16
Finally, options can provide incentives for managers to increase the risk of the firm’s
assets (DeFusco et al. 1990; Rajgopal and Shevlin 2002; Williams and Rao 2006).
PROPENSITY
is the predicted value from this relation. We expect a firm’s propensity to issue options is
positively associated with equity risk.
17
16 The relation in Core and Guay (2001) also includes segment information as measures of total diversification and geographic diversification. Because requiring the use of segment information dramatically reduces our sample size, we do not use segment information when constructing our propensity measure. However, untabulated analyses reveal that a propensity measure that includes segment information is 99% correlated with our propensity measure. Not surprisingly given this high correlation, our inferences are unchanged when we estimate equation (1) using the alternative propensity measure and the subsample of firms with available segment data.
As a control
for subsequent risky investment, we include in equation (1) CHANGE_RD (Coles et al. 2006).
17 Lambert, Larcker, and Verrecchia (1991) shows analytically that options can, for particular parameter values, decrease risk-taking incentives. Although the expected value of option payoffs increases with asset volatility, options are risky assets, and risk-averse, undiversified executives can become more risk-averse if options are a large component of compensation (Carpenter 2000). Thus, the association between options and risk-taking is situational.
21
CHANGE_RD is the year t + 1 research and development expense divided by total assets minus
year t’s research and development expense divided by total assets. We expect that an increase in
risky investment is positively associated with equity risk.
Expected return on common equity
We next test whether the expected return on common equity is negatively associated with
the extent of outstanding employee stock options, also as predicted by finance theory. To do so,
we estimate equation (2).
ttt
ttttttt
DISPERSIONGROWTHMOMBETABMSIZELEVERAGEOPTIONSECC
εβββββββββ
+++++++++=
87
6543210 (2)
ECC is the expected cost of common equity at the end of year t. Our estimate of ECC is based
on the Fama and French (1993) three-factor model supplemented with the momentum factor,
time-varying factor loadings, risk-free interest rates, and risk premiums. We calculate ECC
following Barth, Konchitchki, and Landsman (2010) by first estimating factor betas for each firm
using five-year rolling windows, updated annually, and then using these estimated betas, along
with expected factor returns based on historical averages, to estimate ECC. As with equation (1),
our primary interest is in the coefficient on OPTIONS, β1. We predict it is negative.
Equation (2) also includes as control variables proxies for factors commonly associated
with expected returns. As with equation (1), we include LEVERAGE in equation (2) and expect
a positive association between leverage and expected equity cost of capital. Based on prior
empirical studies, we also expect the cost of equity capital to be negatively associated with firm
size, SIZE, and to be positively associated with the firm’s equity book-to-market ratio, BM, and
stock return beta, BETA (e.g., Fama and French 1993). BM is the natural logarithm of the book
value of equity divided by the market value of equity. BETA is the coefficient on the market

22
return from firm-specific estimation of the relation between a firm’s monthly returns and the
market return, using five-year rolling windows.18
Jegadeesh and Titman (1993) examines price momentum and finds that past winners earn
substantially higher returns than past losers. Thus, we include price momentum, MOM, in
equation (2) and expect it has a positive association with expected equity cost of capital. MOM
is the firm’s raw return over the first ten months of year t. Beaver, Kettler, and Scholes (1970)
posits that high growth firms are more profitable because abnormal profits erode over time as a
result of competition. Thus, we include GROWTH in equation (2) and expect a positive
association between growth and expected equity cost of capital. Finally, because information
risk is positively associated with cost of equity capital (Botosan and Plumlee 2005), we include
DISPERSION in equation (2). DISPERSION is the coefficient of variation of year t earnings
forecasts outstanding in June of year t. We predict a positive association between analyst
forecast dispersion and expected equity cost of capital.
IV. DATA AND FINDINGS FOR EQUITY RISK AND EXPECTED RETURN
Data and descriptive statistics
We base our tests on a sample of U.S. firms over the period 2004 to 2009. Our sample
begins in 2004 because this is the first year employee stock option data are available on
Compustat for a broad set of firms. We obtain stock prices and returns from CRSP and analyst
forecasts from I/B/E/S. We calculate implied equity volatility using data from Optionmetrics
and the approach in Bartov, Mohanram, and Nissim (2007). We estimate equations (1) and (2)
using the pooled cross-sectional sample and base reported t-statistics on standard errors clustered
18 BETA is a proxy for systematic risk and options can increase systematic risk, idiosyncratic risk, or both. Market beta also is theoretically related to leverage. Our including BETA in equation (2) in addition to LEVERAGE is consistent with prior research examining the determinants of ECC. Excluding BETA from equation (2) has no effect on our inferences.

23
by firm and year to mitigate intertemporal and cross-sectional correlation of residuals (Gow,
Ormazabal, and Taylor 2010). We estimate several versions of equations (1) and (2) using
different combinations of the explanatory variables. We do so in part because lack of data
reduces the number of observations available for some variables.
Table 1, Panel A, presents descriptive statistics for each variable we use in our analyses.
Regarding our measures of equity risk and expected return, Panel A reveals that realized equity
volatility, EQUITYVOL, averages 47%, and implied volatility, IMPLIEDVOL, averages 45%.
Panel A also reveals that the mean of expected equity cost of capital, ECC, is 13%. Panel A
reveals that the mean of OPTIONS is 0.08, which indicates that the average ratio of options
outstanding to the total of common equity shares and option outstanding is 8%. This is slightly
larger than the 6.4% reported by Core and Guay (2001) over an earlier sample period and is
consistent with the use of options increasing over time.19
Regarding the control variables, Panel A reveals that the mean of LEVERAGE is 21% of
the sum of the market value of equity and debt. This ratio is consistent with the findings of
Barth, Hodder, and Stubben (2008).
20
Panel B of Table 1 presents the Pearson correlations between the variables. Most of the
correlations are as expected. For example, the correlation between EQUITYVOL and
IMPLIEDVOL is large and positive (Pearson Corr. = 0.60; Spearman Corr. = 0.70). In addition,
The means of earnings, EARN, and change in earnings,
CHANGE_EARN, are negative, but the medians are not. The mean (median) of EARN is –16%
(1%) and of CHANGE_EARN is –1% (0%). The left skewness of earnings is consistent with
prior research (e.g., Ball, Sadka, and Sadka 2009).
19 Because Core and Guay (2001) reports options divided by common shares, for ease of comparison, we convert the ratio in Core and Guay (2001) to the ratio we use. 20 Barth, Hodder and Stubben (2008) measures leverage as the ratio of debt to total assets. Our inferences are invariant to using this alternative measure of leverage.

24
consistent with theory, both measures of risk are positively correlated with CREDITRISK and
GROWTH (Pearson Corr. = 0.36 and 0.45 for CREDITRISK; 0.19 and 0.24 for GROWTH), and
negatively correlated with SIZE (Corr. = –0.36 and –0.56), EARN (Corr. = –0.36 and –0.37), and
CHANGE_EARN (Corr. = –0.11 and –0.06), consistent with the findings of Hanlon, Rajgopal,
and Shevlin (2004). Also as expected, PROPENSITY is positively correlated with EQUITYVOL
and IMPLIEDVOL (Corr. = 0.15 and 0.18). Although the univariate correlations generally are
supportive of our predictions, we base our inferences on the multivariate relations specified by
equations (1) and (2).
Findings: Employee stock options and equity risk
Table 2, Panel A, presents regression summary statistics from estimating four versions of
equation (1). Consistent with our prediction the coefficient on OPTIONS is significantly
negative in all specifications, with t-statistics of –3.32, –4.16, –3.36, and –3.73. That is, the
extent to which a firm has outstanding employee stock options is significantly negatively
associated with equity risk, as measured by realized equity volatility. Panel A also reveals that
leverage is significantly positively associated with equity volatility in all specifications (t = 5.72,
6.85, 5.96, and 5.66). Finding a significant positive association between leverage and equity
volatility coupled with finding a significant negative association between employee stock options
and equity volatility indicates that employee stock options de-lever the firm’s equity, as
predicted.
Regarding the other control variables, Panel A reveals, as expected, that CREDITRISK is
positively associated with equity risk in all versions, although the association is only marginally
significant in the version that includes GROWTH (t = 3.73, 1.74, 10.49, and 3.55). Also as
expected, SIZE is significantly negatively associated with equity volatility (t = –6.34, –6.33, and

25
–6.22). In all specifications, earnings, EARN, is significantly negatively associated with equity
volatility, consistent with the findings of Hanlon, Rajgopal, and Shevlin (2004) (t = –10.89, –
8.34, –11.13, and –10.92). The coefficient on change in earnings, CHANGE_EARN, is
significantly positive in two of the specifications (t = 2.27, –0.72, 2.62, and 1.44). The sign of
the coefficient on CHANGE_EARN is sensitive to the inclusion of GROWTH, which suggests
that CHANGE_EARN also is a proxy for growth. Consistent with growth reflecting greater risk,
GROWTH is significantly positively associated with equity volatility (t = 7.96). The coefficient
on future risk taking, represented by CHANGE_RD, is also significantly positive (t = 2.65).
Panel A also reveals that PROPENSITY is not significantly associated with equity volatility,
incremental to the other variables (t = –1.02).21
Table 2, Panel B, presents regression summary statistics from estimating equation (1)
with implied volatility, IMPLIEDVOL, as the measure of equity risk. Panel B reveals inferences
identical to those revealed by Panel A with respect to the relation between equity risk and
employee stock options. In particular, the coefficient on OPTIONS is significantly negative in
all four specifications of equation (1), with t-statistics ranging from –4.53 to –4.85.
Regarding the control variables, Panel B reveals that, as expected, SIZE and EARN are
consistently negatively associated with implied volatility, with t-statistics ranging from –7.93 to
–9.22. LEVERAGE is significant in all specifications (t = 2.43, 4.24, 2.87 and 2.44). However,
the significance of CREDITRISK depends on the inclusion of SIZE. When SIZE is included in
the equation the coefficients on CREDITRISK are not significantly different from zero; the t-
21 Table 1, Panel B, reveals that PROPENSITY is positively correlated with EQUITYVOL (Corr. = 0.15) and with OPTIONS (Corr. = 0.53). This suggests that the association between PROPENSITY and EQUITYVOL is subsumed by other variables in the estimation equation. Consistent with this conjecture, untabulated findings from estimating equation (1) with only PROPENSITY and OPTIONS as explanatory variables reveal that PROPENSITY is significantly positively associated with EQUITYVOL, and OPTIONS is significantly negatively associated with EQUITYVOL. Untabulated findings using IMPLIEDVOL as the dependent variable reveal the same inferences as the untabulated findings using EQUITYVOL.

26
statistics are all less than or equal to 0.66 in absolute value. When SIZE is not included, the
coefficient on CREDITRISK is significantly positive, as expected (t = 10.62). Also as expected,
the coefficient on GROWTH is significantly positive (t = 8.55) and those on CHANGE_EARN
are significantly positive, except when GROWTH is included in the equation (t =2.49, 0.30, 2.94,
and 2.22). The other control variables are not significantly associated with implied volatility.
Relation across option attributes
The potential for managers to increase the certainty of option payouts by reducing the
strike price of the options, and the long term of employee stock options relative to other warrants
are two characteristics that distinguish employee stock options from other warrants and that
potentially invalidate the theoretical models upon which we base our predictions. Specifically,
the role of OPTIONS in a firm’s capital structure should be more similar to liabilities and less
similar to equity when 1) the options pose greater risk to the common equity holders because the
option strike price is lowered, thereby making option payouts more certain, or 2) the options are
longer term and therefore have less of a de-levering effect on common equity (Schultz and
Trautmann 1994). Thus, to provide additional support for our primary findings and inferences,
we investigate whether the relation between RISK and OPTIONS varies predictably with these
attributes of the employee stock options.
To examine the effects of increased certainty of option payouts associated with expected
strike price reductions, we examine the association between option repricing and the relation
between RISK and OPTIONS. Repricing is the practice of resetting the strike price on a stock
option contract, typically after the stock price declines. We collect repricing data from
ExecuComp and Equilar, and we set an indicator variable, REPRICE, equal to one in the year a

27
firm reprices options for at least one executive, and zero otherwise.22
Warrant value is most sensitive to asset value changes for near-maturity, in-the-money
warrants; therefore, warrant volatility increases as time to maturity decreases. Because asset
volatility is a weighted average of warrant volatility and common equity volatility, for any given
level of asset volatility, common equity volatility decreases as warrant volatility increases. This
implies that common equity volatility should decrease as the time to maturity of employee stock
options decreases. To examine the effects of longer option terms on the relation between RISK
and OPTIONS, we set an indicator variable, AVG_TERM, equal to one if the average term of
options outstanding is above the sample median, and zero otherwise. We estimate the average
life remaining for outstanding options using each firm’s disclosed expected life of newly granted
options. Following Landsman et al. (2006), we assume that the average life for all options
outstanding equals one-half of the expected life of newly granted options. Because longer-term
options have less effect on the risk of and expected return on common equity, we predict a
positive coefficient on the interaction of AVG_TERM and OPTIONS.
Because we expect that the
relation between employee stock options and common equity risk is less negative when firms
have a tendency to reprice options, we predict a positive coefficient on the interaction of
REPRICE and OPTIONS.
Table 2, Panel C, presents the findings. The first four columns present findings from
using realized volatility, EQUITYVOL, as the risk measure, and the last four columns present
findings using implied volatility, IMPLIEDVOL. Consistent with predictions, the findings
relating to repricing in Panel C reveal that the relation between OPTIONS and RISK is
22 This analysis is based on firms covered by ExecuComp, i.e., current and former members of the S&P 1500 plus some requests by clients of S&P. Equilar identifies some repricing firms that ExecuComp does not. Thus, we use both sources to identify repricing firms to increase the power of our tests. Using only ExecuComp to identify repricing firms does not alter our inferences.

28
significantly less negative for firms that reprice options (t = 2.56 and 2.83 for EQUITYVOL and
IMPLIEDVOL). In addition, untabulated findings reveal that the total coefficient on OPTIONS
for firms that reprice options, i.e., the sum of the coefficients on OPTIONS and
OPTIONS×REPRICE, is not significantly different from zero (t = 1.44 and 1.46 for
EQUITYVOL and IMPLIEDVOL). These findings suggest that option repricing changes the
characteristics of employee stock options such that the options no longer have characteristics of
equity.
Relating to longer option terms, Panel C also reveals, as predicted, that the relation
between OPTIONS and RISK is muted when the remaining average employee stock option term
to maturity is above the sample median. The positive coefficient on the interaction variable,
OPTIONS×AVG_TERM, indicates that the relation is significantly less negative for both risk
proxies (t = 2.25 and 1.90 for EQUITYVOL and IMPLIEDVOL). However, untabulated findings
reveal that the total coefficient on OPTIONS for firms with longer-term options, i.e., the sum of
the coefficients on OPTIONS and OPTIONS×AVG_TERM, is significantly negative for both risk
proxies (t = –2.05 and –4.24 for EQUITYVOL and IMPLIEDVOL). These findings suggest that
although longer-term employee stock options have characteristics somewhat less similar to
warrants than shorter-term options, they do not have characteristics of liabilities.
Taken together, the results in Table 2, Panel C, are consistent with the predictions of
theory: employee stock options with contractual terms closer to true warrants exhibit stronger
negative associations with equity risk.
Robustness checks
We conduct four additional tests to check the robustness of our inferences. Untabulated
findings from all robustness checks support the inferences we obtain from the tabulated findings.

29
First, because there are few established models of the determinants of equity volatility,
our empirical specification of equation (1) is necessarily ad hoc. Thus, to investigate the
robustness of our inferences, we include in equation (1)—both with EQUITYVOL and with
IMPLIEDVOL as the dependent variable—several additional variables shown by prior research
to be associated with common equity risk or return. Specifically, we include the equity book-to-
market ratio, momentum, analyst forecast dispersion, the inverse of price per share, and firm age
as additional explanatory variables. The untabulated findings reveal that although the
significance of the association between common equity risk and some of control variables,
including CHANGE_EARN, differs when these additional variables are included in the
estimating equation, the association between common equity risk and OPTIONS is consistently
significantly negative.
Second, because our results could be unduly influenced by the unusually high market
volatility in 2008, we re-estimate our equations excluding observations from 2008. Third, as an
alternative control for the propensity to issue options, we include option grants in the preceding
year. Fourth, we test whether results are sensitive to our measuring OPTIONS as the percentage
of dilution, i.e., the number of options outstanding relative to the total of numbers of common
shares and options outstanding. In particular, we measure OPTIONS as their estimated value,
rather than as the percentage dilution.
Findings: Employee stock options and expected return on equity
Table 3 presents regression summary statistics from estimating two versions of equation
(2). Consistent with our findings for equity risk, statistics in Table 3 from both versions reveal
that OPTIONS is negatively associated with the expected equity cost of capital, ECC (t = –2.95
and –4.55). Consistent with the equity volatility findings, the association between ECC and

30
LEVERAGE is positive, although it is only significantly so when we include GROWTH and
DISPERSION in the equation (t = 1.44 and 3.96).
As expected, SIZE is significantly negatively associated with ECC (t = –3.62 and –5.81)
and BETA is significantly positively associated (t = 4.29 and 2.78). BM and DISPERSION are
not significantly associated with ECC (t = –1.55 and –1.28 for BM, and –1.44 for DISPERSION)
and, contrary to expectations, MOM is significantly negatively associated (t = –4.93 and –2.54).
V. SENSITIVITY OF CLAIMS VALUES TO CHANGES IN ASSET VALUES
Finance theory suggests that debt and equity values respond differently to changes in
asset value. In particular, as the value of the firm’s assets exceeds the value of debt by a larger
margin, the sensitivity of debt value to changes in asset value approaches zero and the sensitivity
of equity value to changes in asset value approaches one (Merton, 1974). Therefore, if the
sensitivity to changes in asset value of the value of employee stock options is more similar to
equity than it is to debt, then the sensitivity of option value to changes in asset value should be
closer to one (zero) for firms further from (closer to) debt default. As a test of this relation, we
present evidence on the sensitivity of the change in the value of liabilities, ∆MVL, equity, ∆MVE,
and employee stock options, ∆MVO, to changes in the value of assets, ∆MVA, for firms with
different distances to default on their debt. We also provide evidence on the expected return on
options, RET_OPT.
We base our estimates of option value and expected return on the approach in Daves and
Ehrhardt (2007), as outlined in Appendix B. Daves and Ehrhardt (2007) shows how to compute
capital components’ values and required returns using only market observables. Specifically,
using EQUITYVOL, common shares outstanding, and employee stock option disclosure data
from Compustat, we first simultaneously solve equations (B3) through (B6) in Appendix B to

31
obtain estimates of option value and the partial derivative of option value with respect to share
price. We then input those estimates, combined with share price, ECC, and the risk-free interest
rate, into equation (B6) in the Appendix to obtain an estimate of the return on options,
RET_OPT. To estimate the values of assets and liabilities, we use the procedure described in
Barth, Hodder, and Stubben (2008), which builds on Merton (1974) and Hillegeist et al. (2004).
Given observed equity value and historical stock return volatility, we invert the Merton (1974)
model to estimate the value of assets, which is then used to estimate the value of liabilities.
For purposes of comparison, we also estimate the value of employee stock options using
the Black-Scholes (1973) option pricing formula, based on inputs from the employee stock
option disclosure data from Compustat; namely, average exercise price, expected stock return
volatility, risk-free interest rate, expected dividend yield, and time to maturity. We follow
Landsman et al. (2006) to estimate the average life for options outstanding.
Table 4, Panel A, presents distributional statistics for and Panel B presents correlations
between the variables we construct. We refer to the Daves and Ehrhardt (2007) estimate of the
value of employee stock options as the D-E value, and the Black-Scholes (1973) estimate as the
B-S value, both scaled by market value of common equity. The estimation methods differ most
with respect to their treatment of dilution and leverage.23
23 The Black-Scholes (1973) option pricing model is frequently used by firms to estimate the value of employee options at the grant date (Aboody, Barth, and Kasznik 2006; Landsman et al. 2006). The binomial pricing model is another common method used to estimate option value. As commonly applied, neither of these methods adjusts for the effects of dilution or considers debt in the capital structure. Appendix A shows how the binomial model can be adjusted for dilution and leverage.
How large differences are is an
empirical question. Panel A reveals that the mean B-S value of employee options is 6% of the
market value of common equity and the mean D-E value is 4%. These statistics indicate that the
Black-Scholes (1973) formula results in values of employee stock options that are overstated by
approximately 50% when dilution is ignored. Consistent with the greater risk of employee stock

32
options, the mean expected return on options, RET_OPT, of 22% is substantially higher than the
mean expected equity cost of capital, ECC, of 13%.
Additional descriptive statistics presented in Panel B reveal that B-S value and D-E value
are positively correlated, although not highly (Corr. = 0.14). Panel B also reveals that, contrary
to theory, B-S value is negatively correlated with BETA (Corr. = –0.20). This is not the case for
D-E value, which is positively correlated with BETA (Corr. = 0.17). B-S value is positively
correlated with LEVERAGE (Corr. = 0.08) and D-E value is negatively correlated with
LEVERAGE (Corr. = –0.26). Neither value estimate is highly correlated with equity volatility,
EQUITYVOL.24
Table 5 presents statistics that enable us to assess the sensitivity to changes in asset value
of equity value, liability value, and employee option value as the distance to default increases.
Panel A presents the median ratio of the change in the values of equity, debt, and options to the
change in asset value by distance-to-default quintile. We define distance to default as the excess
of asset market value over liability book value, scaled by the market value of assets. As
expected, Panel A reveals that the unit change in equity value per unit change in asset value
monotonically decreases as the distance to default increases (0.98 for quintile 5 to 0.73 for
quintile 1). Also as expected, Panel A reveals the opposite for debt—that is, the unit change in
debt value per unit change in asset value monotonically increases as the distance to default
increases (–0.02 for quintile 5 to 0.25 for quintile 1). These relations are consistent with Merton
Consistent with theory, the D-E required return on options, RET_OPT, is
positively correlated with BETA (Corr. = 0.12). RET_OPT is positively correlated with
EQUITYVOL by construction. Overall, the statistics in Table 4 indicate that D-E value and
RET_OPT are consistent with the theory from which they are derived.
24 Recall that the value of a warrant is increasing in the volatility of firm assets and decreasing in leverage. Leverage increases the volatility of equity but not necessarily the volatility of assets. Therefore, the value of warrants is not necessarily increasing in the volatility of common equity.

33
(1974), which shows that as the probability of default increases toward certainty, debt holders
become claimants on the firm’s assets and, thus, effectively equity holders.
More importantly for our research question, as predicted, Panel A reveals that the change
in D-E value exhibits a convex pattern that is similar to that of equity value and opposite that of
debt value. Namely, D-E value decreases monotonically in the change in asset value as the
distance to default decreases (0.06 for quintile 5 to 0.01 for quintile 1). To test whether these
patterns are significant, we estimate the relation between each of the value sensitivities and
distance to default. Table 5, Panel B, presents the findings. It reveals that the sensitivity of
common equity value and option value to changes in asset value each is significantly positive (t
= 5.16 for equity value and 8.67 for option value). In contrast, the sensitivity of liability value to
changes in asset value is significantly negative (t = –5.24).
Taken together, the findings in Table 5 provide corroborative evidence that employee
stock options share more in common with equity than with debt. This, too, suggests that options
would be more appropriately classified as equity, not liabilities, for financial reporting purposes.
VI. SUMMARY AND CONCLUDING REMARKS
This study seeks to determine whether employee stock options have characteristics of
liabilities or of equity. We focus our tests on how the options relate to the risk of and expected
return on firms’ common equity. Based on previously untested finance theory we predict that
because employee stock options are warrants issued and settled by the firm, the presence of
employee stock options is associated with both lower risk of and expected return on common
equity. Our evidence supports this prediction. In particular, we find that realized common
equity return volatility, the volatility implied by a firm’s traded options, and expected equity cost

34
of capital all are negatively associated with the extent to which firms have outstanding employee
stock options.
Consistent with the theory upon which our tests are based, we find that the relation
between employee stock options and the risk of common equity is significantly less negative for
firms with longer-term options and for firms that reprice options. These findings indicate that
the relation between common equity and options with these attributes is more like debt than it is
for options without these attributes. For firms with longer-term options, the relation between
employee stock options and common equity risk is muted but significantly negative, which
indicates that these options are only somewhat more like debt in the capital structure than
shorter-term options. However, for firms that reprice options, the relation between options and
common equity risk is positive, which indicates that these options have characteristics of debt,
not equity. These findings reveal that some employee stock options have terms that negate the
equity-like characteristics of warrants.
We also find that the sensitivity of the value of employee stock options to changes in
asset value is similar to that of equity value and the opposite to that of debt value. In addition,
our descriptive evidence shows that employee stock options have much higher risk and expected
return than common equity; the expected return for options is approximately 70% larger than the
expected return on common equity.
Our findings contribute not only to the finance literature by empirically validating the
predictions of warrant pricing theory, but also to the debate about what characteristics should
distinguish liabilities and equity for financial reporting purposes. Our findings demonstrate that
employee stock options de-lever common equity, not lever it. Our findings also demonstrate that
employee stock options have higher risk and higher expected return than common equity claims

35
against the same assets. Thus, the findings suggest that these option claims are more residual
than common equity claims and, as a result, that these options essentially form a second type of
equity. Taken together, our findings are not consistent with classifying employee stock options
as liabilities for financial reporting purposes.
Our analyses and findings suggest a possible basis on which to classify claims against the
firm’s assets as liabilities or equity—namely, on the basis of the claims’ effects on common
equity risk and expected return. Specifically, claims that increase the risk of and expected return
on common equity would be classified as liabilities, and claims that do not increase common
equity risk and expected return would be classified as equity. Although our results primarily
have implications for classification of employee stock options as debt or equity, our findings also
suggest that disaggregation within equity can be informative. Specifically, because the risk and
expected return characteristics of employee stock options and common equity differ,
disaggregating these components of equity likely would provide useful information to investors.

36
Appendix A
Numerical Example
This appendix offers a numerical example to illustrate the effects of employee stock
option issuance on a firm’s capital structure and the accounting issues addressed in this study.
To facilitate comparison with Kirschenheiter et al. (2004), we begin with a simplified set of
assumptions. In particular, we consider an all-equity firm created at the end of year zero by
raising equity. Proceeds of $100.00 from the sale of 100 shares are invested in productive assets
earning a certain after-tax return of 10%. All available cash flow is retained and invested. At the
end of year one when the stock price is $1.10, the firm grants 47.14 at-the-money options in lieu
of $9.00 of cash wages. The options are exercised at the end of year three. At the end of year
four, the firm is liquidated.
Figure 1 shows financial statements and key performance measures for three
presentations of options. In the first panel of Figure 1, options are presented as liabilities. In the
second panel of Figure 1, options are presented as equity claims against the expected value of
assets, where the expected value of assets includes the present value of the strike price, and the
value of the option equity claim equals the value of the option holders’ undivided interest in the
firm’s assets.25 This presentation “grosses up” the statement of financial position by the strike
price receivable and allows us to illustrate the valuation mechanics of options. The third panel of
Figure 1 is identical to the second panel, except that the strike price receivable is netted against
the option equity. Panel 3 is most consistent with current GAAP.26
25 Option holders’ undivided interest equals 32% of firm assets and future income calculated as: 47.14/(100 + 47.14).
26 We ignore deferred taxes because they complicate the analysis without providing additional insight about liability/equity classification of option claims. Including deferred taxes does not alter the example’s conclusions.

37
In each panel of Figure 1, the value of common equity at the end of each period equals
the present value of the liquidation proceeds distributed to common equity holders at time T:
𝑀𝑀𝑀𝑀𝑀𝑀𝑡𝑡 = 𝑛𝑛𝑛𝑛+𝑚𝑚
1(1+𝑖𝑖)𝑇𝑇−𝑡𝑡
𝑀𝑀𝑀𝑀𝑀𝑀𝑇𝑇 (A1)
where n is the number of shares of common, m is the number of option shares, and MVAT is the
value of assets when the assets are liquidated.27
Figure 1 shows that the value of assets is $161.85 after the options are issued at the end
of period one. The value of assets differs from the book value of assets in Panels 1 and 3
because the present value of the strike price is not included in assets under the options-as-
liabilities approach or current GAAP. In contrast, the present value of the strike price is included
in assets in Panel 2, so the book value of assets equals the value of assets in each period.
Based on the assumed facts, common equity
holders (option holders) expect to receive 68% (32%) of the liquidation value of assets in period
four. The liquidation value of assets includes the cash received from option holders in period
three plus cumulative reinvested earnings.
When options are presented as liabilities, as in Panel 1, “option financial expense” is
imputed by multiplying the value of the option grant by the expected rate of return. This leads to
lower net income that more accurately reflects the income attributable to common equity holders
(Kirschenheiter et al. 2004). However, imputing option financial expense understates return on
assets (ROA), which is assumed by the example to be a constant 10%. Based on the statement of
financial position, leverage is positive, which overstates the default risk of this unlevered firm.
In contrast, Panel 2 presents the option in two parts: the present value of strike price is
included in the book value of assets, and the value of the option holders’ claims against assets is
included in equity. Financial income is imputed as the increase in the present value of the strike
27 The value of the option claims is determined similarly, except that the fraction of proceeds equals m/(n + m).

38
price. However, consistent with current GAAP, increases in the value of option equity are not
included in net income. Panel 2 shows that ROA is correctly reported at 10% and reported
leverage is zero, consistent with the example firm’s fundamentals. Panel 3 reveals the same
outcomes—ROA of 10% and reported leverage of zero.
In Figure 1, classifying options as liabilities appears to overstate the firm’s leverage.
However, theory also predicts that option issuance decreases the risk of and expected return on
common equity. These predictions cannot be illustrated under certainty because all cash flows
earn the same risk-free rate of return (assumed to be 10% in the example). Therefore, we modify
the example to include uncertainty. Specifically, in Figure 2 we maintain an expected after-tax
return of 10% for the assets and set the standard deviation of equity returns equal to 44%. For an
all-equity firm, the return to, and variance of, equity equal the return to, and variance of, assets.
However, the issuance of contingent claims changes the capital structure of the firm. We
quantify the effects of capital structure changes by using a binomial pricing model to compute
the expected values and expected rates of return of each equity component over the two-year
term of the options.
Because uncertainty increases the value of options, the firm must issue only 38.78
options to compensate employees $9.00, rather than the 47.14 options that the firm must issue in
the certainty case.28 This results in a total strike price of $42.66. In Figure 2, the terminal nodes
of each binomial tree show expected values of assets, equity, and options at the end of period
three. For ease of exposition, the end of period three is assumed to be the option expiration date,
and option value and asset value are presented both gross and net of the strike price.29
28 The number of options equals $9.00 divided by the price of a single option with a strike price of $1.10.
29 The $9.00 option price equals the $16.68 expected present value of the option holders’ claim on the firm’s gross assets, i.e., including the strike price, less the $7.68 expected present value of the $42.66 strike price.

39
The asset price tree in the upper left-hand corner of Figure 2 shows the progression of
asset values that occurs when employees are paid cash instead of options. This can be compared
to the asset price tree in the upper right-hand corner of Figure 2, which shows a higher expected
terminal value ($143.99 compared to $133.10) when cash is conserved by paying compensation
with options (with options, assets are $119.00 at the beginning of the term, rather than $110.00,
because the firm has conserved $9.00 in cash that would have been paid in wages). Comparing
the top two asset trees in Figure 2 reveals that the expected return on assets of 10% is invariant to
the issuance of options. The asset price tree in the upper right-hand corner also shows the effect
of the strike price on the expected value of assets, which increases to $126.68 when the future
expected cash flow arising from option exercise is included. Note that the $42.66 strike price is
not included in the calculation of the return of 10% because the strike price is a contribution of
capital rather than income.
The option price tree in the bottom left-hand corner of Figure 2 shows that if the options
are exercised, option holders receive net value of $50.01, which is a total two-year return of
456% on their $9.00 investment. However, computing the options’ return based only on the
exercise value is misleading because the options expire worthless 75% of the time, in this
example. The gross options’ expected terminal value of $23.17 incorporates the potential that
the options expire worthless; thus, the options’ expected return at the date of issuance is a more
reasonable 18%. The value of the option holders’ gross claim on total assets is $16.68, which
combines with the equity holders’ claim of $110.00 to equal the expected total asset value of
$126.68.
The equity price tree in the bottom right-hand corner of Figure 2 reveals that the value of
equity does not change when options are issued: the value of equity remains equal to the pre-

40
option-issuance value of $110.00. This is true even though the expected present value of assets
increases. Comparing the asset price tree with no options (the 100% common equity firm) to the
equity price tree with options (the mixed equity firm) reveals that the mixed equity firm has a
narrower range of potential terminal common equity values ($49.01 to $238.94 compared to
$45.30 to $267.10). The variance is lower because the option holders’ $9.00 cash wage
forfeiture provides insulation against downside outcomes, and because the options absorb a
fraction of upside outcomes. Consistent with the lower variance, the expected return on common
equity also is lower in the presence of options (9% compared to 10%).

41
Appendix B
Estimating option expected return
Daves and Ehrhardt (2007) develops an approach to estimating the variance of and
expected return on the components of complex capital structures. Daves and Ehrhardt (2007)
begins by showing that the weighted average cost of capital, WACC, can be expressed as:
( ) DDQQ wτ1rwrWACC −+= (B1)
where rQ and rD are the returns on “quasi-equity” and debt, and wQ and wD are the proportions of
the firm financed with quasi-equity, Q, and debt, D. τ is the tax rate. Quasi-equity includes
common stock and claims that might become common stock, such as warrants. Debt includes
only debt without an option to convert into common stock.
When equity includes employee stock options, the required return on quasi-equity is a
weighted average of the required returns on levered common equity, rLCE, and the options, rω:
++
+=
WLCEWr
WLCELCErr ωLCEQ (B2)
LCE is the value of levered common equity and W is the value of employee stock options
outstanding. rLCE and rω are the required rates of return on common equity and the options, each
of which is subject to outstanding debt. The total value of the firm is the sum of the values of
debt, levered common equity, and the options.
Empirically, equations (B1) and (B2) are rarely estimable because neither rQ nor rω is
observable. By assuming that quasi-equity, which is equal to W + LCE, follows a Gauss-Weiner
process, Daves and Ehrhardt (2007) shows that the value of the options is given by:
𝜔𝜔 = � 𝑛𝑛𝑛𝑛+𝑚𝑚
� �𝑆𝑆∗𝑁𝑁(𝑑𝑑1∗) − 𝑋𝑋𝑒𝑒−𝑟𝑟𝑟𝑟(𝑇𝑇−𝑡𝑡)𝑁𝑁(𝑑𝑑2
∗)� (B3)

42
where 𝑑𝑑1∗ =
𝑙𝑙𝑛𝑛 (𝑆𝑆∗/𝑋𝑋)+�𝑟𝑟𝑟𝑟+𝜎𝜎𝑄𝑄2 /2�(𝑇𝑇−𝑡𝑡)
𝜎𝜎𝑄𝑄√𝑇𝑇−𝑡𝑡 , 𝑑𝑑2
∗ = 𝑑𝑑1∗ − 𝜎𝜎𝑄𝑄𝑇𝑇 − 𝑡𝑡1/2, and 𝑆𝑆∗ = 𝑆𝑆𝑒𝑒−𝑞𝑞(𝑇𝑇−𝑡𝑡) + 𝑚𝑚𝜔𝜔/𝑛𝑛. S is
the price of a common share, n is the number of common shares outstanding, m is the number of
options each convertible into one common share, q is the continuous dividend, rf is the risk-free
rate of return, and N(▪) is the cumulative normal distribution function.
Estimation of equation (B3) requires an estimate of σQ, which is given by equation (B4).
ω+
ω+σ=σ
mnSmn
S sSQ , where ( )( )
−+
=−−
1
*1
)(
1)(
dNmndNneS
tTq
SS σω (B4)
Equations (B3) and (B4) can be solved numerically for the option price, ω, and the partial
derivative of the option price with respect to the stock price, ωS, which can then be used to solve
for the required return on levered common equity, rLCE, using equation (B5).
+−
+
++
=ωωω
ωω
mnSmSmrf
mnSmSnSrr SS
LCEQ (B5)
The required return on the option in terms of rLCE is given by equation (B6).
𝑟𝑟𝜔𝜔 = 𝑟𝑟𝑟𝑟 + (𝑟𝑟𝐿𝐿𝐿𝐿𝑀𝑀 − 𝑟𝑟𝑟𝑟)𝜔𝜔𝑆𝑆 �𝑆𝑆𝜔𝜔� (B6)
From this system of equations, Daves and Ehrhardt (2007) shows that issuing warrants
does not change the weighted average cost of capital. However, it decreases the required return
on common equity. To see this, use equation (B5) to compute rLCE – rQ:
𝑟𝑟𝐿𝐿𝐿𝐿𝑀𝑀 − 𝑟𝑟𝑄𝑄 = −(𝑟𝑟𝑄𝑄 − 𝑟𝑟𝑟𝑟) × �−𝑚𝑚𝜔𝜔+𝑚𝑚𝑆𝑆𝜔𝜔𝑆𝑆𝑛𝑛𝑆𝑆+𝑚𝑚𝑆𝑆𝜔𝜔𝑆𝑆
� ≤ 0 (B7)
The first term is negative because the return on risky assets is greater than the risk-free rate. The
second term is positive because S > ωS > ω. Thus, issuing warrants lowers the required return
on equity. In addition to decreasing the required return, issuing warrants also decreases the
volatility of equity because equation (5) implies that σQ < σS.

43
References Aboody, D. 2006. Discussion of “Which Approach to Accounting for Employee Stock Options
Best Reflects Market Pricing?” Review of Accounting Studies 11: 247-251. Aboody, D., M. E. Barth, and R. Kasznik. 2006. Do Firms Understate Stock Option-based
Compensation Expense Disclosed Under SFAS 123? Review of Accounting Studies 11: 429-461.
Ball, R., G. Sadka, and R. Sadka. 2009. Aggregate Earnings and Asset Prices. Journal of
Accounting Research 47(5): 1097-1133. Balsam, S. 1994. Extending the Method of Accounting for Stock Appreciation Rights to
Employee Stock Options. Accounting Horizons 8: 52-60. Barth, M. E., W. H. Beaver, and W. R. Landsman. 1998. Relative Valuation Roles of Equity
Book Value and Net Income as a Function of Financial Health. Journal of Accounting & Economics (25): 1-34.
Barth, M. E., L. D. Hodder, and S. R. Stubben. 2008. Fair Value Accounting for Liabilities and
Own Credit Risk. The Accounting Review 83(3): 629-664. Barth, M. E., Y. Konchitchki, and W. R. Landsman. 2010. Cost of Capital and Earnings
Transparency. Working paper, Stanford University. Bartov, E., P. Mohanram, and D. Nissim. 2007. Managerial Discretion and the Economic
Determinants of the Disclosed Volatility Parameter for Valuing ESOs. Review of Accounting Studies 12(1): 155-179.
Beaver, W., P. Kettler, and M. Scholes. 1970. The Association between Market-determined and
Accounting-determined Risk Measures. The Accounting Review: 654-681. Black, F, and M. Scholes. 1973. The Pricing of Options and Corporate Liabilities. The Journal of
Political Economy 81(3): 637 Botosan, C. and M. Plumlee. 2005. Assessing Alternative Proxies for the Expected Risk
Premium. The Accounting Review 80(1): 21-53. Carpenter, J. 2000. Does Option Compensation Increase Managerial Risk Appetite? The Journal
of Finance 55(5): 2311-2331 Clark, M.W. 1993. Entity Theory, Modern Capital Structure Theory, and the Distinction between
Debt and Equity. Accounting Horizons 7(3): 14-31. Coles, J., N. Daniel, and L. Naveen. 2006. Managerial Incentives and Risk-taking. Journal of
Financial Economics 79: 431-468.

44
Core, J., and W. Guay. 2001. Stock Option Plans for Non-executive Employees. Journal of
Financial Economics 61(2): 253-287. Core, J., W. Guay, and D. Larcker. 2008. The Power of the Pen and Executive Compensation.
Journal of Financial Economics 88(1): 1-33. Daves, P., and M. Ehrhardt. 2007. Convertible Securities, Employee Stock Options and the Cost
of Equity. The Financial Review 42(2): 267-288. DeFusco, R., R. Johnson, and T. Zorn. 1990. The Effect of Executive Stock Option Plans on
Stockholders and Bondholders. The Journal of Finance 45(2): 617-628. Fama, E. and K. French. 1993. Common Risk Factors in the Returns on Stocks and Bonds.
Journal of Financial Economics 33(1): 3-56. Financial Accounting Standards Advisory Council (FASAC). 2001. Evaluation of the FASB's
Proposed Accounting for Financial Instruments with Characteristics of Liabilities, Equity, or Both. Accounting Horizons 15(4): 387-400.
Financial Accounting Standards Board. 1985. Statement of Financial Accounting Concepts No. 6
Elements of Financial Statements. Norwalk, CT: FASB. ___________. 2007. Preliminary Views: Financial Instruments with Characteristics of Equity.
Financial Accounting Series No. 1550-100. Norwalk, CT: FASB. Galai, D. 1989. A Note on ‘Equilibrium Warrant Pricing and Accounting for Executive Stock
Options. Journal of Accounting Research 27(2): 313-315. Galai, D., and M. Schneller. 1978. Pricing of Warrants and the Value of the Firm. Journal of
Finance 33: 1333-1342. Gow, I., G. Ormazabal, and D. Taylor. 2010. Correcting for Cross-Sectional and Time-Series
Dependence in Accounting Research. The Accounting Review 85(2): 483-512. Hamada, R. 1969. Portfolio Analysis, Market Equilibrium and Corporation Finance. Journal of
Finance 24(1): 13-31. ___________. 1972. The Effect of the Firm’s Capital Structure on the Systematic Risk of
Common Stocks. Journal of Finance 27(2): 435-452. Hanlon, M., S. Rajgopal, and T. Shevlin. 2004. Large Sample Evidence on the Relation between
Stock Options and Risk Taking. Working paper, University of Washington. http://papers.ssrn.com/sol3/papers.cfm?abstract_id=427260

45
Hillegeist, S. A., E. K. Keating, D. P. Cram, and K. G. Lundstedt. 2004. Assessing the Probability of Bankruptcy. Review of Accounting Studies (9): 5–34.
Hull, J. and A. White. 2003. Accounting for Employee Stock Options. Working paper,
University of Toronto. http://www.rotman.utoronto.ca/~hull/DownloadablePublications/AccountingforStockOptions.pdf
Ingersoll, J. 1977. A Contingent-Claims Valuation of Convertible Securities. Journal of
Financial Economics 4(3): 289-321. Jegadeesh, N., and S. Titman. 1993. Returns to Buying Winners and Selling Losers: Implications
for Stock Market Efficiency. Journal of Finance 48: 65-91. Kirschenheiter, M., R. Mathur, and J. Thomas. 2004. Accounting for Employee Stock Options.
Accounting Horizons 18(2): 135-156. Korteweg, A. 2004. Financial Leverage and Expected Stock Returns: Evidence from Pure
Exchange Offers. Working paper, Stanford University. Lambert, R. A., D. F. Larcker, and R. E. Verrecchia. 1991. Portfolio Considerations in Valuing
Executive Compensation, Journal of Accounting Research 29(1): 129-49. Landsman, W, K. Peasnell, P. Pope, and S. Yeh. 2006. Which Approach to Accounting for
Employee Stock Options Best Reflects Market Pricing? Review of Accounting Studies 11: 203-245.
Li, F., and F. Wong. 2005. Employee Stock Options, Equity Valuation, and the Valuation of
Option Grants Using a Warrant-Pricing Model. Journal of Accounting Research 43(1):97-131.
Mayhew, S. 1995. Implied Volatility. Financial Analysts Journal 51(4): 8-20. Maines, L., E. Bartov, A. Beatty, and C. Botosan. 2004. Evaluation of the IASB's Proposed
Accounting and Disclosure Requirements for Share-Based Payment. Accounting Horizons 18(1): 65-76.
Merton, R. C. 1974. On the Pricing of Corporate Debt: The Risk Structure of Interest Rates. The
Journal of Finance 29: 449-70. Modigliani, F., and M. H. Miller. 1958. The Cost of Equity, Corporate Finance, and the Theory
of Investment. American Economic Review 48(3): 261-297. ___________. 1963. Corporate Income Taxes and the Cost of Capital: A Correction. American
Economic Review 53(3): 433-443.

46
Noreen, E., and M. Wolfson. 1981. Equilibrium Warrant Pricing Models and Accounting for Executive Stock Options. Journal of Accounting Research 19(2): 384-398.
Ohlson, J., and S. Penman. 2005. Debt vs. Equity: Accounting for Claims Contingent on Firms’
Common Stock Performance with Particular Attention to Employee Compensation Options. Working Paper, Columbia Business School.
Paton, W. 1962. Accounting Theory. New York: The Roland Press. Pastor, L., and P. Veronesi. 2003. Stock Valuation and Learning about Profitability. The Journal
of Finance 58(5): 1749-1789. Penman S., S. Richardson, and I. Tuna. 2007. The Book-to-Price Effect in Stock Returns:
Accounting for Leverage. Journal of Accounting Research (45)2: 427-467 Rajgopal, S., and T. Shevlin. 2002. Empirical Evidence on the Relation between Stock Option
Compensation and Risk Taking. Journal of Accounting and Economics 33: 145-171. Robichek, K., and S. Myers. 1966. Problems in the Theory of Optimal Capital Structure. Journal
of Financial and Quantitative Analysis 1(2): 1-35. Rubinstein, M. E. 1973. A Mean-Variance Synthesis of Corporate Financial Theory. The Journal
of Finance 28(1): 167-81. Sacho, Z., and J. Oberholster. 2005. Should the IASB Consider Exercise Date Accounting for
Outstanding Employee Share Options? Meditari Accountancy Research 13(2): 89-106. Schultz, G., and S. Trautmann. 1994. Robustness of option-like warrant valuation. Journal of
Banking & Finance 18(5): 841-859. Sprague, C. 1907. The Philosophy of Accounts. New York: Published by the Author (1908). Terando, W., W. Shaw, and D. Smith. 2007. Valuation and Classification of Company Issued
Cash and Share-puts. Review of Quantitative Finance and Accounting 29(3): 223-240. Ukhov, A. 2004. Warrant Pricing using Observable Variables. Journal of Financial Research
27(3): 329-339.
Williams, M., and R. Rao. 2006. CEO Stock Options and Equity Risk Incentives. Journal of Business Finance & Accounting 33(1): 26-49.

47
Figure 1: Three Presentations of Options
____________________________________________________________________________________________
Period 0 1 2 3 4 0 1 2 3 4Statement of Financial PositionProductive Assets 100.00 119.00 130.90 195.84 215.43 100.00 119.00 130.90 195.84 215.43Other Assets 42.85 47.14Total Assets 100.00 119.00 130.90 195.84 215.43 100.00 161.85 178.04 195.84 215.43
Stock Option Liability 9.00 9.90
Owner's Equity Options 51.85 51.85Contributed Capital 100.00 100.00 100.00 162.74 162.74 100.00 100.00 100.00 151.85 151.85Retained Earnings 10.00 21.00 33.10 52.68 10.00 26.19 43.99 63.57Total Equity 100.00 110.00 121.00 195.84 215.43 100.00 161.85 178.04 195.84 215.43Total Liabilities and Equity 100.00 119.00 130.90 195.84 215.43 100.00 161.85 178.04 195.84 215.43
Income StatementOperating Income 19.00 11.90 13.09 19.58 19.00 11.90 13.09 19.58Option Expense 9.00 9.00Option Financial Expense 0.90 0.99 -4.29 -4.71Net Income 10.00 11.00 12.10 19.58 10.00 16.19 17.80 19.58Operating Cash FlowsCash from net sales 19.00 11.90 13.09 19.58 19.00 11.90 13.09 19.58Imputed Cash Flows Options -9.00 -0.90 -0.99 0.00 Net Operating Cash Flows 10.00 11.00 12.10 19.58 19.00 11.90 13.09 19.58Price DataValue of Option Claims (32%) 51.85 57.04 62.74 69.02 51.85 57.04 62.74 69.02Value of Common Claims (68%) 110.00 121.00 133.10 146.41 110.00 121.00 133.10 146.41Value of Assets 161.85 178.04 195.84 215.43 161.85 178.04 195.84 215.43Financial MeasuresReturn on Assets 10% 9% 9% 10% 10% 10% 10% 10%Return on Equity 10% 10% 10% 10% 10% 10% 10% 10%Leverage (Debt/Assets) 8% 8% 0% 0% 0% 0% 0% 0%
Panel 1: Options as LiabilitiesPanel 2: Options as Equity Claims on
Larger Asset Pool

48
Figure 1 (Continued): Three Presentations of Options ______________________________________________________________________________________________
Period 0 1 2 3 4Statement of Financial PositionProductive Assets 100.00 119.00 130.90 195.84 215.43Other AssetsTotal Assets 100.00 119.00 130.90 195.84 215.43Stock Option LiabilityOwner's Equity Options 9.00 9.00Contributed Capital 100.00 100.00 100.00 160.85 160.85Retained Earnings 10.00 21.90 34.99 54.57Total Equity 100.00 119.00 130.90 195.84 215.43Total Liabilities and Equity 100.00 119.00 130.90 195.84 215.43
Income StatementOperating Income 19.00 11.90 13.09 19.58Option Expense 9.00Option Financial ExpenseNet Income 10.00 11.90 13.09 19.58
Operating Cash FlowsCash from net sales 19.00 11.90 13.09 19.58Imputed Cash Flows Options Net Operating Cash Flows 19.00 11.90 13.09 19.58Price DataValue of Option Claims (32%) 51.85 57.04 62.74 69.02Value of Common Claims (68%) 110.00 121.00 133.10 146.41Value of Assets 161.85 178.04 195.84 215.43
Financial MeasuresReturn on Assets 10% 10% 10% 10%Return on Equity 10% 10% 10% 10%Leverage (Debt/Assets) 0% 0% 0% 0% 0%
Panel 3: Strike Price Receivable Netted Against Option Equity

49
Figure 2: Effect of Options on Expected Return _____________________________________________________________________________________________________________________
____________________________________________________________________________________________________________________
The binomial trees show simulated price paths for assets, options, and equity for two periods. The expected value at each node is the average of potential outcomes. The expected rate of return is equal to ending expected value/beginning expected value minus 1. Simulation parameters are as follows: value of assets at grant date = $110; value of options on grant date = $9; number of options granted is 38.78; strike price = $1.10; expected rate of return on assets = 10%;1 + risk free rate of return (rf) = 1.05%; standard deviation of assets = 44.4%; probability of uptick = 50%; value on uptick (u) = 155.5%; and value on downtick (d) = 64.2%. The risk-neutral probability of an uptick (p) is computed as (rf – d)/(u – d) and is equal to 0.445 at each node. Letting U = the value on an uptick and D = the value on a downtick, the value at each node is computed as (pU)/rf + (1 – p)D/rf.
267.10 331.61171.41 203.53 *288.95
110.00 *185.43 119.00110.00 126.68
110.00 *119.00 119.0070.59 76.37
45.30 49.01Expected Value 110.00 121.00 133.10 126.68 139.95 154.65
*119.00 *130.90 *143.99Expected Rate of Return 10% 10% 10% 10%
92.67 238.9439.31 *50.01 164.22
*21.22 0.00 119.0016.68 110.00*9.00 0.00 119.00
0.00 76.370.00 49.01
Expected Value 16.68 19.66 23.17 110.00 120.29 131.49Expected Rate of Return 18% 18% 9% 9%
Asset Price Tree with OptionsIncludes (*Excludes) Strike PriceAsset Price Tree No Options
Includes (*Excludes) Strike Price Equity Price Tree with OptionsOption Price Tree

50
Table 1: Descriptive Statistics
Panel A: Distributional Statistics
N Mean Std. Dev. Q1 Median Q3 EQUITYVOL 26,729 0.47 0.28 0.26 0.40 0.59 IMPLIEDVOL 12,679 0.45 0.21 0.30 0.41 0.56 ECC 26,763 0.13 0.12 0.02 0.11 0.20 OPTIONS 35,641 0.08 0.06 0.03 0.07 0.11 LEVERAGE 33,004 0.21 0.25 0.00 0.12 0.35 CREDITRISK 30,547 3.42 0.87 3.00 4.00 4.00 SIZE 34,170 5.51 2.36 3.82 5.53 7.17 EARN 35,611 –0.16 0.61 –0.08 0.01 0.06 CHANGE_EARN 34,128 –0.01 0.35 –0.04 0.00 0.03 GROWTH 15,908 0.15 0.08 0.10 0.14 0.20 PROPENSITY 25,759 0.07 0.03 0.06 0.07 0.09 CHANGE_RD 30,635 0.13 2.35 0.00 0.00 0.00 REPRICE 10,546 0.02 0.13 0.00 0.00 0.00 AVG_TERM 26,596 0.46 0.50 0.00 0.00 1.00

51
Table 1 (continued): Descriptive Statistics
Panel B: Pearson (Spearman) Correlations Above (Below) Diagonal
1 2 3 4 5 6 7 8 9 10 11 12 13 14 1 EQUITYVOL 0.60 0.22 0.09 0.10 0.36 –0.36 –0.36 –0.11 0.19 0.15 0.08 –0.01 –0.03 2 IMPLIEDVOL 0.70 0.14 0.07 0.08 0.45 –0.56 –0.37 –0.06 0.24 0.18 0.04 –0.04 –0.02 3 ECC 0.18 0.10 0.00 0.01 0.12 –0.09 –0.05 –0.06 0.11 0.05 0.07 0.00 –0.03 4 OPTIONS 0.12 0.09 –0.02 –0.14 0.28 –0.24 –0.11 0.00 0.28 0.53 –0.01 0.01 –0.05 5 LEVERAGE –0.07 –0.09 0.04 –0.19 –0.03 –0.04 0.07 –0.03 –0.37 –0.40 –0.05 –0.01 0.15 6 CREDITRISK 0.44 0.52 0.07 0.30 –0.13 –0.72 –0.27 –0.06 0.36 0.50 0.03 –0.06 –0.05 7 SIZE –0.37 –0.60 –0.05 –0.21 0.09 –0.74 0.40 0.08 –0.22 –0.49 –0.02 0.09 0.02 8 EARN –0.32 –0.28 –0.02 –0.16 –0.09 –0.49 0.49 0.41 –0.06 –0.33 0.06 0.01 0.02 9 CHANGE_EARN –0.12 –0.09 –0.04 0.00 –0.05 –0.08 0.10 0.30 0.05 –0.07 0.12 0.00 0.00 10 GROWTH 0.27 0.29 0.07 0.32 –0.46 0.40 –0.24 0.11 0.09 0.40 0.08 0.00 –0.13 11 PROPENSITY 0.19 0.21 0.01 0.53 –0.45 0.51 –0.50 –0.20 0.00 0.47 0.05 –0.03 –0.16 12 CHANGE_RD 0.05 0.01 0.03 0.01 –0.03 0.02 0.00 0.00 0.06 0.06 0.04 –0.01 –0.01 13 REPRICE –0.02 –0.05 0.02 0.01 –0.00 –0.06 0.09 0.01 0.00 –0.01 –0.04 –0.01 –0.01 14 AVG_TERM –0.06 –0.05 –0.01 –0.06 0.15 –0.04 0.02 –0.02 –0.01 –0.16 –0.17 –0.01 –0.01
EQUITYVOL is standard deviation of monthly stock returns over subsequent year; IMPLIEDVOL is equity volatility implied by traded options at year-end; ECC is equity cost of capital (Barth, Konchitchki, and Landsman 2010); OPTIONS is employee stock options outstanding (ESO) to the sum of shares and ESO; LEVERAGE is the ratio of the book value of debt to the sum of book value of debt plus the market value of equity; CREDITRISK is estimated credit risk from bond rating prediction model (Barth, Beaver, and Landsman 1998); EARN is annual income before extraordinary items(excluding ESO expense), divided by total assets; CHANGE_EARN is annual change in EARN; GROWTH is analysts' consensus long-term growth forecast, at end of year; SIZE is log of market value of equity; PROPENSITY is the expected value of OPTIONS, excluding segment data (Core and Guay 2001); CHANGE_RD is one-year-ahead change in R&D expenditures; REPRICE is an indicator variable set equal to 1 if the firm disclosed repricing of ESOs for at least one executive during the fiscal year; AVG_TERM is an indicator variable set equal to 1 if the weighted average term of ESOs is above the median for the sample.
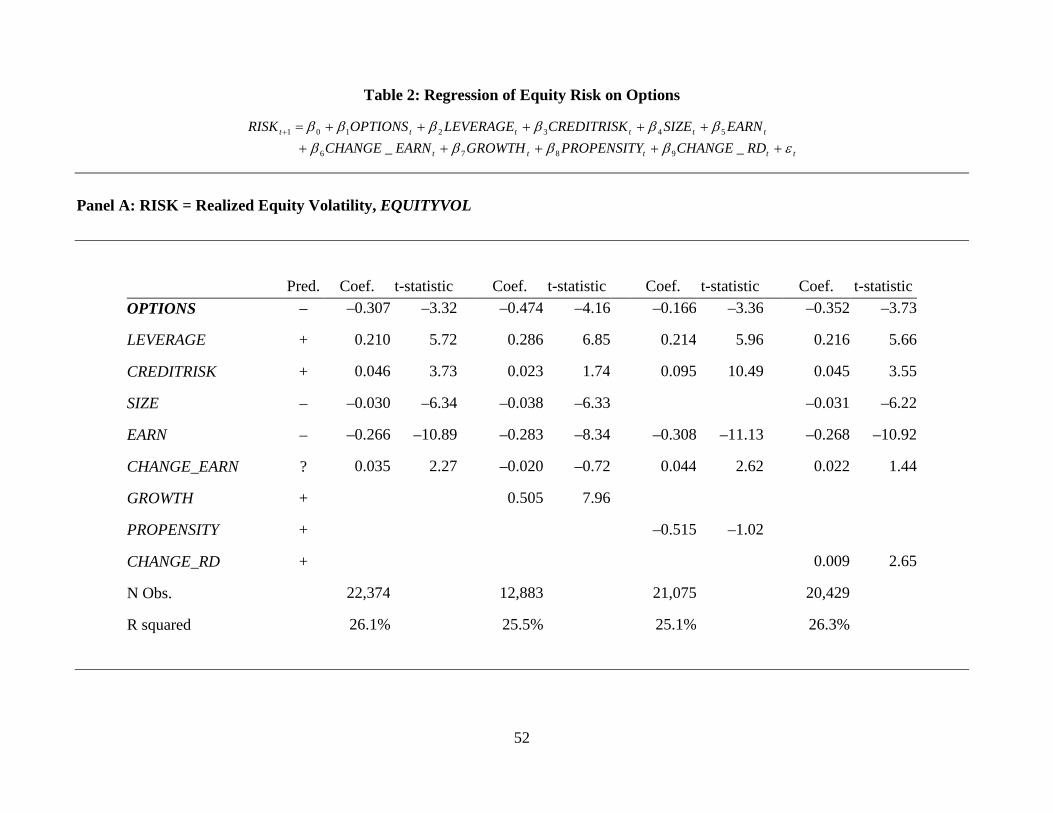
52
Table 2: Regression of Equity Risk on Options
ttttt
tttttt
RDCHANGEPROPENSITYGROWTHEARNCHANGEEARNSIZECREDITRISKLEVERAGEOPTIONSRISK
εββββββββββ
++++++++++=+
__ 9876
5432101
Panel A: RISK = Realized Equity Volatility, EQUITYVOL
Pred. Coef. t-statistic Coef. t-statistic Coef. t-statistic Coef. t-statistic OPTIONS – –0.307 –3.32 –0.474 –4.16 –0.166 –3.36 –0.352 –3.73
LEVERAGE + 0.210 5.72 0.286 6.85 0.214 5.96 0.216 5.66
CREDITRISK + 0.046 3.73 0.023 1.74 0.095 10.49 0.045 3.55
SIZE – –0.030 –6.34 –0.038 –6.33 –0.031 –6.22
EARN – –0.266 –10.89 –0.283 –8.34 –0.308 –11.13 –0.268 –10.92
CHANGE_EARN ? 0.035 2.27 –0.020 –0.72 0.044 2.62 0.022 1.44
GROWTH + 0.505 7.96
PROPENSITY + –0.515 –1.02
CHANGE_RD + 0.009 2.65
N Obs. 22,374 12,883 21,075 20,429
R squared 26.1% 25.5% 25.1% 26.3%

53
Table 2 (continued): Regression of Equity Risk on Options
ttttt
tttttt
RDCHANGEPROPENSITYGROWTHEARNCHANGEEARNSIZECREDITRISKLEVERAGEOPTIONSRISK
εββββββββββ
++++++++++=+
__ 9876
5432101
Panel B: RISK = Implied Volatility, IMPLIEDVOL
Pred. Coef. t-statistic Coef. t-statistic Coef. t-statistic Coef. t-statistic OPTIONS – –0.444 –4.85 –0.438 –4.53 –0.355 –4.65 –0.464 –4.75
LEVERAGE + 0.091 2.43 0.153 4.24 0.104 2.87 0.096 2.44
CREDITRISK + 0.007 0.55 –0.008 –0.60 0.081 10.62 0.008 0.66
SIZE – –0.066 –9.11 –0.065 –7.93 –0.066 –8.50
EARN – –0.312 –9.22 –0.278 –8.36 –0.365 –8.71 –0.307 –8.49
CHANGE_EARN ? 0.065 2.49 0.011 0.30 0.090 2.94 0.060 2.22
GROWTH + 0.460 8.55
PROPENSITY + –0.053 –0.10
CHANGE_RD + 0.001 0.43
N Obs. 11,329 9,262 10,971 10,292
R squared 38.7% 36.9% 29.5% 38.6%
____________________________________________________________________________________________________________
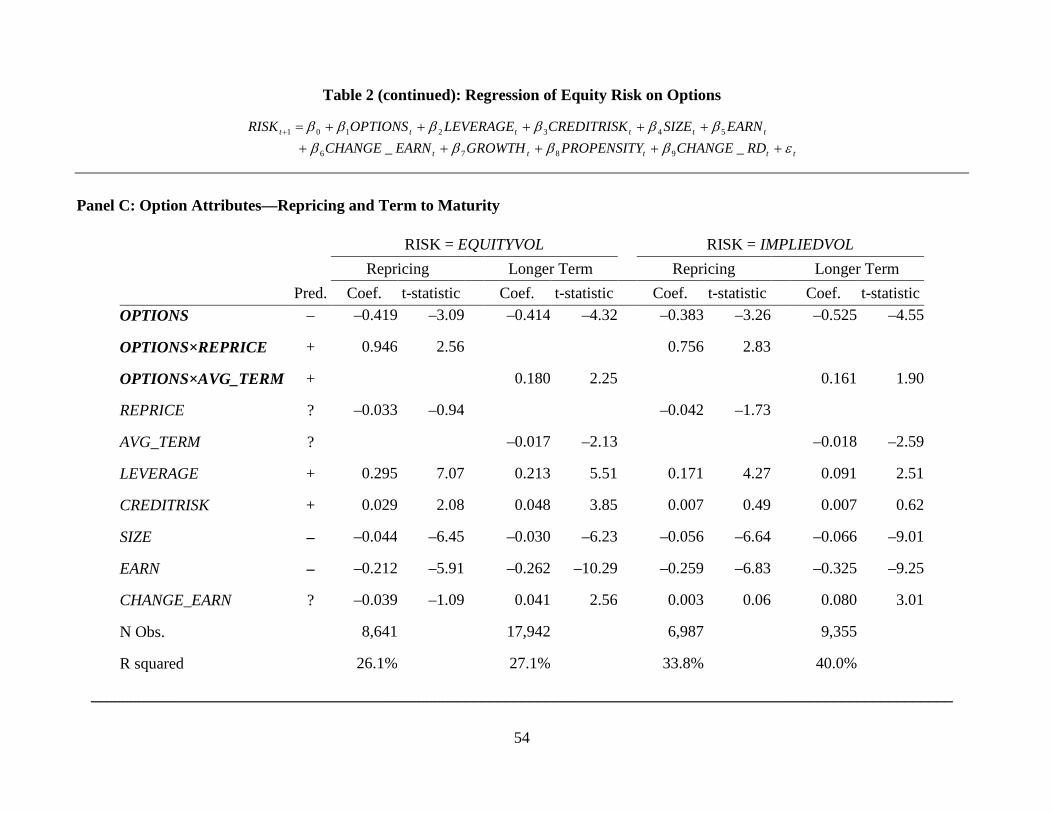
54
Table 2 (continued): Regression of Equity Risk on Options
ttttt
tttttt
RDCHANGEPROPENSITYGROWTHEARNCHANGEEARNSIZECREDITRISKLEVERAGEOPTIONSRISK
εββββββββββ
++++++++++=+
__ 9876
5432101
Panel C: Option Attributes—Repricing and Term to Maturity
RISK = EQUITYVOL RISK = IMPLIEDVOL Repricing Longer Term Repricing Longer Term Pred. Coef. t-statistic Coef. t-statistic Coef. t-statistic Coef. t-statistic
OPTIONS – –0.419 –3.09 –0.414 –4.32 –0.383 –3.26 –0.525 –4.55
OPTIONS×REPRICE + 0.946 2.56 0.756 2.83
OPTIONS×AVG_TERM + 0.180 2.25 0.161 1.90
REPRICE ? –0.033 –0.94 –0.042 –1.73
AVG_TERM ? –0.017 –2.13 –0.018 –2.59
LEVERAGE + 0.295 7.07 0.213 5.51 0.171 4.27 0.091 2.51
CREDITRISK + 0.029 2.08 0.048 3.85 0.007 0.49 0.007 0.62
SIZE – –0.044 –6.45 –0.030 –6.23 –0.056 –6.64 –0.066 –9.01
EARN – –0.212 –5.91 –0.262 –10.29 –0.259 –6.83 –0.325 –9.25
CHANGE_EARN ? –0.039 –1.09 0.041 2.56 0.003 0.06 0.080 3.01
N Obs. 8,641 17,942 6,987 9,355
R squared 26.1% 27.1% 33.8% 40.0%
____________________________________________________________________________________________________________

55
EQUITYVOL is standard deviation of monthly stock returns over subsequent year; IMPLIEDVOL is equity volatility implied by traded options; ECC is equity cost of capital (Barth, Konchitchki, and Landsman 2010); OPTIONS is employee stock options outstanding (ESO) to the sum of shares and ESO; LEVERAGE is the ratio of the book value of debt to the sum of book value of debt plus the market value of equity; CREDITRISK is estimated credit risk from bond rating prediction model (Barth, Beaver, and Landsman 1998); EARN is annual income before extraordinary items, divided by total assets; CHANGE_EARN is annual change in EARN; GROWTH is analysts’ consensus long-term growth forecast, at end of year; SIZE is log of market value of equity; PROPENSITY is the expected value of OPTIONS, excluding segment data (Core and Guay 2001); CHANGE_RD is one-year-ahead change in R&D expenditures; REPRICE is an indicator variable set equal to 1 if the firm disclosed repricing of ESOs for at least one executive during the fiscal year; AVG_TERM is an indicator variable set equal to 1 if the weighted average term of ESOs is above the median for the sample. Regression standard errors are clustered by industry and year.

56
Table 3: Regression of Equity Cost of Capital on Options
tttt
tttttt
DISPERSIONGROWTHMOMBETABMSIZELEVERAGEOPTIONSECC
εβββββββββ
+++++++++=
876
543210
Pred. Coef. t-statistic Coef. t-statistic OPTIONS – –0.197 –2.95 –0.380 –4.55
LEVERAGE + 0.019 1.44 0.064 3.96
SIZE – –0.005 –3.62 –0.013 –5.81
BM – –0.006 –1.55 –0.006 –1.28
BETA + 0.031 4.29 0.025 2.78
MOM + –0.034 –4.93 –0.027 –2.54
GROWTH + 0.158 4.68
DISPERSION + –0.003 –1.44
N Obs. 25,057 11,036
R squared 8.6% 10.8%
ECC is equity cost of capital (Barth, Konchitchki, and Landsman 2010); OPTIONS is employee stock options outstanding (ESO) to the sum of shares and ESO; LEVERAGE is the ratio of the book value of debt to the sum of book value of debt plus the market value of equity; SIZE is the natural log of market value of equity; BM is book value of equity divided by market value of equity; BETA is CAPM beta estimated on monthly returns over rolling 5-year windows; MOM is raw stock return over the first 10 months of the year; GROWTH is analysts’ consensus long-term growth forecast, at end of year; DISPERSION is the natural log of the standard deviation of analysts’ earnings forecasts at end of year.

57
Table 4: Values and Expected Return on Options
Panel A: Distributional Statistics
N Mean Std. Dev. Q1 Median Q3 B-S Value 24,887 0.06 0.07 0.01 0.03 0.06 D-E Value 24,186 0.04 0.04 0.01 0.03 0.05 RET_OPT 19,566 0.22 0.19 0.00 0.19 0.40 ECC 26,763 0.13 0.12 0.02 0.11 0.20 LEVERAGE 33,004 0.21 0.25 0.00 0.12 0.35 BETA 26,763 1.27 0.91 0.60 1.11 1.76 EQUITYVOL 26,729 0.47 0.28 0.26 0.40 0.59 RET_OPT – ECC 19,566 0.09 0.10 0.00 0.06 0.15
Panel B: Pearson Correlations
1 2 3 4 5 6 7 1 B-S Value 0.14 –0.04 –0.02 0.08 –0.20 –0.03 2 D-E Value 0.22 –0.14 0.01 –0.26 0.17 0.00 3 RET_OPT 0.04 –0.17 0.89 0.13 0.12 0.23 4 ECC 0.06 –0.03 0.95 0.01 0.23 0.22 5 LEVERAGE –0.07 –0.34 0.11 0.04 –0.11 0.10 6 BETA –0.16 0.13 0.10 0.13 –0.16 0.31 7 EQUITYVOL 0.11 0.01 0.19 0.18 –0.07 0.41
B-S value is the Black-Scholes option value estimated consistent with Landsman et al. (2006). D-E value is the option value estimated using the method of Daves and Ehrhardt (2007), scaled by market value of equity. RET-OPT is expected return on options (Daves and Ehrhardt 2007); LEVERAGE is the ratio of the book value of debt to the sum of book value of debt plus the market value of equity; BETA is CAPM beta estimated on monthly returns over rolling 5-year windows; EQUITYVOL is standard deviation of monthly stock returns over subsequent year.

58
Table 5: Sensitivity of Option, Common Equity and Debt Values to Changes in Asset Value
Panel A: Median Value Changes by Quintile of Distance to Default
Quintile ΔMVE / ΔMVA
ΔMVD / ΔMVA
ΔMVO / ΔMVA
1 Small Distance to Default 0.73 0.25 0.01 2 0.86 0.11 0.02 3 0.91 0.07 0.02 4 0.97 0.00 0.04 5 Large Distance to Default 0.98 –0.02 0.06
Panel B: Regression of Value Change on Distance to Default
ttt DISTANCEMVAMVX εββ ++=∆∆ 10/
Pred. Coef. t-statistic ∆MVE / ∆MVA + 0.447 5.16
∆MVD / ∆MVA – –0.478 –5.24
∆MVO / ∆MVA + 0.066 8.67
Panel A presents the sensitivities of equity, debt, and option values to changes in asset value across various distances to default. A small (large) distance to default means that default is more (less) likely. ΔMVE is the change in market value of common equity; ΔMVA is the estimated change in net asset value (excl. debt), from the Merton (1974) model; ΔMVD is the estimated change in debt value, from the Merton (1974) model. For estimation procedures for ΔMVA and ΔMVD see Barth, Hodder, and Stubben (2008). MVO is the estimated value of ESOs outstanding (Landsman et al. 2006); DISTANCE is distance to default measured as MVA – book value of debt, scaled by MVA.