are investors rational profit maximisers or do they
TRANSCRIPT
Stockholm School of Economics Department of Economics Master’s Thesis in Economics Academic year 2014-2015
ARE INVESTORS RATIONAL PROFIT MAXIMISERS
OR DO THEY EXHIBIT A GREEN PREFERENCE?
– Evidence from the green bond market
Emmi Östlund (21875)
Abstract
Green bonds are a new debt investment product that has been developed to
stimulate green investments. Using a data set of 28 matching pairs of bonds, the
spread differentials between green and conventional bonds of the same issuer was
explored in order to find out whether investors exhibit a green preference. The
results showed no evidence for the existence of a green preference among investors
and indicated instead that green bonds were traded at a discount compared to their
conventional counterparts. The results indicate that green bonds are unlikely to be a
large catalyst for higher green investment rates as long as there are no targeted
policies that accompany them.
Keywords: Green preference, Investing, Bonds, Utility, Climate change
JEL: G11, G12, H23
Supervisor: Chloe Le Coq
Date submitted: May 14, 2015
Date examined: May 25, 2015
Discussant: Gryte Verbusaityte
Examiner: Maria Perrotta Berlin

2
Acknowledgements
First, I would like thank my tutor Chloe Le Coq for the patience and extremely
valuable feedback that I have got throughout the thesis writing process. Furthermore,
I would like to thank Swedbank DCM for providing me with the data and for
teaching me everything I know about bonds. I would also like to thank course leader
Örjan Sjöberg and my class mates for valuable input during the mid-term seminar.
Last but not least, I would like to thank friends and family for all the support and for
the proof-reading you did for me in the final stages of the thesis.

3
Table of contents
Acknowledgements ................................................................................................................ 2
Terminology ........................................................................................................................ 4
I. Introduction .................................................................................................................... 5
i. Purpose ........................................................................................................................ 6
ii. Research Question and Hypothesis ......................................................................... 6
II. Background ..................................................................................................................... 7
i. Behavioural literature ............................................................................................... 11
III. The capital markets and the development of green bonds ................................ 12
i. The capital markets .................................................................................................. 12
ii. Green Bonds ............................................................................................................. 13
Incentives and motivation ........................................................................................... 15
IV. Previous literature .................................................................................................... 17
i. Bond spreads ............................................................................................................ 18
Corporate bond spreads .............................................................................................. 18
Modelling the yield curve ............................................................................................ 20
ii. Speciality bonds ........................................................................................................ 21
iii. Ethical (mutual) funds ............................................................................................. 22
V. Empirical strategy ......................................................................................................... 23
I. Bond valuation ......................................................................................................... 23
II. Bond yields ................................................................................................................ 24
III. Matching ................................................................................................................ 24
VI. Data ............................................................................................................................ 27
VII. Results ........................................................................................................................ 28
VIII. Discussion/Robustness ........................................................................................... 32
i. Data and Methodology ............................................................................................ 32
ii. Other considerations ............................................................................................... 32
IX. Conclusion ................................................................................................................ 33
References .............................................................................................................................. 36
Appendices ............................................................................................................................ 41
Appendix I ......................................................................................................................... 41
Appendix II ....................................................................................................................... 42
4
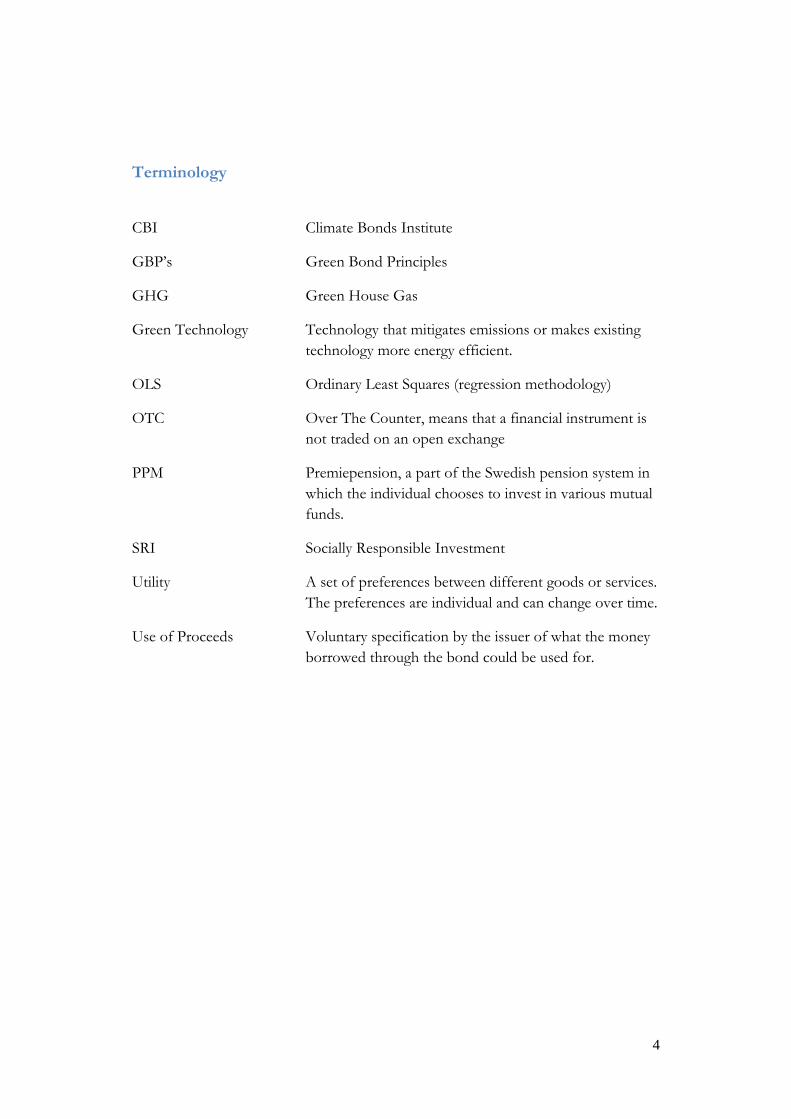
Terminology
CBI Climate Bonds Institute
GBP’s Green Bond Principles
GHG Green House Gas
Green Technology Technology that mitigates emissions or makes existing
technology more energy efficient.
OLS Ordinary Least Squares (regression methodology)
OTC Over The Counter, means that a financial instrument is
not traded on an open exchange
PPM Premiepension, a part of the Swedish pension system in
which the individual chooses to invest in various mutual
funds.
SRI Socially Responsible Investment
Utility A set of preferences between different goods or services.
The preferences are individual and can change over time.
Use of Proceeds Voluntary specification by the issuer of what the money
borrowed through the bond could be used for.

5
I. Introduction
One of today’s most pressing concerns for policy makers all over the world is the
climate change that poses a severe threat to life on earth as it is today. Some people
remain sceptical to whether the global warming is due to human activity. For
example, as late as in January 2015 the US senate voted regarding this issue in which
the majority of senators refused to accept a causal relationship between these two
factors (Goldenberg, 2015). However, most climate researchers seem to agree that
the current warming is anthropogenic and that this development needs to be halted
(Stern, 2006).
In order to stop an increasingly alarming development, it is estimated that € 55-80
billion has to be invested above the business as usual level each year with additional
investments needed for developing country adjustments (Stewart et al., 2009). The
current rate of global investment in green technology is too low and therefore, it is
important to find ways to stimulate the investment rates – a central theme of this
thesis.
Since the required investments are so substantial, it is necessary to involve private
capital investors. The limited budgets of the public sector are neither likely to be able
to sustain increased investment rates nor to find the political support to try to do so.
Most of the private risk-willing capital in the world can be found in the capital
markets and developing ways to channel capital markets investments to green
activities is thus crucial for reaching the necessary levels of green technology
investment. However, private investors have different incentives than governments
in that they lack responsibility to care for society as a whole.
Financial theory often assumes that investors are rational profit maximisers but
experiments have often shown that human beings are in fact not purely rational and
care about the welfare of other people (i.e. show altruistic behaviour) as well as social
norms (Levitt & List, 2007). The increasing popularity of organic products indicate
that people are in fact willing to pay for greener products but the question is whether
this is also true when it comes to investment. If investors have a green preference, i.e.
if they value the same investment opportunity higher if the investment is green, they
would be willing to give up some of their return in order to invest in green projects.
Recently, a new type of debt instrument, called green bonds, has been developed. In
short, this is a means of financing where the proceeds of the bond have to be used
for green purposes as defined by a set of principles stated at the issuance of the bond.
Green bonds are designed to target large institutional investors that usually have a
substantial part of their total funds invested in bonds. Since the bond market is
currently $ 83 trillion in size (Barclays, 2014) and growing, it has the potential to fund
a large part of the investments needed in green technology (Calder et al., 2014).

6
The market seems to have embraced the new investment product (Barclays, 2014).
Nevertheless, assuming that capital markets are relatively efficient, in the long run
green bonds are likely to have a relatively limited impact on green investment rates
unless investors are willing to lend money cheaper (accept lower returns) to invest in
green technology. If investors require the same return for green investments as for
conventional ones, green bonds should be accompanied with policy initiatives to
create more impact.
i. Purpose
The purpose of this thesis is to investigate whether investors are strictly rational and
look for the highest return possible at a certain risk level or if they value contribution
to society. In this thesis, the scope of social welfare is limited to the contribution to
green development. Practically, if investors do put an additional value in contributing
to green development they would exhibit a green preference. This means that for the
same risk level, the investors would be willing to accept a lower return on their
investment if the investment is considered green. This is only true if investors’ utility
curves shift downwards when adding greenness as a factor in their respective utility
curves.
Most studies on ethical investments investigate a hypothesis that looks at whether
ethical investments are costly, i.e. have lower returns due to the constraint of the
investment universe. However, the opposite question, whether investors have a green
preference and thus accept lower returns, is seldom asked. Yet, if the goal is to
increase the green investment rate at a much higher speed than the growth in world
GDP or the share of green technology in the capital markets, this is a much more
important question.
The first perspective, when the ethicality is seen as a cost, merely answers the
question whether ethical investments can be as profitable as the total market. A green
preference, on the other hand, would show that green investments might not need to
provide the market rate of return and still be acceptable to investors. If this holds
true, green corporations have a lower cost of financing for the part of their business
that is green which could, in turn, increase the size of the market that is invested in
green.
This thesis contributes to the existing literature by introducing the concept of green
preference to the literature on capital markets and critically investigates whether
green bonds can actually stimulate green investments on their own or not.
Additionally, to my knowledge, this is the first academic paper that investigates the
green bond market.
ii. Research Question and Hypothesis
Following this, the research question is “Are investors rational profit maximisers or
do they show a green preference?”
7
The tool used for investigating this question is the yield of green bonds compared to
their conventional counterparts. A positive spread difference would mean that green
bonds are traded at a discount, which would indicate that the value of the bonds is
lower than conventional bonds. If the spread difference is negative, it means that
green bonds are trading at a premium, which means that the issuer is financing the
investment cheaper with green bonds.
The hypothesis is that there are currently no significant differences between the two
types of bonds. This is due to previous research indicating that there are no
differences in the returns of ethical and conventional investments (see e.g. Statman,
2000). Additionally, the Swedish pension fund AP7 found in a survey that only 25%
of the respondents thought that ethicality should be considered even if it led to lower
returns (Elsässer, 2014). This is a low number considering that stated and actual
preferences normally differ (Friberg & Sanctuary, 2012) which indicates an even
lower true preference for investing ethically.
A second hypothesis is that there are no differences in volatility between the bonds.
This is important to test since a difference in volatility means that the investment is
more risky and could also be an indication of lower liquidity.
The advantage of using green bonds instead of ethical funds (that would have more
data available), is that ethical funds tend to be relatively permissive on the type of
investment that could be included in such a fund. Not only does it mean that other
ethical aspects than the environment are included, the restriction on eligible activities
is in general less stringent. Green bonds have the advantage of solely focusing on
green investing which is more suitable when investigating green preference.
II. Background
The climate change has been on the global agenda for a few decades but the progress
of mitigating emissions and the adaptation of human activity to fit the planets’
ecosystems still seems far away. The aggregate effects of the warming and pollution
are not certain and are highly dependent on actions taken today but all scenarios pose
significant threats to human lives (see Harris & Roach, 2007 p.12 for a good
overview of the different scenarios).
There have been many initiatives to take action against the climate change on a global
scale but there have been little progress in negotiating solid deals. In recent years,
many countries have introduced their own initiatives. For example, today China is
the world leader in renewable energy manufacturing and has the highest installed
capacity of renewable power generation (REN21, 2014, p.102). These initiatives are
extremely important but since global commons (i.e. global resources such as the
atmosphere or the ocean) are considerably larger than local commons (Ostrom,

8
2010) these isolated efforts are not going to be enough and combatting the climate
change will require global cooperation.
It is estimated that a total of $53 trillion in green investments (Boulle et al., 2014) are
necessary up until 2035 in order to get the world on a 2 degree increase trajectory
which is seen as the minimum amount of warming that is possible when taking into
account the emissions that have already occurred. The current rate of investment is
significantly lower than this, which creates a sense of urgency among governments
and other policy makers to increase these investments. If it can be assumed that
markets are relatively efficient this problem arises because the optimal individual
investment rates in green technology is lower than the social optimal level.
Green technology is a very broad concept and there are many different definitions.
However it is important to stress that both mitigation and adaptation activities are
included in the concept. There is not only a shift from dirty activities to green
activities required but also the allocation of research needs to be shifted in the same
direction (Aghion et al., 2009). Furthermore, it is important to find an efficient
allocation between more short-term solutions that are focused on adaptation of
existing technologies and long-term solutions that mitigate the problems altogether.
This means that it is necessary to create various investment opportunities since
investors have different needs and they need to be matched with the needs of the
corporations that they are supposed to finance.
Investors have seemed to be concerned about the underinvestment in green
technology and many of them have expressed that they want to use their investments
to stimulate green growth. The earliest examples of this are mutual and pension
funds that have specific mandates for investing in sustainable technology. The
question is however, whether investors care enough about social welfare to accept
lower returns. Researchers have shown that in most cases the return of ethical and
conventional investments do not differ significantly. This is puzzling since then, the
investors are not really showing any preference for social welfare and it points
towards that they are simply maximising their returns under an additional constraint.
Investors can only be seen as having a preference for social welfare if they are willing
to give up some of their return in order for the investment to be ethical.
Furthermore, it is likely that only a preference for social welfare can increase a sub-
optimally low investment rate, since if the investments where good enough to return
the market rate of return, they would have already been funded.
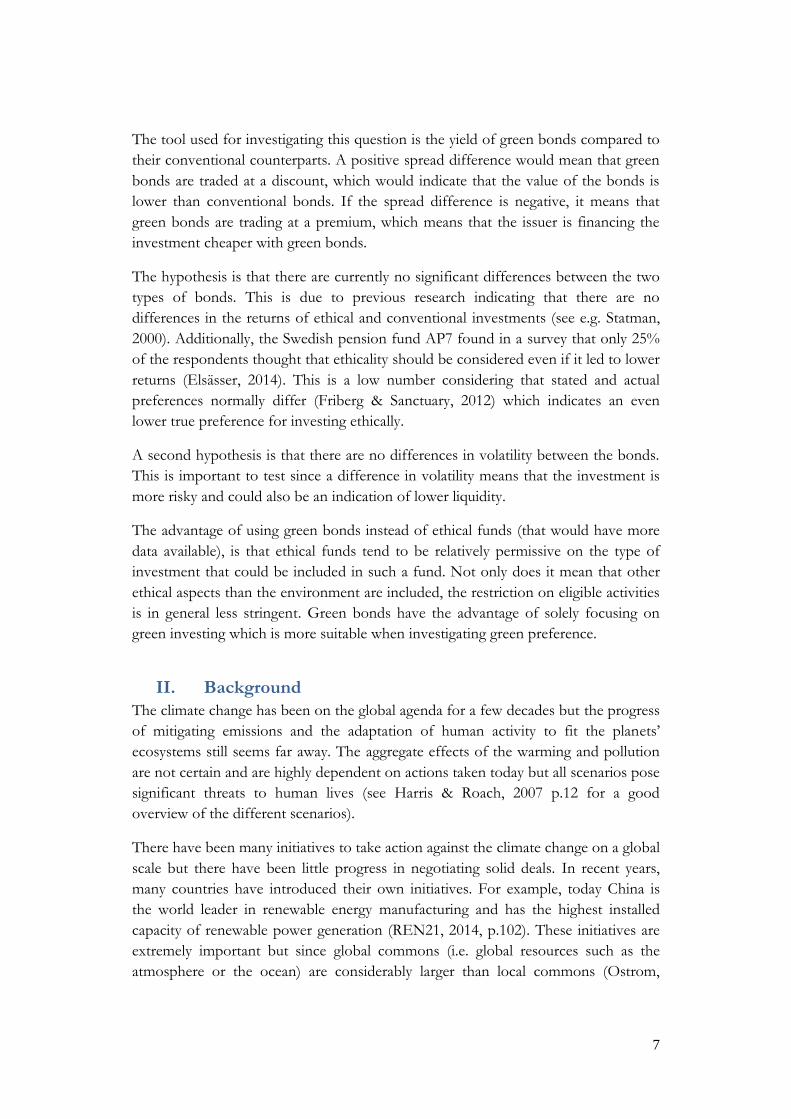
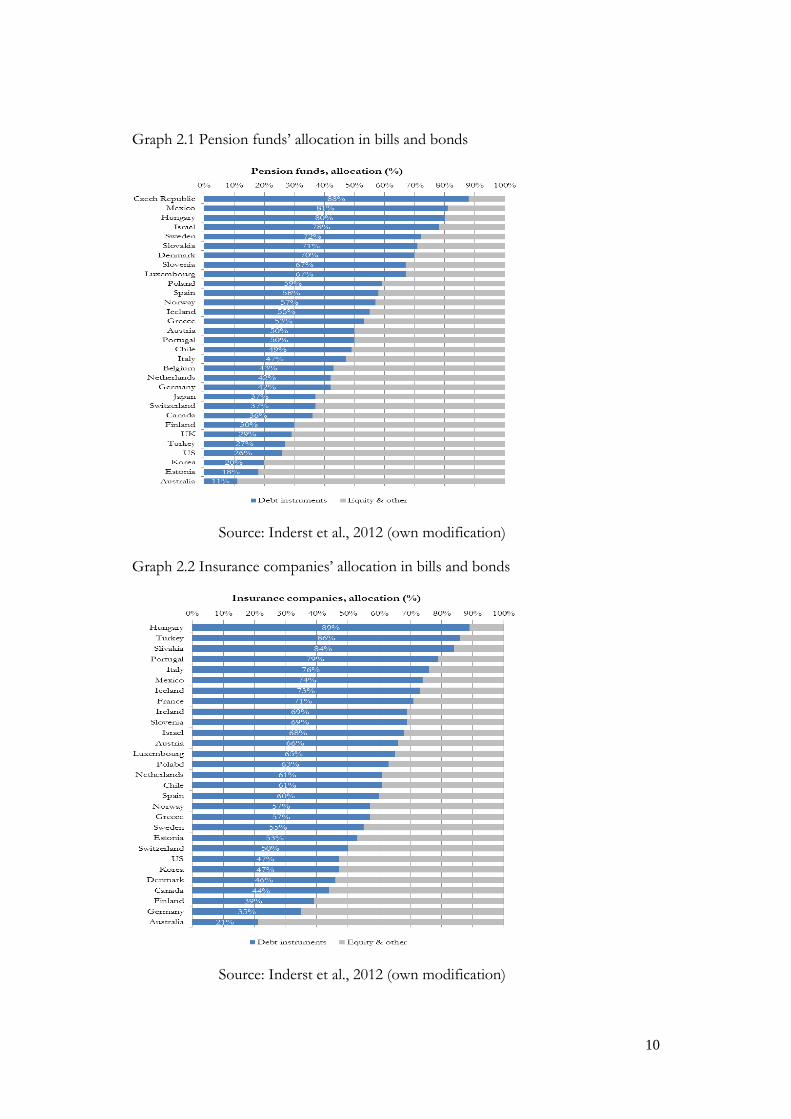
As mentioned previously, most of the risk-willing private capital is invested on the
capital markets. Because of the substantial need for investment, capital markets
financing of green growth can only be successful if instruments are designed to
attract investors with a considerable asset base such as pension funds, sovereign
wealth funds and insurance companies (Reichelt, 2010). This kind of investors often

9
has a large part of their investments in debt instruments (see Graph 2.1 and 2.2
below) which is what makes green bonds particularly interesting.
10
Graph 2.1 Pension funds’ allocation in bills and bonds
Source: Inderst et al., 2012 (own modification)
Graph 2.2 Insurance companies’ allocation in bills and bonds
Source: Inderst et al., 2012 (own modification)

11
i. Behavioural literature
Although it is often assumed in theory that people are completely rational decision
makers, there is an extensive body of research that indicate that we are only limitedly
so (see Kahneman, 2011 for a good overview of cognitive biases). This irrational
tendency has also been observed on the capital markets. For example evidence show
that we are unwilling to realize losses and often stick to low-performing stocks
instead of taking the loss and invest in something better-performing (Riple, 2013).
Behavioural economics and behavioural finance look at the psychological aspects of
the decision making process of economic agents. Some of the evidence indicates that
we are both altruistic and willing to incur costs to punish behaviour that we believe is
unjust (Bazerman & Moore, 2013). For example, it turns out that we value fairness
and reject low bids in ultimatum games (Riple, 2013).
Evidence contradicting the theory that humans are rational profit maximisers can
also be found when studying the brain. In an experiment, scientists analysed neural
activity in the brain when subjects made mandatory or voluntary transfers to a local
charity. They showed that both the pure altruism (taxation) and the “warm glow”
(voluntary transfer) type of giving elicited neural activity in parts of the brain that are
linked to reward processing (Harbaugh et al., 2007)
If human beings are indeed only limitedly rational, a simple risk-return maximisation
does not show the investors true preferences. Instead, we need to look at the
investors’ utility curves. If investors indeed have a green preference, adding the green
label to a bond is going to shift or change the shape of their utility curve.
In economic language this means that an additional factor, which could be seen as a
beta of a regression, exist in the utility curve that corresponds to the greenness of the
bond. Since green technology is beneficial for society, an investor that values social
welfare should see the greenness as a good. The question is thus whether greenness
creates additional utility for investors, which would push the utility curve of the
investor to the right if the investment is considered green. The existence of a shift in
the utility curve is the central question of this thesis. Although this might sound
abstract, on an individual level people make these kinds of decisions on an everyday
basis.
Let us illustrate this reasoning with a practical example from regular life. Nowadays,
we have organic and conventional produce in the grocery store and generally the
organic product is more expensive. Sometimes the difference is a few percent but for
some products the difference is much higher. According to economic theory, people
would only buy organic products at a higher price if they are compensated for this by
some other factor that increases their utility.
If we look at a hypothetical example with oranges we have that in terms of price:

12
1.5 kg oranges (conventional) = 1 kg oranges (organic)
Clearly, 1.5 kg of oranges is more than 1 kg of oranges, so why would anyone buy
organic oranges? The answer is of course that there are differences between the
oranges. Many people believe that organic products have different quality than
conventional products, like tasting better and being healthier (Hoffman et al., 2014)
but sometimes they are also perceived as less lasting (Menigo, 2015). The fact is that
many people buy organic produce simply because it is better for the environment
(Hoffman et al., 2014). This means that whether or not there are differences in
quality,
U(1 kg oranges (conventional)) < U(1 kg oranges (organic))
Thus, the consumer is indifferent between conventional and organic oranges when:
U(O(p,q,S)) = U(O(p,q,S)) + U(Green)
Where O=orange
p = price
q= quantity
S= quality (vector of quality determinants)
Green = green preference
The capital markets case is slightly different and more complicated than in the
example above because many investors do not maximise their own utility but the
utility of the firm that they are employed or the utility of their customers. The idea
behind green preference is however the same and this thesis is looking at whether the
green bond market can give any evidence of the existence of a U(green) factor on the
bond market.
III. The capital markets and the development of green bonds
i. The capital markets
The capital markets are market places that match risk-willing capital (investors) with
corporate financing needs. In order to accommodate different types of needs, there
are nowadays several different categories of investment products (Berk & DeMarzo,
2007).
The two main divisions within capital markets are the debt markets and the equity
markets. The debt market, which mainly consists of bills and bonds, is the largest
part of the market estimated at around $80 trillion which corresponds to
approximately 75 % of the total market. The typical investors are large institutional
investors such as pension funds, insurance companies and mutual funds. Individual
investors represent a smaller share of the market compared to the equity market due

13
to minimum investment limits, called denominations, being relatively high. Another
barrier for individual investors is the fact that bonds are traded over the counter
(OTC) which requires that you have contact with a broker, either directly or through
your bank contact.
ii. Green Bonds
Green bonds are a relatively new phenomenon on the market and were pioneered by
the European Investment Bank and the World Bank in 2007/2008 when investors
approached them about creating a green investment product. A green bond is a
regular bond but has one extra constraint which is that the money raised from the
bond (henceforth called the use of proceeds) can only be used for financing green
projects and activities.
Due to initial inconsistencies in the utilisation of the term green bonds, The Green
Bond Principles (GBPs) were developed by an industry group consisting of various
market actors since they realised that the uncertainties lead to a lower credibility of
the product. Green use of proceeds were thus defined and divided into eight non-
exhaustive categories (ICMA, 2015):
Renewable energy
Energy efficiency (including efficient buildings)
Sustainable waste management
Sustainable land use (including sustainable forestry and agriculture)
Biodiversity conservation
Clean transportation
Sustainable water management (including clean and/or drinking water)
Climate change adaptation
14
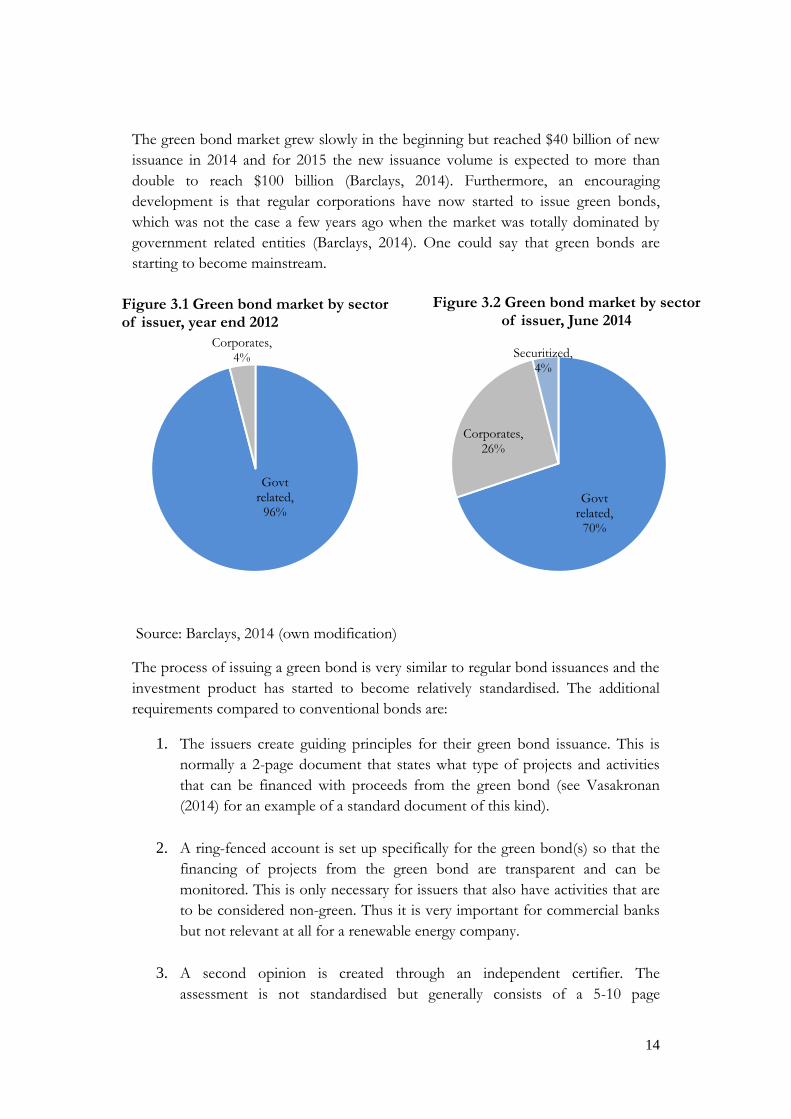
The green bond market grew slowly in the beginning but reached $40 billion of new
issuance in 2014 and for 2015 the new issuance volume is expected to more than
double to reach $100 billion (Barclays, 2014). Furthermore, an encouraging
development is that regular corporations have now started to issue green bonds,
which was not the case a few years ago when the market was totally dominated by
government related entities (Barclays, 2014). One could say that green bonds are
starting to become mainstream.
Source: Barclays, 2014 (own modification)
The process of issuing a green bond is very similar to regular bond issuances and the
investment product has started to become relatively standardised. The additional
requirements compared to conventional bonds are:
1. The issuers create guiding principles for their green bond issuance. This is
normally a 2-page document that states what type of projects and activities
that can be financed with proceeds from the green bond (see Vasakronan
(2014) for an example of a standard document of this kind).
2. A ring-fenced account is set up specifically for the green bond(s) so that the
financing of projects from the green bond are transparent and can be
monitored. This is only necessary for issuers that also have activities that are
to be considered non-green. Thus it is very important for commercial banks
but not relevant at all for a renewable energy company.
3. A second opinion is created through an independent certifier. The
assessment is not standardised but generally consists of a 5-10 page
Govt related,
70%
Corporates, 26%
Securitized, 4%
Figure 3.2 Green bond market by sector of issuer, June 2014
Govt related,
96%
Corporates, 4%
Figure 3.1 Green bond market by sector of issuer, year end 2012

15
document where the company’s project profile and the industry sector as a
whole is analysed. The company’s environmental policies and own
adaptations to difficulties with standards etc. is also discussed in order to
assess the possibility for the company to ensure a high standard on their
green activities.
4. A yearly investment letter is created where there are descriptions to the
investors what kind of projects that have been financed through the use of
proceeds.
It is important to understand that even though the money raised from a green bond
can only be used to finance activities that are defined in the green bond principles as
green, the money to pay the coupons and the payback of the principal investment at
maturity can come from any cash flow of the company. The default risk of the bond
is thus identical to a conventional bond of the same issuer (given they have similar
strucutral features).
There are some additional costs involved in issuing green bonds (Climate Bonds
Initiative, 2014). First, there is a fee to the third-party independent verifier that issues
the second opinion about the bond (step 3 in the process above). Second, it is
required that the bond is registered by the Climate Bonds Standard Board (CBSB)
which costs one tenth of a basis point, i.e. 0.001% of the total bond. None of these
costs could be considered to be a significant cost to the issuer. Apart from this, there
are some costs associated with regularly providing information to investors and
monitoring entities but these are also small and unlikely to discourage from issuing
green bonds.
Hence, once the bond has been issued, the additional constraints of a green bond
are:
The limitation of the use of proceeds to green activities
The creation of yearly information material to investors so that they can
monitor their investment.
For investors, green bonds do not create any additional constraints since this is a
commitment made solely on the issuers’ side. However, if the investor is strict about
monitoring the use of proceeds of the green bond, there will be some extra costs
since they need to take time to read and analyse the projects that have been funded
through the bond.
Incentives and motivation
What is the rationale behind green bonds? In order to understand the potential
benefits of green bonds, it is important to define the different incentives and
motivations for both issuing and investing in this type of bond. In other words, we

16
need to understand why this type of product is interesting from the perspective of
the market.
The issuers’ perspective
For the issuer, the activities or research that could be labelled as green development
and financed with a green bond typically already exist in their corporate portfolio.
Thus, it is not a major disruption in their usual business but it requires corporations
to define what part of their business that could legitimately be considered green.
The motivation of the issuer could principally be divided into two main categories,
financial and marketing reasons. The former consist of investor diversification,
strategic motivations or if issuing green bonds are a cheaper means of financing.
Marketing reasons could for example be to position and promote the company as a
socially responsible corporation or a way to provide a service to important investors
if they have green investment mandates that they would like to fill.
Most issuers and adviser point out that green bond issuances tend to attract new
investors to firms which mean that the investor base is diversified and broadened.
This could be beneficial from a cost perspective because it creates a bigger market
for the firms bonds. Another way of exploiting a market diversification is to issue
green and conventional tranches of bonds in order to find more market depth (i.e. to
raise more money).
The investors’ perspective
In section II above, some of the behavioural aspects of investing were discussed.
However, there are many reasons why investors might choose to invest in a green
bond and all of these are of course not irrational. As seen in the table below, there
could be pure financial reasons why an investor would prefer to invest in a
corporation that issues green bonds, for example, sometimes corporations that put a
lot of effort in investing in green development are seen as safer in the long-term
perspective because of expected shifts in technology or the possibility of stricter
regulations.

17
Table 3.3 Motivations for green investing
Source: Inderst et al., 2012
Although out of scope for this thesis, it is necessary to understand the idea of why
green bonds could make corporations focus more on green activities. If green
financing is indeed cheaper, corporations will have the incentive to shift their
activities into projects that are green because of their lower cost of financing.
Moreover, some green projects that previously had lower return on investment than
the cost of financing might be possible to be realised if this cost goes down. Another
possible effect that is true whether or not green financing is cheaper, is that green
bonds forces corporations to earmark some of their money to green activities which
could increase the size of the budget for these products. Last but not least, if
commercial or development banks issue green bonds, they have a certain amount of
targeted funding for green projects which in turn enhances the chance of getting
financed for firms with green activities.
IV. Previous literature
Green bonds are a new phenomenon and despite the fact that several policy papers
have been published by investment advisers and sovereign agencies, there have not
yet been any academic studies in the subject. However the literature on bond pricing
and ethical investments in general is more developed and can be used to find a
suitable methodology for investigating green bond yields. This section will summarise
Financial considerations
Extra-financial considerations
Reputational considerations
Compliance and fiduciary duty
Portfolio return criteria
Ecological Of the investor and the investee companies
Domestic law and regulations
Portfolio risk criteria Scientific Pressure by politicians, media, NGOs etc.
International conventions
Portfolio diversification criteria
Ethical/Religious Intangible asset such as community investing
Voluntary industry codes
Long-term risk considerations
Political/Social Marketing tool Disclosure regulation
Internalization of externalities
Other “norm” based
Good governance codes
Double or triple bottom line
Part of fiduciary obligations

18
the relevant part of this literature and draw some conclusions regarding the suitable
methodology for this thesis.
i. Bond spreads
Modern portfolio theory is a line of theory that attempts to explain asset prices and
construct optimal investment portfolios by maximising return at different risk levels.
Markowitz (1952) claimed that all investors aim at achieving the highest possible
return at a given risk level. Mogdliani and Miller (1961) developed this into the
theory of the rational investor. This article assumed perfect information and that all
actors where knowledgeable about how to maximise their return. Sharpe (1964) used
the same ideas to create the capital asset pricing model (CAPM) which gives a simple
relationship between the values of all securities on the capital markets. According to
these theories, diversification of assets leads to the elimination of idiosyncratic risk
which means that the investors need only to get compensated for the exposure to the
systematic (market-wide) risk.
The literature on the drivers of bond spreads is tightly connected to modern
portfolio theory and was pioneered by a seminal article regarding the optimal capital
structure written by Mogdliani and Miller (1958) in which the authors set up the
foundations for the valuation of firms in a world of uncertainty. Optimal leverage
structure has been quantitatively investigated by Brennan and Schwartz (1978) and
Fama and French (1993) extended this to model common risk factors in the returns
of stocks and bonds where they show that some balance sheet measures explain part
of credit spread differentials.
However, it has been shown that structural bond pricing models lack accuracy (Eom
et al., 2004) This could be due to restricting assumptions that biases the estimation
results. For example empirical studies have shown that the traditional Black-Scholes
(1973) model and the extension by Merton (1974) underestimates credit spreads due
to the assumption that default only occurs when a firm has exhausted all its assets
(Longstaff & Schwartz, 1995). However, most models tend to over predict bond
spreads on average, especially for bonds from firms with high leverage (Eom et al.,
2004).
Corporate bond spreads
Following this, it is clear that there is no real consensus in what the excess spread of
corporate bonds compared to government bonds consists of. Default risk (and the
expected loss given default) is the most intuitive part of the excess spread and the
effect of this factor can be estimated through the credit rating. Nevertheless, the
extent to which this parameter explains the bond spread is debated. What all
researchers seem to agree upon is that default risk does not explain all of the spread.
Other factors that are commonly acknowledged to have explanatory power are:
19
Tax effects: government bonds are often taxed differently to corporate bonds
and some studies (e.g. Elton et al. (2001)) find that the tax effect is indeed very
important in a data set with US bonds.
Risk premium: corporate bonds are relatively more risky than government
bonds and if this risk is systematic rather than diversifiable (as is the conclusion
of Elton et al. (2001)) investors will demand an extra premium for holding this
risk.
Liquidity: some researchers argue that liquidity issues are more important than
the two factors above (e.g. Chen et al. (2007)) for example since some
investors such as asset managers are reluctant or cannot hold illiquid bonds
due to requirements of marking their portfolios to market.
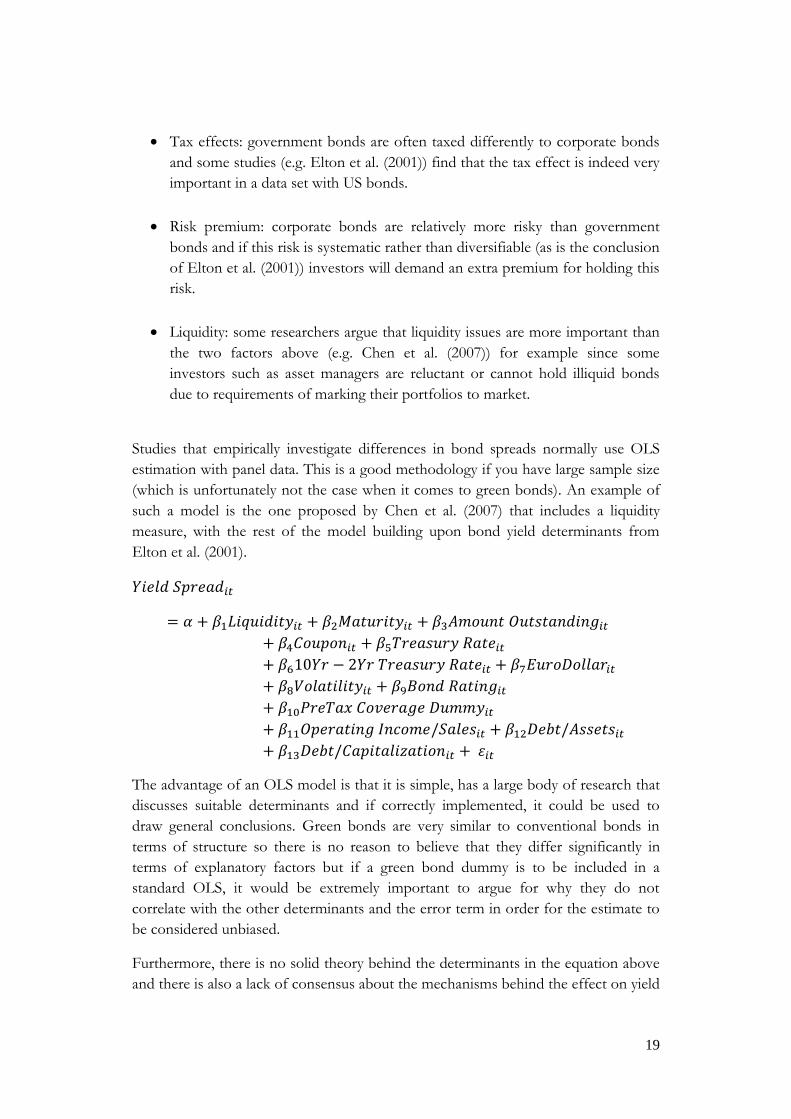
Studies that empirically investigate differences in bond spreads normally use OLS
estimation with panel data. This is a good methodology if you have large sample size
(which is unfortunately not the case when it comes to green bonds). An example of
such a model is the one proposed by Chen et al. (2007) that includes a liquidity
measure, with the rest of the model building upon bond yield determinants from
Elton et al. (2001).
𝑌𝑖𝑒𝑙𝑑 𝑆𝑝𝑟𝑒𝑎𝑑𝑖𝑡
= 𝛼 + 𝛽1𝐿𝑖𝑞𝑢𝑖𝑑𝑖𝑡𝑦𝑖𝑡 + 𝛽2𝑀𝑎𝑡𝑢𝑟𝑖𝑡𝑦𝑖𝑡 + 𝛽3𝐴𝑚𝑜𝑢𝑛𝑡 𝑂𝑢𝑡𝑠𝑡𝑎𝑛𝑑𝑖𝑛𝑔𝑖𝑡
+ 𝛽4𝐶𝑜𝑢𝑝𝑜𝑛𝑖𝑡 + 𝛽5𝑇𝑟𝑒𝑎𝑠𝑢𝑟𝑦 𝑅𝑎𝑡𝑒𝑖𝑡
+ 𝛽610𝑌𝑟 − 2𝑌𝑟 𝑇𝑟𝑒𝑎𝑠𝑢𝑟𝑦 𝑅𝑎𝑡𝑒𝑖𝑡 + 𝛽7𝐸𝑢𝑟𝑜𝐷𝑜𝑙𝑙𝑎𝑟𝑖𝑡
+ 𝛽8𝑉𝑜𝑙𝑎𝑡𝑖𝑙𝑖𝑡𝑦𝑖𝑡 + 𝛽9𝐵𝑜𝑛𝑑 𝑅𝑎𝑡𝑖𝑛𝑔𝑖𝑡
+ 𝛽10𝑃𝑟𝑒𝑇𝑎𝑥 𝐶𝑜𝑣𝑒𝑟𝑎𝑔𝑒 𝐷𝑢𝑚𝑚𝑦𝑖𝑡
+ 𝛽11𝑂𝑝𝑒𝑟𝑎𝑡𝑖𝑛𝑔 𝐼𝑛𝑐𝑜𝑚𝑒/𝑆𝑎𝑙𝑒𝑠𝑖𝑡 + 𝛽12𝐷𝑒𝑏𝑡/𝐴𝑠𝑠𝑒𝑡𝑠𝑖𝑡
+ 𝛽13𝐷𝑒𝑏𝑡/𝐶𝑎𝑝𝑖𝑡𝑎𝑙𝑖𝑧𝑎𝑡𝑖𝑜𝑛𝑖𝑡 + 𝜀𝑖𝑡
The advantage of an OLS model is that it is simple, has a large body of research that
discusses suitable determinants and if correctly implemented, it could be used to
draw general conclusions. Green bonds are very similar to conventional bonds in
terms of structure so there is no reason to believe that they differ significantly in
terms of explanatory factors but if a green bond dummy is to be included in a
standard OLS, it would be extremely important to argue for why they do not
correlate with the other determinants and the error term in order for the estimate to
be considered unbiased.
Furthermore, there is no solid theory behind the determinants in the equation above
and there is also a lack of consensus about the mechanisms behind the effect on yield

20
spreads that these determinants are assumed to have. This makes it difficult to
interpret results and also raises various questions. For example, it is questionable
whether some of the determinants included in the regression, like the EuroDollar
dummy and the various Treasury rates are equally relevant for bonds with different
currency denominations. In the end, this might require that only a single currency is
used which is not a suitable strategy if the sample size is limited. Data availability
would further decrease the sample size since this method requires access to a large
variety of data, of which each represents a risk to biasing the estimates if they are
measured incorrectly.
Last but not least, green bonds are a fairly recent phenomenon but since financial
data is collected daily, it is possible to obtain quite a few observations. Some of the
other terms in the estimation are however only observed on a much more
uncommon basis. This is especially true for the three last terms of the expression,
derived from the Fama-French (1993) model, which could be observed quarterly at
best.
Modelling the yield curve
Another feasible method is using a Monte Carlo simulation in order to forecast the
yield curve of conventional bonds and green bonds respectively. This method was
pioneered by Nelson and Siegel (1987) (and thus called the Nelson-Siegel model) and
was refined by Diebold and Li (2006). The assumption of the model is that the yield
curve can be simulated using an equation. The original Nelson-Siegel (1987) proved
adequate for estimating the term structure of US Treasury bills. The data utilised
consisted of 37 samples of yield and term to maturity observations collected between
1981 and 1983. Since green bonds are very similar in terms of structure, coupon and
costs, and as long as the issuers are matched for the respective yield curves, there is
no reason to believe that they should have a different representation than for
conventional bonds.
The advantage of using a simulation is that unlike OLS it is not necessary to identify
parameters that affect bond yields. However, the green bond market is immature and
the bonds that have been issued have been mainly issued in the time span between 5-
10 years which means that we do not have data for estimating the longer maturity
range of the yield curve. Since it is also necessary to have several bonds from the
same issuer, it would only be possible to use this method on two of the issuers
because of the limited data availability, and even then, the data quality would be
relatively poor. The yield curves could also be estimated on the whole market but
that would require even better data availability.
Additionally, the issuers that potentially have enough bonds outstanding are
supranational agencies and these issuers are very special since they often have high
21
ratings (AAA-AA) due to government guarantees. Thus, no general conclusions
could be drawn if this method were to be used.
ii. Speciality bonds
Speciality bonds are a subgroup of bonds that are tailored to fund a certain type of
project such as green bonds, catastrophe bonds and SRI bonds. As mentioned
earlier, there are no academic studies performed on green bonds, which is why it is
interesting from a methodological perspective to look at research on other speciality
bonds to find a suitable empirical strategy.
The most developed type of speciality bond is the sukuk bond which is a sharia
compliant investment product that has a very similar payment structure to bonds.
They require a principal investment and pays interest during the term of the loan but
the difference from conventional bonds is that they consist of partial ownership of
assets, that could be physical assets, projects, businesses, debt etc. which means that
the interest is not paid on the money (which is prohibited according to sharia law)
but on the share of the asset. Although sukuk bonds are conceptually very different
from green bonds, the literature within this field is relevant from a methodological
perspective.
Ariff et al. (2013) uses matched samples of conventional and sukuk bonds in the
Malaysian market and find that the returns of these bonds differ significantly and also
find that there is no Granger causality between the two. They thus conclude that
despite the structural similarities, sukuk and conventional bonds should be seen as
two separate securities and that bond pricing models need to be modified in order to
price sukuk bonds correctly.
However Uppal (2014) criticises this study arguing that matching is difficult due to
the different structures of the bonds citing “marked difference in the structuring,
placement, collateral, issuance costs, liquidity and bankruptcy cost of sukuk and the
conventional bonds”. The author also criticises the use of Granger causality since the
data used is recorded monthly which means that cross-serial correlations cannot be
expected since the market should adjust much quicker to new information. Instead,
Uppal investigates 49 fixed rate sukuk bonds on a more global scale (12 markets) and
compares them to US treasuries with one year constant maturity. Using a Vector
Error Correction (VEC) model it is shown that conventional bonds and sukuk bonds
are co-integrated and the conclusion is that the market prices both types of bonds
similarly.
The structural differences highlighted by Uppal (2014) between sukuk bonds and
conventional bonds needs to be addressed if the matching technique is going to be
used. When we look at the objections raised against matching sukuk and
conventional bonds, we can draw the conclusion that green bonds seem to be much
more similar to conventional bonds.
22
structuring – no difference if matched correctly
placement – unclear what this entails, seems to be geographical location but it does
not say whether it is of the investor or the issuer. In any case, it is
probably more relevant to sukuk securities because they are mostly
issued out of Muslim countries and bought by investors specialised in
Islamic finance.
collateral – no difference
issuance costs – green bonds have marginally higher issuance costs
liquidity – might be a difference (could check in data)
bankruptcy cost – no difference
This indicates that the objections should have marginal impact and be unlikely to
significantly bias the results when matching conventional and green bonds.
iii. Ethical (mutual) funds
Ethical mutual funds (sometimes called socially responsible investment (SRI) funds)
are similar to green bonds for different reason than sukuks, namely they also share
the idea of investing in sustainable development. Ethical funds have their origin in
the 1960’s when the interest for equality, labour and civil rights issues increased due
to the political climate. Nowadays, ethical funds have assets of several trillions of
dollars and are generally concerned with climate change. Due to the long history of
ethical funds, several studies have looked at the difference in the performance of
ethical versus conventional mutual funds but most of the studies do not find any
significant differences (see e.g. Hamilton et al. ,1993; Statman, 2000).
There have been several matched pairs studies with one example being Kreander et
al. (2005) that looked at 60 European mutual funds (30 pairs) that were matched on
age, country of investment, size and investment universe. Renneboog et al. (2008)
also used the matched pair method, matching on age, size, fees and risk exposure.
They find that ethical fund performance is lower than for conventional funds but
only significantly so for France, Japan and Sweden.
Bauer et al. (2005) investigates the same issue among ethical mutual funds from the
UK, US and Germany. They use a modified version of the matched pairs test where
103 ethical funds are matched with the average of three matching conventional funds
each in order to minimise the risk for individual differences. The results showed that
ethical funds had a catching up phase when they underperformed but the returns
converged to the same level as for conventional mutual funds.

23
Although green bonds are different from ethical mutual funds, there are several
insights to draw for the continuation of this thesis. First, matching seems to be the
preferred method for looking at differences in returns because of the unobserved
differences that might exist between funds. Second, the results indicate that there
might not be any differences in returns and furthermore, that results obtained might
be caused by market immaturity which means that the spread differentials could
reach a different level (or cease to exist) in the steady state.
V. Empirical strategy
I. Bond valuation
A bond can be structured in several ways but is basically it is a contract where the
bond holder lends money to the bond issuer and expects to get the principal (the
amount lent) back at a certain date in the future, called the maturity date, and receive
interest payments, called coupons, at a fixed frequency (that could be zero) in the
meantime.
In its simplest form, bond valuation is an ordinary net present value calculation of
the expected cash flows from the bond and the value of the principal at maturity
(Berk & DeMarzo, 2007 p. 225):
𝑃 = ∑𝐶
(1 + 𝑖)𝑛+
𝑀
(1 + 𝑖)𝑛
𝑁
𝑛=1
Where P = bond price
C = the coupon payments which correspond to regular interest
payments for bank loans.
i = (required) yield of the investor.
M = the principal investment, which corresponds to the borrowed
amount. A bond is normally not amortised so the full amount is repaid
at the maturity date.
N = the number of coupon payments
For bonds with fixed coupons, this is a very straightforward calculation. However, in
reality, bond pricing is not that simple since the required yield is hard to estimate and
varies according to the risks associated with holding the bond. In a world where
there are uncertainties about future interest rates and the financial viability of firms
these risks could be substantial and translates into credit spread differentials on
bonds with similar contractual structures.
Since the coupon and the principal investment are agreed upon in the initial contract,
the only factor that changes with time is the required yield, i. If investors indeed have
24
a green preference this would affect the price of the bond through its effect on i
since any green preference in the utility curve would lower the required yield of the
investment.
II. Bond yields
Even though the bond price is what the investor pays for the bond, bond prices
cannot be used to compare bonds with each other (Berk & DeMarzo, 2007 p.228-
229). This is because a bond has fixed coupon payments C (or in the case of a
floating bond a fixed spread over an index) and a fixed principal amount at maturity
M. Thus the cash flows from the bond never change and the factor that fluctuates is
required yield i. The yield corresponds to interest rates on bank loans and is the
return that investors demand in order to lend the money to the issuer.
The relationship between bond yields and bond price is inverse and the intuition
behind this is that when the price goes down, you pay less for the same pre-
determined future cash flows i.e. the yield is higher.
There are several yield measures such as yield to maturity, yield to call and yield to
worst. The most commonly used measure is yield to maturity which is the annualized
return on the investment assuming that all coupon payments are re-invested at the
same rate (Bodie et al., 2011, p.479). The measure assumes that the investor holds
the bond until maturity and that all cash flows are paid out on time with no default.
The fact that green bonds do not have complicated structural features such as call
options etc. makes yield to maturity the most appropriate measure for the value of
the bond.
III. Matching
The previous literature on sukuk bonds (e.g. Safari, 2012) and ethical funds (e.g.
Renneboog et al., 2008) suggest that matching is the preferred technique when
looking at differences between special and conventional types of investment. As
explained above, it is an appealing method due to the relatively limited amount of
outstanding bonds.
The number one strength of utilising the matching pairs technique is that it accounts
for unobserved differences between issuers. Furthermore, if there are unobserved
differences in the bond structures (such as differences in legal jurisdiction etc.) they
are more likely to differ between issuers than for different bonds by the same issuer.
This is because bonds are usually issued from “programmes” that could be seen as
contractual frameworks. Additional terms such as green bond principles can just be
added to this pre-determined “programme”.
Unlike equity, bonds are not completely standardised instruments and there are
certain factors that can be varied in order to match issuer and investor needs. These
factors can have impact on the price, liquidity and volatility of the bonds. In order to

25
find suitable matches between green and conventional bonds, it is therefore
important to understand the main characteristics of bond structures which are
outlined below1.
Issue size
The issue size is important for both equity and debt investors since small issuances
are likely to be less liquid than larger ones. Illiquidity is a problem since prices are
likely to be more volatile and because it could lead to delays in getting out of a
position in the stock or bond.
Small issuances could also be tailored specifically for certain investors which usually
indicates that the bond is for buy-to-hold purposes i.e. the investors that initially buy
the bond will hold them until maturity. Then, there is no price data since the bond
was not traded. Furthermore, they could be tap issues (additional issuance from an
existing bond) that have not yet integrated with the original issuance which means
that they eventually will merge with another bond in the data set.
However, the most important reason for eliminating small issuances from the data
set is the risk that the price data might be wrong, something that is less of a problem
when analysing equity prices. This is because, unlike stocks, bonds are traded OTC,
so when you buy a bond you always call your bank or broker and they will then re-
check the prices at which the seller is willing to sell. Thus, the seller does not have to
commit to the prices shown on the screen as is the case with the stock market which
means that bond prices are seldom adjusted unless there is some trading activity
going on in the bond.
Credit Rating
The credit rating is an assessment of the default risk usually made by a credit rating
agency. Since ratings are costly not just in terms of fees but also in terms of
managing the paper work for rating agencies, they are avoided as much as possible.
Instead, shadow ratings could be made from the issuers advisor (normally a bank or
corporate finance firm) that indicate what the likely rating of the company had there
been a formal rating. These ratings are of course less reliable than a formal rating
since the shadow ratings are made by the same banks that market that take the bonds
to the market and many investment professionals therefore use them with caution.
There is a big divide between bonds that are rated BBB- and lower, called high-yield
bonds, and those that are rated between AAA and BBB, investment grade bonds.
Since many fund managers do not have mandates to invest in high-yield bonds, the
market depth (i.e. the amount of money that could be raised) can be significantly
lower if the bond is given a non-investment grade rating. The market for high-yield
1 This section goes through the fundamentals of bond structures and is loosely based on Berk &
DeMarzo, 2007 and Bodie et al., 2011. For a more thorough overview please refer to these books.

26
bonds is relatively developed in the US but is still immature in many European
markets, which leads to higher risks and liquidity issues.
It is important to add that a rating, neither formal nor shadow, is to be considered as
a guarantee of the credit quality for the firm or bond, something that became evident
in the Global Financial Crisis of the late 00’s. In the aftermath of the crisis, several
market actors have become sceptical about the methodologies and the incentives of
the credit rating agencies but have not changed the fact that ratings are still a very
important consideration for institutional investors.
In this thesis, the issuer is one of the matching criteria, which eliminates the
possibility of the issuers being of different credit ratings. However, the individual
bonds could be of different credit quality which could lead to discrepancies in their
ratings. Since most bonds in the data set are not rated, it is important to make an
assessment whether this would have been likely. Practically, this is done by matching
the collateral type of the bonds (see next page for more about collateral type).
Maturity
A longer the maturity of a bond means that the investment is riskier because it is
more likely that the interest rate environment changes and affects the value of the
bond. Thus the longer maturity a bond has, the higher the required yield. This
means that the maturity date of the bonds is an important matching criterion in the
coming analysis in order to ensure that the bonds have the same risk level.
Coupons
The interest payments on bonds are called coupons and are naturally a key
component in determining bond yields. Coupons can either be fixed and pay a
certain dividend per year or pay a floating dividend, called Floating Rate Notes
(FRN). In Europe, FRN means that the coupon payment is fixed at a certain rate
over or under the 3-month Libor rate but the benchmark indices vary depending on
the geographical market. FRNs are more difficult to analyse since interest rates
always fluctuate and many empirical studies exclude FRNs because of this.
Most coupon payments are made semi-annually but the coupon could also be paid
with a different time interval. Coupon payments that are due more frequently are
considered less risky because there is less chance of default between the payments.
Furthermore, the time value of money makes interest payments more valuable if they
are frequent because it means that the next payment is due sooner. It is therefore
important that bonds are matched with the same coupon type and pay out frequency.
Collateral and Seniority
Bonds can have different seniority in the case of a default, with the most common
categories being (senior) unsecured and subordinated. A bond can also have
collateral, which means that certain assets are pledged to protect the claim. In the

27
European market a common form of a bond with collateral is the covered bond,
which is a bond that is connected to a certain pool of assets that the bond holders
can pledge in the case of a default. Covered bonds are generally seen as very secure
investments meaning higher ratings and lower credit spreads but this is naturally
dependent on the quality of the assets pledged.
Collateral and seniority are important structural factors that can affect the credit
spreads significantly, especially for issuers with lower credit quality. In the case of
green bonds, the vast majority of bonds are senior unsecured or unsecured and all
other bond types should therefore be eliminated from the analysis to ensure
consistency.
VI. Data
The time series data was retrieved from Bloomberg on March 17, 2015. There were
then 274 active bonds that were labelled as green on the total market. Since bond
data is registered manually, there is a potential risk that some of the entries are
incorrect, but a quick cross-check with the list on the Climate Bond Institutes list of
green bonds verifies that the data is accurate. None of the papers in the literature
review have a detailed specification about the process of how bonds were matched
or eliminated from their data sets. Therefore the elimination process below my own
based on the structural characteristics of bonds that have been pointed out in the
literature as being important to match.
Zero coupon bonds (2 bonds) and other bonds that have irregular or complex
coupons (25 bonds) were excluded from the data set because the effect on the bond
pricing is unclear. After some consideration, the floating rate bonds (32 bonds) were
also eliminated since they have a different yield measure than fixed coupon bonds
and the data quality was poor. Furthermore any bonds that include some kind of
collateral were excluded as well (2 bonds). No bonds in the sample are subordinated
which leaves us with a sample that consists entirely of senior unsecured or unsecured
bonds.
The matching of the bonds was done manually by looking at the issue date, coupon
type and frequency and most importantly, by matching the maturity date. Naturally,
some of the bonds do not have matching pairs which means that they have to be
eliminated from the sample. After this procedure, there were 130 matching pairs left
of which a few bonds had several different matches. In this case, data for both
matching bonds were retrieved and the bond with the best data was chosen. When
data availability was good for both bonds, the one with the closest maturity date to
the green bond was chosen.

28
Since many of the remaining bonds were very small in terms of issue size (below
USD 10 million), they were eliminated and the data set was reduced to 64 bonds. The
limit is somewhat arbitrary since this would be a very small bond in some countries
while it would be relatively normal in other jurisdictions. This limitation was
necessary due to the reasons explained in section III. Although it seems like a big
decrease in the number of bonds, in terms of volume, the reduction was less than
10 %.
The next step was to look at data quality of the time series data in order to assess
whether the quality was good enough for a time series regression. The data is again
obtained from Bloomberg and consists of daily price and yield (ask and bid) quotes
from January, 2011 to March 19, 2015 but most of the bonds were issued later than
the start date which means that there are not quotes for the entire time period. There
were several bonds that lacked data on the bond yield which meant that a further 25
bonds had to be eliminated.
Each time series needs to have at least a month of data recorded (although the more
the better) and this criteria led to the elimination of 10 bonds due to the lack of
observations. A further 2 bonds were eliminated due to illiquidity. This left us with a
final data set comprised of 28 matching pairs of bonds with time series data. Please
refer to Appendix 1 for a list of the bonds accompanied with their Bloomberg
identifier.
The sample size is relatively small compared to the initial size of the data set but is in
line with Kreander et al. (2005) that looked at 30 pairs of matching funds and Ariff
and Safari (2012) that used 49 pairs of sukuk bonds. The data set is however much
smaller than the Bauer et al. (2005) data set of 103 pairs of bonds and the sample size
is a part of the methodology that could be improved upon once data availability
becomes better. However, at this point in time, it is difficult to argue for keeping any
of the bonds that have been eliminated according to the criteria above.
VII. Results
The summarized data shows that the mean yield for green bonds seems to be slightly
higher than for conventional bonds. The same tendency can be seen for the 95%
confidence interval in which green bonds are slightly higher on both sides.
Table 7.1 Summary statistics yield (%), full data set
Mean Standard error
Standard deviation
95% Confidence Interval
No of obs
Green 2.8588 0.6284 3.3253 1.5694 4.1483 28
Conventional 2.7814 0.6064 3.2089 1.5371 4.0257 28
29
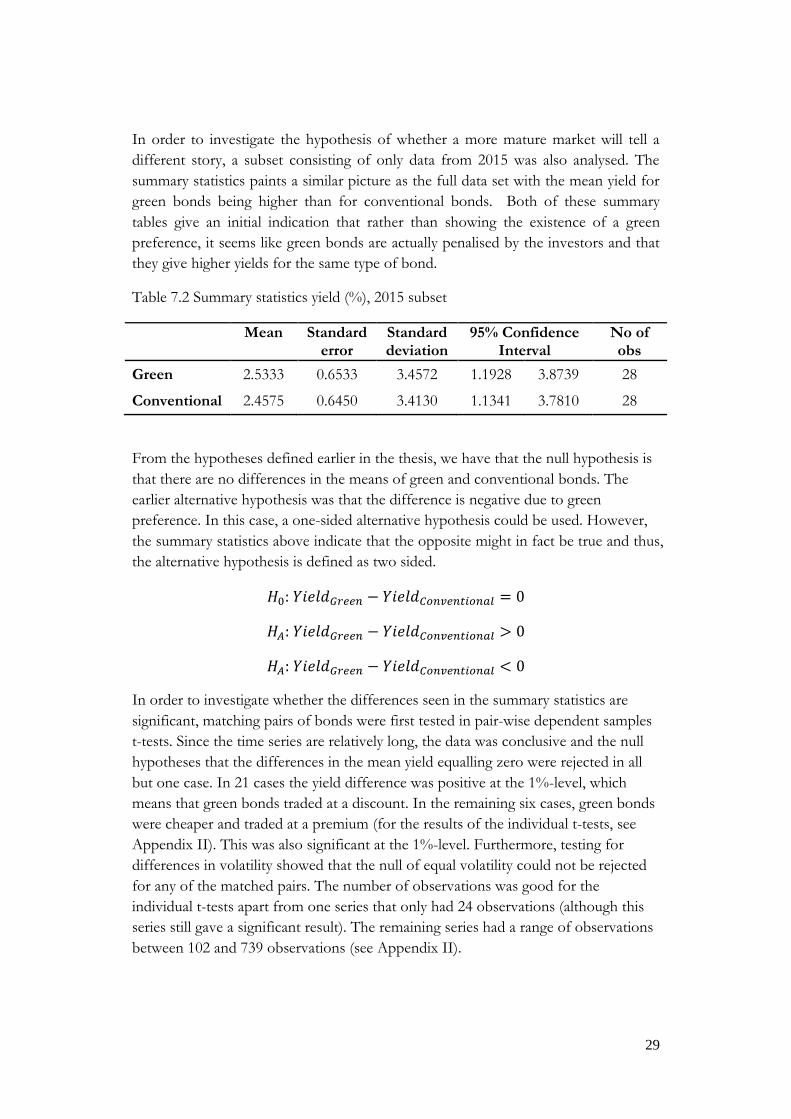
In order to investigate the hypothesis of whether a more mature market will tell a
different story, a subset consisting of only data from 2015 was also analysed. The
summary statistics paints a similar picture as the full data set with the mean yield for
green bonds being higher than for conventional bonds. Both of these summary
tables give an initial indication that rather than showing the existence of a green
preference, it seems like green bonds are actually penalised by the investors and that
they give higher yields for the same type of bond.
Table 7.2 Summary statistics yield (%), 2015 subset
Mean Standard error
Standard deviation
95% Confidence Interval
No of obs
Green 2.5333 0.6533 3.4572 1.1928 3.8739 28
Conventional 2.4575 0.6450 3.4130 1.1341 3.7810 28
From the hypotheses defined earlier in the thesis, we have that the null hypothesis is
that there are no differences in the means of green and conventional bonds. The
earlier alternative hypothesis was that the difference is negative due to green
preference. In this case, a one-sided alternative hypothesis could be used. However,
the summary statistics above indicate that the opposite might in fact be true and thus,
the alternative hypothesis is defined as two sided.
𝐻0: 𝑌𝑖𝑒𝑙𝑑𝐺𝑟𝑒𝑒𝑛 − 𝑌𝑖𝑒𝑙𝑑𝐶𝑜𝑛𝑣𝑒𝑛𝑡𝑖𝑜𝑛𝑎𝑙 = 0
𝐻𝐴: 𝑌𝑖𝑒𝑙𝑑𝐺𝑟𝑒𝑒𝑛 − 𝑌𝑖𝑒𝑙𝑑𝐶𝑜𝑛𝑣𝑒𝑛𝑡𝑖𝑜𝑛𝑎𝑙 > 0
𝐻𝐴: 𝑌𝑖𝑒𝑙𝑑𝐺𝑟𝑒𝑒𝑛 − 𝑌𝑖𝑒𝑙𝑑𝐶𝑜𝑛𝑣𝑒𝑛𝑡𝑖𝑜𝑛𝑎𝑙 < 0
In order to investigate whether the differences seen in the summary statistics are
significant, matching pairs of bonds were first tested in pair-wise dependent samples
t-tests. Since the time series are relatively long, the data was conclusive and the null
hypotheses that the differences in the mean yield equalling zero were rejected in all
but one case. In 21 cases the yield difference was positive at the 1%-level, which
means that green bonds traded at a discount. In the remaining six cases, green bonds
were cheaper and traded at a premium (for the results of the individual t-tests, see
Appendix II). This was also significant at the 1%-level. Furthermore, testing for
differences in volatility showed that the null of equal volatility could not be rejected
for any of the matched pairs. The number of observations was good for the
individual t-tests apart from one series that only had 24 observations (although this
series still gave a significant result). The remaining series had a range of observations
between 102 and 739 observations (see Appendix II).

30
The six pairs that showed significantly lower spreads for green bonds (and thus
indicating a green bond premium) consisted of five supranational bonds (83.3%) and
one corporate bond (16.7%) from the real estate industry. This corresponds well to
the share of corporate bonds in the sample (17.9%). The bonds were mixed in terms
of currency with three EUR bonds, one NZD bond, one ZAR bond and one SEK
bond. This is not consistent with their respective share in the sample but it is hard to
draw any conclusion from this due to the small number.
We then looked at a matching pairs t-test that uses just the means and not the entire
time series data. Although this leads to dramatically fewer observations, it reduces the
risk of bias due to potential errors in the data. Since the pairs are matched pairs are
the dependent sample t-test has to be used.
Table 7.3 Matched t-test results
Yield Volatility
Full data set 2015 Full data set 2015
Mean difference
0.0774 0.0758* -0.0225 -0.0303
(0.0539) (0.0442) (0.0316) (0.0287)
Observations 28 28 28 28
Bonds * days 8495 1523 8495 1523
*significant at the 10% level
For the full data set, the results show that there are no significant differences
between green and conventional bonds. However, if we look at the data for only
2015, the mean difference is significant at the 10%-level. Again, the result is showing
that conventional bonds have lower yields and thus are cheaper than green bonds.
Investors thus seem to have a preference for conventional bonds compared to their
green counterparts. Given that the mean yield is 2.5% the size of the difference is not
substantial but definitely shows that there is no evidence of a green preference.
Thus, the individual t-tests (that is the more correct method in this case) are
conclusive, and the small sample show the same tendency which means that we have
strong case in favour of conventional bonds. Thus we reject the null and conclude
that conventional bonds on average have a lower yield requirement.
We then proceed to the second hypothesis which has a null of no difference in
volatility between green and conventional bonds. A matched pairs test was
performed on the difference between the standard deviation of the two types of
bonds both using the whole data series and the small sample as in the case with the
yield differences. The results show that there are no differences in the standard

31
deviation at any relevant significance level and the results are similar for the
individual t-tests, the full data set and the 2015 subset. Thus the null of no
differences in volatility cannot be rejected.
To assess the robustness of the results we need to look at the key assumptions that
the matching pairs t-tests rely upon (Lund & Lund, 2015):
A. Continuous data variable
B. The independent variable should consist of two categories that are related or
matched
C. The sample of pairs is a random sample of the population
D. Differences between the pairs should follow a normal distribution, i.e. no
outliers or significant differences in the distribution of data points. This is not
as important when the sample size is large since it is rather a question of
statistical power rather than one of accuracy.
The first two assumptions are unproblematic since the bond yield data indeed is
continuous and as argued for above, conventional and green bonds indeed consist of
matching pairs if matched correctly.
The third assumption is somewhat more problematic since the sampling for obvious
reasons is not completely random. All bonds that have a suitable match, had a
relatively normal issue size and had enough data were included in the data set. This
does not necessarily mean that this assumption is violated but for the robustness sake
we look at various descriptive characteristics and compare these with the original
data set.
The comparison shows that some smaller currencies are lacking from the sample but
the percentage of bonds denominated in more commonly used currencies like EUR
or USD seems consistent. SEK bonds seem to be slightly overrepresented in the
sample. Industry type looks similar although supranational agencies are
overrepresented (78% compared to 67%) and financial services are underrepresented
(3.5% compared to 15.3%) in terms of number of bonds. However, in terms of
volume this is not an issue since this difference is driven by 34 issuances made by
Credit Agricole that were eliminated from the data set due to their very small
issuance volumes. Eliminating these, financial services corresponded to 3.3% of the
bonds issued which is very close to the share in the sample. Credit ratings mainly
follow the industry types and thus do not show any significant differences. Thus it
looks like there is no indication that the population and the sample differ significantly
and thus should be considered sufficiently random.
The last assumption can be checked by searching for outliers and by performing a
normality test for the differences of each matching pair. The time series data seem to
follow one another smoothly and there is no evidence for outliers. However, when

32
testing for normality of the differences using the Shapiro Wilks test, the null of a
normal distribution of the differences was rejected for all the time series and for all
relevant significance levels. Since the result is so strong, I decided to use the
Wilcoxon Sign-Rank test that is a better test when the distribution is severely non-
normal (McDonald, 2014). However, the results were identical to the matched pairs
t-tests done in the first place.
VIII. Discussion/Robustness
i. Data and Methodology
When it comes to a matched pairs t-tests, the difficulty is always to ensure that the
matching is adequate. All the bonds in the sample have fixed coupons, the same
currency, collateral type, and credit rating and are matched according to issuer but
there is always the possibility that unobserved differences exist. What can be said is
that there are slight differences in the maturity dates. None of them is larger than six
months but this could of course still affect the results. Unfortunately, due to the
limited amount of matching bonds, it is impossible to find a perfectly matching pair
of bonds.
Other methods could be used to investigate the same hypothesis and the most
suitable for further research is modelling the yield curves of green versus
conventional bonds for a few specific issuers. A weakness with this method is that
the sample is largely going to consist of supranational agencies but it would still be an
interesting exercise and would work out the problem with finding perfectly matching
pairs. As the green bond market grows, the quality of data will increase for both this
and the matched pairs method.
When it comes to evaluating green or social preferences on the capital markets, other
approaches are possible such as comparing the returns of industry sectors that are
relatively green with typically dirty ones. The main difficulty in this case would be to
find comparable instruments.
ii. Other considerations
Green bonds are still a new phenomenon and the market is still immature which
means that investors might not be certain at this point on how to trade these
instruments. This means that the investors might change their strategies as the
market matures which could lead to other results. As the market reaches more of a
steady state, the spread differentials might converge to different levels.
There are still many issues remaining with green bonds. First of all, there is no real
consensus on what constitutes a green bond. The GBP’s are very diverse and does
not eliminate the possibility of greenwashing. Secondly, there is no rating system for
green bonds and therefore there is no way of assessing the greenness of a specific
33
bond unless you read the materials provided by the issuer. A rating would reduce the
effort of information seeking for individual investors and would also enable a larger
variety of green bonds (very green to not so green) and also help to prevent green
bond requirement becoming too stringent and thereby stifling the market. These
uncertainties and the cost to acquire the relevant information could contribute to the
relatively higher returns required for green bonds.
As a side note, there are some questions regarding whether the bond market is
actually the best alternative for targeting green technology investment. The bond
market is interesting because it represents 75% of capital markets as well as because
there are many large institutional investors that are heavily invested in bonds. These
investors are more easily monitored and targeted by policies or regulation which
creates potential for an implementation of such. Unfortunately, the characteristics’ of
bonds make them less likely to support new technology start-ups and innovations in
companies that do not have other sources of cash flows to rely on. This is because
bonds require regular interest payments which make stable cash flows a very
important feature for a successful bond issuance. An innovative start-up that might
have negative EBITDA are generally not suitable candidates to issue bonds.
With that said, the limitations are of course only true for firms that directly finance
their activities through bonds, and development and commercial banks could make
up for this by issuing bonds themselves and lend money to the smaller firms.
Furthermore, bonds could still be important for adaptation of existing technology,
emission reduction initiatives for transports and buildings and for companies that
have other cash cow products. The bond market is thus more suitable for large
corporations which to some extent will affect the type of green innovation that they
can support.
IX. Conclusion
This thesis did not find any evidence of the existence of a green preference and most
of the tests performed actually indicated the opposite - that conventional bonds are
in fact traded at a premium. There is no evidence of a green preference and this is
consistent with previous research on ethical investments. Thus the main conclusion
of this thesis has to be that there is no evidence contradicting the theory of the
rational return maximising investor – at least not on the green bond market.
Furthermore, this difference between the bond types were not stemming for
differences in volatility which indicates that the difference is not stemming from
differences in risk (assuming that the matching was indeed adequate).
This is consistent with the finding that people on average are not willing to give up
money on the pension in order to invest ethically (Elsässer, 2014). This observation
is interesting since the willingness pay for ethical alternatives have been found on

34
various retail markets (see e.g. Bjørner et al., 2004). There are several possible
explanations for this, for example in this case the consumer is not making the asset
allocation themselves but leaves it to a professional that might have differing
incentives. An interesting angle that focuses on the consumer could be the concept
of mental accounting (Thaler, 1985). The model explains that people value money
and make choices differently according to which mental account the money used
booked on. Therefore, it could be the case that when it comes to our consumption
account (now) we are happy to pay for green alternatives, but on our pensions
account (tomorrow) we might be much more reluctant to do so. The existence of
such behaviour could be a topic for further research.
This thesis also gave an indication of the limitations of assuming that creative
investment products are going to stimulate investment rates in green technology.
Many policy makers seem to believe that a lack of investment vehicles is one of the
main reasons to the underinvestment in green projects (see e.g. Croce et al., 2011)
and green bonds is said to be a way of solving this problem. Yet, bonds per se are
not a new phenomenon and a substantial chunk of financing is therefore unlikely to
just lay around waiting for a suitable bond product. If investors have no preference
for green bonds, they are not likely to have a significant impact on green investment
rates. That is, unless money currently not invested at all is invested or if projects that
were previously not funded at all or were funded inefficiently are financed through
these bonds. Unfortunately, I have failed to find any studies that look at the amount
of such low-hanging fruit. Investigating the existence of such would be an interesting
question for further research.
One area that could potentially benefit from green bonds is projects that are financed
through development banks. This is because development banks aggregate the
funding and a green bond locks the proceeds to be used solely for green projects
which could lead to increased lending to these. Since development banks’ main goal
usually is about stimulating certain industries rather than pure profit green bonds
could be a way of actively shifting their financing activities to green projects.
However, these actors tend to already have a large focus on environment which
renders doubt about the effect of a green bond compared to just issuing a
conventional bond from the same development bank.
One point that is important to raise is that the market for green bonds is still
immature and the investors’ might not yet trust them to be good investment
products. Thus there might be future potential for green bonds to become a cheaper
funding alternative.
In any case, if the underinvestment in green technology is not a problem caused by
the lack of investment vehicles but rather one of investors lacking opportunities
giving adequate return, policy and regulations is the key to move forward. The

35
existence of a green investment product like green bonds makes it easier for
governments to create targeted policies.
It is important to distinguish between policies that give direct support to green
activities versus creating investment incentives. The problem with incentives is that
you always get what you incentivise and because of the inflexibility and the time
consuming process of implementing policies and monitoring them, policies can
never keep up with technological innovation. This could lead to inefficient
technology being incentivised because the technology existed at the time of the
policy proposal but is no longer the most efficient solution. Some researchers, such
as Milton Friedman argues that government failures are very common because of
bureaucracy and less analytical capabilities. Investment is a more flexible target
because there are many more actors in the market each with their own analytical
capabilities.
If investment incentives are to be implemented, it is important that there is a system
in place to monitor the sector and ensure that the risk of greenwashing is low. There
are several ways in which governments could incentivise the issuance and investment
in green bonds (Calder et al., 2014):
1. Create investment funds that invest all or a certain amount of their money in green
bonds. This creates more demand and creates legitimacy for the green bond market,
both of which could lead to lower financing costs for green projects (i.e. the bond
will price tighter).
2. Provide guarantees (at state or municipal level) to green projects in order to enhance
the credit ratings of the bonds issued to finance the project. This would also reduce
the financing costs.
3. Create tax incentives for investors by treating green bonds more favourably than
conventional bonds. Some tax incentive schemes already exist for example at
municipal level in the US and a scheme in the Netherlands that targets individual
investors to buy into a specific “Green Fund”.
On a regulatory (coercive) level, it might be possible to require national pension
funds and insurance companies to invest at least a certain share of their fund in green
projects. For example, in Sweden, this could be a requirement for being eligible as a
choice for the PPM programme. Unfortunately most tools available for policy
makers are blunt and they will only be efficient if they are implemented consistently
and as a package solution. It is however essential that climate policy is addressed
both through the stimulation of innovation and of the financing thereof.
36
References
Aghion, P., Hemous, D., Veugelers, R., 2009. No green growth without innovation.
Bruegel Policy Brief, 2009/07, Brussels: Bruegel
Ariff, M. Safari, M., 2012. Are sukuk securities the same a conventional bonds?. Afro
Eurasian Studies, 1[1], pp. 101-125.
Ariff, M., Safari, M., Mohamed, S., 2013. Sukuk securities and conventional bonds:
evidence of significant differences. Social Sciences and Humanities, 21[2], pp. 621-638.
Barclays, 2014. Barclays MSCI green bond indices: Bringing clarity to the green bond market
thoguh benchmark indices. New York, NY: Barclays
Bauer, R., Koedijk, K. Otten, R., 2005. International evidence on ethical mutual find
performance and investment style. Journal of Banking & Finance, 29[7], pp. 1751-1767.
Bazerman, M. Moore, D., 2013. Judgment in managerial decision making. 8 ed. Danvers,
MA: Wiley.
Berk, J. DeMarzo, P., 2007. Corporate finance. 3 ed. Boston, MA: Pearson Education.
Bjørner, T. B., L. G. Hansen, and C. S. Russell (2004). Environmental labeling and
consumers choice - an empirical analysis of the effect of the nordic swan. Journal of
Environmental Economics and Management, 47[3], pp. 411-434.
Black, F., Scholes, M., 1973. The pricing of options and corporate liabilities. Journal of
Political Economy, 81[3], pp. 637-654.
Bodie, Z., Kane, A. Marcus, A., 2011. Investments and portfolio management. 9 ed. New
York, NY: McGraw-Hill.
Boulle, B., Kidney, Oliver, P., 2014. Bonds and climate change: the state of the market in
2014, London: Climate Bonds Initiative.
Brennan, M., Schwartz, E., 1978. Corporate income taxes, valuation and the problem
of optimal capital structure. Journal of Business, 51[1], pp. 103-114.
Calder, A., Kolodzie, M.,Nanji, A., 2014. Green bonds: fifty shades of green. Royal Bank of
Canada
Chen, L., Lesmond, D. Wei, J., 2007. Corporate yield spreads and bond liquidity. The
Journal of Finance, 62[1], pp. 119-149.
Climate Bonds Initiative, 2014. Climate bonds. [Online]
Available at: http://www.climatebonds.net/standards/certification/get-certified
[Access: 2015-03-10].

37
Della Croce, R., Kaminker, C., Stewart, F., 2011. The role of pension funds in financing
green growth initiatives, Paris: OECD Publishing.
Contie, V., 2007. NIH Research matters. [Online]
Available at: http://www.nih.gov/researchmatters/june2007/06222007altruist.htm
[Access: 2015-04-24].
Diebold, F., Li, C., 2006. Forecasting the term structure of government bond yields.
Journal of Econometrics, 130, pp. 337-564.
Elsässer, M., 2014. AP7: Etiska placeringar. [Online]
Available at: https://ap7se.files.wordpress.com/2014/11/1530961_ap7_etiska-
placeringar_rapport_20141007.pdf
[Access: 2015-05-12].
Elton, E., Gruber, M., Agrawal, D. Mann, C., 2001. Explaining the rate spread on
corporate bonds. The Journal of Finance, 56[1], pp. 247-278.
Eom, Y., Helwege, J. Huang, J.-Z., 2004. Structural models of corporate bond
pricing: an empirical analysis. The Review of Financial Studies, 17[2], pp. 499-544.
Fama, E., French, K., 1992. The cross-section of expected stock returns. Journal of
Finance, 47[2], pp. 427-465.
Fama, E., French, K., 1993. Common risk factors in the returns of stocks and bonds.
Journal of Financial Economics, 33, pp.3-56
Fama, E., 1965. Random walks in stock market prices. Financial Analysts Journal, 21[5],
pp. 55-59.
Friberg, R., Sanctuary, M., 2012. What’s holding it back? A study in organic and
Fairtrade retail coffee purchases. Unpublished paper Stockholm School of Economics,
2012-03-26
Available at: http://pzp.hhs.se/media/5477/friberg_sanctuary.pdf
[Access: 2015-06-02].
Goldenberg, S., 2015. The Guardian. [Online]
Available at: http://www.theguardian.com/environment/2015/jan/22/us-senate-
man-climate-change-global-warming-hoax
[Access: 2015-02-01].
Griswold, A., 2013. Business Insider. [Online]
Available at: http://www.businessinsider.com/nobel-robert-shiller-work-for-
goldman-sachs-google-2013-10?IR=T
[Access: 2015-05-09].

38
Hamilton, S., Jo, H. Statman, M., 1993. Doing well while doing good? Socially
resonsible mutual funds. Financial Anaylsts Journal, Nov/Dec, pp. 62-66.
Harbaugh, W., Mayr, U. Burghart, D., 2007. Neural responses to taxation and
voluntary giving reveal motives for charitable donations. Science, Vol. 316, pp. 1622-
1625.
Harris, J. Roach, B., 2007. The economics of global climate change. Tufts University,
Medford, MA: Global development and environment institute.
Hoffman, R., 2014. Varför köpa ekologisk mat? Får vi det vi förväntar oss?, Uppsala:
Swedish University of Agricultural Studies.
ICMA, 2015. Green bond principles. [Online]
Available at: http://www.icmagroup.org/Regulatory-Policy-and-Market-
Practice/green-bonds/green-bond-principles/
[Access: 2015-02-03].
Inderst, G., Kaminker, C., Stewart, F., 2012. Defining and measuring green
investments: Implications for institutional investors' asset allocations. OECD Working
Papers on Finance, Insurance and Private Pensions, No. 24, OECD Publishing.
Available at:
http://www.oecd.org/pensions/WP_24_Defining_and_Measuring_Green_Investm
ents.pdf
[Access: 2015-03-03].
Kahneman, D., 2013. Thinking, fast and slow. New York, NY: Farrar, Straus and
Giroux
Kreander, N., 2005. Evaluating the performance of ethical and non-ethical funds: a
matched pair analysis. Journal of Buisness, Finance and Accountig,, 32[7/8], pp. 1465-1493.
Levitt, S., List, J., 2007. What do laboratory experiments measureing social
preferences reveal about the real world? Journal of Economic Perspectives, 21[2], pp. 153-
174.
Longstaff, F. Schwartz, E., 1995. A simple approach to valuing risky fixed and
floating rate debt. Journal of Finance, 1[3], pp. 789-819.
Lund, A., Lund, M., 2015. Laerd statistics. [Online]
Available at: https://statistics.laerd.com/spss-tutorials/dependent-t-test-using-spss-
statistics.php
[Access: 2015-05-01].
Markowitz, H., 1952. Portfolio selection. Journal of Finance, 7[1], pp. 77-91.
39
McDonald, J., 2014. Handbook of biological statistics – Paired t-test. [Online]
Available at: http://www.biostathandbook.com/pairedttest.html
[Access: 2015-05-12]
Menigo, 2015. Menigo. [Online]
Available at: http://www.menigo.se/aktuellt/nyheter/reportage/2015/02/den-
ekologiska-ekvationen-tillgang-genom-efterfragan/
[Access: 2015-05-01].
Merton, R., 1974. On the pricing of corporate debt: the risk structure of interest rates.
Journal of Finance, 29[2], pp. 449-470.
Mogdliani, F., Miller, M., 1958. The cost of capital, corporation finance and the
theory of investment. American Economic Review. 48[3], pp. 261-297.
Mogdliani, F., Miller, M., 1961. Dividend policy, growth and the valuation of shares.
Journal of Business. 34[34], pp. 411-433.
Nelson, C., Siegel, A., 1987. Parsimonious modeling of yield curves. Journal of Business.
60[4], pp. 473-489.
Ostrom, E., 2010. Polycentric systems for cpoing with collective action and global
environmental change. Global Environemental Change, Vol. 20, pp. 550-557.
Reichelt, H., 2010. Green bonds: a model to mobilise private capital to fund climate
change mitigation and adaptation projects in: The Euromoney handbook: environmental
finance handbook. Washington DC: The World Bank, pp. 2-8.
Riple, A., 2013. Lögn, förbannad lögn och prognoser. Stockholm: Nordstedts
REN21, 2014. Renewables 2014: global status report, France: Renewable Energy Policy
Network for the 21st Century.
Renneboog, L., 2008. The orice of ethics and stakeholder governance: the
performance of socially responsible mutual funds. Journal of Corporate Finance, 14[3],
pp. 302-322.
Sharpe, W., 1964. Capital asset prices: a thoery of market equilibrium under
conditions of risk. Journal of Finance, 19[3], pp. 425-442.
Statman, M., 2000. Socially responsible mutual funds. Financial Analysts Journal,
May/June, pp. 30-39.
Stern, N., 2006. What is the economics of climate change? World Economics, 7[2],
pp. 1-10.

40
Stewart, R., Kingsbury, B. Rudyk, B., 2009. Climate finance for limiting emissions
and promoting green development. R. Stewart, B. Kingsbury B. Rudyk eds., Climate
Finance - regulatory and funding strategies for climate change and global development. New York:
New York University Press, pp. 3-34.
Thaler, R., 1985. Mental accounting and consumer choice. Marketing Science, 4[1],
pp. 15-25.
Uppal, J., 2014. Sukuk or islamic bonds? Evidence from global issues. Kuala Terengganli,
Malaysia, International Conference on Management, Economics and Finance
(ICMEF 2014).
Vasakronan, 2014. Vasakronan green bond framework. [Online]
Available at: http://vasakronan.se/wp-content/uploads/Green-Bond-
Framework.pdf
[Access: 2015-02-09].

41
Appendices
Appendix I List of bonds
AFDB G EI4132177 Corp AFRICAN DEVELOPMENT BANK
AfDB C EJ8217048 Corp AFRICAN DEVELOPMENT BANK
AFDB G EJ3356411 Corp AFRICAN DEVELOPMENT BANK
AfDB C EK3697704 Corp AFRICAN DEVELOPMENT BANK
AFDB G EJ8766135 Corp AFRICAN DEVELOPMENT BANK
AfDB C 008281BA4 Corp AFRICAN DEVELOPMENT BANK
Agence FranceG EK4611688 Corp AGENCE FRANCAISE DEVELOP
Agence FranceC EK2903962 Corp AGENCE FRANCAISE DEVELOP
G?teborg G EJ8568853 Corp CITY OF GOTHENBURG
G?teborg C EJ5888254 Corp CITY OF GOTHENBURG
EIB G EK0981200 Corp EUROPEAN INVESTMENT BANK
EIB C EJ5097013 Corp EUROPEAN INVESTMENT BANK
EIB G EJ1271687 Corp EUROPEAN INVESTMENT BANK
EIB C EK0161845 Corp EUROPEAN INVESTMENT BANK
EIB G EK4710878 Corp EUROPEAN INVESTMENT BANK
EIB C EK0369372 Corp EUROPEAN INVESTMENT BANK
EIB G EJ7525862 Corp EUROPEAN INVESTMENT BANK
EIB C EI7914977 Corp EUROPEAN INVESTMENT BANK
IBRD G EK3354868 Corp INTL BK RECON & DEVELOP
IBRD C EK1822395 Corp INTL BK RECON & DEVELOP
IBRD G EI7368026 Corp INTL BK RECON & DEVELOP
IBRD C EJ9215959 Corp INTL BK RECON & DEVELOP
IBRD G EI1567227 Corp INTL BK RECON & DEVELOP
IBRD C EJ3049610 Corp INTL BK RECON & DEVELOP
IBRD G EI1566864 Corp INTL BK RECON & DEVELOP
IBRD C EJ2027518 Corp INTL BK RECON & DEVELOP
IBRD G EI1567581 Corp INTL BK RECON & DEVELOP
IBRD C EJ1007289 Corp INTL BK RECON & DEVELOP
IBRD G EK2735083 Corp INTL BK RECON & DEVELOP
IBRD C EK4882107 Corp INTL BK RECON & DEVELOP
IBRD G EI1569702 Corp INTL BK RECON & DEVELOP
IBRD C EJ3001850 Corp INTL BK RECON & DEVELOP
IFC G EJ8740387 Corp INTL FINANCE CORP
IFC C EJ6958676 Corp INTL FINANCE CORP
IFC G EJ8740320 Corp INTL FINANCE CORP
IFC C EJ5818061 Corp INTL FINANCE CORP
KfW G EK3739316 Corp KFW
KfW C EJ7609716 Corp KFW
Kommunalbank G EJ9363940 Corp KOMMUNALBANKEN AS

42
Kommunalbank C EJ8535621 Corp KOMMUNALBANKEN AS
Nederlandse G EK3569374 Corp NEDER WATERSCHAPSBANK
Nederlandse C EK0370396 Corp NEDER WATERSCHAPSBANK
NIB G EJ8486791 Corp NORDIC INVESTMENT BANK
NIB C EJ7456704 Corp NORDIC INVESTMENT BANK
NRW G EK5698064 Corp NRW.BANK
NRW C EK3938470 Corp NRW.BANK
Rodamco G EK2966274 Corp RODAMCO SVERIGE AB
Rodamco C EJ9721097 Corp RODAMCO SVERIGE AB
Unibail G EK0810946 Corp UNIBAIL-RODAMCO SE
Unibail C EJ7063583 Corp UNIBAIL-RODAMCO SE
Unilever G EK1269761 Corp UNILEVER PLC
Unilever C EH8631622 Corp UNILEVER PLC
Vasakronan G EK7559421 Corp VASAKRONAN AB
Vasakronan C EK7246912 Corp VASAKRONAN AB
Vasakronan G EK1272823 Corp VASAKRONAN AB
Vasakronan C EK0901711 Corp VASAKRONAN AB
Appendix II List of the number of observations used in each of the matched pairs t-tests and the
t-values obtained when testing for mean differences for the full time period.
Bond
No of obs
T-test (difference of means)
AfDB 1 388 26.72
AfDB 2 177 67.91
AfDB 3 375 77.41
Agence France 136 -68.46
Göteborg stad 148 78.63
EIB 1 277 14.68
EIB 2 620 29.89
EIB 3 310 29.10
EIB 4 439 55.28
IBRD 1 199 48.82
IBRD 2 356 -38.16
IBRD 3 632 -12.22
IBRD 4 739 7.17
IBRD 5 598 -34.50
IBRD 6 132 25.51
IBRD 7 378 10.52
IFC 1 189 1.42
IFC 2 375 7.16

43
KfW 177 -17.65
Kommunalbanken AS 349 75.70
Nederlanse Waterschapsbank 190 49.87
NIB 185 60.09
NRW 102 15.27
Rodamco Sverige 206 95.38
Unibail-Rodamco 281 27.32
Unilever 261 118.84
Vasakronan 1 24 -11.27
Vasakronan 2 252 45.17