are refugees located near urban job opportunities?...are refugees located near urban job...
TRANSCRIPT

CINDY HUANG AND JIMMY GRAHAMJUNE 2018
ARE REFUGEES LOCATED NEAR URBAN JOB OPPORTUNITIES?AN ANALYSIS OF OVERLAP BETWEEN REFUGEES AND
MAJOR URBAN AREAS IN DEVELOPING COUNTRIES,
AND IMPLICATIONS FOR EMPLOYMENT OPPORTUNITIES
AND MNC ENGAGEMENT

ABOUT THE TENT PARTNERSHIP FOR REFUGEES
TENT IS MOBILIZING THE PRIVATE SECTOR TO IMPROVE THE LIVES
AND LIVELIHOODS OF THE MORE THAN 20 MILLION MEN, WOMEN, AND
CHILDREN WHO HAVE BEEN FORCIBLY DISPLACED FROM THEIR HOME
COUNTRIES. AS TRADITIONAL ACTORS STRUGGLE TO COPE WITH THE
GLOBAL REFUGEE CRISIS – WITH EVER-INCREASING NUMBERS OF
REFUGEES, DISPLACED FOR LONGER PERIODS OF TIME – IT IS CLEAR
THAT BUSINESSES HAVE A MORE IMPORTANT ROLE THAN EVER BEFORE.
TENT WORKS WITH BUSINESSES TO HELP THEM DEVELOP AND
IMPLEMENT TANGIBLE COMMITMENTS TO SUPPORT REFUGEES.
TENT.ORG
ARE REFUGEES LOCATED NEAR URBAN JOB OPPORTUNITIES?

ABOUT CGD
THE CENTER FOR GLOBAL DEVELOPMENT WORKS TO REDUCE GLOBAL POVERTY
AND IMPROVE LIVES THROUGH INNOVATIVE ECONOMIC RESEARCH THAT DRIVES
BETTER POLICY AND PRACTICE BY THE WORLD'S TOP DECISION MAKERS.
CINDY HUANG IS CO-DIRECTOR OF MIGRATION, DISPLACEMENT, AND
HUMANITARIAN POLICY AND A SENIOR POLICY FELLOW AT THE CENTER FOR
GLOBAL DEVELOPMENT. PREVIOUSLY, HUANG WAS DEPUTY VICE PRESIDENT
FOR SECTOR OPERATIONS AT THE MILLENNIUM CHALLENGE CORPORATION,
DIRECTOR OF POLICY OF THE STATE DEPARTMENT’S BUREAU OF CONFLICT
AND STABILIZATION OPERATIONS, AND SENIOR ADVISOR TO THE STATE
DEPARTMENT’S COUNSELOR AND CHIEF OF STAFF ON GLOBAL FOOD SECURITY
ISSUES. SHE HAS A PHD IN CULTURAL ANTHROPOLOGY FROM THE UNIVERSITY
OF CALIFORNIA, BERKELEY, AN MPA FROM THE WOODROW WILSON SCHOOL
AT PRINCETON UNIVERSITY, AND A BA IN ETHICS, POLITICS AND ECONOMICS
FROM YALE UNIVERSITY.
JIMMY GRAHAM IS A RESEARCH ASSISTANT FOR MIGRATION, DISPLACEMENT,
AND HUMANITARIAN POLICY AT THE CENTER FOR GLOBAL DEVELOPMENT.
GRAHAM PREVIOUSLY WORKED AS A CONSULTANT WITH THE WORLD BANK’S
GLOBAL EDUCATION PRACTICE; AS RESEARCH ASSISTANT FOR GEORGETOWN
UNIVERSITY’S INITIATIVE ON INNOVATION, DEVELOPMENT, AND EVALUATION;
AND AS A PEACE CORPS VOLUNTEER. HE HAS AN MA IN GLOBAL HUMAN
DEVELOPMENT FROM GEORGETOWN UNIVERSITY AND A BA IN INTERNATIONAL
STUDIES FROM THE UNIVERSITY OF SOUTH CAROLINA.
CGDEV.ORG
3
ARE REFUGEES LOCATED NEAR URBAN JOB OPPORTUNITIES?

ABOUT THIS REPORT
This report has been developed collaboratively, drawing on insights from expert consultations and research by a team at the Center for Global Development (CGD). Cindy Huang supervised the research and is the lead author. Jimmy Graham is a contributing author, conducted the quantitative analysis, and created the interactive map. Emily Schabacker provided editorial support.
We wish to thank the following people for their helpful input, feedback, and
suggestions: Masood Ahmed, Maia Bix, Christelle Cazabat, Alan Gelb, Kate Gough,
Nabila Islam, Ewen Macleod, Gideon Maltz, Brian Rawson, and Chloe Sydney.
All errors remain our own.
CGD is an independent and nonpartisan research institution. We are partnering
with the Tent Partnership for Refugees to identify sustainable ways for businesses
to help address refugee crises. CGD is grateful to the Tent Partnership for support
of this work.
4
ARE REFUGEES LOCATED NEAR URBAN JOB OPPORTUNITIES?

CONTENTS
EXECUTIVE SUMMARY 6
INTRODUCTION 8
ESTIMATING OVERLAP BETWEEN REFUGEES
AND MAJOR URBAN AREAS 16
THE REFUGEE-MNC NEXUS: IMPLICATIONS OF THE
OVERLAP BETWEEN REFUGEES AND URBAN AREAS 22
LARGE REFUGEE POPULATIONS ARE LOCATED
IN MAJOR URBAN AREAS—IN MOST COUNTRIES 26
PROXIMITY TO MAJOR URBAN AREAS IS JUST THE FIRST STEP 34
APPENDIX 38
ENDNOTES 40
5
ARE REFUGEES LOCATED NEAR URBAN JOB OPPORTUNITIES?

EXECUTIVE SUMMARY
WITH OVER 22 MILLION REFUGEES AROUND THE WORLD, DISPLACED ON AVERAGE FOR OVER 10 YEARS, POLICYMAKERS ARE LOOKING FOR MORE SUSTAINABLE SOLUTIONS TO REFUGEE CRISES.1
One promising approach is to expand economic
opportunities for refugees in developing countries,
which host 85 percent of the world’s refugees.2 In recent
years, governments, donors, and private sector actors
have been finding innovative ways to include refugees
in labor markets, thus enabling them to become more
self-reliant, reducing the cost of hosting refugees and
creating economic benefits for hosts.3
Multinational corporations (MNCs) are emerging as
important partners in the push to expand refugee
employment and entrepreneurship. As market leaders
with global reach through hiring and supply chains,
policy influencers, and innovators, MNCs have distinctive
capacities for engagement that do not exist within the
traditional refugee response community.4 MNCs are
also well positioned to participate in broader jobs and
livelihoods initiatives that support both refugees and the
communities hosting refugees, which often struggle with
high unemployment and limited economic opportunities.
To help demonstrate where MNCs, regional and local
businesses, and other actors are best positioned to
expand economic opportunities for refugees, we created
an interactive tool to map the locations of working-age
refugees, and analyzed the extent to which refugees
overlap with major urban areas in 31 of the 37 developing
countries hosting at least 25,000 refugees.5 When
refugees are located in urban areas, where economic
activity and MNCs cluster, they have a much greater
likelihood of being in close proximity to potential
employers.
Using estimates of refugees living in a country's most
populous city and those living in cities with over 300,000
people as lower and upper bounds for the number of
refugees in or around major urban areas, we find that
of the 31 countries:
• 15 to 17 have at least 7,000 working-age
refugees in or around major urban areas,
• 9 to 11 have at least 25,000 working-age
refugees in or around major urban areas, and
• 5 to 7 have at least 50,000 working-age
refugees in or around major urban areas.
ARE REFUGEES LOCATED NEAR URBAN JOB OPPORTUNITIES?
6

In total we estimate that there are between 915,087 and
2,186,829 working-age refugees in or around major
urban areas in these countries.6
Countries with significant overlaps of refugees and
major urban areas are located in a variety of regions,
and most of the countries with substantial overlap have
a significant MNC presence: the large majority have at
least 1,000 people employed by MNCs with OECD home
countries, and about half have more than 10,000.7 And
the number of MNCs is just the tip of the iceberg. With
their deep supply chains and market leadership, MNCs
can shape the local market and policy environment as
well. These findings indicate there are opportunities
for MNCs and regional and local businesses to engage
with refugees. Our interactive map shows approximately
where these opportunities are.
While our analysis shows that there is substantial overlap
between refugees and urban economic opportunities,
it also adds nuance to the headline that 60 percent
of refugees with known locations live in urban areas.8
For our sample of 23 countries with the best data, we
estimate that 48 percent of the refugees are working
age. Among them, about 62 percent are in urban
areas—a proportion close to the global 60 percent
figure. Among these urban working-age refugees, 62
percent are in major urban areas with at least 300,000
people, and about 24 percent of them are in the largest
urban area in the host country. This means that, in
addition to the fact that the majority of refugees are
in urban areas, there are also substantial proportions
of refugees in major and largest urban areas. For the
refugees outside of these areas, there are additional
opportunities for global, regional, and local businesses
located in smaller urban areas to engage refugees, and
those located in major urban areas can supply from
refugee-owned businesses in smaller urban areas.
However, while our analysis shows that proximity is not
a major barrier to expanding employment for refugees
in many contexts, there are other significant obstacles in
almost all these countries. In most developing countries,
refugees are not legally allowed to work. Many refugees
do in fact work in these countries in the informal
economy, but these workers are more vulnerable to
exploitation and deportation, and a lack of access to the
formal economy restricts their economic opportunities.
And even where refugees are allowed to work formally,
de facto barriers like discrimination still affect their ability
to access the labor market.9 Other challenges include
skill mismatches between refugees and employers’
needs and a lack of equal labor protections.10 Thus,
location in urban areas is just one important factor that
must be considered for expanding labor market access
for refugees.
7
ARE REFUGEES LOCATED NEAR URBAN JOB OPPORTUNITIES?

INTRODUCTION
8
8
ARE REFUGEES LOCATED NEAR URBAN JOB OPPORTUNITIES?

INTRODUCTION
IN RESPONSE TO THE SYRIAN REFUGEE CRISIS AND UNPRECEDENTED LEVELS OF DISPLACEMENT, THERE IS A NEW WAVE OF INTEREST IN EXPANDING ECONOMIC OPPORTUNITIES FOR REFUGEES.
Providing refugees with access to employment is a
promising alternative to the unsustainable model of
year-after-year humanitarian support. As a central
component of self-reliance, employment gives refugees
the ability to support themselves.11 This is crucial given
that refugees have on average been displaced for over
10 years, with the average rising to 21 years for those
displaced for five years or more.12 Employment is also
one of the major unmet needs identified by refugees.13
In recent years there has been an increase in initiatives
to expand refugee employment opportunities, including
World Bank-financed livelihoods projects for refugees in
Uganda; the Jordan Compact, an agreement between
the Jordanian government and international partners
that extended work permits to refugees; and a similar
forthcoming compact in Ethiopia.14 These initiatives also
target host communities so that refugees and citizens
alike benefit from new opportunities. Given that refugees
are often hosted in countries with high unemployment
rates, doing so makes them both politically feasible and
more welcome by the host communities.
Interest in supporting refugees has also been
growing among multinational corporations (MNCs),
including over 80 companies that have joined the Tent
Partnership.15 MNCs are increasingly seeking social
impact alongside profit, and are emerging as important
partners in the push to expand refugee employment and
entrepreneurship. As market leaders, policy influencers,
and innovators, MNCs have distinctive capacities for
engagement that do not exist within the traditional
refugee response community. Recently, we analyzed
the most promising contributions that MNCs can make,
particularly in developing countries, which host 85
percent of the world's refugees.16 We highlighted the
potential role of MNCs in hiring refugees as employees
and sourcing from refugee-owned and refugee-
employing businesses. Incorporating refugees into
these core business activities can be more sustainable
than traditional corporate social responsibility activities,
which are often one-off or periodic for refugees. Some
companies—such as IKEA, Starbucks, and Safeway—
have already stepped up and committed to hiring
refugees.17 MNCs can also work with local businesses
and business associations to encourage other firms to
engage refugees and build on their experience.
As an initial step toward identifying geographic areas in
developing countries where there is significant potential
for expanding economic opportunities for refugees
and where MNCs are most likely to be able to engage
refugees, we mapped the overlap of refugees and major
urban areas. Of course, there are economic
9
ARE REFUGEES LOCATED NEAR URBAN JOB OPPORTUNITIES?

opportunities and MNCs located outside of major
urban areas, but, as we discuss in greater detail in the
“refugee-MNC nexus” section, the largest concentrations
of economic opportunities and MNCs are most likely in
major urban areas. And for MNCs or other companies
to engage refugees, through both direct hiring and
sourcing, they must first be reasonably proximate. It
would be difficult, for example, for a firm operating in
an urban area to employ refugees located in distant
camps or rural areas. And while it may be more feasible
for a company to source from relatively remote refugee
businesses, closer proximity would make partnership
more likely.
It is also true that with freedom of movement, refugees
could relocate or commute to areas with economic
opportunities. However, transportation costs and lack of
networks in new areas may deter many refugees from
doing so. Distance from areas of economic opportunity
also represents an additional barrier to initiatives that
seek to employ refugees in special economic zones,
such as in Jordan, where the zones are far from most
refugees. For example, Syrian refugees in Jordan
report being unwilling to travel away from home for work
due to safety concerns and fear of being deported.18
By determining the extent of overlap between refugees
and major economic areas, the analysis provides a
strong indication of where refugees are geographically
best positioned to take advantage of economic
opportunities.
This analysis is important on several levels. First, it adds
nuance to our general knowledge of where refugees
are located. We know that 60 percent of refugees
now live in urban areas, but the proportion of refugees
in urban areas in developing countries specifically is
less well understood, as is the proportion of refugees
concentrated in major urban areas rather than scattered
across smaller urban areas.19 Furthermore, given the
common misperception that refugees are mostly based
in camps or distant rural areas, highlighting the presence
of refugees in major urban areas may help encourage
the involvement of MNCs and other businesses, as well
as nontraditional partners such as urban planners. The
analysis could also be used by companies to understand
where specifically they can engage refugees. Similarly,
it could help policymakers understand whether
geographic proximity will serve as an additional barrier
to jobs and livelihood programs. It could also be relevant
beyond economic opportunities for refugees. For
example, it can showcase the degree to which refugee
protection services must be geared toward urban
environments.
GIVEN THE COMMON MISPERCEPTION THAT
REFUGEES ARE MOSTLY BASED IN CAMPS
OR DISTANT RURAL AREAS, HIGHLIGHTING
THE PRESENCE OF REFUGEES IN MAJOR
URBAN AREAS MAY HELP ENCOURAGE
THE INVOLVEMENT OF MNCS AND OTHER
BUSINESSES.
ARE REFUGEES LOCATED NEAR URBAN JOB OPPORTUNITIES?
10

Analyzing data on the locations of UNHCR-registered
refugees and people in refugee-like situations
(henceforth “refugees”) in developing countries, we find
that in many countries, substantial numbers of working-
age refugees (defined in our sample as between the
ages of 18 and 59) are living in major urban areas.20
For our low estimate, we consider the most populous
(henceforth “largest”) city in each country to be a major
urban area. For our high estimate, we consider cities with
at least 300,000 people to be major urban areas.21 The
methodology, data, and sample for these estimates are
described in the “Estimating overlap between refugees
and major urban areas” section below.
As figure 1 shows, our high estimate is that, for the 31
countries in our full sample, 17 from a variety of regions
around the world have a minimum of 7,000 working-age
refugees overlapping with major urban areas. Of these
countries, 11 have overlap for at least 25,000 refugees,
and 7 have overlap for at least 50,000. Figure 2 shows
that using our low estimate, we still predict overlap of
at least 7,000 refugees for 15 countries, at least 25,000
for 9 countries, and at least 50,000 for 5 countries. In
other words, even when using a conservative measure,
our analysis shows that there is overlap between major
urban areas and refugees in over half of the countries
examined, and there is especially significant overlap in
about a third. Altogether, using data for 31 countries with
good and moderate data availability, we estimate that
there are between 915,087 and 2,186,829 refugees that
are in major urban areas and therefore likely in close
proximity to economic opportunities and MNCs.22
OUR ANALYSIS SHOWS THAT THERE IS
OVERLAP BETWEEN MAJOR URBAN AREAS
AND REFUGEES IN OVER HALF OF THE
COUNTRIES EXAMINED, AND THERE IS
ESPECIALLY SIGNIFICANT OVERLAP IN
ABOUT A THIRD.
While our analysis shows that there is substantial overlap
between refugees and urban economic opportunities,
it also adds nuance to the headline that 60 percent
of refugees with known locations live in urban areas.
For our sample of 23 countries with the best data, we
estimate that 48 percent of the refugees are working
age. Among them, about 62 percent are in urban
areas—a proportion close to the global 60 percent
figure. Among these urban working-age refugees, 62
percent are in major urban areas with at least 300,000
people, and about 24 percent of them are in the largest
urban area in the host country. This means that, in
addition to the fact that the majority of refugees are in
urban areas, there are also substantial proportions of
refugees in major and largest urban areas. Furthermore,
refugees located outside of these major urban areas can
still be engaged directly by businesses located in smaller
urban areas or can be suppliers for businesses in larger
urban areas. Moreover, some of the refugees in smaller
urban areas and even rural areas are located near major
urban areas, such that it may be possible for them to
relocate for job opportunities.
11
ARE REFUGEES LOCATED NEAR URBAN JOB OPPORTUNITIES?

Our findings are illustrated in the interactive map at the
end of this section, which depicts refugee locations
relative to major urban areas in all 31 countries along
with additional information. For each refugee location,
the map gives the location name, location type (rural/
urban), type of accommodation (camp/non-camp), and
number of working-age refugees. For each country,
it provides the number of MNCs with OECD home
countries (hereafter referred to as OECD MNCs), number
of people employed by these MNCs, average proportion
of working-age refugees, total number of refugees, and
estimates for the total number of refugees in or around
major cities. And for each major city, it gives the name
and population and indicates whether it is the largest
city. Aside from illustrating our results on working-age
refugees in major urban areas, we hope the map will
be used by anyone with an interest in understanding or
analyzing the demographic characteristics or geographic
locations of refugee populations.
FIGURE 1 | LOCATIONS OF UNHCR-REGISTERED REFUGEES AND PEOPLE IN REFUGEE-LIKE SITUATIONS IN RELATION TO MAJOR URBAN AREAS, FOR 31 COUNTRIES
See the “Estimating overlap between refugees and major urban areas” section for a description of how estimates were calculated.
Quartiles
1 2 3 40
20,000
40,000
60,000
80,000
100,000
120,000
140,000
160,000
180,000
HIGH ESTIMATE
LOW ESTIMATE
AFGHANISTAN
BANGLADESH
BURKINA FASO
CHAD
DRC
MAURITANIA
NEPAL
NIGER
SERBIA
SOUTH SUDAN
YEMEN
TANZANIA
THAILAND
ZAMBIA
CONGO, REP. OF
CAMEROON
BURUNDI
ETHIOPIA
INDIA
RWANDA
<7,000 REFUGEES14 COUNTRIES
>7,000 REFUGEES17 COUNTRIES
>25,000 REFUGEES11 COUNTRIES
>50,000 REFUGEES7 COUNTRIES
KENYA
UGANDA
EGYPT
SUDAN
MALAYSIA
IRAN
IRAQ
LEBANON
JORDAN
PAKISTAN
TURKEY
ARE REFUGEES LOCATED NEAR URBAN JOB OPPORTUNITIES?
12

FIGURE 2 | LOW ESTIMATE FOR NUMBER OF WORKING-AGE REFUGEES IN MAJOR URBAN AREAS, FOR 31 COUNTRIES
See the “Estimating overlap between refugees and major urban areas” section for a description of how estimates were calculated.
The analysis can be used as one screen to identify
potential opportunities for MNC engagement with
refugees and expanding other economic opportunities
for refugees in developing countries—but it is only a first
step: geographic overlap is a necessary but insufficient
condition. Refugees face serious policy and practical
barriers to engaging formally with businesses (whether
local, regional, or global), including legal frameworks
that prohibit refugees from working formally, lack of
documents to access financial services, skill sets that
do not match the needs of companies, and lack of
childcare.23 Legal protections should also be in place
before companies engage refugees. They should
be implemented not only to protect refugees from
exploitation, but also to prevent refugees from earning
below minimum wage and thus undermining local labor
organizations and creating resentment within host
communities.24
However, where legal barriers exist and protections
are lacking, MNCs and other businesses and actors
can still engage by participating in broader dialogues
with host governments and other partners on creating a
supportive policy environment. They can also participate
in programs that expand protections for refugee workers
or lower de facto barriers. For example, Istanbul Apparel
Quartiles
1 2 3 40
20,000
40,000
60,000
80,000
100,000
120,000
140,000
160,000
180,000
HIGH ESTIMATE
LOW ESTIMATE
AFGHANISTAN
BANGLADESH
BURKINA FASO
CAMEROON
CHAD
DRC
IRAQ
MAURITANIA
NEPAL
NIGER
SERBIA
SOUTH SUDAN
YEMEN
TANZANIA
THAILAND
ZAMBIA
CONGO, REP. OF
BURUNDI
ETHIOPIA
INDIA
RWANDA
EGYPT
<7,000 REFUGEES16 COUNTRIES
>7,000 REFUGEES15 COUNTRIES
>25,000 REFUGEES9 COUNTRIES
>50,000 REFUGEES5 COUNTRIES
KENYA
PAKISTAN
SUDAN
UGANDA
MALAYSIA
IRAN
JORDAN
LEBANON
TURKEY
13
ARE REFUGEES LOCATED NEAR URBAN JOB OPPORTUNITIES?

LOCATIONS OF UNHCR-RECOGNIZED REFUGEES IN RELATION TO MAJOR URBAN AREAS IN 31 DEVELOPING COUNTRIES
Go to http://bit.ly/2sPrugS to access the interactive map
The boundaries and names used on this map do not imply the expression of any opinion or acceptance by the authors.
Exporters’ Association, a consortium of apparel firms
in Turkey, has recently partnered with the International
Labour Organization (ILO) in committing to bring refugee
employees into the formal sector, which would provide
the refugees legal protections.25 In order to help address
financial access barriers, Mastercard is partnering
with USAID to roll out digital financial tools for refugee
communities in Uganda and Kenya.26
ARE REFUGEES LOCATED NEAR URBAN JOB OPPORTUNITIES?
14

15
ARE REFUGEES LOCATED NEAR URBAN JOB OPPORTUNITIES?

ESTIMATING OVERLAP BETWEEN REFUGEES AND MAJOR URBAN AREAS
16
ARE REFUGEES LOCATED NEAR URBAN JOB OPPORTUNITIES?
TO DETERMINE THE EXTENT TO WHICH REFUGEES ARE LOCATED IN MAJOR URBAN AREAS IN DEVELOPING COUNTRIES, WE ANALYZED THE GEOGRAPHIC OVERLAP IN 31 COUNTRIES.
These countries were selected based on two criteria.
First, based on data from the UNHCR 2016 Statistical
Yearbook, we included all developing countries that
were hosting at least 25,000 refugees at the end of
2016—a total of 37 countries.27 Second, using the same
dataset, we excluded countries that were missing
location data for over 56 percent of the refugees in
the country, and that did not have additional location
information available through the UNHCR map portal,
Refworld, or the Humanitarian Data Exchange.28 This left
us with 31 countries that we deemed to have sufficient
location data. These 31 countries and the proportion of
data available for each are depicted in the interactive
map and listed in the appendix. The appendix also
includes limited information for the other six developing
countries hosting at least 25,000 refugees.
We then divided the 31 countries into two groups: those
that had at least 90 percent location data available,
and those that did not.29 The rationale for this division
was to have one analysis that was more accurate in
estimating overlap (albeit for a smaller sample) and one
analysis that included both groups and thus covered a
larger sample (albeit providing underestimates for some
countries because of the missing data). In addition, for
the remaining six countries with at least 25,000 refugees
that had scant data on the locations of refugees, we
conducted qualitative research to provide a general idea
of the likelihood of overlap between refugees and major
urban areas.
We utilized two data sources to create a high and low
estimate for most countries. For 29 of the 31 countries
with data, we used the UNHCR Statistical Yearbook
to determine where refugees were located in each
country, and how many were located in urban areas. For
the remaining two countries, Bangladesh and Iran, we
used a variety of other sources.30 For all 31 countries we
used the UNHCR Statistical Yearbook to determine the
proportion of working-age refugees (18 to 59 years old).31
(The proportions of working-age refugees and locations
of urban and rural refugees are also depicted in the
interactive map.)
UNHCR’s data collection process is decentralized to the
country level.32 The method varies slightly by country, but
“UNHCR ensures that the choice of a particular method is
appropriate for the country concerned.”33 In developing
countries, the vast majority of data on refugees is
collected by UNHCR via the registration process.
This means that most location data for registered
refugees should be accurate to the extent that refugees
accurately reported their location during registration and
have remained in the same location since registration
or verification—a thorough process carried out by
ESTIMATING OVERLAP BETWEEN REFUGEES AND MAJOR URBAN AREAS
17
ARE REFUGEES LOCATED NEAR URBAN JOB OPPORTUNITIES?

UNHCR to attempt to maintain up-to-date records.34 For
unregistered refugees regarded as “people in refugee-
like situations,” UNHCR either uses an estimation
strategy to define their location or regards their locations
as unknown.35 Although this is a less accurate approach,
people in refugee-like situations make up a small
minority of the total refugee population.36 In certain
contexts, particularly urban areas, surveys are used to
determine demographic and location information. In
other cases, as clearly indicated in the interactive map,
UNHCR is only able to provide location data specific at a
higher-level geographic unit (district, region, etc.), rather
than a city or town.37 UNHCR’s refugee data is therefore
not perfect. But it is the best source of information
available on refugee location and demographics, and
UNHCR claims that “the various sources of all data
collected were critically verified, and the various data
collection methods were carefully evaluated.”38 The
available data should provide a strong approximation of
the locations and demographics of refugees.39
For all 31 countries, we used data from the UN’s 2014
World Urbanization Prospects report to identify major
urban areas.40 The report provided us with a list of all
urban areas in these 31 countries containing at least
300,000 people. We considered all of these areas to be
major urban areas for our high estimate and the most
populous city in each country to be the major urban
area for our low estimate.41 We chose the 300,000
cutoff because the World Urbanization Prospects
report (developed by UNDESA, an authority in tracking
urban development worldwide) considers cities with a
population of less than 300,000 to be small and less
noteworthy as urban agglomerations (cities of 300,000
to 500,000 people are considered medium-sized).
Therefore, we considered that 300,000 would be an
appropriate cutoff for a more liberal measure of “major”
urban areas. However, this cutoff is still somewhat
arbitrary, so we also used a second, more conservative
measure of the most populous city. All the major
urban areas and their populations are depicted in the
interactive map.
It is important to note that not all the UNHCR refugee
location information is specific to a given city. That is
to say, in a minority of instances, the data describes
whether the refugees are rural or urban, and in which
administrative division (e.g. district, region, etc.) they
are located, but it does not identify the exact city. We
therefore have assumed that, among a population of
urban refugees in an administrative area with a major
urban area, a large proportion will be located in the major
urban area. Based on this assumption, we consider
urban refugees in an administrative area with major
urban areas to be located “in or around a major urban
area.” In the interactive map, refugee locations described
as “dispersed” are not precise, but rather indicate the
administrative area in which the bubble is located. All
other locations (the majority) are precise.
Working on these assumptions, our high estimate of
geographic overlap between refugees and major urban
areas is the number of working-age refugees located
in or around urban areas with a population of at least
300,000 people. Our low estimate is the number of
working-age refugees in or around the largest urban
area in the country. For several reasons, these estimates
are not perfect indications of the number of refugees
located in major urban areas in these countries. For
one, they are biased downwards by the facts that some
data for refugee locations is missing, and our definition
of “working-age” (ages 18 to 59) is narrower than the
more common definition of 15 to 64 (the data do not
allow us to use the definition of 15 to 64). (These factors
also exert downward bias on the overall estimated
number of urban, working-age refugees, presented in
the tables and appendix.) Our estimates of overlap may
also be biased slightly upwards because some of the
ARE REFUGEES LOCATED NEAR URBAN JOB OPPORTUNITIES?
18

FIGURE 3 | LOCATIONS OF REFUGEES IN CAMEROON, RELATIVE TO MAJOR URBAN AREAS
“dispersed” urban refugees may be located in smaller
cities that we do not consider major urban areas. Another
small source of bias, in an unknown direction, is the
application of weighted averages for refugee locations
with unknown working-age proportions.42 Nonetheless,
the estimates are still useful in highlighting the general
degree to which refugees overlap with major urban
areas.
The map of Cameroon in figure 3 provides an example of
how the analysis was conducted. Out of a total of 375,415
refugees in the country, there are 9,290 working-age
refugees located in major urban areas—this is the high
estimate of overlap. Of the six major cities in the country,
refugees are located in two: Douala and Yaoundé. There
are 5,506 located in Yaoundé, the largest city—this is the
low estimate.
YAOUNDEDOUALA
LOUM
BAFOUSSAMMBOUDA
BAMENDA
NUMBER OF WORKING- AGE REFUGEES
REFUGEE LOCATION TYPE
15,001 - 20,000
10,001 - 15,000
5,001 - 10,000
1,001 - 5,000
183 - 1,000
MAJOR URBAN AREAS URBAN
RURAL
MAJOR URBAN AREAS
>300,000 PEOPLE
MOST POPULOUS CITY
0 50 100 200 MILES
19
ARE REFUGEES LOCATED NEAR URBAN JOB OPPORTUNITIES?

The map of Jordan in figure 4 provides another example.
For Jordan, locations for urban refugees are only precise
to the governorate. For example, we know that there
are 9,275 urban, working-age refugees in the Balqa
governorate, but we do not know in which cities within
the governorate they are located. There are four major
cities in the country: Irbid (in the Irbid governorate),
Zarqa and Al-Ruseifa (in the Zarqa governorate), and
Amman (in the Amman governorate), with Amman being
the largest. Thus, working on the assumption that the
59,830 urban refugees in the Irbid governorate are
FIGURE 4 | LOCATIONS OF REFUGEES IN JORDAN, RELATIVE TO MAJOR URBAN AREAS
located in or around Irbid, the 22,833 urban refugees in
the Zarqa governorate are located in or around Zarqa or
Al-Ruseifa, and the 110,013 urban refugees in the Amman
governorate are located in or around Amman, our high
estimate of overlap is 192,676 and our low estimate
is 110,013.
The maps in figures 3 and 4 provide just two examples;
additional information on these two countries and
refugee locations for the other 29 countries can be
explored in the interactive map.
NUMBER OF WORKING- AGE REFUGEES
REFUGEE LOCATION TYPE
60,001 - 144,208
35,001 - 60,000
10,001 - 35,000
5,001 - 10,000
703 - 5,000
MAJOR URBAN AREAS
URBAN
RURAL
MAJOR URBAN AREAS
>300,000 PEOPLE
MOST POPULOUS CITY
AMMANAL-RUSEIFA
ZARQA
IRBID
0 15 30 60 MILES
ARE REFUGEES LOCATED NEAR URBAN JOB OPPORTUNITIES?
20

21
ARE REFUGEES LOCATED NEAR URBAN JOB OPPORTUNITIES?
THE REFUGEE-MNC NEXUS: IMPLICATIONS OF THE OVERLAP BETWEEN REFUGEES AND URBAN AREAS
22
ARE REFUGEES LOCATED NEAR URBAN JOB OPPORTUNITIES?
THE REFUGEE-MNC NEXUS: IMPLICATIONS OF THE OVERLAP BETWEEN REFUGEES AND URBAN AREAS
THE LINK BETWEEN ECONOMIC OPPORTUNITIES AND URBAN AREAS IS WELL DOCUMENTED: FROM ADAM SMITH TO CONTEMPORARY RESEARCHERS, FOR CENTURIES ECONOMISTS HAVE FOUND POSITIVE ASSOCIATIONS BETWEEN URBAN SCALE AND PRODUCTIVITY, ECONOMIC ACTIVITY, AND EMPLOYMENT.43
As an illustration, 681 of the world largest urban areas
in developed and developing countries account for
24 percent of the global population and 60 percent
of global output.44 Likewise, there is a high correlation
between population and employment.45 And although
new opportunities for employment are not guaranteed
by large amounts of employment (in some cities
unemployment is as high as 25 percent),46 large cities
still provide the most promising opportunities. This
is especially true in developing countries, which are
home to the large urban areas with the fastest-growing
economies and where urban productivity relative to
national productivity is especially high.47 Thus, while
being in a large urban area in a developing country is
not a guarantee of economic opportunity (and there
are of course economic opportunities in smaller urban
areas and rural zones), it does entail larger employment
opportunities.
According to theoretical and empirical evidence from
a large literature on the determinants of foreign direct
investment (FDI), MNCs cluster in and around major urban
areas, and larger urban areas attract more MNCs. In
theory, urban areas attract the most FDI (which includes
the activity of MNCs) because they provide a range of
benefits to new businesses and investors, including
more developed infrastructure, access to transportation
hubs and support services, and proximity to government
agencies.48 They also provide access to larger markets—
both in terms of demand and supply of skilled labor—and
facilitate knowledge spillover and linkages.49
In India, a study found that population size was a strong
determinant of where companies decided to invest; a 1
percent increase in population “improved the odds of
attracting an investor by 16 percent.”50 Another study found
that in China, for both manufacturing and service FDI,
the proportion of a population that was urban in a given
province was strongly correlated with the amount of FDI
to that province.51 A US-based analysis also found that
agglomeration, the “geographic clustering of economic
activity” (a characteristic of cities), attracted FDI.52 A study
looking specifically at MNC location decisions in 100
countries found that “multinationals’ location choices are
significantly affected by agglomeration economies” and
access to major markets.53 Another analysis, examining
72 cities in developed and developing countries around
the world, revealed that population size was strongly
correlated with the likelihood that an MNC would establish
its regional offshore headquarters in a given city.54
23
ARE REFUGEES LOCATED NEAR URBAN JOB OPPORTUNITIES?

Based on the evidence that a large portion of MNCs
operate in urban areas, and larger urban areas are likely
to have a stronger MNC presence, we consider major
urban areas to be likely areas for MNC presence, and
the largest urban area in each country to be the most
likely location for MNCs. Of course, some MNCs operate
in rural areas (such as those involved in extractives
or agriculture), and many refugees have agricultural
experience and skills that may be valued by these MNCs.
However, their locations are more difficult to estimate,
and are in many cases probably not clustered in a
single area.
Another important factor to consider is how MNC
concentration varies across countries. It may be the
case that MNCs generally congregate in cities, but if
there are few or no MNCs in a given country, that fact is
irrelevant for the country. And while we do not have data
for within-country locations of MNCs, we do have data on
their locations by country. Specifically, we have data on
the number of OECD MNCs, and the number of people
employed directly by these MNCs in each country.55
Thus, when analyzing the implications of refugee-major
urban area overlap for engagement with MNCs in each
country, we are careful to take note of the number of
OECD MNCs in the country.
Among developing countries hosting at least 25,000
refugees, the mean and median numbers of people
employed directly by OECD MNCs in 2014 were 250,665
and 16,205, respectively. Meanwhile, the mean and
median numbers of refugees in those countries in 2016
were 407,117 and 228,990, respectively.
Among MNCs present in a given a country where
refugees are able to work legally, it is likely that only
a fraction will proactively engage refugees and that
refugees would account for only a fraction their total
workforce. If MNCs were to hire refugees at the same
rate as natives (relative to their respective shares of
the entire population), the total number of refugee
hires would be especially small, not accounting for the
additional barriers refugees face. Thus, MNCs would
have to prioritize refugee hires to create a direct impact.
Such prioritization will be politically more feasible in a
context of increased MNC investments and a growing
overall workforce. To mitigate the risk of social tensions,
it is important for MNCs to take an area-based approach
in which new investments benefit both refugees and
host communities, which are often experiencing high
unemployment and limited economic opportunities. Still,
regardless of how much MNCs prioritize refugee hiring,
the overall proportion that they hire may be substantial
but minor.
However, MNCs can create impact through more than
just direct hires. They can include refugees in their
supply chains.56 By sourcing supplies, inputs, and
services from refugee-owned or -employing businesses,
they can indirectly support refugee employment.
This can range from supplying office equipment and
services (e.g., catering, maintenance, and landscaping)
to manufacturing inputs. As market leaders, MNCs are
also trendsetters. By demonstrating business models
that create profit as well as social impact for refugee
populations, they can influence other local, regional,
and global businesses to do the same.57
MNCS CAN CREATE IMPACT THROUGH MORE
THAN JUST DIRECT HIRES. THEY CAN INCLUDE
REFUGEES IN THEIR SUPPLY CHAINS. BY
SOURCING SUPPLIES, INPUTS, AND SERVICES
FROM REFUGEE-OWNED OR -EMPLOYING
BUSINESSES, THEY CAN INDIRECTLY SUPPORT
REFUGEE EMPLOYMENT.
24
ARE REFUGEES LOCATED NEAR URBAN JOB OPPORTUNITIES?

Furthermore, in partnership with donors and NGOs,
MNCs can organize efforts to increase awareness
among local businesses about refugee skills and
potential and the business case for hiring them.
Leveraging their extensive supply chains as influence in
local markets, they can also incentivize and encourage
other businesses to engage refugees. Therefore,
although the greatest potential for employing large
numbers of refugees comes from local and regional
businesses rather than global ones, MNC engagement
can facilitate refugee employment and entrepreneurship
more broadly.
Finally, their unique position as leaders and innovators
gives MNCs distinctive capacities for engaging on policy
reforms that do not exist within the traditional refugee
response community. Leveraging their position as
major investors and job creators, they may be able to
shape meaningful dialogue with policymakers even in
challenging political economy environments.
For all these reasons, we are interested in the
implications of refugee-major urban area overlap for
MNC engagement in addition to economic opportunities
more broadly.
25
ARE REFUGEES LOCATED NEAR URBAN JOB OPPORTUNITIES?

LARGE REFUGEE POPULATIONS ARE LOCATED IN MAJOR URBAN AREAS—IN MOST COUNTRIES
26
ARE REFUGEES LOCATED NEAR URBAN JOB OPPORTUNITIES?

TABLE 1 | REFUGEE, URBAN LOCATION, AND MNC DATA AND OVERLAP ESTIMATES FOR THE 23 COUNTRIES WITH AT LEAST 90 PERCENT DATA, RANKED BY THE HIGH ESTIMATE AND GROUPED BY HIGH ESTIMATE QUARTILES
TOTAL NUMBER OF REFUGEES
NUMBER OF URBAN, WORKING-
AGE REFUGEES
HIGH ESTIMATE OF OVERLAP:
NUMBER IN OR AROUND URBAN
AREAS WITH >300K PEOPLE*
LOW ESTIMATE OF OVERLAP: NUMBER IN
OR AROUND LARGEST
URBAN AREA
NUMBER OF OECD MNCS **
NUMBER OF PEOPLE
EMPLOYED BY OECD MNCS
NUMBER OF WORKING-AGE REFUGEES***
AFGHANISTAN 59,771 2,052 0 0 3 671 16,138
TANZANIA 281,498 0 0 0 128 17,794 110,645
YEMEN 269,783 76,385 0 0 16 300 199,005
NEPAL 25,249 321 321 321 20 582 20,032
BURKINA FASO 32,552 1,037 1,036 648 51 3,377 13,337
NIGER 166,093 1,256 1,066 1,066 34 3,148 58,164
CHAD 391,251 1,853 1,853 1,853 27 9,045 146,554
SOUTH SUDAN 262,560 6,174 2,246 2,246 . . 92,933
THAILAND 106,447 2,381 2,381 2,381 2,466 491,313 51,755
CONGO, REP. OF 46,457 8,132 8,132 7,075 83 11,091 23,377
CAMEROON 375,415 11,623 9,290 3,784 106 17,724 149,355
BURUNDI 57,469 10,897 10,897 10,897 6 100 23,832
ETHIOPIA 791,631 40,131 11,973 11,973 31 16,205 271,670
RWANDA 156,065 18,620 17,011 17,011 7 . 74,486
KENYA 451,099 26,311 26,311 26,311 221 65,250 175,005
UGANDA 940,835 34,023 34,023 34,023 60 7,390 352,022
SUDAN 421,466 65,922 36,691 31,327 8 100 177,717
MALAYSIA 92,263 72,888 72,888 72,888 2,091 363,249 72,888
IRAQ 261,888 142,916 98,777 3,875 76 2,661 143,650
LEBANON 1,012,969 427,582 118,196 118,196 123 6,246 427,645
JORDAN 685,197 259,470 192,676 110,013 84 10,377 314,944
PAKISTAN 1,352,560 426,257 314,307 29,786 159 47,296 618,333
TURKEY 2,869,421 1,678,813 1,078,782 302,124 1,858 358,473 1,828,854
TOTAL 11,109,939 3,315,044 2,038,857 787,798 7,658 1,432,392 5,362,342
AVERAGE 483,041 144,132 88,646 34,252 348 68,209 233,145
Quartile averages are depicted in Figure 5. Turkey was excluded from the quartiles as an outlier. See notes for the table on page 37.
ANALYSIS 1: 23 COUNTRIES WITH AT LEAST 90 PERCENT DATA AVAILABILITY
Table 1 presents the high and low estimates for each of
the 23 countries with at least 90 percent data availability
for refugee locations. This information is also illustrated
in the interactive map. On average, somewhere between
34,252 and 88,646 working-age refugees are in major
urban areas. This is a relatively small portion of the total
number of refugees, but even the average low estimate
of 34,252 is a substantial population of refugees that have
access to urban economic opportunities and potential
engagement with MNCs.
LARGE REFUGEE POPULATIONS ARE LOCATED IN MAJOR URBAN AREAS—IN MOST COUNTRIES
27
ARE REFUGEES LOCATED NEAR URBAN JOB OPPORTUNITIES?

However, these averages mask a good deal of variation
across countries. Figure 5 presents the average high and
low estimates for four groups of countries, with groups
created by separating countries into quartiles based on
the estimates. It shows that, even excluding Turkey as an
outlier, there are on average at least 70,000 working-age
refugees in or around major urban areas for the highest
quartile. For the next group, there still tends to be tens of
thousands of refugees living in these areas. Populations
are thinner for the second quartile, with about 3,500
to 6,000 working-age refugees in major urban areas
on average. While this is not a huge quantity, it is still a
reasonably large population with opportunities to connect
with urban economic opportunities. However, populations
are much smaller for the group with the least overlap,
where average estimates range from 339 to 404.
This first analysis makes it clear that while refugees
do not have a strong presence in major urban areas
Quartiles were created based on low and high estimates of overlap, respectively. Turkey is excluded as an outlier; all other reported
estimates are included.
in all countries in the sample, they do in a wide range
of countries. From our sample, according to the high
estimate, there are 14 countries with at least 7,000
refugees in or around major urban areas; according to the
low estimate, there are 12. These countries represent a
range of regions—including the Middle East, South Asia,
Southeast Asia, East Africa, and West Africa—such that
there are likely opportunities for MNCs and organizations
seeking to expand employment for refugees to engage
in a variety of regions. In terms of even more promising
opportunities, there are 8 to 9 countries (according to the
low and high estimates, respectively) with at least 25,000
refugees overlapping, and 4 to 6 with at least 50,000.
Furthermore, it is important to keep in mind that overlap
may be considerably larger in some countries than these
estimates suggest, as they do not capture the possibility
of refugees being located near MNCs that operate in, or
supply from, rural areas.
FIGURE 5 | AVERAGE ESTIMATES OF GEOGRAPHIC OVERLAP BETWEEN WORKING-AGE REFUGEES AND MAJOR URBAN AREAS, BY COUNTRY QUARTILE
Quartiles
1 2 3 40
20,000
40,000
60,000
80,000
100,000
120,000
140,000
160,000
180,000
HIGH ESTIMATE
LOW ESTIMATE
ARE REFUGEES LOCATED NEAR URBAN JOB OPPORTUNITIES?
28

These analyses highlight two other facts that add nuance
to our understanding of the refugee crisis. First, in these
23 countries, there are 787,798 and 2,038,857 working-
age refugees in the largest cities and major urban areas
with over 300,000 people, respectively, which amounts
to about 15 percent and 38 percent of the total working-
age refugee population for this subset of countries.
This means that, for this sample, about 62 percent of
urban working-age refugees are in major urban areas
and about 24 percent of urban working-age refugees
are in largest urban areas. These may seem like low
percentages, but they amount to large absolute numbers.
It is well known that 60 percent of refugees with known
locations live in urban areas, but it is less well known that
many of these urban refugees (over 60 percent) are also
in major urban areas and about a quarter of them are in
largest urban areas. Furthermore, these percentages are
likely underestimates because, as discussed above in
“estimating overlap between refugees and major urban
areas” section, some data are missing.
Another interesting nuance is that nearly half—about 48
percent—of all refugees in the sample are working-age.
This figure is close to the proportion of working-age
refugees among the global population of refugees with
demographic information (45 percent).58 Our analysis
shows that the proportion in developing countries is
similar, but slightly larger. And, if the more common
working-age definition of ages 15 to 64 could be used,
these proportions would be even larger.
Table 1 also shows that, for 16 of the 23 countries, the low
estimate for refugees in major urban areas is equal to at
least 20 percent of the total number of people employed
by OECD MNCs. For 11 countries, it is equal to at least
half of the total employment numbers. This suggests that
there is a large pool of potential refugee applicants in
these countries relative to the number of total people that
the companies hire.
IT IS WELL KNOWN THAT 60 PERCENT OF
REFUGEES WITH KNOWN LOCATIONS LIVE IN
URBAN AREAS, BUT IT IS LESS WELL KNOWN
THAT MANY OF THESE URBAN REFUGEES
(OVER 60 PERCENT) ARE ALSO IN MAJOR
URBAN AREAS AND ABOUT A QUARTER OF
THEM ARE IN LARGEST URBAN AREAS.
Furthermore, there are a large number of MNCs that
can engage refugees. In countries with at least 7,000
refugees overlapping (according to the low estimate), the
average number of OECD MNCs is 394; excluding Turkey
and Malaysia as outliers, it is 78. And in reality, because
data is missing for some OECD countries and there is no
data for non-OECD countries, these averages are likely
substantially higher.59 The number of OECD MNCs and
the number of people employed by them can also be
explored in the interactive map.
Quartiles
1 2 3 40
20,000
40,000
60,000
80,000
100,000
120,000
140,000
160,000
180,000
HIGH ESTIMATE
LOW ESTIMATE
29
ARE REFUGEES LOCATED NEAR URBAN JOB OPPORTUNITIES?

ANALYSIS 2: 31 COUNTRIES WITH SUFFICIENT LOCATION DATA
Our second analysis builds on the first by adding the
seven countries with less than 90 percent location
data available but sufficient information to provide a
general picture of overlap. Table 2 shows the results
of the analysis. This information is also illustrated in the
interactive map. Because of the missing data (the amount
of which for each country is listed in the last column), both
the high and low estimates are very likely underestimates
of the actual amount of overlap. Nevertheless, the
table shows that these new estimates pull the average
estimates down only slightly. Like the first sample, the
new sample has significant variation, with little-to-no
overlap in some countries and a very large degree of
overlap in others.
TABLE 2 | REFUGEE, URBAN LOCATION, AND MNC DATA AND OVERLAP ESTIMATES FOR COUNTRIES WITH SUFFICIENT DATA, RANKED BY THE HIGH ESTIMATE
TOTAL NUMBER
OF REFUGEES
NUMBER OF URBAN, WORKING-
AGE REFUGEES
HIGH ESTIMATE OF OVERLAP:
NUMBER IN OR AROUND URBAN
AREAS WITH >300K PEOPLE*
LOW ESTIMATE OF OVERLAP: NUMBER IN
OR AROUND LARGEST
URBAN AREA
NUMBER OF OECD MNCS **
NUMBER OF PEOPLE EMPLOYED BY OECD
MNCS
NUMBER OF WORKING-
AGE REFUGEES
***
% DATA AVAILABLE
BANGLADESH 964,207 3,397 0 0 108 39,041 418,631 52
MAURITANIA 74,148 829 414 414 23 902 30,726 65
SERBIA 36,522 9,444 1,041 1,041 996 112,080 21,147 65
DRC 451,956 3,249 3,249 0 66 6,412 150,164 48
ZAMBIA 29,350 4,718 4,718 4,718 73 7,082 15,356 81
INDIA 197,851 14,019 14,019 14,019 3,298 2,225,638 112,775 45
EGYPT 213,530 101,464 36,533 19,099 534 141,948 102,844 66
IRAN 979,435 87,998 87,998 87,998 69 3,242 430,942 20
AVERAGE 368,375 28,140 18,497 15,911 646 317,043 160,323
TOTAL 2,946,999 225,118 147,972 127,289 5,167 2,536,345 1,282,584
AVERAGE FOR ALL 31 COUNTRIES
453,450 114,199 70,543 29,519 428 136,853 214,352
TOTAL FOR ALL 31 COUNTRIES
14,056,938 3,540,162 2,186,829 915,087 12,825 3,968,737 6,644,926
See notes for the table on page 37.
ARE REFUGEES LOCATED NEAR URBAN JOB OPPORTUNITIES?
30

It should be reiterated that a lack of overlap does not
preclude the ability to connect refugees with economic
opportunities or for MNCs to engage refugees in hiring
and supply chains. As noted above, proximity is certainly
a helpful factor, but if there were strong will among the
international community and the private sector to bring
refugees into the labor market, then barriers of proximity
could be overcome. For example, in Bangladesh, many
refugees are located around the city of Cox’s Bazaar. This
city is not considered “major,” but it has a population of
about 250,000, so it is near the cutoff and presents some
possibilities for interaction.60 Even more promisingly,
as depicted in the interactive map, Chittagong, a city of
over 4 million, is only about 100 kilometers north of the
refugee populations. There are also many MNCs in the
country. If the proper incentives and support programs
were created, it would certainly be feasible to connect
MNCs and other businesses in Chittagong with refugees.
Thus, while the estimates provided here are an indication
of the ease of connecting with refugees, they are by no
means a final determinant of the ability to do so.
A LACK OF OVERLAP DOES NOT PRECLUDE
THE ABILITY TO CONNECT REFUGEES WITH
ECONOMIC OPPORTUNITIES OR FOR MNCS TO
ENGAGE REFUGEES IN HIRING AND SUPPLY
CHAINS.
Figure 6 illustrates the estimates for the low-data
countries alongside the countries with at least 90
percent data availability and attempts to connect
the findings from this analysis with the implications
for MNC engagement. It shows that about half of all
countries have at least 7,000 refugees overlapping with
major urban areas, where MNCs are most likely to be
operating. More specifically, based on the low and high
estimates, 15 to 17 out of the 31 countries have at least
7,000 overlapping, 9 to 11 have at least 25,000, and 5 to
7 have at least 50,000. Furthermore, the graph shows
that most of the countries with substantial overlap also
have significant MNC presence; the large majority have
at least 1,000 people employed by MNCs with OECD
home countries, and about half have more than 10,000.
Thus, assuming that many of these MNCs are operating
in major urban areas, there are opportunities for MNCs
to connect with refugees in a wide range of countries.
31
ARE REFUGEES LOCATED NEAR URBAN JOB OPPORTUNITIES?
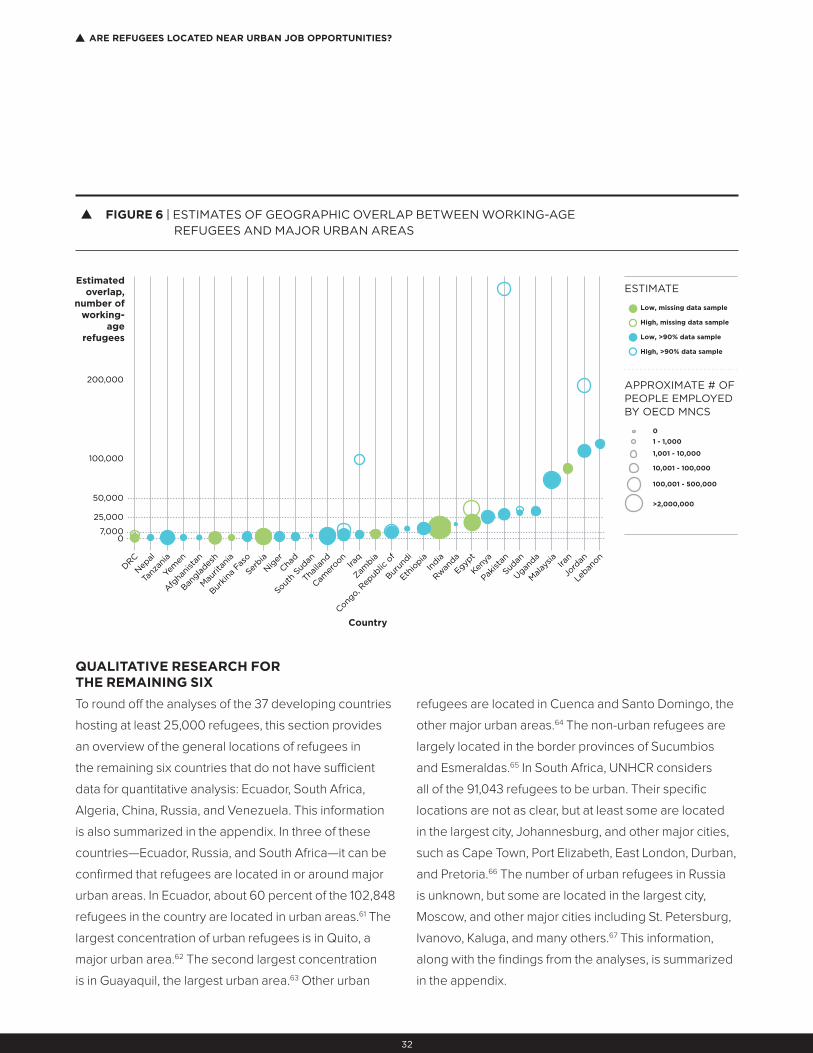
QUALITATIVE RESEARCH FOR THE REMAINING SIX
To round off the analyses of the 37 developing countries
hosting at least 25,000 refugees, this section provides
an overview of the general locations of refugees in
the remaining six countries that do not have sufficient
data for quantitative analysis: Ecuador, South Africa,
Algeria, China, Russia, and Venezuela. This information
is also summarized in the appendix. In three of these
countries—Ecuador, Russia, and South Africa—it can be
confirmed that refugees are located in or around major
urban areas. In Ecuador, about 60 percent of the 102,848
refugees in the country are located in urban areas.61 The
largest concentration of urban refugees is in Quito, a
major urban area.62 The second largest concentration
is in Guayaquil, the largest urban area.63 Other urban
refugees are located in Cuenca and Santo Domingo, the
other major urban areas.64 The non-urban refugees are
largely located in the border provinces of Sucumbios
and Esmeraldas.65 In South Africa, UNHCR considers
all of the 91,043 refugees to be urban. Their specific
locations are not as clear, but at least some are located
in the largest city, Johannesburg, and other major cities,
such as Cape Town, Port Elizabeth, East London, Durban,
and Pretoria.66 The number of urban refugees in Russia
is unknown, but some are located in the largest city,
Moscow, and other major cities including St. Petersburg,
Ivanovo, Kaluga, and many others.67 This information,
along with the findings from the analyses, is summarized
in the appendix.
FIGURE 6 | ESTIMATES OF GEOGRAPHIC OVERLAP BETWEEN WORKING-AGE REFUGEES AND MAJOR URBAN AREAS
Country
07,000
25,000
50,000
100,000
200,000
DRC
Nep
al
Tanz
ania
Yem
en
Afg
hani
stan
Bangla
desh
Mau
ritan
ia
Burkina
Fas
o
Serbia
Nig
er
Chad
South
Sudan
Thailand
Camer
oonIra
q
Zambia
Congo,
Rep
ublic
of
Burun
di
Ethio
piaIn
dia
Rwan
da
Egypt
Kenya
Pakist
an
Sudan
Uganda
Malay
sia Iran
Jord
an
Leban
on
Low, missing data sample
High, missing data sample
Low, >90% data sample
High, >90% data sample
0
1 - 1,000
1,001 - 10,000
10,001 - 100,000
100,001 - 500,000
>2,000,000
Estimated overlap,
number of working-
age refugees
ESTIMATE
APPROXIMATE # OF PEOPLE EMPLOYED BY OECD MNCS
ARE REFUGEES LOCATED NEAR URBAN JOB OPPORTUNITIES?
32

In the other three countries, the presence of refugees in
major urban areas is more difficult to confirm. In Algeria,
in fact, most refugees (about 90,000) are in camps in the
isolated areas along the border with Western Sahara.68
There are only about 7,000 urban refugees, which are in
the largest city, Algiers. In China and Venezuela, locations
are difficult to ascertain; refugees appear to be scattered
throughout the countries. Regardless, the situations in
these two countries may not warrant (or allow) concerted
efforts to expand economic opportunities for refugees:
in China, refugees are already mostly integrated,69 and in
Venezuela the burgeoning economic crisis has resulted
in the outflow of many Colombian as well as Venezuelan
refugees and a prohibitive climate for investment.70
Overall, this information is in sync with the trends from
the analyses above: refugees are not in favorable
locations for engagement urban economic activities
in all countries, but in many countries they are.
33
ARE REFUGEES LOCATED NEAR URBAN JOB OPPORTUNITIES?

PROXIMITY TO MAJOR URBAN AREAS IS JUST THE FIRST STEP
34
ARE REFUGEES LOCATED NEAR URBAN JOB OPPORTUNITIES?

PROXIMITY TO MAJOR URBAN AREAS IS JUST THE FIRST STEP
AS MENTIONED PREVIOUSLY, GEOGRAPHIC PROXIMITY TO MAJOR URBAN AREAS IS ONLY ONE POTENTIAL BARRIER—AND GENERALLY NOT THE MOST SIGNIFICANT—TO EXPANDING ECONOMIC OPPORTUNITIES FOR REFUGEES.
Other factors may constitute much more substantial
barriers, such as the inability for refugees to access the
formal labor market in many countries. Refugees do work
in the informal economy in many countries, and this work
is an important source of self-sufficiency given the lack
of formal opportunities.72 But there are costs to working
informally: informal workers do not have the same rights
and labor protections that formal workers enjoy; they
are prone to greater exposure to health and safety risks;
and they face the possibility of harassment, arrest, or
deportation if caught working.73 They also necessarily
have fewer economic opportunities as both employees
and business owners. Female refugees are especially
vulnerable to the risks of informal employment.74
There are a wide range of factors limiting formal
labor market access, including refugees’ lack of legal
recognition; their inability to be legally employed, own a
business, or leave camps; and discrimination. If refugees
are not allowed to move freely and are not able to access
formal employment, MNCs and other businesses may not
be able to work with refugees, regardless of proximity.75
Similarly, if refugees are restricted from opening a
business or accessing financial services like loans,
businesses may not be able to include refugee-owned
businesses in their supply chains. And, as we show in a
forthcoming paper, providing refugees with greater labor
market access can be beneficial not only to refugees and
their employers, but also to their host countries in terms
of labor market outcomes, fiscal effects, and economic
growth.
Legal protections should also be in place before
employment opportunities are expanded for refugees.
They should be implemented not only to protect
refugees from exploitation, but also to prevent refugees
from building local resentment. For example, if there
is no equal pay legislation regarding refugees, they
may earn below minimum wage and thus undermine
local labor organizations or displace native workers.
Before extending the right to work, governments should
consider what measures should be enacted to ensure
fair outcomes.76
Another major barrier may be skills match. For example,
in countries such as Turkey, most refugees do not
speak the same language as the host community.
Furthermore, higher-skilled refugees may find ways to
migrate to countries with more opportunities, leaving
MNCs and other businesses with a more restricted
pool of applicants from which to hire.77 And even when
skilled refugees are present and are permitted to
work, it may be difficult for businesses to confirm their
35
ARE REFUGEES LOCATED NEAR URBAN JOB OPPORTUNITIES?

abilities, as the process of obtaining recognition for
professional credentials can be exceedingly difficult or
even impossible. Policymakers and businesses should
work together to overcome these barriers. Working
in partnership with others, MNCs can leverage their
stature and role in developing economies to engage in
policy dialogue and promote greater rights for refugees.
They can also work with local businesses and business
associations to combat discrimination and prejudice
toward refugees by disseminating information about
refugees and their skills.
In terms of skills barriers, businesses, donors, and NGOs
can work together to provide language and skills training
to refugees and job matching services. For example, an
NGO in Jordan, ReBootKamp, helps refugees develop
IT skills desired by businesses and helps connect them
with hiring companies, including MNCs.78 Another project
in Jordan led by the International Rescue Committee and
Western Union helped connect refugees to businesses’
outsourcing tasks.79 While such progress is promising,
more energy, investment, and innovation is required.
Building on initial successes, development actors with
new investments in addressing protracted displacement,
such as the World Bank, can leverage their policy voice
and funding to facilitate opportunities at scale.80 But
regardless of future investments, there are refugees
that can be engaged now. Although some groups and
populations of refugees may not possess the skill sets
needed for certain employment opportunities, many
others are capable of meeting the needs of MNCs and
other businesses.81
Our analysis has shown that there is substantial
overlap between refugees and major urban areas,
suggesting that there is ample opportunity for
businesses to hire and source from refugees. The
analysis and interactive map can serve as a basic
tool for MNCs and their partners, giving a first
indication of which countries and cities might provide
opportunities for engagement. They can also serve
as a tool for other organizations seeking to better
understand refugee locations and demographics.
Although we recognize that where, how, and if a
given company ultimately decides to engage with
refugees depends on several factors—including the
company’s own needs and priorities—research and
tools such as these can help guide and encourage
businesses in the early stages of planning.
Future research could include an expansion of the
current map to other countries, the development of
more detailed maps pinpointing the specific intra-
country locations of refugees (in the countries we
have analyzed as well as others), or a database that
collects information on each country related to its
enabling environment for businesses to engage
refugees, including de facto and de jure measures.
Analyses could also be conducted to more rigorously
determine within-country MNC locations in relation
to refugees, potentially by scanning countries’ news
reports for mentions of MNC locations; the level and
types of related donor and NGO activities; or the
demographic and skills profiles of refugees. We hope
our analysis is just a first step in developing research
and tools that facilitate sustainable private sector
engagement in promoting refugee livelihoods.
ARE REFUGEES LOCATED NEAR URBAN JOB OPPORTUNITIES?
36

TABLE NOTES
* High Estimate = number of working-age refugees
located in urban areas with at least 300,000 people
Low Estimate = number of working-age refugees located
in the most populous urban area
** For the “number of MNCs/MNC employment data,”
data are from OECD.stat, for 2014. MNC definitions for
this dataset vary by country; they are typically defined
as all foreign affiliates for which the combined direct
and indirect ownership interest of all parents from the
declaring country exceeds, depending on the country,
either 10 percent or 50 percent (usually the latter).
The OECD countries included are Austria, Belgium,
the Czech Rep., Denmark, Estonia, Finland, France,
Germany, Greece, Hungary, Ireland, Italy, Latvia,
Luxembourg, the Netherlands, Norway, Poland, Portugal,
the Slovak Rep., Slovenia, Spain, Sweden, the US, and
the UK. The OECD countries excluded are Australia,
Canada, Japan, Korea, Switzerland, and Turkey.
For some partner-declaring country combinations,
data is confidential—particularly when there are very
few MNCs. In some cases, data is missing without
explanation. We count confidential and missing data
as zero. Thus, the data for total numbers of MNCs and
employment are underestimates. Where all data for a
given country is missing or confidential (i.e. for South
Sudan and Rwanda on one variable), we display it as
missing in the tables and as zero in the interactive map.
*** The number of working-age refugees in each country
was calculated by first determining the population-
weighted average working age proportion among
all refugee locations in each the country, and then
multiplying these average proportions by the total
number of refugees in each country. So, it was not
calculated by simply adding together the number of
working-age refugees in each within-country location.
This was done so that the missing data would not cause
underestimation.
37
ARE REFUGEES LOCATED NEAR URBAN JOB OPPORTUNITIES?ARE REFUGEES LOCATED NEAR URBAN JOB OPPORTUNITIES?

APPENDIX
TOTAL NUMBER OF REFUGEES
NUMBER OF URBAN, WORKING-
AGE REFUGEES
HIGH ESTIMATE OF OVERLAP:
NUMBER IN OR AROUND URBAN
AREAS WITH >300K PEOPLE*
LOW ESTIMATE OF OVERLAP: NUMBER IN
OR AROUND LARGEST
URBAN AREA
NUMBER OF OECD MNCS
NUMBER OF PEOPLE
EMPLOYED BY OECD MNCS
% OF REFUGEES
WITH PRECISE LOCATION INFO (I.E. % COUNTED IN ESTIMATES)
NUMBER OF WORKING-AGE
REFUGEES
AFGHANISTAN 59,771 2,052 0 0 3 671 99.7 16,138
YEMEN 269,783 76,385 0 0 16 300 99.4 199,005
TANZANIA 281,498 0 0 0 128 17,794 100.0 110,645
BANGLADESH 964,207 3,397 0 0 108 39,041 52.0 418,631
NEPAL 25,249 321 321 321 20 582 100.0 20,032
MAURITANIA 74,148 829 414 414 23 902 64.9 30,726
BURKINA FASO 32,552 1,037 1,036 648 51 3,377 100.0 13,337
SERBIA 36,522 9,444 1,041 1,041 996 112,080 65.0 21,147
NIGER 166,093 1,256 1,066 1,066 34 3,148 99.9 58,164
CHAD 391,251 1,853 1,853 1,853 27 9,045 99.7 146,554
SOUTH SUDAN 262,560 6,174 2,246 2,246 . . 99.5 92,933
THAILAND 106,447 2,381 2,381 2,381 2,466 491,313 99.9 51,755
DRC 451,956 3,249 3,249 0 66 6,412 48.0 150,164
ZAMBIA 29,350 4,718 4,718 4,718 73 7,082 80.9 15,356
CONGO, REP. OF 46,457 8,132 8,132 7,075 83 11,091 98.3 23,377
CAMEROON 375,415 11,623 9,290 3,784 106 17,724 95.9 149,355
BURUNDI 57,469 10,897 10,897 10,897 6 100 100.0 23,832
ETHIOPIA 791,631 40,131 11,973 11,973 31 16,205 89.7 271,670
INDIA 197,851 14,019 14,019 14,019 3,298 2,225,638 44.4 112,775
RWANDA 156,065 18,620 17,011 17,011 7 . 99.6 74,486
KENYA 451,099 26,311 26,311 26,311 221 65,250 100.0 175,005
UGANDA 940,835 34,023 34,023 34,023 60 7,390 99.9 352,022
EGYPT 213,530 101,464 36,533 19,099 534 141,948 66.2 102,844
SUDAN 421,466 65,922 36,691 31,327 8 100 99.2 177,717
MALAYSIA 92,263 72,888 72,888 72,888 2,091 363,249 100.0 72,888
IRAN 979,435 87,998 87,998 87,998 69 3,242 20.0 430,942
IRAQ 261,888 142,916 98,777 3,875 76 2,661 99.5 143,650
LEBANON 1,012,969 427,582 118,196 118,196 123 6,246 100.0 427,645
JORDAN 685,197 259,470 192,676 110,013 84 10,377 99.7 314,944
PAKISTAN 1,352,560 426,257 314,307 29,786 159 47,296 99.9 618,333
TURKEY 2,869,421 1,678,813 1,078,782 302,124 1,858 358,473 99.9 1,828,854
ALGERIA 94,232 ? ? ? 387 52,370 0.0 ?
CHINA 317,225 ? ? ? 14,646 3,387,069 0.0 ?
ECUADOR 102,848 ? ? ? 258 43,515 0.0 ?
RUSSIA 228,990 ? ? ? 3,264 749,827 0.0 ?
SOUTH AFRICA 91,043 ? ? ? 1,988 477,685 0.0 ?
VENEZUELA 172,053 ? ? ? 486 94,063 4.8 ?
ARE REFUGEES LOCATED NEAR URBAN JOB OPPORTUNITIES?
38

QUALITATIVE COMMENTS
COUNTRY QUALITATIVE COMMENT
ALGERIAMost are in camps in the isolated areas along the border with Western Sahara.
There only about 7,000 urban refugees, which are in the largest city, Algiers.
CHINALocations are difficult to ascertain; refugees appear to be scattered
throughout the country.
ECUADOR
About 60% are located in urban areas. The largest concentration of urban
refugees is in Quito, a major city. The second largest concentration is in
Guayaquil, the largest city.
RUSSIA
The number or urban refugees in Russia is unknown, but some are located in
the largest city, Moscow, and other major cities including St. Petersburg and
many others.
SOUTH AFRICA
UNHCR considers all of the 91,043 refugees to be urban. Their specific
locations are not as clear, but at least some are located in the largest city,
Johannesburg, and other major cities such as Cape Town, Port Elizabeth, East
London, Durban, and Pretoria.
VENEZUELA
Locations are difficult to ascertain; refugees appear to be scattered
throughout the country.
39
ARE REFUGEES LOCATED NEAR URBAN JOB OPPORTUNITIES?

ENDNOTES
1. Figures at a Glance (2017). UNHCR. http://www.unhcr.org/figures-at-a-glance.html.; Devictor, X. & Do, Q. (2016).
How Many Years Have Refugees Been in Exile? World Bank Policy Research Working Paper, Working Paper
Series, 7810. http://dx.doi.org/10.1596/1813-9450-7810.
2. The calculation for the proportion of refugees in developing countries was made using World Bank income
classifications for low- and middle-income countries and the most recent data on refugee locations from UNHCR.
UNHCR Statistical Yearbook 2016 (2017). UNHCR. http://www.unhcr.org/en-us/statistics/country/5a8ee0387/unhcr-
statistical-yearbook-2016-16th-edition.html.
3. Huang, C., Charles, S., Post, L., & Gough, K. (2018). Tackling the Realities of Protracted Displacement: Case Studies
on What’s Working and Where We Can Do Better. The Center for Global Development and the International
Rescue Committee. https://www.cgdev.org/sites/default/files/tackling-realities-protracted-displacement-case-
studies-whats-working.pdf.; Devictor, X. (2017) Forcibly Displaced: Toward a Development Approach Supporting
Refugees, the Internally Displaced, and Their Hosts. World Bank. https://openknowledge.worldbank.org/bitstream/
handle/10986/25016/Forcibly percent20Displaced_Overview_Web.pdf?sequence=6&isAllowed=y.
4. Huang, C. (2017). Global Business and Refugee Crises: A Framework for Sustainable Engagement. The Tent
Foundation and the Center for Global Development. https://www.cgdev.org/sites/default/files/global-business-
and-refugee-crises.pdf.
5. The interactive map can be viewed here: http://bit.ly/2sPrugS.
6. Numbers of refugees are based on the 2016 UNHCR Statistical Yearbook and include all registered refugees
and people in refugee-like situations. We consider working-age refugees to be between the ages of 18 and 59.
Different definitions are sometimes used (such as 15 to 64), but 18 to 59 is the closest approximation to working-
age that the available data allow. UNHCR Statistical Yearbook 2016 (2017). UNHCR.
7. Data on the number of MNCs with OECD home countries and people employed by them is based on the ‘Outward
activity of multinationals by country of location’ from OECD.stat. OECD.stat (2014). OECD. https://stats.oecd.org/.
8. Global Trends: Forced Displacement in 2016 (2017). UNHCR. http://www.unhcr.org/en-us/statistics/
unhcrstats/5943e8a34/global-trends-forced-displacement-2016.html.
9. Zetter, R. & Ruaudel, H. (2016). Refugees’ Right to Work and Access to Labor Markets – An Assessment: Part
II: Country Cases (Preliminary). Global Knowledge Partnership on Migration and Development (KNOMAD).
http://www.knomad.org/sites/default/files/2017-12/KNOMAD percent20Study percent201- percent20Part
percent20II- percent20Refugees percent20Right percent20to percent20Work percent20- percent20An
percent20Assessment.pdf.
10. Barbelet, V. (2017). Livelihood strategies of Central African refugees in Cameroon. Humanitarian Policy
Group. https://www.odi.org/sites/odi.org.uk/files/resource-documents/11371.pdf.; Global Refugee Work Rights
Report (2014). Asylum Access and the Refugee Work Rights Coalition. http://asylumaccess.org/wp-content/
uploads/2014/09/FINAL_Global-Refugee-Work-Rights-Report-2014_Interactive.pdf.
ARE REFUGEES LOCATED NEAR URBAN JOB OPPORTUNITIES?
40

11. Huang, C. (2017). Global Business and Refugee Crises: A Framework for Sustainable Engagement.
12. Devictor, X. & Do, Q. (2016). How Many Years Have Refugees Been in Exile?
13. Bellamy, C., Haysom, S., Wake, C., & Barbelet, V. (2017). The lives and livelihoods of Syrian refugees A study of
refugee perspectives and their institutional environment in Turkey and Jordan. Humanitarian Policy Group. https://
www.odi.org/sites/odi.org.uk/files/resource-documents/11343.pdf.
14. Huang, C., Charles, S., Post, L., & Gough, K. (2018). Tackling the Realities of Protracted Displacement: Case Studies
on What’s Working and Where We Can Do Better.
15. Mobilizing the Private Sector: Tent Partnership for Refugees (2018). The Tent Foundation. https://www.tent.org/
partners/.
16. Huang, C. (2017). Global Business and Refugee Crises: A Framework for Sustainable Engagement. The calculation
for the proportion of refugees in developing countries was made using World Bank income classifications for
low- and middle-income countries and the most recent data on refugee locations from UNHCR. UNHCR Statistical
Yearbook 2016 (2017). UNHCR.
17. Huang, C. (2017). Global Business and Refugee Crises: A Framework for Sustainable Engagement.
18. Post, L., Ward, M., & Gray, A. (2017). In Search of Work: Creating Jobs for Syrian Refugees: A Case Study of the
Jordan Compact. International Rescue Committee. https://www.rescue.org/sites/default/files/document/1343/
insearchofworkweb.pdf.
19. Global Trends: Forced Displacement in 2016 (2017). UNHCR.
20. Different definitions are sometimes used for “working age” (such as 15 to 64), but 18 to 59 is the closest
approximation to working age that the available data allow. UNHCR Statistical Yearbook 2016 (2017). UNHCR.
21. The decision to use this benchmark is based on the World Urbanization Prospects report and is described in detail
in the “refugee-MNC nexus” section. World Urbanization Prospects: The 2014 Revision (2015). UNDESA, Population
Division. https://esa.un.org/unpd/wup/Publications/Files/WUP2014-Report.pdf.
22. The 31 countries were selected because they have at least 25,000 registered refugees and people in refugee-
like situations and they have location data for at least 44 percent of the refugees in the country. The 23 countries
had at least 90 percent location data available. For a detailed description of the selection methodology, see the
“Estimating overlap between refugees and major urban areas” section.
23. This 48 percent figure was calculated by first determining the population-weighted average working age proportion
among all refugee locations in each the country, and then multiplying these average proportions by the total
number of refugees in each country. This gave us the estimated number of working-age refugees in each country.
We added these numbers together to find the total number of working-age refugees for all 23 countries, and
divided it by the total number of refugees in all 23 countries.
41
ARE REFUGEES LOCATED NEAR URBAN JOB OPPORTUNITIES?

24. Zetter, R. & Ruaudel, H. (2016). Refugees’ Right to Work and Access to Labor Markets – An Assessment: Part II:
Country Cases (Preliminary).; Barbelet, V. (2017). Livelihood strategies of Central African refugees in Cameroon.;
Promise to Practice: Following through on commitments to support the future of Syria and the region (2018).
Catholic Agency for Overseas Development, ActionAid, Human Appeal, Danish Refugee Council, Norwegian
Refugee Council, CARE, Caritas, Christian Aid, Mercy Corps, Action Against Hunger USA, People in Need,
Médecins du Monde, Oxfam, International Rescue Committee, Save the Children, World Vision, Dorcas Aid
International, Finn Church Aid, Bibliothèques Sans Frontières, Lebanon Humanitarian INGO Forum, & Jordan INGO
Forum. https://reliefweb.int/report/syrian-arab-republic/promise-practice-following-through-commitments-support-
future-syria-and.
25. Global Refugee Work Rights Report (2014). Asylum Access.
26. Matthew, B. (2018). ILO backs Syrian refugee initiative in Turkey. Apparel Insider. https://apparelinsider.com/ilo-
backs-syrian-refugee-initiative-turkey/.
27. Refugee Settlements to be Transformed into Digital Communities for Long-term Economic Growth: Mastercard
and the U.S. Agency for International Development Announce Powerful New Public-Private Coalition (2018).
Mastercard Press Releases.
28. The 37 countries are Afghanistan, Algeria, Bangladesh, Burkina Faso, Burundi, Cameroon, Chad, China, the
Republic of Congo, the DRC, Ecuador, Egypt, Ethiopia, India, Iran, Iraq, Jordan, Kenya, Lebanon, Malaysia,
Mauritania, Nepal, Niger, Pakistan, Russia, Rwanda, Serbia, South Africa, South Sudan, Sudan, Thailand, Turkey,
Uganda, Tanzania, Venezuela, Yemen, and Zambia. UNHCR (2017). UNHCR Statistical Yearbook 2016.
29. 56 percent was a natural cutoff: the next largest amount of missing data was 88 percent, for Bangladesh. South
Africa, Russia, Ecuador, China, and Algeria were excluded, all of which were missing at least 95 percent of the
data. Iran and Bangladesh would have also been excluded by this criterion, but they had additional data available
through the UNHCR map portal and the Humanitarian Data Exchange, respectively. Map Portal (2018). UNHCR.
http://maps.unhcr.org/en/search.; The Humanitarian Data Exchange (2018). https://data.humdata.org/.; Refworld
(2018). UNHCR. http://www.refworld.org/type,MAP,,,,,0.html.
30. The requirement of having at least 90 percent of data available was a natural cutoff: the next largest amount of
data available was 81 percent (for Zambia). The rest of the countries included had between 44 percent and 66
percent. The list of countries for the former group can be seen in table 1. This list for the latter group can be seen in
table 2.
31. For Bangladesh, because there has been such a large recent influx of refugees, we use data from 2018 rather
than 2016. At the end of 2016 there were 276,207 registered refugees in the country. Since then there has been
an influx of at least 688,000 refugees (as of February 2018), putting the total at about 964,207. Prior to the influx,
there were only 68 registered urban refugees. The vast majority of the newly arrived refugees are around Cox’s
Bazaar. Thus, the urban refugees in the area should account for virtually all of the registered urban refugees in
ARE REFUGEES LOCATED NEAR URBAN JOB OPPORTUNITIES?
42

the country. Counting refugees residing within the actual city of Cox’s Bazaar as urban, we estimate that there are
7,823 urban refugees in the country, of which (if we use the weighted average working-age percentage for the
country) 0.434 are of working-age, resulting in a total of 3,397 urban working-age refugees. By this method we were
able to account for the precise locations of 52 percent of the refugees in the country. To calculate estimates for
Iran we used a UNHCR map from 2014 of the Afghan refugee situation. The graphical representation allowed us to
make rough, conservative estimates using the lower end of the range for each province. The number of refugees
in the country remained more or less constant from 2014 to 2016, declining from 982,027 in 2014 to 979,435 in
2016. There was no precise urban/rural data for Iran, so, to maintain a highly conservative estimate, we made the
assumption that only refugees in Tehran, which amounted to 20 percent of the total refugee population, were
urban. We applied the weighted average working-age percentage for the refugees in the country for which we have
data. UNHCR Population Statistics (2017). UNHCR. http://popstats.unhcr.org/en/overview.; Rohingya Displacement
(2018). Humanitarian Data Exchange. https://data.humdata.org/event/rohingya-displacement.; Bangladesh Fact
Sheet: March 2017 (2017). UNHCR. http://www.unhcr.org/50001ae09.pdf.; Regional Overview: Afghan Returnees
and Refugees - January 2014 (2015). UNHCR. http://maps.unhcr.org/en/view?id=3014.; UNHCR Population Statistics
(2017). UNHCR.
32. The number of working-age refugees was calculated using the working-age percentage for each location-specific
group of refugees. If no percentage was available for a given group, the population-weighted average of the
other refugee locations in the country was applied. This was done for a small minority of locations: for 29 of the 31
countries (with Iran and Bangladesh excluded), 90 percent of the refugees for which there was specific location
information also had demographic information. For Bangladesh and Iran, for which most of the data came from non-
UNHCR sources, only 9 percent of the refugees included in the analysis had demographic information.
33. Sources, Methods, and Data Considerations, In UNHCR Statistical Yearbook 2014 (2015). UNHCR. http://www.unhcr.
org/56655f4be.html.
34. Ibid.
35. UNHCR Handbook for Registration: Procedures and Standards for Registration, Population Data Management and
Documentation (2003). UNHCR. http://www.unhcr.org/en-us/publications/operations/4a278ea1d/unhcr-handbook-
registration-provisional-release-september-2003-complete.html.
36. UNHCR Statistical Online Population Database: Sources, Methods and Data Considerations (2013). UNHCR. http://
www.unhcr.org/afr/statistics/country/45c06c662/unhcr-statistical-online-population-database-sources-methods-
data-considerations.html.
37. The number of registered refugees compared to people in refugee-like situations in each country is listed in
the UNHCR 2016 Statistical Yearbook. For the 23-country sample, there are only 79,148 people in refugee-like
situations, 0.7 percent of the total number of refugees and people in refugee-like situations. For the 31-country
sample, there are 355,148, amounting to 2.9 percent. UNHCR Statistical Yearbook 2016 (2017). UNHCR.
38. Sources, Methods, and Data Considerations, In UNHCR Statistical Yearbook 2014 (2015). UNHCR.
43
ARE REFUGEES LOCATED NEAR URBAN JOB OPPORTUNITIES?

39. Ibid.
40. To give a few examples of how UNHCR collects data and how the registration and verification process varies,
in some countries UNHCR conducts registration as close as possible to refugee settlements to help ensure
accuracy. In situations where they collect location data through registration they may not do so close to
settlements but will instead carry out exercises after registration to verify physical presence. In other countries
refugees are in government-run centers and are thus easier to track. So methodology varies across countries,
but UNHCR appears to consistently prioritize keeping information updated and accurate (Based on personal
communications with UNHCR country offices, April 2018).
41. World Urbanization Prospects: The 2014 Revision (2015). UNDESA, Population Division.
42. According to the report, no city in South Sudan had at least 300,000 people. Therefore, based on population
information from the CIA’s World Factbook, we included the country’s largest city, Juba. The World Factbook:
South Sudan. (2018). CIA. https://www.cia.gov/library/publications/the-world-factbook/geos/od.html.
43. The number of working-age refugees was calculated using the working-age percentage for each location-
specific group of refugees. If no percentage was available for a given group, the population-weighted average
of the other refugee locations in the country was applied. This was done for a small minority of locations: for 29
of the 31 countries (with Iran and Bangladesh excluded), 90 percent of the refugees for which there was specific
location information also had demographic information. For Bangladesh and Iran, for which most of the data came
from non-UNHCR sources, only 9 percent of the refugees included in the analysis had demographic information.
44. Duranton, G. (2015). Growing through cities in developing countries. The World Bank Research Observer, 30 (1),
39-73. https://academic.oup.com/wbro/article/30/1/39/1875556.
45. Florida, R., Mellander, C., & Gulden, T. (2012). Global metropolis: assessing economic activity in urban centers
based on nighttime satellite images. The Professional Geographer, 64 (2), 178-187. https://www.tandfonline.com/
doi/full/10.1080/00330124.2011.583590.
46. Duranton, G. (2015). Growing through cities in developing countries.
47. Sanchez-Reaza, J. (2016). Looking at urbanization through a jobs lens. World Bank Jobs and Development
Blog. http://blogs.worldbank.org/jobs/looking-urbanization-through-jobs-lens.; Florida, R. (2014). Why Big Cities
Matter in the Developing World. Citylab. https://www.citylab.com/life/2014/01/why-big-cities-matter-developing-
world/6025/.
48. Berube, A., Trujillo, J. L., Parilla, J. (2015). Global Metro Monitor: An Uncertain Recovery. Brookings. https://www.
brookings.edu/research/global-metro-monitor/.; Florida, R. (2014). Why Big Cities Matter in the Developing World.
49. Zhu, T. J., Larrey, Y. A., Santos, V. (2015). What do Multinational Firms Want from Cities? Insights from Investment
Promotion Intermediaries and Location Advisory Consultants. Competitive Cities for Jobs and Growth:
Companion Paper 5. World Bank. https://openknowledge.worldbank.org/bitstream/handle/10986/23571/
What0do0multin0ms0want0from0cities0.pdf;sequence=1.
ARE REFUGEES LOCATED NEAR URBAN JOB OPPORTUNITIES?
44

50. Bobonis, G. J., & Shatz, H. J. (2007). Agglomeration, adjustment, and state policies in the location of foreign
direct investment in the United States. The Review of Economics and Statistics, 89 (1), 30-43. https://www.
mitpressjournals.org/doi/abs/10.1162/rest.89.1.30.
51. Nunnenkamp, P., & Mukim, M. (2012). The clustering of FDI in India: the importance of peer effects. Applied
Economics Letters, 19 (8), 749-753. https://www.tandfonline.com/doi/abs/10.1080/13504851.2011.602007.
52. Yin, F., Ye, M., & Xu, L. (2014). Location Determinants of Foreign Direct Investment in Services Evidence
from Chinese Provincial-Level Data. LSE Asia Research Centre Working Papers. http://www.lse.ac.uk/
asiaResearchCentre/_files/ARCWP64-YinYeXu.pdf.
53. Bobonis, G. J., & Shatz, H. J. (2007). Agglomeration, adjustment, and state policies in the location of foreign direct
investment in the United States.
54. Alfaro, L., & Chen, M. X. (2016). Location fundamentals, agglomeration economies, and the geography
of multinational firms. Harvard Business School Working Paper, No. 17-014. https://dash.harvard.edu/
handle/1/27864355/
55. Belderbos, R., Du, H., & Goerzen, A. (2015). Global city connectivity and the establishment of MNC regional
headquarters. Paper session 3: “Global cities and MNE Location Choices”. In Conference on Location Decisions of
Multinational Enterprises: Market, Cities or Clusters. http://kraksfondbyforskning.dk/wp-content/uploads/2015/05/
Paper-Belderbos-Du-and-Goerzen.pdf.
56. Data on the number of MNCs and people employed by MNCs with OECD home countries is based on the ‘Outward
activity of multinationals by country of location’ from OECD.stat. OECD.stat (2014). OECD.
57. Huang, C. (2017). Global Business and Refugee Crises: A Framework for Sustainable Engagement.
58. Ibid.
59. UNHCR Statistical Yearbook 2016 (2017). UNHCR.
60. Six OECD countries did not report data for the number of MNCs or the number of employees: Australia, Canada,
Japan, Korea, Switzerland, and Turkey. Among the countries that did report, for some partner-declaring country
combinations, data was confidential and therefore not reported—particularly in cases where there were very few
MNCs. In a few cases the data was missing without explanation. We count confidential and missing data as zero.
Thus, the data for total numbers of MNCs and employment are underestimates. Where all data for a given country is
missing or confidential (i.e. for South Sudan and Rwanda on one variable), we display it as missing in the tables and
as zero in the interactive map.
61. Bangladesh Population 2018 (2018). World Population Review. http://worldpopulationreview.com/countries/
bangladesh-population/.
62. Ecuador: UNHCR Global Appeal 2012-2013 (2013). UNHCR. http://www.unhcr.org/4ec2310bb.pdf.; Ecuador Global
Focus (2018). UNHCR http://reporting.unhcr.org/node/2543.
45
ARE REFUGEES LOCATED NEAR URBAN JOB OPPORTUNITIES?

63. Ecuador: UNHCR Global Appeal 2012-2013 (2013). UNHCR.
64. UNHCR’s Work in Urban Areas: Provinces of Guayas and Azuay (2013). UNHCR. http://www.acnur.org/fileadmin/
scripts/doc.php?file=fileadmin/Documentos/RefugiadosAmericas/Ecuador/2012/UNHCRs_work_in_Guayas_and_
Azuay_Feb2012.
65. Ecuador Fact Sheet, February 2017 (2017). UNHCR. http://reporting.unhcr.org/sites/default/files/UNHCR
percent20Ecuador percent20Factsheet percent20- percent20February percent202017.pdf.
66. UNHCR’s Work in the Province of Sucumbios (2010). UNHCR. http://www.acnur.org/fileadmin/scripts/doc.
php?file=fileadmin/Documentos/RefugiadosAmericas/Ecuador/2011/UNHCRs_work_in_the_province_of_
Sucumbios.
67. South Africa Global Focus (2017). UNHCR. http://reporting.unhcr.org/node/2524.
68. Russian Federation Global Focus (2017). UNHCR. http://reporting.unhcr.org/node/2551.
69. Algeria Global Focus (2017). UNHCR. http://reporting.unhcr.org/node/7039.
70. Sing, J. (2007). Vietnamese refugees well settled in China, await citizenship. UNHCR. http://www.unhcr.org/en-us/
news/latest/2007/5/464302994/vietnamese-refugees-well-settled-china-await-citizenship.html.
71. Colombia Global Focus (2017). UNHCR. http://reporting.unhcr.org/node/2542.
72. Zetter, R. & Ruaudel, H. (2016). Refugees’ Right to Work and Access to Labor Markets – An Assessment: Part I:
Synthesis. Global Knowledge Partnership on Migration and Development (KNOMAD). https://www.knomad.org/
sites/default/files/2017-03/KNOMAD percent20Study percent201 percent20Part percent20I- percent20Assessing
percent20Refugees percent27 percent20Rights percent20to percent20Work_final.pdf.
73. Farrell, D. (2004). The hidden dangers of the informal economy. McKinsey quarterly, (3), 26-37.; Zetter, R. &
Ruaudel, H. (2016). Refugees’ Right to Work and Access to Labor Markets – An Assessment: Part II: Country Cases
(Preliminary).
74. Umlas, E. (2011). Cash in Hand: Urban Refugees, the Right to Work and UNHCRs Advocacy Activities. UNHCR.
http://www.unhcr.org/research/evalreports/4dc7f82c9/cash-hand-urban-refugees-right-work-unhcrs-advocacy-
activities-elizabeth.html.
75. Zetter, R. & Ruaudel, H. (2016). Refugees’ Right to Work and Access to Labor Markets – An Assessment: Part I:
Synthesis. Global Knowledge Partnership on Migration and Development (KNOMAD).
76. Global Refugee Work Rights Report (2014). Asylum Access.
77. Jobs Make the Difference: Expanding Economic Opportunities for Syrian Refugees and Host Communities (2017).
UNDP, ILO, & WFP. https://www.jobsmakethedifference.org/full-report.
ARE REFUGEES LOCATED NEAR URBAN JOB OPPORTUNITIES?
46

78. SAP Refugee Code Week 2017 Concludes Under Patronage of Queen Rania Al Abdullah (2017). Mena Herald.
https://www.menaherald.com/en/business/society/sap-refugee-code-week-2017-concludes-under-patronage-
queen-rania-al-abdullah.
79. Hunt, A., Samman, E., & Mansour-Ille, D. (2017). Syrian women refugees in Jordan Opportunity in the gig economy?
ODI. https://www.odi.org/sites/odi.org.uk/files/resource-documents/11742.pdf.
80. New Support for Refugees and Host communities in Jordan and Lebanon Brings Total Concessional Financing to
US $1 Billion (2017). World Bank. http://www.worldbank.org/en/news/press-release/2017/04/21/new-support-for-
refugees-and-host-communities-in-jordan-and-lebanon-brings-total-concessional-financing-to-us-1-billion.
81. Jobs Make the Difference: Expanding Economic Opportunities for Syrian Refugees and Host Communities (2017).
UNDP, ILO, & WFP. ; Ucak, S. (2017). Another Side to the Story: A Market Assessment of Syrian SMEs in Turkey.
Building Markets. http://buildingmarkets.org/sites/default/files/pdm_reports/another_side_to_the_story_a_
market_assessment_of_syrian_smes_in_turkey.pdf.
47
ARE REFUGEES LOCATED NEAR URBAN JOB OPPORTUNITIES?

CGDEV.ORGTENT.ORG