are students reading my feedback? using a feedback analytics capture system to understand how large...
TRANSCRIPT

Australian Conference on Science and Mathematics Education - September 2014
Are students reading my feedback?
Using feedback analytics to understand how large cohorts of
biomedical science students use feedback
Kirsten Zimbardi1,2, Andrew Dekker2, Andrea Bugarcic1,3, Kay Colthorpe1, Prasad Chunduri1, Judit Kibedi1, Lesley Lluka1,
Craig Engstrom4, Peter Worthy5, Phil Long2.1School of Biomedical Sciences, 2UQx, 3Institute for Molecular
Bioscience, 5School of Human Movement Studies, 4School of Chemistry & Molecular Bioscience
The University of Queensland

Australian Conference on Science and Mathematics Education - September 2014
Learning from Feedback
Potent effects on learning gains1
Weakest element of university teaching2-3
Guides on how to give feedback4-5
But how do students use feedback?6
1Hattie (2009), 2Graduate Careers Australia (2012) 3Surridge 2009 4Nicol & MarFarlane Dick (2006), 5Hattie & Timperley (2007) 6Jonsson (2012), Boud & Molloy (2013), 8Sadler (2013), 9Furnborough & Truman
Anecdotes on students NOT collecting feedback7
Students struggle to interpret and transfer feedback8-9

Australian Conference on Science and Mathematics Education - September 2014
Electronic feedbackefficient and accessible
Many systems for online electronic feedback
Increasing availability of tools for audio feedback
Students like audio feedback10-13
but how do they use it…10Rhind et al. (2013), 11Ice et al. (2007), 12Still (2006), 13Lunt and Curran (2010)

Australian Conference on Science and Mathematics Education - September 2014
Learning analytics
Arose from educational technology and educational data mining14
Study of learning behavioursin digital footprints ieclickstreams15
14Haythornthwaite et al. 2013), 15Long & Siemens (2011) , 16Warnakulasooriya et al. (2007), 17Oxman & Wong (2014)
Used to evaluate and improve adaptive online quizzes and cyber-tutors16-17
Australian Conference on Science and Mathematics Education - September 2014
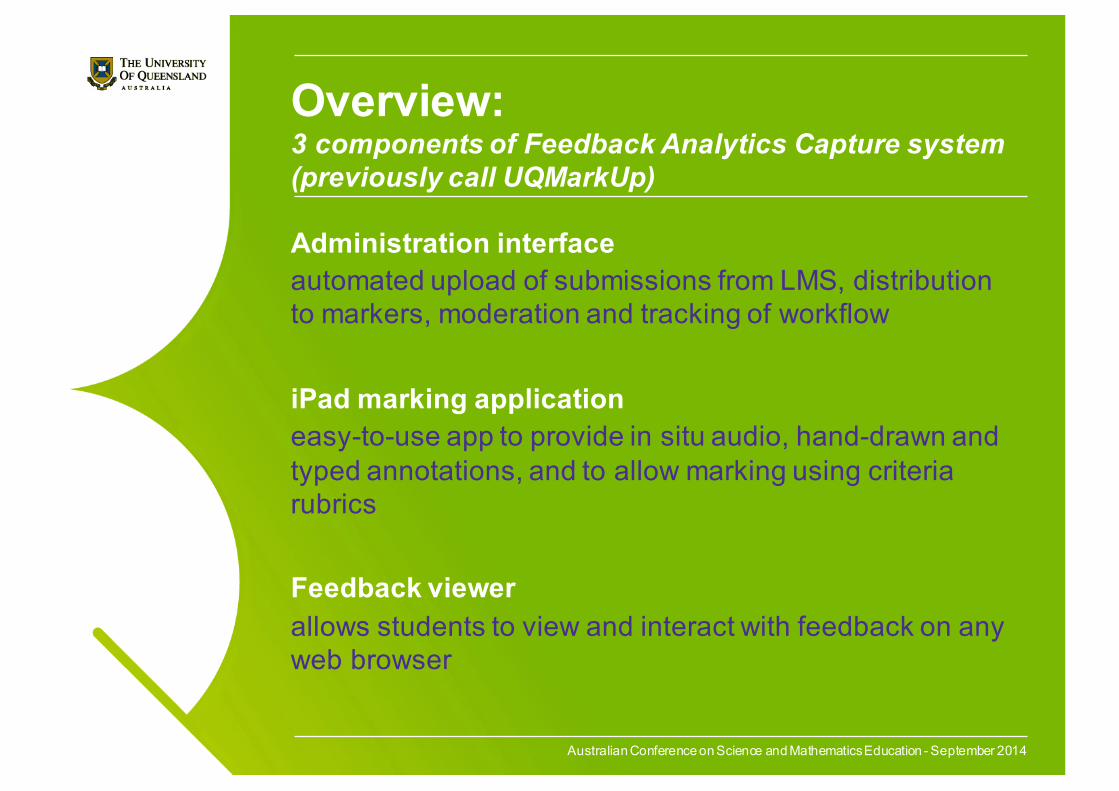
Overview:3 components of Feedback Analytics Capture system (previously call UQMarkUp)
Administration interfaceautomated upload of submissions from LMS, distribution to markers, moderation and tracking of workflow
iPad marking applicationeasy-to-use app to provide in situ audio, hand-drawn and typed annotations, and to allow marking using criteria rubrics
Feedback viewerallows students to view and interact with feedback on any web browser

Australian Conference on Science and Mathematics Education - September 2014
Administration Interface:Organising the assessment & marking

Australian Conference on Science and Mathematics Education - September 2014
iPad marking app:providing in-situ multi-modal feedback

Australian Conference on Science and Mathematics Education - September 2014
Feedback viewer: capturing student clickstreams

Australian Conference on Science and Mathematics Education - September 2014
Current dashboard visualisations of feedback use
How a student interacted with each audio annotation within a marked document
How long a student viewed each page in their marked document during a 17-minute viewing.

Australian Conference on Science and Mathematics Education - September 2014
Study Methods
Laboratory reports from biomedical science courses at 1st and 2nd year (2 semesters each)
Level 1: 1,781 students, 5,371 Reports, 73,638 items of feedback
Level 2: 389 students, 613 Reports, 22,056 items of feedback
Clickstream data from feedback viewer

Australian Conference on Science and Mathematics Education - September 2014
Clickstream logs

Australian Conference on Science and Mathematics Education - September 2014
The majority of students are opening their feedback
Level 2
Pro
port
ion
of r
epor
ts (
%)
Report
1
Report
20
20
40
60
80
100Report 1Report 2
Level 1
Pro
port
ion
of r
epor
ts (
%)
Report
1
Report
2
Report
3
Report
40
20
40
60
80
100Report 1Report 2Report 3Report 4

Australian Conference on Science and Mathematics Education - September 2014
How long do students keep their feedback open?
Level 1
Ope
n du
ratio
n (h
ours
)
Report
1
Report
2
Report
3
Report
40
5
10
15
20
25Report 1Report 2Report 3Report 4
Level 2
Report
1
Report
20
5
10
15
20
25
Ope
n du
ratio
n (h
ours
) Report 1Report 2

Australian Conference on Science and Mathematics Education - September 2014
When do students access feedback?
Level 1Number of students opening feedback per day
Average duration (hours) feedback is open per day
Class Due date
Class Due date
Data from a subset of students in a single practical group (n=98)

Australian Conference on Science and Mathematics Education - September 2014
When do students access feedback?Release vs class vs next due date
Class Due date
Class Due date
Level 2Number of students opening feedback per day
Average duration (hours) feedback is open per day
Data from a subset of students in a single practical group (n=46)

Australian Conference on Science and Mathematics Education - September 2014
Conclusions
More students are opening their feedback, for much longer than we expected
Students open feedback briefly when released, during related class
Students open feedback much longer as the due date of the next (related) assessment item
Context-dependent variations year level?assessment difficulty?other avenues for feedback?

Australian Conference on Science and Mathematics Education - September 2014
Acknowledgements & contact details
Funding
School of Biomedical SciencesUQ Faculty of Science
Teaching and Learning Grant
Thank you to our students and tutors
Kirsten [email protected]
Feedback Analytics Capture system walkthrough: http://www.transformingassessment.com/events_4_september_2013.php
Current analysis: http://rpubs.com/kirstenz/31918