are the china-related stock markets segmented with both world and regional stock markets?
TRANSCRIPT
Int. Fin. Markets, Inst. and Money 17 (2007) 277–290
Are the China-related stock markets segmentedwith both world and regional stock markets?
Yuenan Wang ∗, Amalia Di IorioSchool of Economics, Finance and Marketing, RMIT Business, GPO Box 2476V, Melbourne, Vic. 3001, Australia
Received 7 July 2005; accepted 12 December 2005Available online 18 January 2006
Abstract
Implementing the Capital Asset Pricing Model framework, this study investigates the integration of threeChina-related stock markets, namely, the A-, B- and H-share markets, with both the Hong Kong stock marketand the world market. An analysis of market segmentation versus integration using the Jorion and Schwartzmodel suggests that the A-share market was a segmented market during the period 1995–2004. However,evidence of a higher-level integration between the A- and B-share markets, and the A-share and Hong Kongstock markets is found in the sub-period tests. The hypothesis that the B- and H-share markets are becomingincreasingly integrated with the world stock market is not supported.© 2005 Elsevier B.V. All rights reserved.
JEL classification: C33; G12; G15
Keywords: Market segmentation; CAPM; Chinese stock market; Hong Kong Stock Market; A, B and H shares
1. Introduction
The financial deregulation process, beginning with the relaxation of controls on capital move-ments and followed by the reduction of exchange controls, has led many to argue that stockmarkets across the world are becoming increasingly integrated (see, for example, Grundfest,1990). In turn, the significant cross-border investment activity that has resulted as a consequenceof these liberalization measures has contributed considerably to the progress of market integra-tion, and the benefit to investors is obvious. Specifically, investors benefit from internationaldiversification because stock price changes in different markets are imperfectly correlated and
∗ Corresponding author. Tel.: +61 3 99251674.E-mail address: [email protected] (Y. Wang).
1042-4431/$ – see front matter © 2005 Elsevier B.V. All rights reserved.doi:10.1016/j.intfin.2005.12.001
278 Y. Wang, A.D. Iorio / Int. Fin. Markets, Inst. and Money 17 (2007) 277–290
thus overall portfolio risk exposure can be reduced by holding securities from a variety of firmsin different countries (see, for example, Grubel, 1968; Sarkar and Li, 2002). Investors can alsobenefit from assembling a portfolio where the components are priced incorrectly relative to oneanother (see, for example, McDondald, 1973; Stulz, 1981). However, investment barriers suchas ownership restrictions (see, for example, Eun and Janakiramanan, 1986) differential tax rates(see, for example, Black, 1974; Stapleton and Subrahmanyam, 1977) lack of sufficient informa-tion (see, for example, Adler and Dumas, 1975; Sjoo and Zhang, 2000) and market illiquidity(see, for example, Bekaert, 1995; Bailey and Chung, 1999), are widely believed to hamper theprocess of integration. Consequently, a persistent issue in the field of international finance is theextent to which international financial markets are integrated.
The analysis of market integration reported in the literature has been undertaken using severaldifferent empirical frameworks although many studies have been conducted based on an assetpricing model or pricing kernel. The general hypothesis of this type of analysis is that assets, whichexhibit related risk characteristics should yield similar returns. For example, studies by Solnik(1974), Stehle (1977), and Jorion and Schwartz (1986) each examine the risk–return relationshipbetween various stock markets in the framework of an equilibrium international asset pricingmodel. These studies, however, test the polar case of integration or segmentation. Others, suchas Errunza and Losq (1985, 1992), and Hietala (1989) examine the international capital marketequilibrium under partial segmentation and argue that the required return on an ineligible stock,which cannot be held by some investors due to government restrictions, is different from whatthe standard CAPM suggests. Extending the investigation of the issue of market integration evenfurther, Bekaert and Harvey (1995), Rockinger and Urga (2001), and Vaihekoski and Nummelin(2001) explore the time-varying integration properties of a number of stock markets. Moreover,Cho et al. (1986), Gultekin et al. (1989), and Mittoo (1992) provide evidence of market integrationby using the arbitrage pricing model.
One market that has recently stimulated some interest with regard to the question of integra-tion is the Chinese stock market. Indeed, the Chinese stock market has a history of no more than15 years and the government has been relatively cautious in opening it to foreign investment.The Chinese market has two classes of shares—A- and B-shares. The A-shares were initiallydesignated exclusively for domestic investors, while the B-shares were initially designated exclu-sively for foreign investors. A further class of Chinese shares, namely H-shares, are issued bysome mainland enterprises on the Hong Kong stock market and trade in HK dollars. Interestingly,although mainland enterprises are allowed to issue two classes of shares in China-related stockmarkets, the shares are usually observed to trade at significantly different prices.1 Ma (1996), Su(1999), and Fung et al. (2000) investigate the price difference for the stocks dual-listed on theChinese A- and B-share markets and conclude that the same assets are priced differently becausethe two markets are segmented. Considering the current barriers that hinder foreign investorsinvesting in A-shares (the largest Chinese share market), it would be reasonable to conclude thatthe A-share market is probably segmented from other world stock markets while the B- andH-share markets (both considerably smaller than the A-share market) are relatively integrated.However, recent changes, such as the Chinese government’s decision to open the B-share mar-ket to domestic investors in February 2001, could lead some to argue that the A-share marketis becoming increasingly integrated with the B-share market. Interestingly, prices of A-sharesplunged more than 30% from June 2001 to the end of 2003, and the price gap between A-, B- and
1 A listed company can issue shares on either the A- and B-share markets, or the A- and H-share markets.
Y. Wang, A.D. Iorio / Int. Fin. Markets, Inst. and Money 17 (2007) 277–290 279
H-shares narrowed considerably during this period. Notably, some studies reported in the currentliterature, such as Groenewold et al., (2004), and Hatemi-J and Roca (2004) find modest growthin the interrelationship between mainland stock market and the Hong Kong and Taiwan stockmarket after the Asian financial crisis. However, Yeh and Lee (2000) and Wang and Jiang (2004)find little evidence that other Asian markets have great influences on the A-share market.
Hence, although the general belief may be that the Chinese stock market is largely segmented,the empirical findings are mixed and the degree to which the market is in fact segmented orintegrated remains unclear. Thus, this analysis employs the Jorion and Schwartz (1986) model totest the market integration versus segmentation hypothesis in three China-related stock markets,that is, the A-share market, the B- and H-share market. The results of our analysis show thatdomestic factors are significantly priced at the 1% level for A-shares in an examination of theintegration between the A- and B-share markets, the A-share and the Hong Kong stock markets.This result supports the hypothesis that the A-share market is segmented from those two markets.However, sub-period tests imply that the A-share market has become increasingly integrated withthe B-share market and the Hong Kong market over time. Finally, the findings of our integrationand segmentation testing of the B- and H-share markets using a world market portfolio areinconclusive since neither integration nor segmentation can be rejected.
The reminder of the paper is organized as follows. Section 2 briefly introduces the practice of theChinese stock market integration with the world market in the past 10 years. Data and methodologyare reported in Section 3. Section 4 discusses the results and a conclusion is presented in Section5.
2. The internationalization practice of Chinese securities
Since the establishment of the Shanghai Stock Exchange and the Shenzhen Stock Exchange in1991, a number of stocks, known as A-shares, have been listed. A-shares are denominated in RMBand were, until recently, available only for domestic purchase. Notably, the A-share market is themost important investment playground for domestic traders. Over the past few years, the Chinesegovernment has taken steps to boost the A-share market. By the end of 2003, 517.35 billionRMB had been raised and 1263 domestic companies had been listed in this market.2 However,the A-share market is regarded as a rough stock market with distinct characteristics, such as stateintervention and low market transparency (Anderson, 2002).
Once the A-share market was established, the Chinese government began considering thepossibility of making the stock market available to foreign investors although it did not want togive foreigners access to the RMB since the currency was not, and is not, convertible. Hence,the B-share market was created in 1992 with the intention that this tiny market was to becomeChina’s window to the investment world. Interestingly, the establishment of the B-share marketperfectly reflects the mixed feelings of the Chinese government toward the internationalizationof the Chinese stock market. On the one hand, they want to make use of foreign capital but onthe other hand they do not want to affect or shake socialist public ownership. However, since theB-share market proved to be unattractive to foreign investors and the total market capitalizationwas very small, the Chinese government decided to also open it to domestic investors in 2001.This measure was unfortunately unsuccessful and resulted in the B-share market remaining weakwith only a few companies having been listed since 2000.
2 Information source: http://www.csrc.gov.cn/cn/homepage/index.jsp.
280 Y. Wang, A.D. Iorio / Int. Fin. Markets, Inst. and Money 17 (2007) 277–290
In addition to issuing B-shares to foreigners, another important vehicle for introducing Chinesecompanies to the world has been listing mainland companies on foreign stock markets. The twocapital markets considered to be important for Chinese firms are the Hong Kong and the NewYork stock markets.3 Chinese stocks began trading on the New York Stock Exchange in 1992while in 1993 the Chinese government allowed a number of companies to list on the Hong Kongmarket, trading in Hong Kong dollars. By the end of 2002, total capital raised by Chinese ADRsand H-shares had reached about $5 billion and $20 billion, respectively.4 Overseas listings ofChinese companies have gained momentum in recent years and it is expected that China will soonrival Japan as one of the region’s biggest markets for ADRs.5 The great success of Chinese IPO’sin these foreign markets stems from various factors. First, the Hong Kong and New York stockmarkets are better regulated than those in China. Second, the Chinese government imposes strictrestrictions on companies that want to list in foreign markets. For example, the requirements ofcorporate governance and shareholders protection on overseas listed companies are more stringentthan those on domestically listed companies.6 Finally, only China’s large and successful keyenterprises are approved for overseas listing.
Listing domestic companies in foreign stock markets is not, however, a necessary nor sufficientcondition for the integration of the Chinese stock market with the world’s financial sector. Indeed,the process of integration of the Chinese stock market continues to be influenced by the restrictionsimposed by the government on capital flow and currency convertibility although China’s recententry into the World Trade Organization is a significant milestone in the opening of the A-sharemarket to other global markets.7 The GATS has posed great challenges to China’s securitiesregulatory systems, namely, its accounting system and transparency of law and regulations.8
Further, in an attempt to once again attract foreign capital, the Chinese government launched thequalified foreign institutional investors (QFII) policy in 2003 that introduced foreign investors intothe domestic A-share market and the Chinese bond market. Despite the strict criteria outlined inthe QFII policy, 12 foreign investors had been approved by the end of 2003 with a total approvedinvestment quota of 1.7 billion US dollars.9 It is expected that all restrictions to keep foreigninvestors from investing in the A-share market will have been eliminated by the end of 2005 andthe percentage of foreign shares will reach 10% with a total market value of US$ 294.4 billion.10
3. Data and methodology
This study investigates the period extending from January 1994 to December 2004 and employsdata obtained from the Datastream database. First, the data includes the monthly prices and book-to-market values of all individual stocks in the A-, B- and H-share markets. All stocks withnegative book-to-market values are excluded from the sample, as are stocks with no more than 6
3 Other stock markets where Chinese companies have raised capital include the Singaporean Stock Exchange and theLondon Stock Exchange.
4 Currently ADRs are the mainstream instruments for Chinese enterprises to tap into the US stock market.5 Information source: a report in The Standard, 26 July 2004 by Dennis Eng.6 Overseas listing is subject to the further approval of State Council Securities.7 For example, qualified foreign investors are required to keep their principal in China for at least 3 years and the
investment quota needs to be approved by the Chinese Securities Regulatory Commission. For more detailed informationabout those restrictions, please refer to the website of the CSRC and Yeo (2003).
8 For more information about the impact of the WTO on China’s stock market, see Cheong and Yee (2003), pp. 274–279.9 For relevant information, refer to http://www.csrc.gov.cn/cn/homepage/index.jsp and Yeo (2003).
10 See Pei and Qiu (2002).
Y. Wang, A.D. Iorio / Int. Fin. Markets, Inst. and Money 17 (2007) 277–290 281
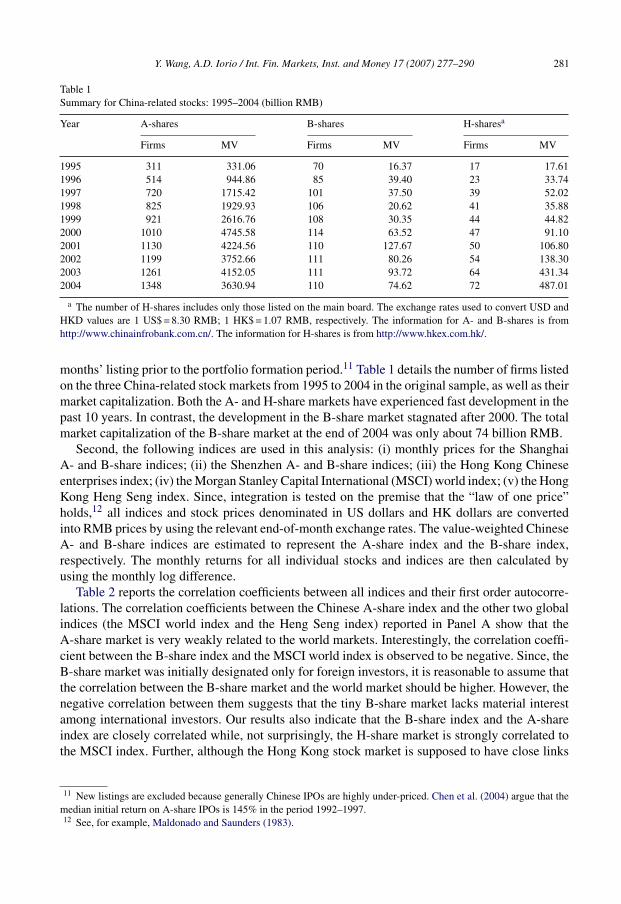
Table 1Summary for China-related stocks: 1995–2004 (billion RMB)
Year A-shares B-shares H-sharesa
Firms MV Firms MV Firms MV
1995 311 331.06 70 16.37 17 17.611996 514 944.86 85 39.40 23 33.741997 720 1715.42 101 37.50 39 52.021998 825 1929.93 106 20.62 41 35.881999 921 2616.76 108 30.35 44 44.822000 1010 4745.58 114 63.52 47 91.102001 1130 4224.56 110 127.67 50 106.802002 1199 3752.66 111 80.26 54 138.302003 1261 4152.05 111 93.72 64 431.342004 1348 3630.94 110 74.62 72 487.01
a The number of H-shares includes only those listed on the main board. The exchange rates used to convert USD andHKD values are 1 US$ = 8.30 RMB; 1 HK$ = 1.07 RMB, respectively. The information for A- and B-shares is fromhttp://www.chinainfrobank.com.cn/. The information for H-shares is from http://www.hkex.com.hk/.
months’ listing prior to the portfolio formation period.11 Table 1 details the number of firms listedon the three China-related stock markets from 1995 to 2004 in the original sample, as well as theirmarket capitalization. Both the A- and H-share markets have experienced fast development in thepast 10 years. In contrast, the development in the B-share market stagnated after 2000. The totalmarket capitalization of the B-share market at the end of 2004 was only about 74 billion RMB.
Second, the following indices are used in this analysis: (i) monthly prices for the ShanghaiA- and B-share indices; (ii) the Shenzhen A- and B-share indices; (iii) the Hong Kong Chineseenterprises index; (iv) the Morgan Stanley Capital International (MSCI) world index; (v) the HongKong Heng Seng index. Since, integration is tested on the premise that the “law of one price”holds,12 all indices and stock prices denominated in US dollars and HK dollars are convertedinto RMB prices by using the relevant end-of-month exchange rates. The value-weighted ChineseA- and B-share indices are estimated to represent the A-share index and the B-share index,respectively. The monthly returns for all individual stocks and indices are then calculated byusing the monthly log difference.
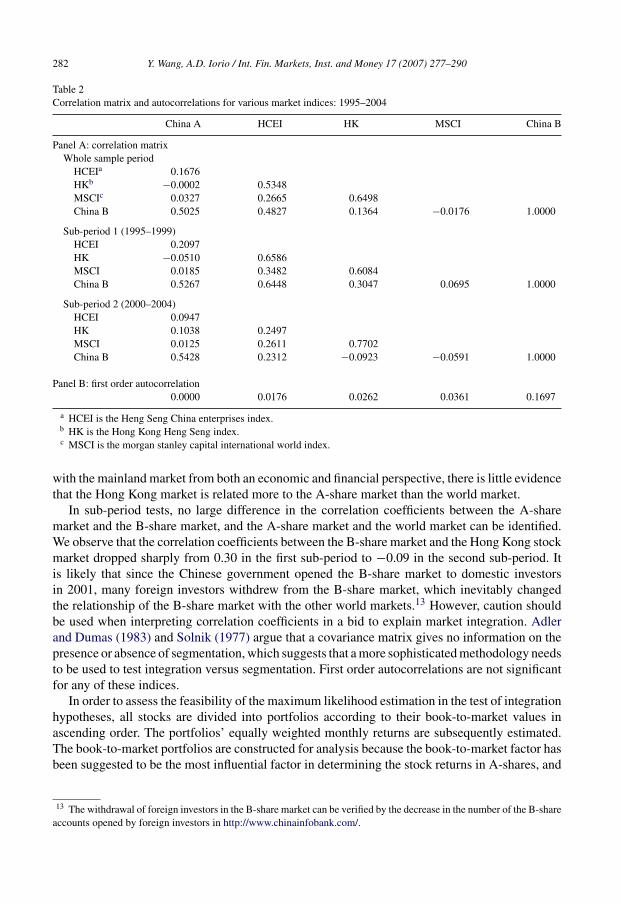
Table 2 reports the correlation coefficients between all indices and their first order autocorre-lations. The correlation coefficients between the Chinese A-share index and the other two globalindices (the MSCI world index and the Heng Seng index) reported in Panel A show that theA-share market is very weakly related to the world markets. Interestingly, the correlation coeffi-cient between the B-share index and the MSCI world index is observed to be negative. Since, theB-share market was initially designated only for foreign investors, it is reasonable to assume thatthe correlation between the B-share market and the world market should be higher. However, thenegative correlation between them suggests that the tiny B-share market lacks material interestamong international investors. Our results also indicate that the B-share index and the A-shareindex are closely correlated while, not surprisingly, the H-share market is strongly correlated tothe MSCI index. Further, although the Hong Kong stock market is supposed to have close links
11 New listings are excluded because generally Chinese IPOs are highly under-priced. Chen et al. (2004) argue that themedian initial return on A-share IPOs is 145% in the period 1992–1997.12 See, for example, Maldonado and Saunders (1983).
282 Y. Wang, A.D. Iorio / Int. Fin. Markets, Inst. and Money 17 (2007) 277–290
Table 2Correlation matrix and autocorrelations for various market indices: 1995–2004
China A HCEI HK MSCI China B
Panel A: correlation matrixWhole sample period
HCEIa 0.1676HKb −0.0002 0.5348MSCIc 0.0327 0.2665 0.6498China B 0.5025 0.4827 0.1364 −0.0176 1.0000
Sub-period 1 (1995–1999)HCEI 0.2097HK −0.0510 0.6586MSCI 0.0185 0.3482 0.6084China B 0.5267 0.6448 0.3047 0.0695 1.0000
Sub-period 2 (2000–2004)HCEI 0.0947HK 0.1038 0.2497MSCI 0.0125 0.2611 0.7702China B 0.5428 0.2312 −0.0923 −0.0591 1.0000
Panel B: first order autocorrelation0.0000 0.0176 0.0262 0.0361 0.1697
a HCEI is the Heng Seng China enterprises index.b HK is the Hong Kong Heng Seng index.c MSCI is the morgan stanley capital international world index.
with the mainland market from both an economic and financial perspective, there is little evidencethat the Hong Kong market is related more to the A-share market than the world market.
In sub-period tests, no large difference in the correlation coefficients between the A-sharemarket and the B-share market, and the A-share market and the world market can be identified.We observe that the correlation coefficients between the B-share market and the Hong Kong stockmarket dropped sharply from 0.30 in the first sub-period to −0.09 in the second sub-period. Itis likely that since the Chinese government opened the B-share market to domestic investorsin 2001, many foreign investors withdrew from the B-share market, which inevitably changedthe relationship of the B-share market with the other world markets.13 However, caution shouldbe used when interpreting correlation coefficients in a bid to explain market integration. Adlerand Dumas (1983) and Solnik (1977) argue that a covariance matrix gives no information on thepresence or absence of segmentation, which suggests that a more sophisticated methodology needsto be used to test integration versus segmentation. First order autocorrelations are not significantfor any of these indices.
In order to assess the feasibility of the maximum likelihood estimation in the test of integrationhypotheses, all stocks are divided into portfolios according to their book-to-market values inascending order. The portfolios’ equally weighted monthly returns are subsequently estimated.The book-to-market portfolios are constructed for analysis because the book-to-market factor hasbeen suggested to be the most influential factor in determining the stock returns in A-shares, and
13 The withdrawal of foreign investors in the B-share market can be verified by the decrease in the number of the B-shareaccounts opened by foreign investors in http://www.chinainfobank.com/.
Y. Wang, A.D. Iorio / Int. Fin. Markets, Inst. and Money 17 (2007) 277–290 283
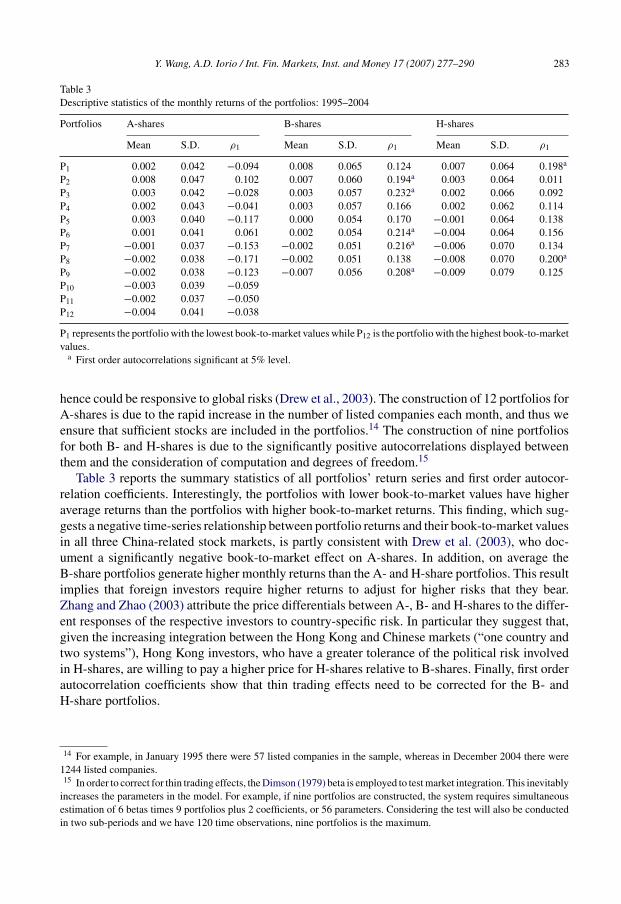
Table 3Descriptive statistics of the monthly returns of the portfolios: 1995–2004
Portfolios A-shares B-shares H-shares
Mean S.D. ρ1 Mean S.D. ρ1 Mean S.D. ρ1
P1 0.002 0.042 −0.094 0.008 0.065 0.124 0.007 0.064 0.198a
P2 0.008 0.047 0.102 0.007 0.060 0.194a 0.003 0.064 0.011P3 0.003 0.042 −0.028 0.003 0.057 0.232a 0.002 0.066 0.092P4 0.002 0.043 −0.041 0.003 0.057 0.166 0.002 0.062 0.114P5 0.003 0.040 −0.117 0.000 0.054 0.170 −0.001 0.064 0.138P6 0.001 0.041 0.061 0.002 0.054 0.214a −0.004 0.064 0.156P7 −0.001 0.037 −0.153 −0.002 0.051 0.216a −0.006 0.070 0.134P8 −0.002 0.038 −0.171 −0.002 0.051 0.138 −0.008 0.070 0.200a
P9 −0.002 0.038 −0.123 −0.007 0.056 0.208a −0.009 0.079 0.125P10 −0.003 0.039 −0.059P11 −0.002 0.037 −0.050P12 −0.004 0.041 −0.038
P1 represents the portfolio with the lowest book-to-market values while P12 is the portfolio with the highest book-to-marketvalues.
a First order autocorrelations significant at 5% level.
hence could be responsive to global risks (Drew et al., 2003). The construction of 12 portfolios forA-shares is due to the rapid increase in the number of listed companies each month, and thus weensure that sufficient stocks are included in the portfolios.14 The construction of nine portfoliosfor both B- and H-shares is due to the significantly positive autocorrelations displayed betweenthem and the consideration of computation and degrees of freedom.15
Table 3 reports the summary statistics of all portfolios’ return series and first order autocor-relation coefficients. Interestingly, the portfolios with lower book-to-market values have higheraverage returns than the portfolios with higher book-to-market returns. This finding, which sug-gests a negative time-series relationship between portfolio returns and their book-to-market valuesin all three China-related stock markets, is partly consistent with Drew et al. (2003), who doc-ument a significantly negative book-to-market effect on A-shares. In addition, on average theB-share portfolios generate higher monthly returns than the A- and H-share portfolios. This resultimplies that foreign investors require higher returns to adjust for higher risks that they bear.Zhang and Zhao (2003) attribute the price differentials between A-, B- and H-shares to the differ-ent responses of the respective investors to country-specific risk. In particular they suggest that,given the increasing integration between the Hong Kong and Chinese markets (“one country andtwo systems”), Hong Kong investors, who have a greater tolerance of the political risk involvedin H-shares, are willing to pay a higher price for H-shares relative to B-shares. Finally, first orderautocorrelation coefficients show that thin trading effects need to be corrected for the B- andH-share portfolios.
14 For example, in January 1995 there were 57 listed companies in the sample, whereas in December 2004 there were1244 listed companies.15 In order to correct for thin trading effects, the Dimson (1979) beta is employed to test market integration. This inevitably
increases the parameters in the model. For example, if nine portfolios are constructed, the system requires simultaneousestimation of 6 betas times 9 portfolios plus 2 coefficients, or 56 parameters. Considering the test will also be conductedin two sub-periods and we have 120 time observations, nine portfolios is the maximum.
284 Y. Wang, A.D. Iorio / Int. Fin. Markets, Inst. and Money 17 (2007) 277–290
Tests of market segmentation versus market integration are conducted by using the Jorion andSchwartz (1986) model. With regard to the test of market segmentation, the rate of return onportfolio i is governed by
Rit = E(Ri) + βDi (RDt − E(RDt)) + βG
i VGt + εit (1)
where Rit is the monthly return on portfolio i, and RDt is the market return in a China-relatedstock market (the A-, B- and H-share markets). E(Ri) and E(RDt) are the expected values ofportfolio i and the China-related market, respectively, and βD
i and βGi are the factor loadings. VGt
is the international market return orthogonal to a China-related market return by a projection16:
RGt = c0 + c1RDt + VGt (2)
In a two-factor world, the expected value of Rit is given by
E(Ri) = γ0 + γDβDi + γGβG
i (3)
where γD and γG are the market prices of two respective factors. If a China-related stock marketis completely segmented from the world market, the international factor risk should not haveexplanatory power for portfolio return, i.e. γD = 0, then Eq. (3) can be reduced to
E(Ri) = γ0 + γDβDi (4)
This is the purely domestic CAPM, implying a version of the Black model where γ0 is theexpected return on the zero-beta portfolio. Note at the same time that
γD = E(RDt) − γ0 (5)
If Eqs. (3) and (5) are substituted into Eq. (1), the rate of return of portfolios can be rewrittenas
Rit = γ0(1 − βDi ) + γGβG
i + βDi RDt + βG
i VGt + εit (6)
This is the final model that is tested in this analysis. Under the joint hypothesis of segmentationand efficiency of the A-, B- and H-share markets, the purely international risk factor should notbe priced and thus γG in Eq. (6) should be equal to zero. The test of market integration likewiserevolves around the assessment of whether the parameter denoted by δD equals zero or not.
In order to correct for thin trading effects on B- and H-shares, we implement a modified Jorionand Schwartz (1986) model using the Dimson (1979) beta. Subsequently, Eq. (6) becomes
Rit = γ0(1 − βDi ) + γGβG
i ++1∑
k=−1
βDikRD,t+k +
+1∑
k=−1
βGikVG,t+k + εit (7)
where
βDi =
+1∑
k=−1
βDik and βG
i =+1∑
k=−1
βGik
16 The correlation coefficients between the A-share index, MSCI world index and Heng Seng index are very low andapproximately 0.02 in both cases. However, orthogonolized global indices are still used hereafter to ensure purely inter-national risk factors.
Y. Wang, A.D. Iorio / Int. Fin. Markets, Inst. and Money 17 (2007) 277–290 285
Mittoo (1992) challenges the results of Jorion and Schwartz (1986) by dividing the wholesample period into sub-periods and argues that the tests of integration and segmentation aresensitive to different time periods. Consequently, our analysis is extended by dividing the wholesample period into two equal sub-periods, thus aiming to identify the potential changes in themarket integration process in these China-related stock markets.
4. Empirical results
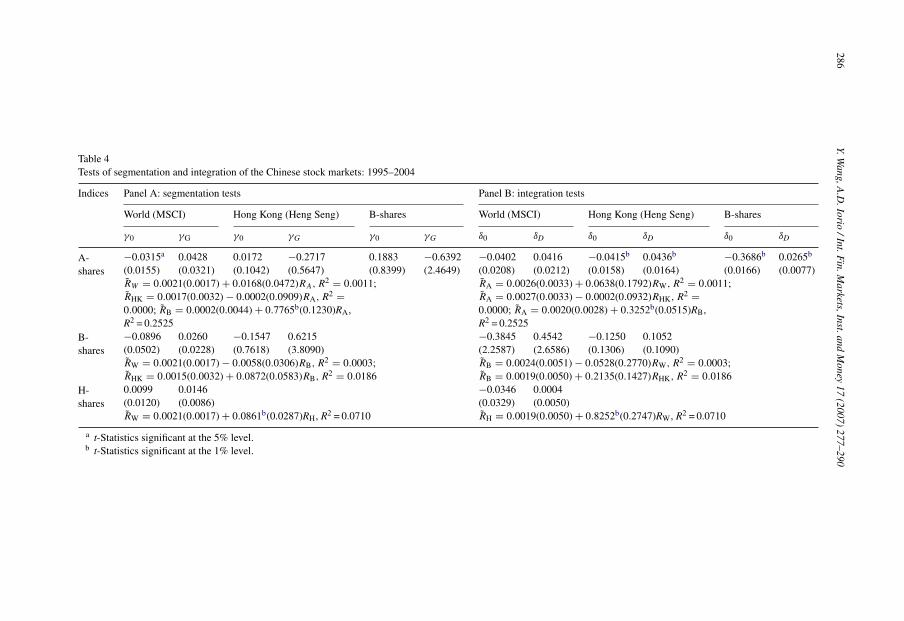
Table 4 provides the results for both the integration and segmentation tests over the full sampleperiod (1995–2004). In the test of segmentation, γG = 0 implies that one cannot reject the nullhypothesis of segmentation because global risk factors are not priced. The results for the A-share market in Panel A show that neither the MSCI world index nor the Heng Seng index arepriced for the domestic book-to-market portfolios, implying strong evidence of A-share marketsegmentation. Further, the negative Hong Kong stock market coefficient may reflect the negativecorrelation between the A-share index and the Hong Kong Heng Seng index within the sampleperiod as indicated in Table 2. In addition, the coefficient for the segmentation test between theA-share market and the B-share market is negative, indicating that no reliable conclusion can bemade at this stage.
Panel B reports the results of the analysis where integration is used as the null hypothesis.First, when the Heng Seng index is used as the global market index to test its segmentation withthe A-share market, the null hypothesis of integration is rejected. This is consistent with thesegmentation results reported in Panel A. The null hypothesis of integration between the A- andB-share markets is also rejected since δD is significantly different from zero at the 1% level. Theseresults are similar to the findings of Ma (1996), Su (1999), and Fung et al. (2000), who argue thata large price differential between the A-shares and the B-shares of a company suggests these twomarkets are segmented. The test of segmentation versus integration between the B-share marketand the world stock market, and the H-share market and the world market show that neithersegmentation nor integration can be rejected. A possible explanation for this result could be thatalthough they are accessible to foreign investors, the total market capitalization of both the B-sharemarket and the H-share market is too small to attract enough foreign investment. By the end of2004, the total market capitalization of each of these two markets was only 75 and 487 billionRMB, respectively. The fact that the B- and H-share markets are neither completely integratednor completely segmented with the world markets might suggest that they are integrated morewith the world market than the A-share market. In short, the integration of the A-share market isrejected in favour of segmentation from 1995 to 2004.
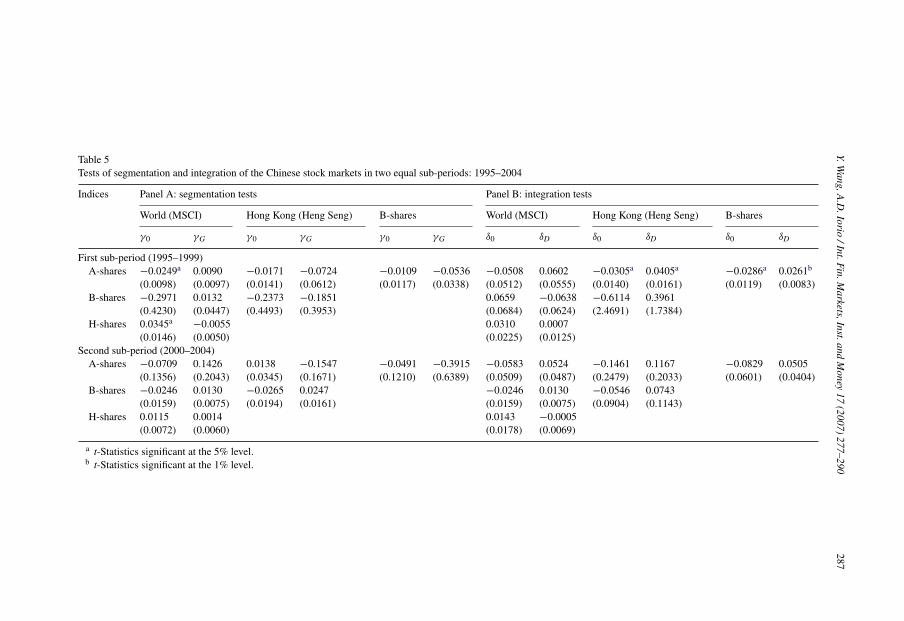
Consistent with the study undertaken by Mittoo (1992), we conduct a sub-period analysis bydividing the whole sample period arbitrarily into two equal sub-periods and the results of ourinvestigation are reported in Table 5. First, our findings indicate that there has been a move fromsegmentation to integration between the A-share market and the global market over time. We notean increasing degree of integration between the A-share market and the Hong Kong market, andthe A-share market and the B-share market. In particular, in the first sub-period (1995–1999), theresults are similar to the findings of the whole sample period analysis and suggest that the ChineseA-share market is segmented from both the Hong Kong market and the B-share market. In thetest of integration, the t-statistics for δD are 2.52 and 3.14, respectively, which rejects the nullhypothesis that the markets are integrated. The fact that the global risk factors are not significantlypriced at the 5% level in the test of segmentation further suggests that the results are reliable and
286Y.W
ang,A.D
.Iorio/Int.F
in.Markets,Inst.and
Money
17(2007)
277–290
Table 4Tests of segmentation and integration of the Chinese stock markets: 1995–2004
Indices Panel A: segmentation tests Panel B: integration tests
World (MSCI) Hong Kong (Heng Seng) B-shares World (MSCI) Hong Kong (Heng Seng) B-shares
γ0 γG γ0 γG γ0 γG δ0 δD δ0 δD δ0 δD
A-shares
−0.0315a
(0.0155)0.0428(0.0321)
0.0172(0.1042)
−0.2717(0.5647)
0.1883(0.8399)
−0.6392(2.4649)
−0.0402(0.0208)
0.0416(0.0212)
−0.0415b
(0.0158)0.0436b
(0.0164)−0.3686b
(0.0166)0.0265b
(0.0077)RW = 0.0021(0.0017) + 0.0168(0.0472)RA, R2 = 0.0011;RHK = 0.0017(0.0032) − 0.0002(0.0909)RA, R2 =0.0000; RB = 0.0002(0.0044) + 0.7765b(0.1230)RA,R2 = 0.2525
RA = 0.0026(0.0033) + 0.0638(0.1792)RW, R2 = 0.0011;RA = 0.0027(0.0033) − 0.0002(0.0932)RHK, R2 =0.0000; RA = 0.0020(0.0028) + 0.3252b(0.0515)RB,R2 = 0.2525
B-shares
−0.0896(0.0502)
0.0260(0.0228)
−0.1547(0.7618)
0.6215(3.8090)
−0.3845(2.2587)
0.4542(2.6586)
−0.1250(0.1306)
0.1052(0.1090)
RW = 0.0021(0.0017) − 0.0058(0.0306)RB, R2 = 0.0003;RHK = 0.0015(0.0032) + 0.0872(0.0583)RB, R2 = 0.0186
RB = 0.0024(0.0051) − 0.0528(0.2770)RW, R2 = 0.0003;RB = 0.0019(0.0050) + 0.2135(0.1427)RHK, R2 = 0.0186
H-shares
0.0099(0.0120)
0.0146(0.0086)
−0.0346(0.0329)
0.0004(0.0050)
RW = 0.0021(0.0017) + 0.0861b(0.0287)RH, R2 = 0.0710 RH = 0.0019(0.0050) + 0.8252b(0.2747)RW, R2 = 0.0710
a t-Statistics significant at the 5% level.b t-Statistics significant at the 1% level.
Y.Wang,A
.D.Iorio
/Int.Fin.M
arkets,Inst.andM
oney17
(2007)277–290
287
Table 5Tests of segmentation and integration of the Chinese stock markets in two equal sub-periods: 1995–2004
Indices Panel A: segmentation tests Panel B: integration tests
World (MSCI) Hong Kong (Heng Seng) B-shares World (MSCI) Hong Kong (Heng Seng) B-shares
γ0 γG γ0 γG γ0 γG δ0 δD δ0 δD δ0 δD
First sub-period (1995–1999)A-shares −0.0249a
(0.0098)0.0090(0.0097)
−0.0171(0.0141)
−0.0724(0.0612)
−0.0109(0.0117)
−0.0536(0.0338)
−0.0508(0.0512)
0.0602(0.0555)
−0.0305a
(0.0140)0.0405a
(0.0161)−0.0286a
(0.0119)0.0261b
(0.0083)B-shares −0.2971
(0.4230)0.0132(0.0447)
−0.2373(0.4493)
−0.1851(0.3953)
0.0659(0.0684)
−0.0638(0.0624)
−0.6114(2.4691)
0.3961(1.7384)
H-shares 0.0345a
(0.0146)−0.0055(0.0050)
0.0310(0.0225)
0.0007(0.0125)
Second sub-period (2000–2004)A-shares −0.0709
(0.1356)0.1426(0.2043)
0.0138(0.0345)
−0.1547(0.1671)
−0.0491(0.1210)
−0.3915(0.6389)
−0.0583(0.0509)
0.0524(0.0487)
−0.1461(0.2479)
0.1167(0.2033)
−0.0829(0.0601)
0.0505(0.0404)
B-shares −0.0246(0.0159)
0.0130(0.0075)
−0.0265(0.0194)
0.0247(0.0161)
−0.0246(0.0159)
0.0130(0.0075)
−0.0546(0.0904)
0.0743(0.1143)
H-shares 0.0115(0.0072)
0.0014(0.0060)
0.0143(0.0178)
−0.0005(0.0069)
a t-Statistics significant at the 5% level.b t-Statistics significant at the 1% level.
288 Y. Wang, A.D. Iorio / Int. Fin. Markets, Inst. and Money 17 (2007) 277–290
that the A-share market is segmented from the Hong Kong and the B-share market during thisperiod. However, in the second sub-period, one cannot reject the null hypothesis of integrationbetween any pair of these stock markets nor can the null hypothesis of segmentation be rejected.One possible explanation for this finding of insignificant segmentation and integration parameterscould be imprecise estimation. First, the betas with residuals βG
i in the segmentation test andβD
i in the integration test are relatively unstable over time. Second, the segmentation parameterloaded (γG) on to the beta relative to the global index may be close to zero, which could resultin large standard errors. However, the tests of segmentation and integration in the Chinese A-share market in the two sub-periods still suggest a move from segmentation to integration. Thisresult is consistent with the findings of the correlation analysis reported in Table 2 and those ofGroenewold et al., (2004), and Hatemi-J and Roca (2004), who document a modest growth inthe interrelationship between the mainland stock market and the Hong Kong stock market afterthe Asian financial crisis. It is worth noting that although the correlation coefficients between theB-share market and the Hong Kong stock market changed considerably from the first sub-periodto the second sub-period as indicated in Table 2, the tests of segmentation versus integrationbetween these two markets when using the Jorion and Schwartz (1986) model do not indicatethat the B-share market is becoming less integrated with the Hong Kong market in the secondsub-period.17
5. Conclusion
The Chinese A-share market has long been considered to be segmented from other globalfinancial markets. Even though China recently became a member of the WTO and its governmenthas committed to the gradual opening of the A-share market over the next 5 years, there is little,if any, evidence of more significant liberalization measures, such as the removal of capital andexchange rate controls. However, empirical analysis of the Chinese stock markets provides mixedresults with regard to the segmentation versus integration issue. Thus, this study attempts to shedsome light on the issue by employing the Jorion and Schwartz (1986) model to test the hypothesisin three China-related stock markets, namely, the A-share, the B-share and the H-share markets.Specifically, the study tests the period from 1995 to 2004 and further investigates sub-periodswithin this sample period in a bid to establish whether tests of integration and segmentation aresensitive to different time periods.
First, the results of the full sample period analysis suggest the segmentation of the A-sharemarket from the world stock markets. However, the sub-period test results indicate a move fromsegmentation to integration between the A-share and the B-share markets, and the A-share and theHong Kong stock markets. The opening of the B-share market to domestic investors in 2001 mayaccount for the integration between the A- and B-share markets while the increasingly higher-level of economic integration between Hong Kong and mainland China enhances the integrationbetween their stock markets. There is no evidence that the A-share market index is becomingincreasingly integrated with the MSCI world index.
17 In order to test the robustness of our results, stocks were grouped according to their size and tested. At the beginningof each month, all stocks for which size information was available were sorted into portfolios and the equally weightedmonthly returns at the end of each month were estimated for all portfolios. These returns were subsequently used to run themodel. However, since we implemented the Jorion and Schwartz (1986) model, this paper only obtains nested integrationversus segmentation results. In this case, neither integration nor segmentation can be rejected and thus it seems that B/Mportfolios can better explain the results.
Y. Wang, A.D. Iorio / Int. Fin. Markets, Inst. and Money 17 (2007) 277–290 289
Finally, although the B-share market and the H-share market were established to attract foreigninvestment to mainland-based Chinese companies, the hypothesis that they are becoming increas-ingly integrated with the world market is not supported by the results of this analysis. However,considering the increased participation of domestic investors in the B-share market and its lack ofattraction to foreign investors, one might expect a closer relationship between the B-share marketand the A-share market rather than a closer relationship between the B-share market and the worldmarkets in the future. In addition, the impact of the QFII scheme and the forthcoming qualifieddomestic institutional investors (QDII) programme on the integration between the A-share marketand the world stock markets may provide an interesting area for future research.18
Acknowledgements
We are grateful to Robert Brooks for his support and suggestions and anonymous reviewersfor their insightful comments.
References
Adler, M., Dumas, B., 1975. Optimal international acquisitions. Journal of Finance 30, 1–19.Adler, M., Dumas, B., 1983. International portfolio choice and corporation finance: a synthesis. Journal of Finance 38,
925–984.Anderson, M.D., 2002. Taking stock in China: company disclosure and information in China’s stock markets. Georgetown
Law Journal 88, 1919–1952.Bailey, W., Chung, Y.P., 1999. Foreign ownership restrictions and equity price premiums: what drives the demand for
cross-border. Journal of Financial and Quantitative Analysis 34, 489–511.Bekaert, G., 1995. Market integration and investment barriers in emerging equity markets. World Bank Economic Review
9, 75–107.Bekaert, G., Harvey, C.R., 1995. Time-varying world market integration. Journal of Finance 50, 403–444.Black, F., 1974. International capital market equilibrium with investment barriers. Journal of Financial Economics 1,
337–352.Chen, G., Firth, M., Kim, J., 2004. IPO underpricing in China’s new stock market. Journal of Multinational Financial
Management 14, 283–303.Cheong, C., Yee, C.H., 2003. Handbook on China’s WTO Accession and its Impacts. World Scientific Publishing, pp.
274–279.Cho, D.C., Eun, C.S., Senbet, L.W., 1986. International arbitrage pricing theory: an empirical investigation. Journal of
Finance 41, 313–329.Dimson, E., 1979. Risk measurement when shares are subject to infrequent trading. Journal of Financial Economics 7,
197–226.Drew, M., Naughton, T., Veeraraghavan, M., 2003. Firm size, book-to-market equity and security returns: evidence from
the Shanghai Stock Exchange. Australia Journal of Management 28, 119–139.Errunza, V., Losq, E., 1985. International asset pricing under mild segmentation: theory and test. Journal of Finance 40,
105–124.Errunza, V., Losq, E., 1992. Tests of integration, mild segmentation and segmentation hypotheses. Journal of Banking
and Finance 16, 949–972.Eun, C.S., Janakiramanan, S., 1986. A model of international asset pricing with a constraint on the foreign equity ownership.
Journal of Finance 41, 897–914.Fung, H.G., Lee, W., Leung, W.K., 2000. Segmentation of the A- and B-share Chinese equity markets. Journal of Financial
Research 23, 179–195.Groenewold, N., Tang, S., Wu, Y., 2004. The dynamic interrelationships between the greater China share markets. China
Economic Review 15, 45–62.
18 See Chinadaily, 19 November 2005 for QDII scheme. http://www.chinadaily.com.cn/.
290 Y. Wang, A.D. Iorio / Int. Fin. Markets, Inst. and Money 17 (2007) 277–290
Grubel, H.G., 1968. Internationally diversified portfolios: welfare gains and capital flows. American Economic Review58, 1299–1314.
Grundfest, J.A., 1990. Internationalization of the world’s securities markets: economic causes and regulatory conse-quences. Journal of Financial Services Research 4, 349–378.
Gultekin, M., Gultekin, B., Penati, A., 1989. Capital controls and international capital market segmentation: the evidencefrom Japanese and American stock markets. Journal of Finance 44, 849–869.
Hatemi-J, A., Roca, E., 2004. Do birds of the same feather flock together? The case of the Chinese states equity markets.International Financial Markets and Institutions and Money 14, 281–294.
Hietala, P.T., 1989. Asset pricing in a partially segmented market: evidence from the finish market. Journal of Finance44, 697–718.
Jorion, P., Schwartz, E., 1986. Integration vs. segmentation in the Canadian stock market. Journal of Finance 41, 603–616.Ma, X., 1996. Capital controls, market segmentation and stock prices: evidence from the Chinese stock market. Pacific-
Basin Finance Journal 4, 219–239.Maldonado, R., Saunders, A., 1983. Foreign exchange restrictions and the law of one price. Financial Management 12,
19–23.McDondald, J.G., 1973. French mutual fund performance: an evaluation of internationally diversified portfolios. Journal
of Finance 28, 1161–1180.Mittoo, U.R., 1992. Additional evidence on integration in the Canadian stock market. Journal of Finance 47, 2035–2054.Pei, C., Qiu, W., 2002. Internationalisation of securities market after China’s WTO accession. China and World Economy
4, 24–27.Rockinger, M., Urga, G., 2001. A time-varying parameter model to test for predictability and integration in the stock
markets of transition economies. Journal of Business and Economic Statistics 19, 73–84.Sarkar, A., Li, K., 2002. Global market integration and diversification benefits. Current Issues in Economics and Finance
8, 5–6.Sjoo, B., Zhang, J., 2000. Market segmentation and information diffusion in China’s stock markets. Journal of Multinational
Financial Management 10, 421–438.Solnik, B.H., 1974. An international market model of security price behavior. Journal of Financial and Quantitative
Analysis 9, 537–554.Solnik, B.H., 1977. Testing international asset pricing models: some pessimistic views. Journal of Finance 32, 503–512.Stapleton, R.C., Subrahmanyam, M.G., 1977. Market imperfections, capital market equilibrium and corporation finance.
Journal of Finance 32, 307–319.Stehle, R., 1977. An empirical test of the alternative hypotheses of national and international pricing of risky assets.
Journal of Finance 32, 493–502.Stulz, R., 1981. A model of international asset pricing. Journal of Financial Economics 9, 358–383.Su, D., 1999. Ownership restrictions and stock prices: evidence from Chinese markets. Financial Review 34, 37–55.Vaihekoski, M., Nummelin, K., 2001. Sources of capital market segmentation: empirical evidence from Finland. Financial
Review 37, 139–160.Wang, S.S., Jiang, L., 2004. Location of trade, ownership restrictions, and market illiquidity: examining Chinese A- and
H-shares. Journal of Banking and Finance 28, 1273–1297.Yeh, Y.H., Lee, T.S., 2000. The interaction and volatility asymmetry of unexpected returns in the greater China stock
markets. Global Finance Journal 11, 129–149.Yeo, S., 2003. The PRC qualified foreign institutional investors market. China Economic Review 14, 443–450.Zhang, Y., Zhao, R., 2003. Risk under “One Country and Two Systems”: evidence from class A, B and H shares of Chinese
listed companies. Review of Pacific Basin Financial Markets and Policies 6, 179–197.