are vix futures etps effective hedges? geng deng, … vix futures etps effective hedges? geng deng,...
TRANSCRIPT
Are VIX Futures ETPs Effective Hedges? Geng Deng, PhD, FRM, Craig McCann, PhD, CFA,
and Olivia Wang, PhD 1 Exchange-traded products (ETPs) linked to futures contracts on the
CBOE S&P 500 Volatility Index (VIX) have grown in volume and assets under management in recent years, in part because of their perceived potential to hedge against stock market losses.
In this paper we study whether VIX-related ETPs can effectively hedge a portfolio of stocks. We find that while the VIX increases when large stock market losses occur, ETPs which track short term VIX futures indices are not effective hedges for stock portfolios because of the negative roll yield accumulated by such futures-based ETPs. ETPs which track medium term VIX futures indices suffer less from negative roll yield and thus appear somewhat better hedges for stock portfolios. Our findings cast doubt on the potential diversification benefit from holding ETPs linked to VIX futures contracts.
We also study the effectiveness of VIX ETPs in hedging Leveraged ETFs (LETFs) in which rebalancing effects lead to significant losses for buy-and-hold investors during periods of high volatility. We find that VIX futures ETPs are usually not effective hedges for LETFs.
I. Introduction Exchange-traded products (ETPs) linked to futures contracts on the CBOE S&P
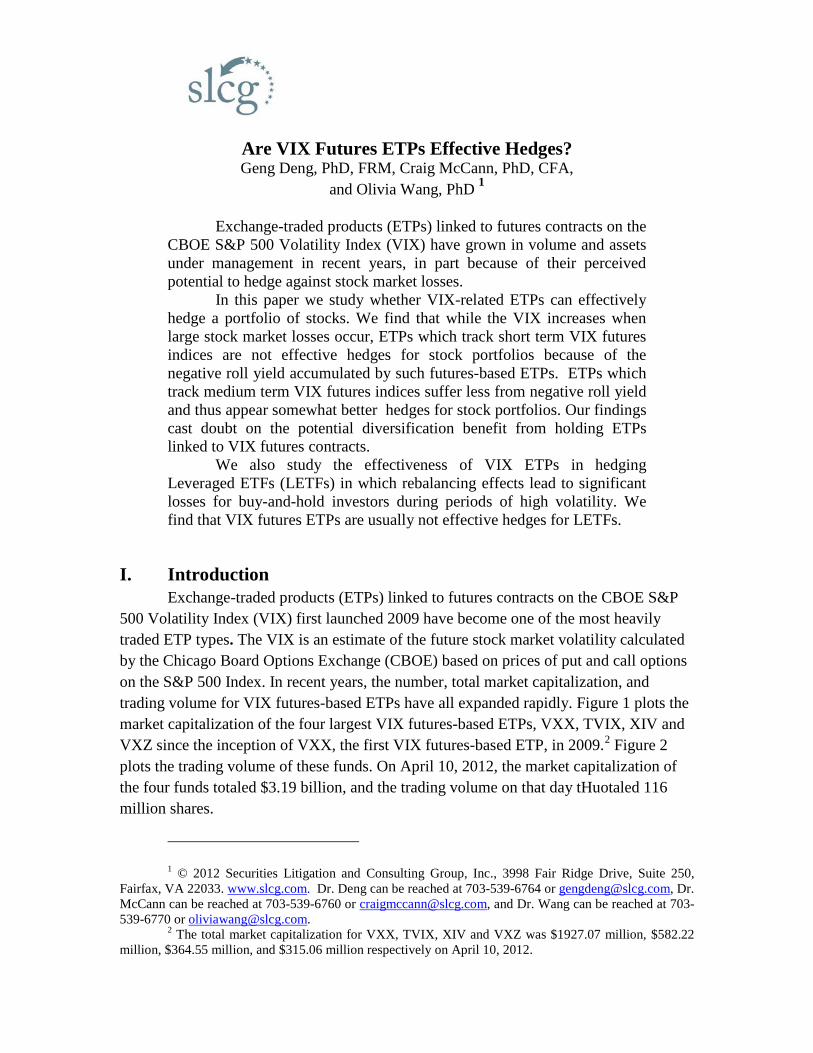
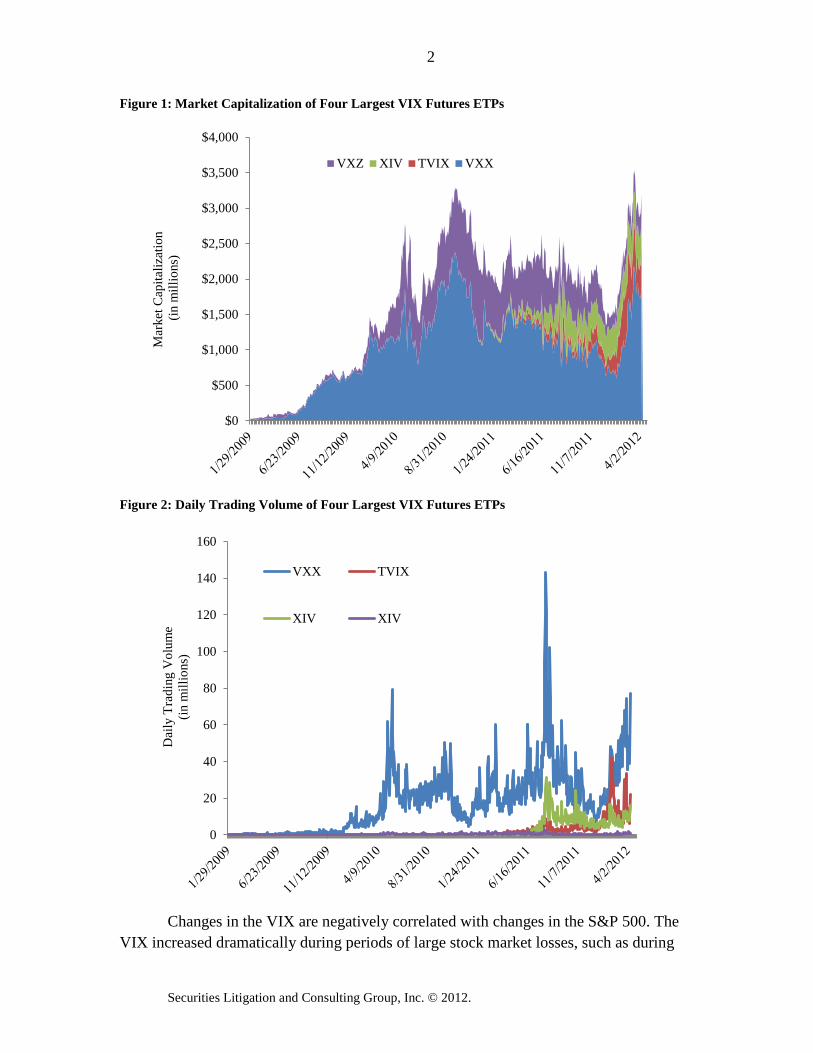
500 Volatility Index (VIX) first launched 2009 have become one of the most heavily traded ETP types. The VIX is an estimate of the future stock market volatility calculated by the Chicago Board Options Exchange (CBOE) based on prices of put and call options on the S&P 500 Index. In recent years, the number, total market capitalization, and trading volume for VIX futures-based ETPs have all expanded rapidly. Figure 1 plots the market capitalization of the four largest VIX futures-based ETPs, VXX, TVIX, XIV and VXZ since the inception of VXX, the first VIX futures-based ETP, in 2009.2 Figure 2 plots the trading volume of these funds. On April 10, 2012, the market capitalization of the four funds totaled $3.19 billion, and the trading volume on that day tHuotaled 116 million shares.
1 © 2012 Securities Litigation and Consulting Group, Inc., 3998 Fair Ridge Drive, Suite 250,
Fairfax, VA 22033. www.slcg.com. Dr. Deng can be reached at 703-539-6764 or [email protected], Dr. McCann can be reached at 703-539-6760 or [email protected], and Dr. Wang can be reached at 703-539-6770 or [email protected].
2 The total market capitalization for VXX, TVIX, XIV and VXZ was $1927.07 million, $582.22 million, $364.55 million, and $315.06 million respectively on April 10, 2012.
2
Securities Litigation and Consulting Group, Inc. © 2012.
Figure 1: Market Capitalization of Four Largest VIX Futures ETPs
Figure 2: Daily Trading Volume of Four Largest VIX Futures ETPs
Changes in the VIX are negatively correlated with changes in the S&P 500. The
VIX increased dramatically during periods of large stock market losses, such as during
$0
$500
$1,000
$1,500
$2,000
$2,500
$3,000
$3,500
$4,000M
arke
t Cap
italiz
atio
n
(in
mill
ions
) VXZ XIV TVIX VXX
0
20
40
60
80
100
120
140
160
Dai
ly T
radi
ng V
olum
e
(in m
illio
ns)
VXX TVIX
XIV XIV
3
Deng, McCann, and Wang
Are VIX Futures ETPs Effective Hedges?
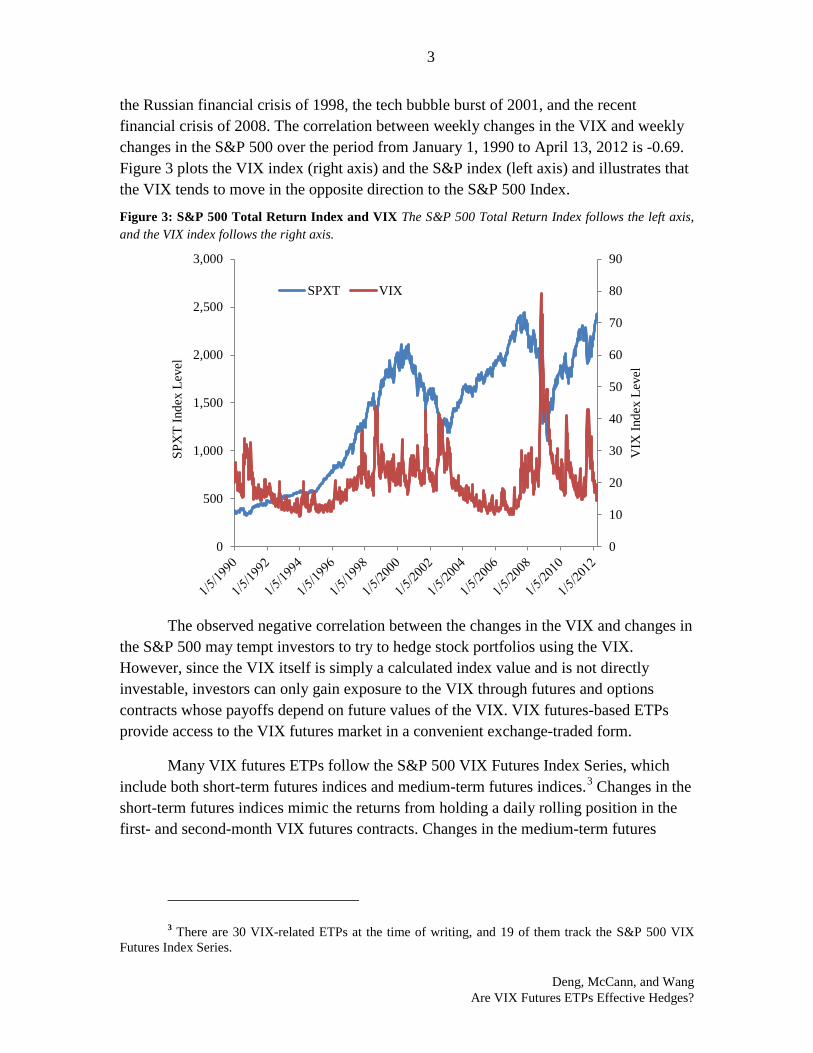
the Russian financial crisis of 1998, the tech bubble burst of 2001, and the recent financial crisis of 2008. The correlation between weekly changes in the VIX and weekly changes in the S&P 500 over the period from January 1, 1990 to April 13, 2012 is -0.69. Figure 3 plots the VIX index (right axis) and the S&P index (left axis) and illustrates that the VIX tends to move in the opposite direction to the S&P 500 Index.
Figure 3: S&P 500 Total Return Index and VIX The S&P 500 Total Return Index follows the left axis, and the VIX index follows the right axis.
The observed negative correlation between the changes in the VIX and changes in
the S&P 500 may tempt investors to try to hedge stock portfolios using the VIX. However, since the VIX itself is simply a calculated index value and is not directly investable, investors can only gain exposure to the VIX through futures and options contracts whose payoffs depend on future values of the VIX. VIX futures-based ETPs provide access to the VIX futures market in a convenient exchange-traded form.
Many VIX futures ETPs follow the S&P 500 VIX Futures Index Series, which include both short-term futures indices and medium-term futures indices.3 Changes in the short-term futures indices mimic the returns from holding a daily rolling position in the first- and second-month VIX futures contracts. Changes in the medium-term futures
3 There are 30 VIX-related ETPs at the time of writing, and 19 of them track the S&P 500 VIX
Futures Index Series.
0
10
20
30
40
50
60
70
80
90
0
500
1,000
1,500
2,000
2,500
3,000
VIX
Inde
x Le
vel
SPX
T In
dex
Leve
l
SPXT VIX
4
Securities Litigation and Consulting Group, Inc. © 2012.
indices mimic the return from holding a daily rolling position in the fourth-, fifth-, sixth- and seventh-month VIX futures contracts.4
As we will explain later in further detail, VIX futures-based investments are subject to negative roll yields. Roll yield occurs when an investment manager purchases a futures contract and then sells it sometime later as the contract gets closer to expiration and purchases a futures contract with the same initial maturity as the contract just sold. Since the price of longer-dated VIX futures contracts is typically higher than shorter-dated VIX futures contracts, the “roll yield” is negative on average and could lead to persistent underperformance of ETPs tracking the VIX future indices compared to the VIX itself.
In this paper, we study whether ETPs which track VIX futures indices are good hedges for stock portfolios. We compute optimal hedge ratios using regression analysis and construct hedged portfolios as in Figlewski (1985). Specifically, we test the effectiveness of the VIX short-term futures indices tracked by ETPs to hedge stock and bond portfolios. Our results show that VIX futures ETPs are generally not very good hedges for stocks.
We also study the ability of VIX futures ETPs to mitigate LETFs’ tracking error over long holding periods. Trainor (2011) shows that a simple strategy of holding LETFs when the VIX level is below 20 and then selling them when the VIX level exceeds 20 increases risk-adjusted returns. The VIX signal proposed by Trainor improves risk-adjusted returns because LETFs’ negative rebalancing and compounding effects over long holding periods are worse during periods of high stock market volatility.5 Also, since higher stock market volatility is associated with negative returns, avoiding the leveraged ETFs when the VIX is high could increase returns. Rather than use the VIX index as an signal for when to hold or sell LETFs as in Trainor (2011), we test whether direct trades in a VIX futures ETP can hedge the return of LETFs over long holding periods. Our results show that VIX futures ETPs do not effectively hedge LETFs.
Early literature studies the diversification benefit of volatility-related products using variance swaps and spot VIX. For example, Daigler and Rossi (2006) study the effect of adding the VIX index directly in a S&P 500 stock portfolio in a mean-variance efficient portfolio framework. Hafner and Wallmeier (2008) study investment in volatility using variance swaps. They find that the negative volatility risk premium in the U.S. market for the period from 1995 to 2004 leads to short positions in variance swaps
4 Throughout this paper we use the S&P 500 VIX Futures Index Series when we talk about VIX
futures indices. There are other indices which model the returns of VIX futures positions, such as Citi Volatility Index Total Return (CVOLT), which combines a rolling mid-term futures strategy with a short position in the S&P 500.
5 Deng and McCann (2012) study this effect in a more theoretical framework.
5
Deng, McCann, and Wang
Are VIX Futures ETPs Effective Hedges?
in the efficient portfolios. This in turn implies short positions in the stock index as well in the efficient portfolio due to the negative return correlation between the variance swaps and the return index. Dash and Moran (2005) explore the relationship between the VIX index and hedge fund returns. They show that the negative return correlation between the VIX and hedge funds is asymmetric in the sense that when hedge funds have low returns, the correlation is negative; while when hedge funds have high returns, the correlation is positive. They also find that, using standard mean variance analysis, the optimal allocation of the VIX index in efficient portfolios is less than 10%.
Recent literature evaluates VIX futures in the mean variance framework. Chen, Chung and Ho (2010) addresses whether volatility-related assets, including VIX futures, expand the efficient frontier. Using return data of VIX-related assets over the period of 1996 to 2008, they find that adding VIX-related assets to benchmark portfolios can lead to statistically significant expansion of the efficient frontier. Also under a mean variance framework, Alexander and Korovilas (2012 a) show that, unless the investor can reliably predict the future values of the VIX futures indices, holding VIX futures ETPs could only provide diversification benefit to an equity portfolio in periods of high volatility, thereby limiting the diversification benefit of VIX futures ETPs.
Other related studies include Szado (2009), Warren (2012), and Alexander and Korovilas (2012 b). Szado (2009) studies the diversification impact of various VIX exposures for a typical institutional investment portfolio during the 2008 financial crisis with a focus on the latter part of 2008. Not surprisingly, confined to this period, Szado (2009) finds that adding VIX exposures, especially VIX call options could provide some diversification benefit. Warren (2012) finds that potential role for volatility products depends on investors’ risk-and-return characteristics. Alexander and Korovilas (2012 b) provide a detailed analysis of VIX futures ETNs. They show that a VIX futures ETN portfolio with a long position in mid-term VIX futures ETNs and a short position in short-term VIX futures ETNs provides better returns in terms of Sharpe ratio, Sortino ratio and the maximum daily loss compared to ETNs tracking VIX futures indices. As we will see below, this result is consistent with our findings.
II. VIX Futures and Futures Indices
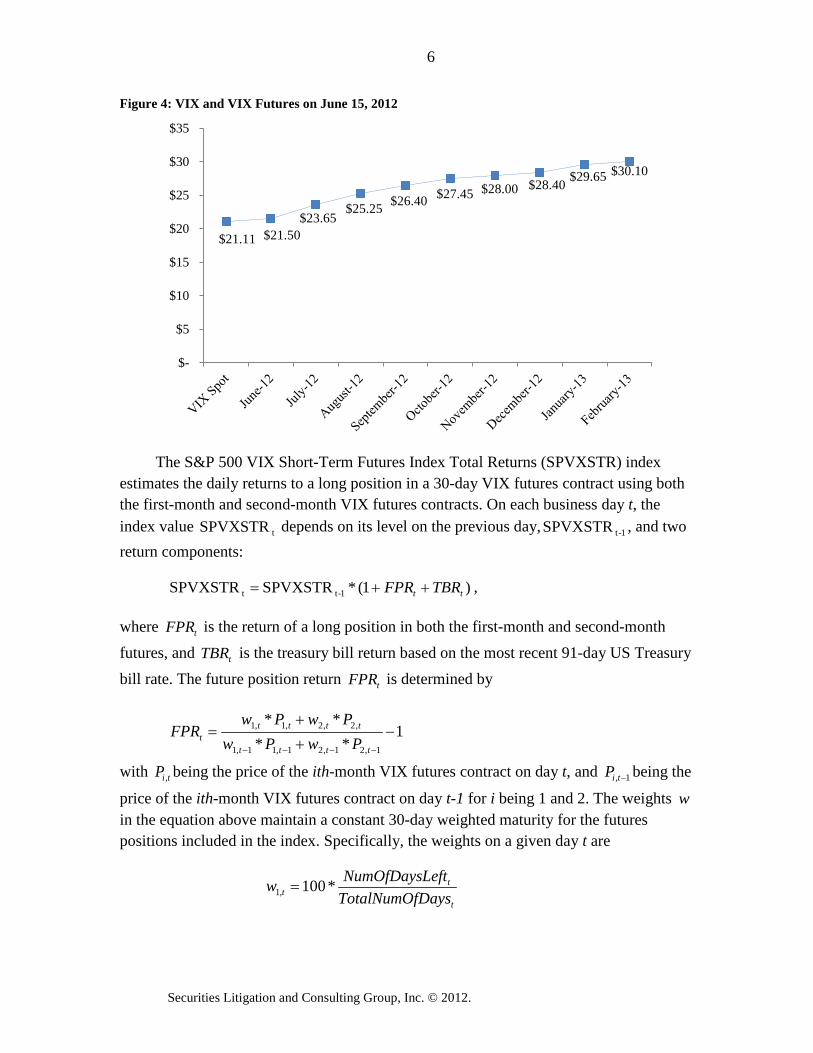
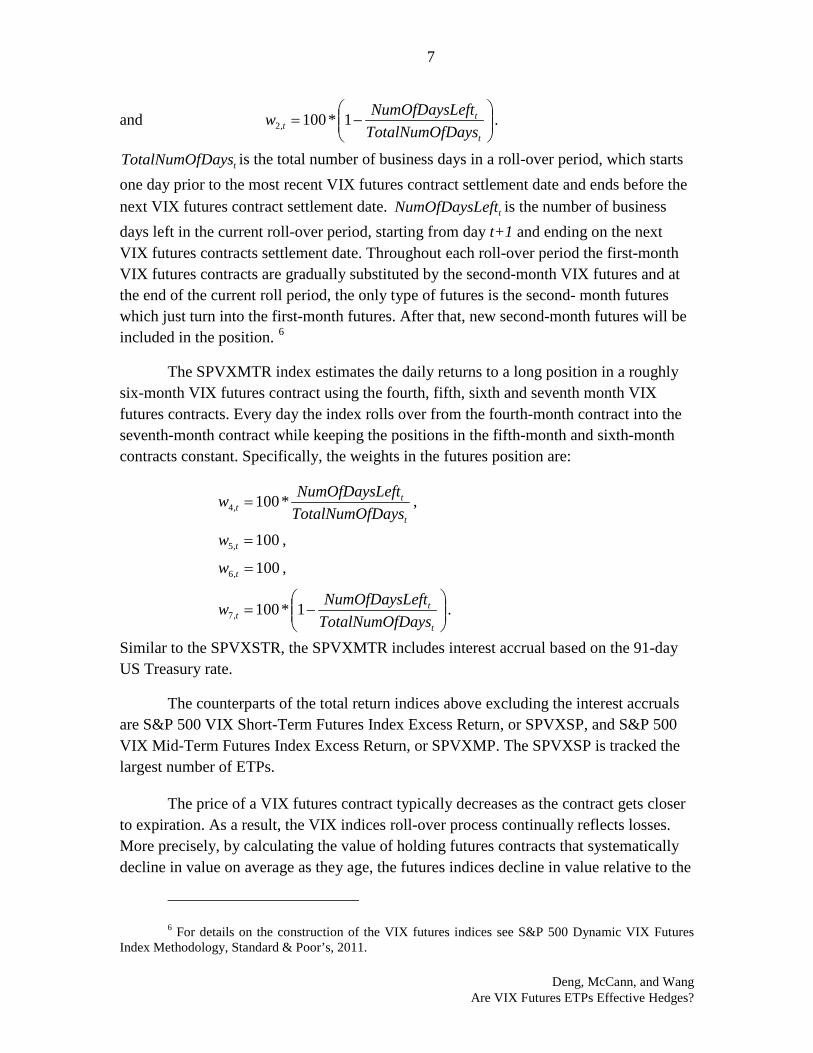
The CBOE maintains a set of futures contracts on the VIX expiring each month for the next nine months. The contracts expire each month, on a Wednesday, thirty days before the third Friday of the following month. The contract closest to expiration is referred to as the first-month contract, and later expiring contracts in sequence are second-month contract, third-month contract and so on. The closing prices for the VIX futures contracts on June 15, 2012 are plotted in figure 4. This recent pattern of futures prices increasing with the time to expiration is common.
6
Securities Litigation and Consulting Group, Inc. © 2012.
Figure 4: VIX and VIX Futures on June 15, 2012
The S&P 500 VIX Short-Term Futures Index Total Returns (SPVXSTR) index estimates the daily returns to a long position in a 30-day VIX futures contract using both the first-month and second-month VIX futures contracts. On each business day t, the index value tSPVXSTR depends on its level on the previous day, 1-tSPVXSTR , and two return components:
)1(*SPVXSTRSPVXSTR 1-tt tt TBRFPR ++= ,
where tFPR is the return of a long position in both the first-month and second-month futures, and tTBR is the treasury bill return based on the most recent 91-day US Treasury bill rate. The future position return tFPR is determined by
1**
**
1,21,21,11,1
,2,2,1,1 −++
=−−−− tttt
ttttt PwPw
PwPwFPR
with tiP , being the price of the ith-month VIX futures contract on day t, and 1, −tiP being the
price of the ith-month VIX futures contract on day t-1 for i being 1 and 2. The weights win the equation above maintain a constant 30-day weighted maturity for the futures positions included in the index. Specifically, the weights on a given day t are
t
tt DaysTotalNumOf
eftNumOfDaysLw *100,1 =
$21.11 $21.50 $23.65
$25.25 $26.40 $27.45 $28.00 $28.40 $29.65 $30.10
$-
$5
$10
$15
$20
$25
$30
$35
7
Deng, McCann, and Wang
Are VIX Futures ETPs Effective Hedges?
and
−=
t
tt DaysTotalNumOf
eftNumOfDaysLw 1*100,2 .
tDaysTotalNumOf is the total number of business days in a roll-over period, which starts one day prior to the most recent VIX futures contract settlement date and ends before the next VIX futures contract settlement date. teftNumOfDaysL is the number of business days left in the current roll-over period, starting from day t+1 and ending on the next VIX futures contracts settlement date. Throughout each roll-over period the first-month VIX futures contracts are gradually substituted by the second-month VIX futures and at the end of the current roll period, the only type of futures is the second- month futures which just turn into the first-month futures. After that, new second-month futures will be included in the position. 6
The SPVXMTR index estimates the daily returns to a long position in a roughly six-month VIX futures contract using the fourth, fifth, sixth and seventh month VIX futures contracts. Every day the index rolls over from the fourth-month contract into the seventh-month contract while keeping the positions in the fifth-month and sixth-month contracts constant. Specifically, the weights in the futures position are:
t
tt DaysTotalNumOf
eftNumOfDaysLw *100,4 = ,
100,5 =tw ,
100,6 =tw ,
−=
t
tt DaysTotalNumOf
eftNumOfDaysLw 1*100,7 .
Similar to the SPVXSTR, the SPVXMTR includes interest accrual based on the 91-day US Treasury rate.
The counterparts of the total return indices above excluding the interest accruals are S&P 500 VIX Short-Term Futures Index Excess Return, or SPVXSP, and S&P 500 VIX Mid-Term Futures Index Excess Return, or SPVXMP. The SPVXSP is tracked the largest number of ETPs.
The price of a VIX futures contract typically decreases as the contract gets closer to expiration. As a result, the VIX indices roll-over process continually reflects losses. More precisely, by calculating the value of holding futures contracts that systematically decline in value on average as they age, the futures indices decline in value relative to the
6 For details on the construction of the VIX futures indices see S&P 500 Dynamic VIX Futures
Index Methodology, Standard & Poor’s, 2011.
8
Securities Litigation and Consulting Group, Inc. © 2012.
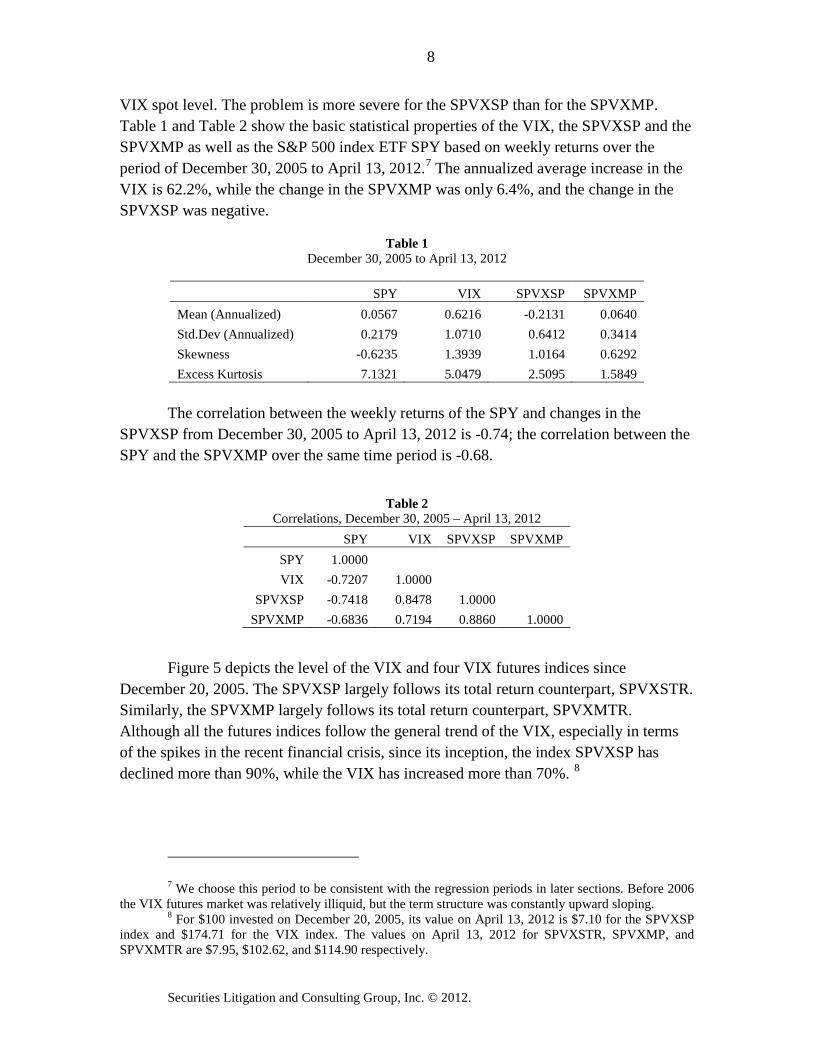
VIX spot level. The problem is more severe for the SPVXSP than for the SPVXMP. Table 1 and Table 2 show the basic statistical properties of the VIX, the SPVXSP and the SPVXMP as well as the S&P 500 index ETF SPY based on weekly returns over the period of December 30, 2005 to April 13, 2012.7 The annualized average increase in the VIX is 62.2%, while the change in the SPVXMP was only 6.4%, and the change in the SPVXSP was negative.
Table 1 December 30, 2005 to April 13, 2012
The correlation between the weekly returns of the SPY and changes in the SPVXSP from December 30, 2005 to April 13, 2012 is -0.74; the correlation between the SPY and the SPVXMP over the same time period is -0.68.
Table 2
Correlations, December 30, 2005 – April 13, 2012 SPY VIX SPVXSP SPVXMP
SPY 1.0000 VIX -0.7207 1.0000
SPVXSP -0.7418 0.8478 1.0000 SPVXMP -0.6836 0.7194 0.8860 1.0000
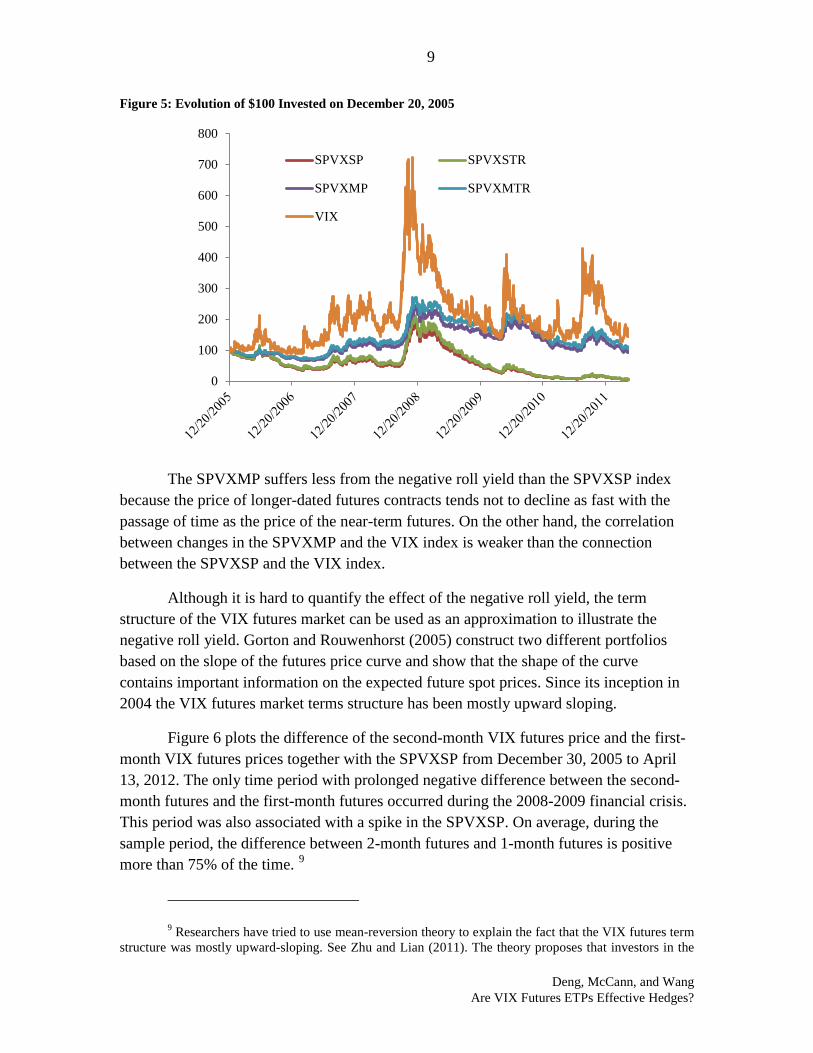
Figure 5 depicts the level of the VIX and four VIX futures indices since December 20, 2005. The SPVXSP largely follows its total return counterpart, SPVXSTR. Similarly, the SPVXMP largely follows its total return counterpart, SPVXMTR. Although all the futures indices follow the general trend of the VIX, especially in terms of the spikes in the recent financial crisis, since its inception, the index SPVXSP has declined more than 90%, while the VIX has increased more than 70%. 8
7 We choose this period to be consistent with the regression periods in later sections. Before 2006
the VIX futures market was relatively illiquid, but the term structure was constantly upward sloping. 8 For $100 invested on December 20, 2005, its value on April 13, 2012 is $7.10 for the SPVXSP
index and $174.71 for the VIX index. The values on April 13, 2012 for SPVXSTR, SPVXMP, and SPVXMTR are $7.95, $102.62, and $114.90 respectively.
SPY VIX SPVXSP SPVXMP Mean (Annualized) 0.0567 0.6216 -0.2131 0.0640 Std.Dev (Annualized) 0.2179 1.0710 0.6412 0.3414 Skewness -0.6235 1.3939 1.0164 0.6292 Excess Kurtosis 7.1321 5.0479 2.5095 1.5849
9
Deng, McCann, and Wang
Are VIX Futures ETPs Effective Hedges?
Figure 5: Evolution of $100 Invested on December 20, 2005
The SPVXMP suffers less from the negative roll yield than the SPVXSP index because the price of longer-dated futures contracts tends not to decline as fast with the passage of time as the price of the near-term futures. On the other hand, the correlation between changes in the SPVXMP and the VIX index is weaker than the connection between the SPVXSP and the VIX index.
Although it is hard to quantify the effect of the negative roll yield, the term structure of the VIX futures market can be used as an approximation to illustrate the negative roll yield. Gorton and Rouwenhorst (2005) construct two different portfolios based on the slope of the futures price curve and show that the shape of the curve contains important information on the expected future spot prices. Since its inception in 2004 the VIX futures market terms structure has been mostly upward sloping.
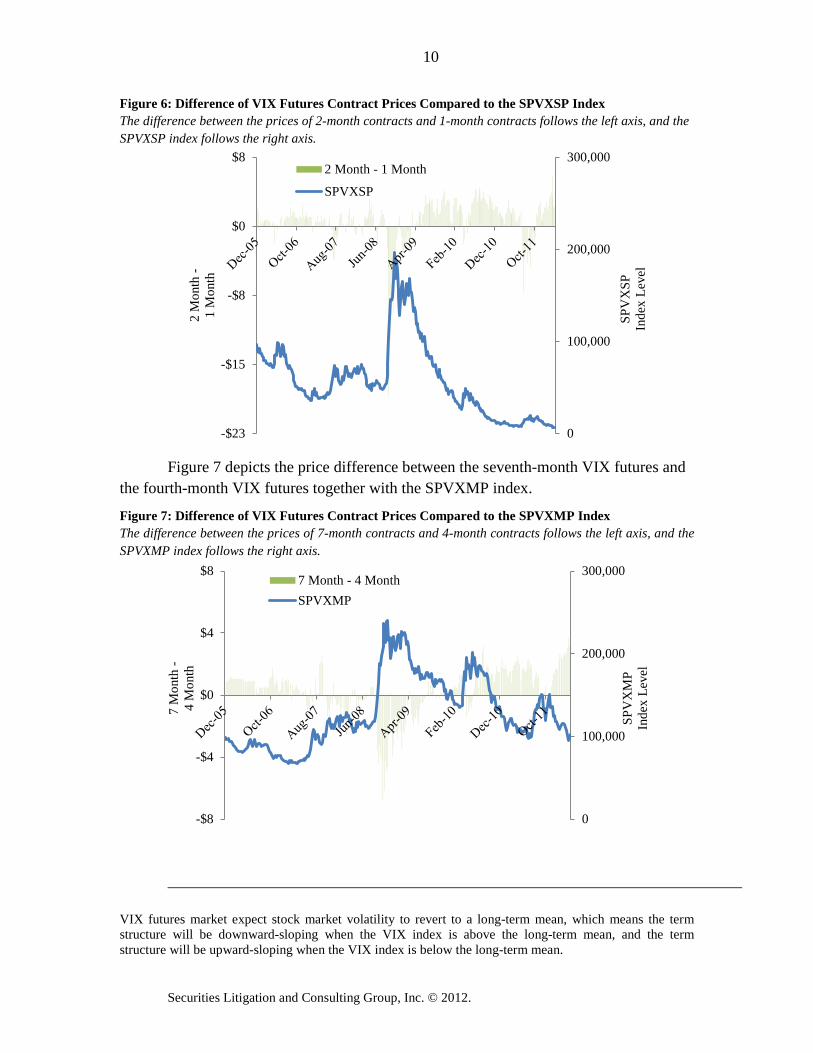
Figure 6 plots the difference of the second-month VIX futures price and the first-month VIX futures prices together with the SPVXSP from December 30, 2005 to April 13, 2012. The only time period with prolonged negative difference between the second-month futures and the first-month futures occurred during the 2008-2009 financial crisis. This period was also associated with a spike in the SPVXSP. On average, during the sample period, the difference between 2-month futures and 1-month futures is positive more than 75% of the time. 9
9 Researchers have tried to use mean-reversion theory to explain the fact that the VIX futures term
structure was mostly upward-sloping. See Zhu and Lian (2011). The theory proposes that investors in the
0
100
200
300
400
500
600
700
800
SPVXSP SPVXSTR
SPVXMP SPVXMTR
VIX
10
Securities Litigation and Consulting Group, Inc. © 2012.
Figure 6: Difference of VIX Futures Contract Prices Compared to the SPVXSP Index The difference between the prices of 2-month contracts and 1-month contracts follows the left axis, and the SPVXSP index follows the right axis.
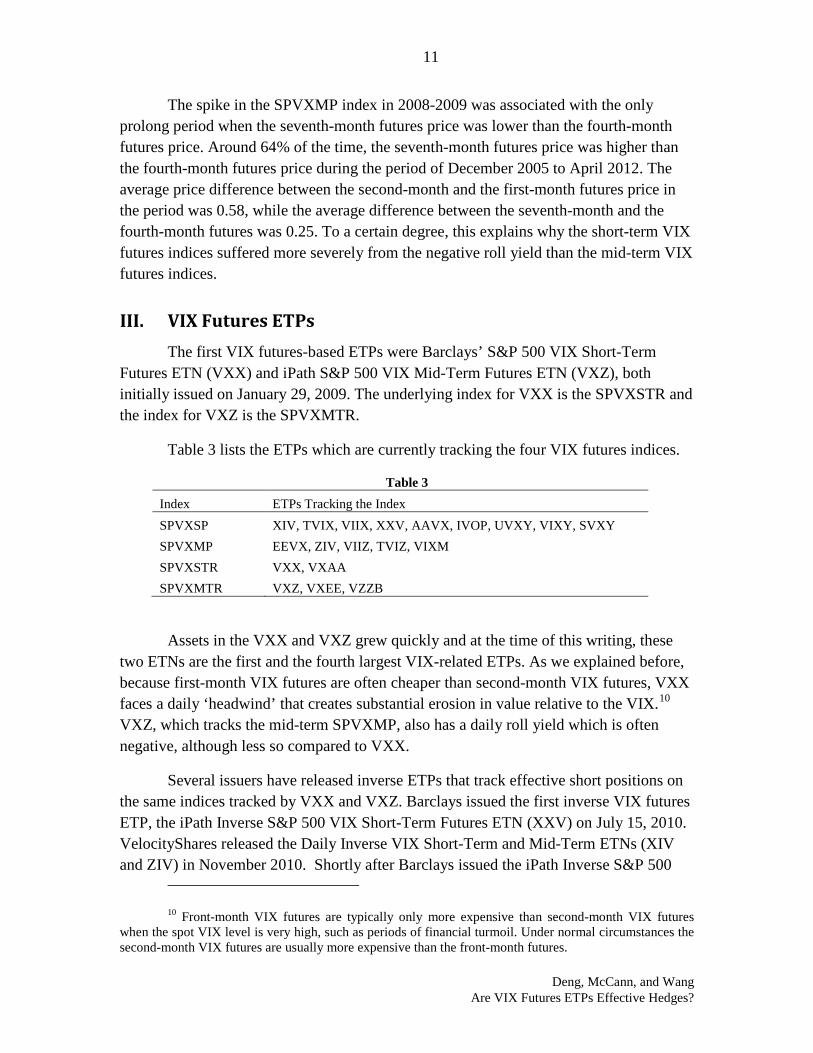
Figure 7 depicts the price difference between the seventh-month VIX futures and the fourth-month VIX futures together with the SPVXMP index.
Figure 7: Difference of VIX Futures Contract Prices Compared to the SPVXMP Index The difference between the prices of 7-month contracts and 4-month contracts follows the left axis, and the SPVXMP index follows the right axis.
VIX futures market expect stock market volatility to revert to a long-term mean, which means the term structure will be downward-sloping when the VIX index is above the long-term mean, and the term structure will be upward-sloping when the VIX index is below the long-term mean.
0
100,000
200,000
300,000
-$23
-$15
-$8
$0
$8
SPV
XSP
In
dex
Leve
l
2 M
onth
-
1 M
onth
2 Month - 1 Month
SPVXSP
0
100,000
200,000
300,000
-$8
-$4
$0
$4
$8
SPV
XM
P
Inde
x Le
vel
7 M
onth
- 4
Mon
th
7 Month - 4 MonthSPVXMP
11
Deng, McCann, and Wang
Are VIX Futures ETPs Effective Hedges?
The spike in the SPVXMP index in 2008-2009 was associated with the only prolong period when the seventh-month futures price was lower than the fourth-month futures price. Around 64% of the time, the seventh-month futures price was higher than the fourth-month futures price during the period of December 2005 to April 2012. The average price difference between the second-month and the first-month futures price in the period was 0.58, while the average difference between the seventh-month and the fourth-month futures was 0.25. To a certain degree, this explains why the short-term VIX futures indices suffered more severely from the negative roll yield than the mid-term VIX futures indices.
III. VIX Futures ETPs The first VIX futures-based ETPs were Barclays’ S&P 500 VIX Short-Term
Futures ETN (VXX) and iPath S&P 500 VIX Mid-Term Futures ETN (VXZ), both initially issued on January 29, 2009. The underlying index for VXX is the SPVXSTR and the index for VXZ is the SPVXMTR.
Table 3 lists the ETPs which are currently tracking the four VIX futures indices.
Table 3 Index ETPs Tracking the Index SPVXSP XIV, TVIX, VIIX, XXV, AAVX, IVOP, UVXY, VIXY, SVXY SPVXMP EEVX, ZIV, VIIZ, TVIZ, VIXM SPVXSTR VXX, VXAA SPVXMTR VXZ, VXEE, VZZB
Assets in the VXX and VXZ grew quickly and at the time of this writing, these two ETNs are the first and the fourth largest VIX-related ETPs. As we explained before, because first-month VIX futures are often cheaper than second-month VIX futures, VXX faces a daily ‘headwind’ that creates substantial erosion in value relative to the VIX.10 VXZ, which tracks the mid-term SPVXMP, also has a daily roll yield which is often negative, although less so compared to VXX.
Several issuers have released inverse ETPs that track effective short positions on the same indices tracked by VXX and VXZ. Barclays issued the first inverse VIX futures ETP, the iPath Inverse S&P 500 VIX Short-Term Futures ETN (XXV) on July 15, 2010. VelocityShares released the Daily Inverse VIX Short-Term and Mid-Term ETNs (XIV and ZIV) in November 2010. Shortly after Barclays issued the iPath Inverse S&P 500
10 Front-month VIX futures are typically only more expensive than second-month VIX futures
when the spot VIX level is very high, such as periods of financial turmoil. Under normal circumstances the second-month VIX futures are usually more expensive than the front-month futures.
12
Securities Litigation and Consulting Group, Inc. © 2012.
VIX Short-Term Futures ETN (IVO) in January 2011, which was similar to XIV in exposure. SVXY, the ProShares Short VIX Short-Term Futures ETF, offered the same strategy but was implemented as an ETF.
There are also leveraged VIX futures-related ETFs whose daily NAV changes equal twice the daily NAV changes of VXX and VXZ. The most actively traded of these has been TVIX, the VelocityShares Daily 2x VIX Short-Term ETN, which rebalances daily to provide constant 2x exposure of SPVXSP, the S&P 500 VIX Short-Term Futures Index Excess Return. Other currently available leveraged VIX futures ETPs include TVIZ, the VelocityShares Daily Inverse VIX Mid-Term ETN, and UVXY, the ProShares Ultra VIX Short-Term Futures ETF.
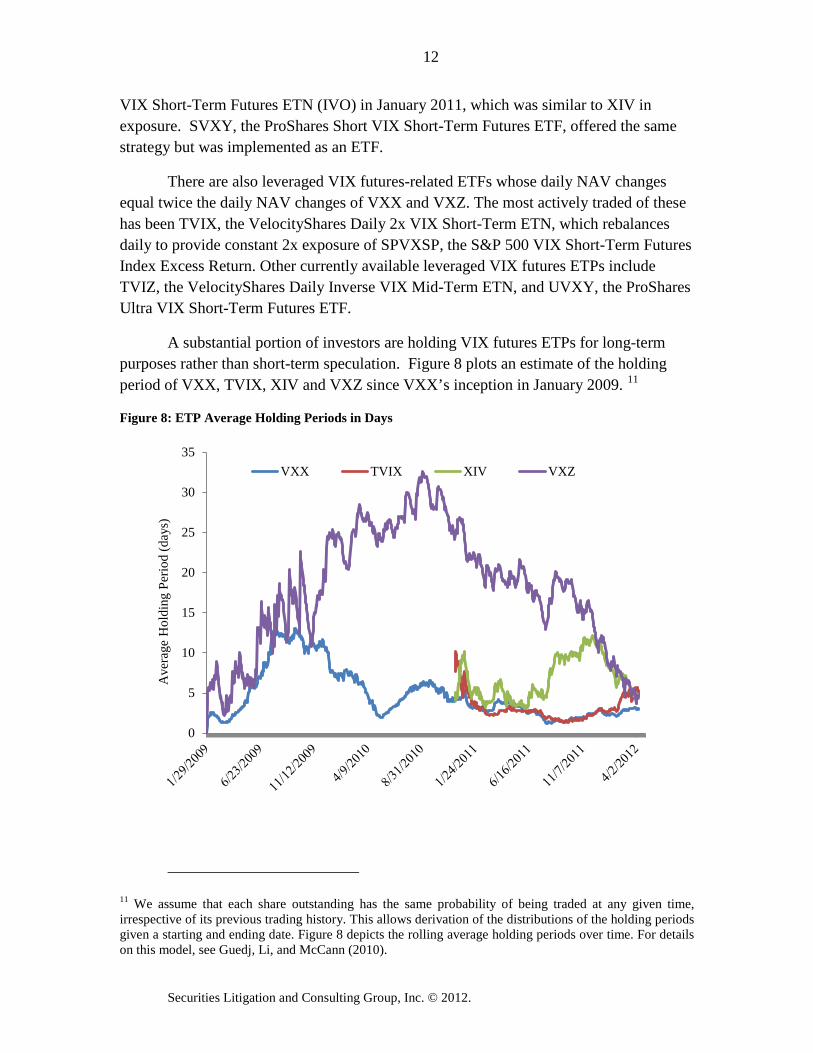
A substantial portion of investors are holding VIX futures ETPs for long-term purposes rather than short-term speculation. Figure 8 plots an estimate of the holding period of VXX, TVIX, XIV and VXZ since VXX’s inception in January 2009. 11
Figure 8: ETP Average Holding Periods in Days
11 We assume that each share outstanding has the same probability of being traded at any given time, irrespective of its previous trading history. This allows derivation of the distributions of the holding periods given a starting and ending date. Figure 8 depicts the rolling average holding periods over time. For details on this model, see Guedj, Li, and McCann (2010).
0
5
10
15
20
25
30
35
Ave
rage
Hol
ding
Per
iod
(day
s)
VXX TVIX XIV VXZ
13
Deng, McCann, and Wang
Are VIX Futures ETPs Effective Hedges?
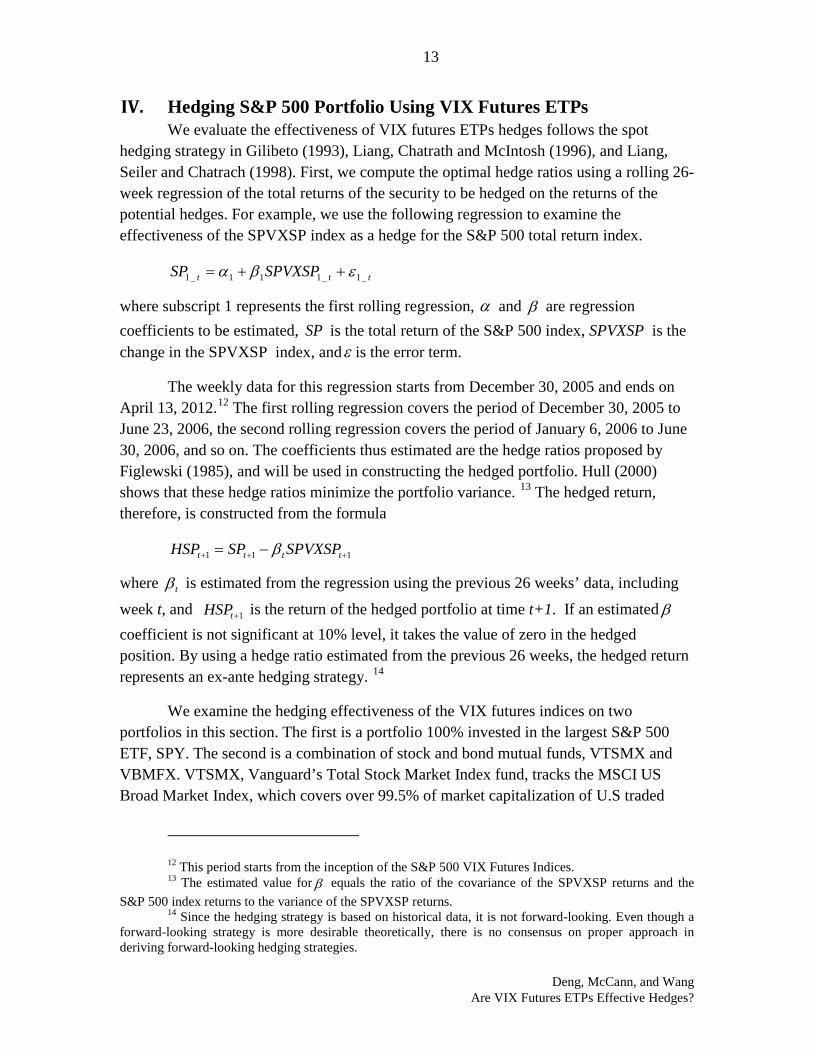
IV. Hedging S&P 500 Portfolio Using VIX Futures ETPs We evaluate the effectiveness of VIX futures ETPs hedges follows the spot
hedging strategy in Gilibeto (1993), Liang, Chatrath and McIntosh (1996), and Liang, Seiler and Chatrach (1998). First, we compute the optimal hedge ratios using a rolling 26-week regression of the total returns of the security to be hedged on the returns of the potential hedges. For example, we use the following regression to examine the effectiveness of the SPVXSP index as a hedge for the S&P 500 total return index.
ttt SPVXSPSP _1_111_1 εβα ++=
where subscript 1 represents the first rolling regression, α and β are regression coefficients to be estimated, SP is the total return of the S&P 500 index, SPVXSP is the change in the SPVXSP index, andε is the error term.
The weekly data for this regression starts from December 30, 2005 and ends on April 13, 2012.12 The first rolling regression covers the period of December 30, 2005 to June 23, 2006, the second rolling regression covers the period of January 6, 2006 to June 30, 2006, and so on. The coefficients thus estimated are the hedge ratios proposed by Figlewski (1985), and will be used in constructing the hedged portfolio. Hull (2000) shows that these hedge ratios minimize the portfolio variance. 13 The hedged return, therefore, is constructed from the formula
111 +++ −= tttt SPVXSPSPHSP β
where tβ is estimated from the regression using the previous 26 weeks’ data, including
week t, and 1+tHSP is the return of the hedged portfolio at time t+1. If an estimated βcoefficient is not significant at 10% level, it takes the value of zero in the hedged position. By using a hedge ratio estimated from the previous 26 weeks, the hedged return represents an ex-ante hedging strategy. 14
We examine the hedging effectiveness of the VIX futures indices on two portfolios in this section. The first is a portfolio 100% invested in the largest S&P 500 ETF, SPY. The second is a combination of stock and bond mutual funds, VTSMX and VBMFX. VTSMX, Vanguard’s Total Stock Market Index fund, tracks the MSCI US Broad Market Index, which covers over 99.5% of market capitalization of U.S traded
12 This period starts from the inception of the S&P 500 VIX Futures Indices. 13 The estimated value for β equals the ratio of the covariance of the SPVXSP returns and the
S&P 500 index returns to the variance of the SPVXSP returns. 14 Since the hedging strategy is based on historical data, it is not forward-looking. Even though a
forward-looking strategy is more desirable theoretically, there is no consensus on proper approach in deriving forward-looking hedging strategies.
14
Securities Litigation and Consulting Group, Inc. © 2012.
stocks. VBMFX, Vanguard’s Total Bond Market Index fund, tracks the Barclays Capital U.S. Aggregate Float Adjusted Index. The potential hedges include the SPVXSP and the SPVXMP. 15
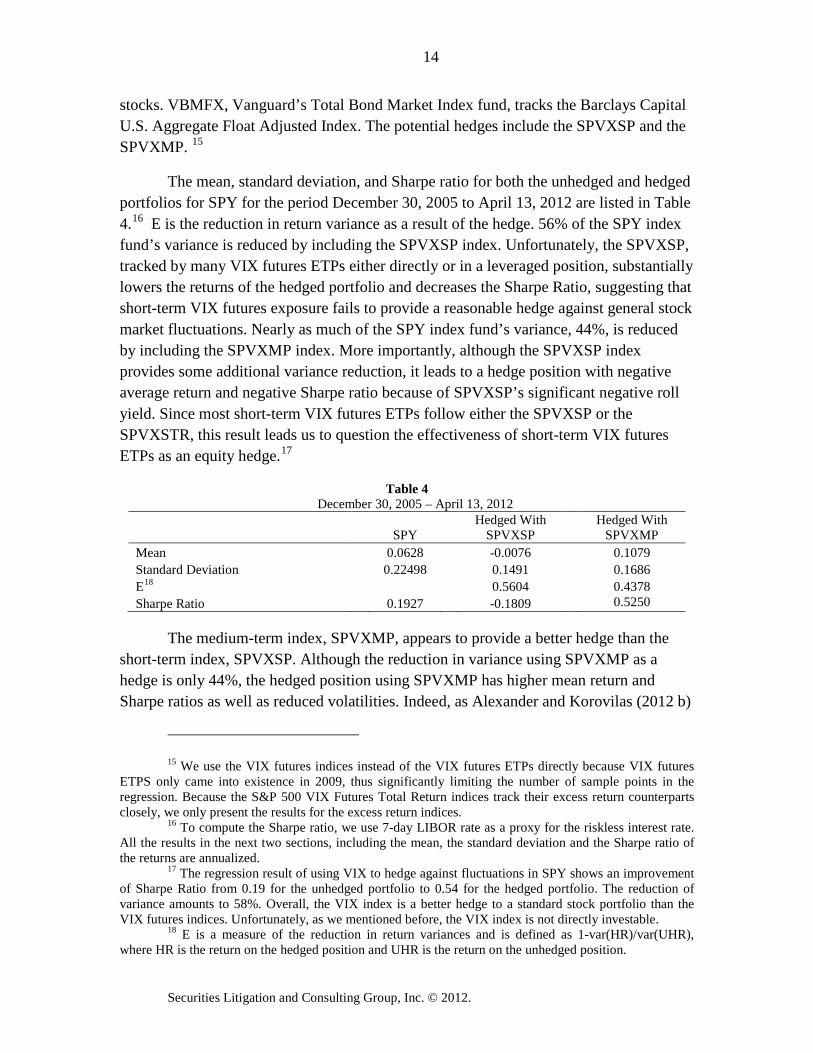
The mean, standard deviation, and Sharpe ratio for both the unhedged and hedged portfolios for SPY for the period December 30, 2005 to April 13, 2012 are listed in Table 4.16 E is the reduction in return variance as a result of the hedge. 56% of the SPY index fund’s variance is reduced by including the SPVXSP index. Unfortunately, the SPVXSP, tracked by many VIX futures ETPs either directly or in a leveraged position, substantially lowers the returns of the hedged portfolio and decreases the Sharpe Ratio, suggesting that short-term VIX futures exposure fails to provide a reasonable hedge against general stock market fluctuations. Nearly as much of the SPY index fund’s variance, 44%, is reduced by including the SPVXMP index. More importantly, although the SPVXSP index provides some additional variance reduction, it leads to a hedge position with negative average return and negative Sharpe ratio because of SPVXSP’s significant negative roll yield. Since most short-term VIX futures ETPs follow either the SPVXSP or the SPVXSTR, this result leads us to question the effectiveness of short-term VIX futures ETPs as an equity hedge.17
Table 4 December 30, 2005 – April 13, 2012
SPY Hedged With
SPVXSP Hedged With
SPVXMP Mean 0.0628 -0.0076 0.1079 Standard Deviation 0.22498 0.1491 0.1686 E18
0.5604 0.4378
Sharpe Ratio 0.1927 -0.1809 0.5250
The medium-term index, SPVXMP, appears to provide a better hedge than the short-term index, SPVXSP. Although the reduction in variance using SPVXMP as a hedge is only 44%, the hedged position using SPVXMP has higher mean return and Sharpe ratios as well as reduced volatilities. Indeed, as Alexander and Korovilas (2012 b)
15 We use the VIX futures indices instead of the VIX futures ETPs directly because VIX futures
ETPS only came into existence in 2009, thus significantly limiting the number of sample points in the regression. Because the S&P 500 VIX Futures Total Return indices track their excess return counterparts closely, we only present the results for the excess return indices.
16 To compute the Sharpe ratio, we use 7-day LIBOR rate as a proxy for the riskless interest rate. All the results in the next two sections, including the mean, the standard deviation and the Sharpe ratio of the returns are annualized.
17 The regression result of using VIX to hedge against fluctuations in SPY shows an improvement of Sharpe Ratio from 0.19 for the unhedged portfolio to 0.54 for the hedged portfolio. The reduction of variance amounts to 58%. Overall, the VIX index is a better hedge to a standard stock portfolio than the VIX futures indices. Unfortunately, as we mentioned before, the VIX index is not directly investable.
18 E is a measure of the reduction in return variances and is defined as 1-var(HR)/var(UHR), where HR is the return on the hedged position and UHR is the return on the unhedged position.
15
Deng, McCann, and Wang
Are VIX Futures ETPs Effective Hedges?
has shown, a portfolio with positive exposure to medium-term VIX futures ETNs and negative exposure to short-term VIX futures ETNs could be a good diversifier for stock and bond portfolios.
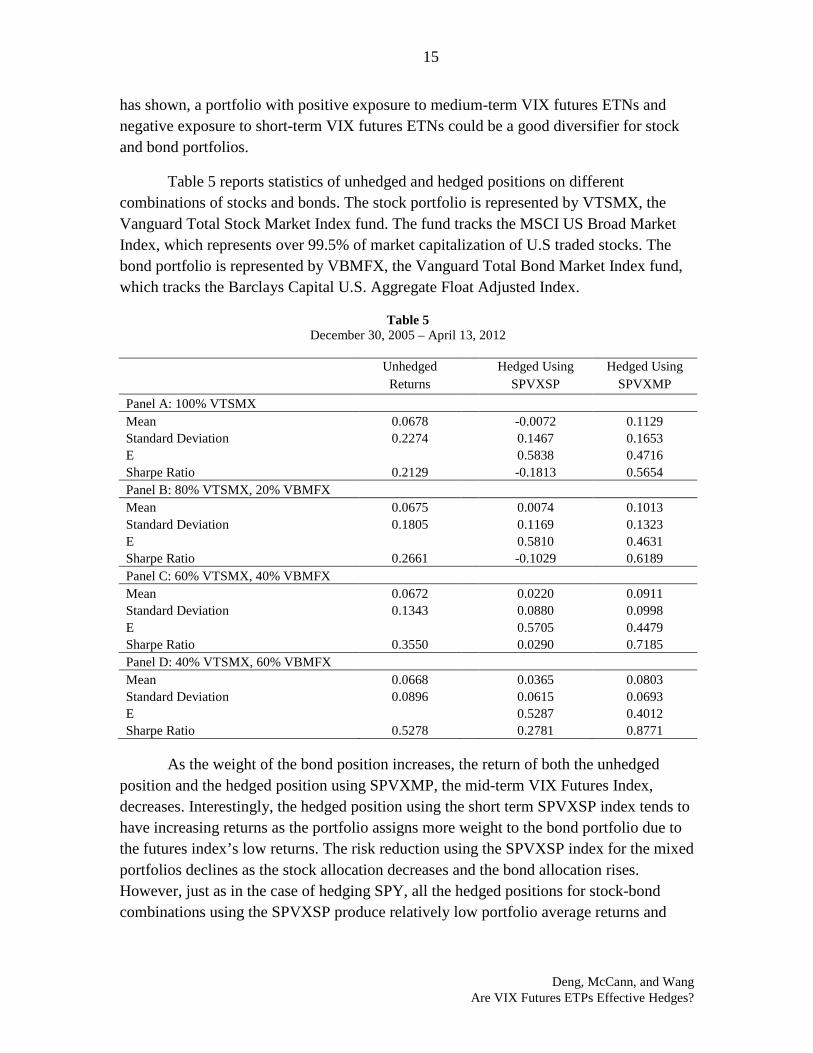
Table 5 reports statistics of unhedged and hedged positions on different combinations of stocks and bonds. The stock portfolio is represented by VTSMX, the Vanguard Total Stock Market Index fund. The fund tracks the MSCI US Broad Market Index, which represents over 99.5% of market capitalization of U.S traded stocks. The bond portfolio is represented by VBMFX, the Vanguard Total Bond Market Index fund, which tracks the Barclays Capital U.S. Aggregate Float Adjusted Index.
Table 5 December 30, 2005 – April 13, 2012
Unhedged
Returns Hedged Using
SPVXSP Hedged Using
SPVXMP Panel A: 100% VTSMX Mean 0.0678 -0.0072 0.1129 Standard Deviation 0.2274 0.1467 0.1653 E
0.5838 0.4716
Sharpe Ratio 0.2129 -0.1813 0.5654 Panel B: 80% VTSMX, 20% VBMFX
Mean 0.0675 0.0074 0.1013 Standard Deviation 0.1805 0.1169 0.1323 E
0.5810 0.4631
Sharpe Ratio 0.2661 -0.1029 0.6189 Panel C: 60% VTSMX, 40% VBMFX
Mean 0.0672 0.0220 0.0911 Standard Deviation 0.1343 0.0880 0.0998 E
0.5705 0.4479
Sharpe Ratio 0.3550 0.0290 0.7185 Panel D: 40% VTSMX, 60% VBMFX
Mean 0.0668 0.0365 0.0803 Standard Deviation 0.0896 0.0615 0.0693 E
0.5287 0.4012
Sharpe Ratio 0.5278 0.2781 0.8771
As the weight of the bond position increases, the return of both the unhedged position and the hedged position using SPVXMP, the mid-term VIX Futures Index, decreases. Interestingly, the hedged position using the short term SPVXSP index tends to have increasing returns as the portfolio assigns more weight to the bond portfolio due to the futures index’s low returns. The risk reduction using the SPVXSP index for the mixed portfolios declines as the stock allocation decreases and the bond allocation rises. However, just as in the case of hedging SPY, all the hedged positions for stock-bond combinations using the SPVXSP produce relatively low portfolio average returns and
16
Securities Litigation and Consulting Group, Inc. © 2012.
negative Sharpe ratios. This illustrates that the ETPs based on the short-term VIX futures index are not ideal hedges.
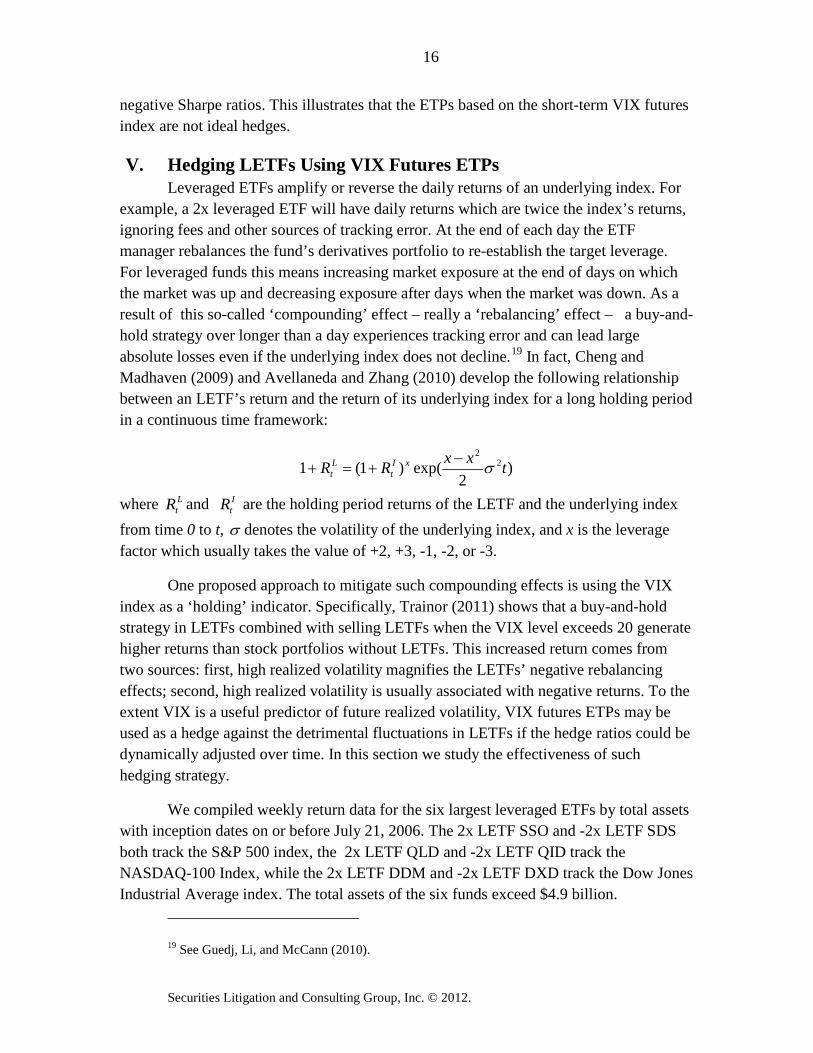
V. Hedging LETFs Using VIX Futures ETPs Leveraged ETFs amplify or reverse the daily returns of an underlying index. For
example, a 2x leveraged ETF will have daily returns which are twice the index’s returns, ignoring fees and other sources of tracking error. At the end of each day the ETF manager rebalances the fund’s derivatives portfolio to re-establish the target leverage. For leveraged funds this means increasing market exposure at the end of days on which the market was up and decreasing exposure after days when the market was down. As a result of this so-called ‘compounding’ effect – really a ‘rebalancing’ effect – a buy-and-hold strategy over longer than a day experiences tracking error and can lead large absolute losses even if the underlying index does not decline.19 In fact, Cheng and Madhaven (2009) and Avellaneda and Zhang (2010) develop the following relationship between an LETF’s return and the return of its underlying index for a long holding period in a continuous time framework:
)2
exp()1(1 22
txxRR xIt
Lt σ−
+=+
where LtR and I
tR are the holding period returns of the LETF and the underlying index from time 0 to t, σ denotes the volatility of the underlying index, and x is the leverage factor which usually takes the value of +2, +3, -1, -2, or -3.
One proposed approach to mitigate such compounding effects is using the VIX index as a ‘holding’ indicator. Specifically, Trainor (2011) shows that a buy-and-hold strategy in LETFs combined with selling LETFs when the VIX level exceeds 20 generate higher returns than stock portfolios without LETFs. This increased return comes from two sources: first, high realized volatility magnifies the LETFs’ negative rebalancing effects; second, high realized volatility is usually associated with negative returns. To the extent VIX is a useful predictor of future realized volatility, VIX futures ETPs may be used as a hedge against the detrimental fluctuations in LETFs if the hedge ratios could be dynamically adjusted over time. In this section we study the effectiveness of such hedging strategy.
We compiled weekly return data for the six largest leveraged ETFs by total assets with inception dates on or before July 21, 2006. The 2x LETF SSO and -2x LETF SDS both track the S&P 500 index, the 2x LETF QLD and -2x LETF QID track the NASDAQ-100 Index, while the 2x LETF DDM and -2x LETF DXD track the Dow Jones Industrial Average index. The total assets of the six funds exceed $4.9 billion.
19 See Guedj, Li, and McCann (2010).
17
Deng, McCann, and Wang
Are VIX Futures ETPs Effective Hedges?
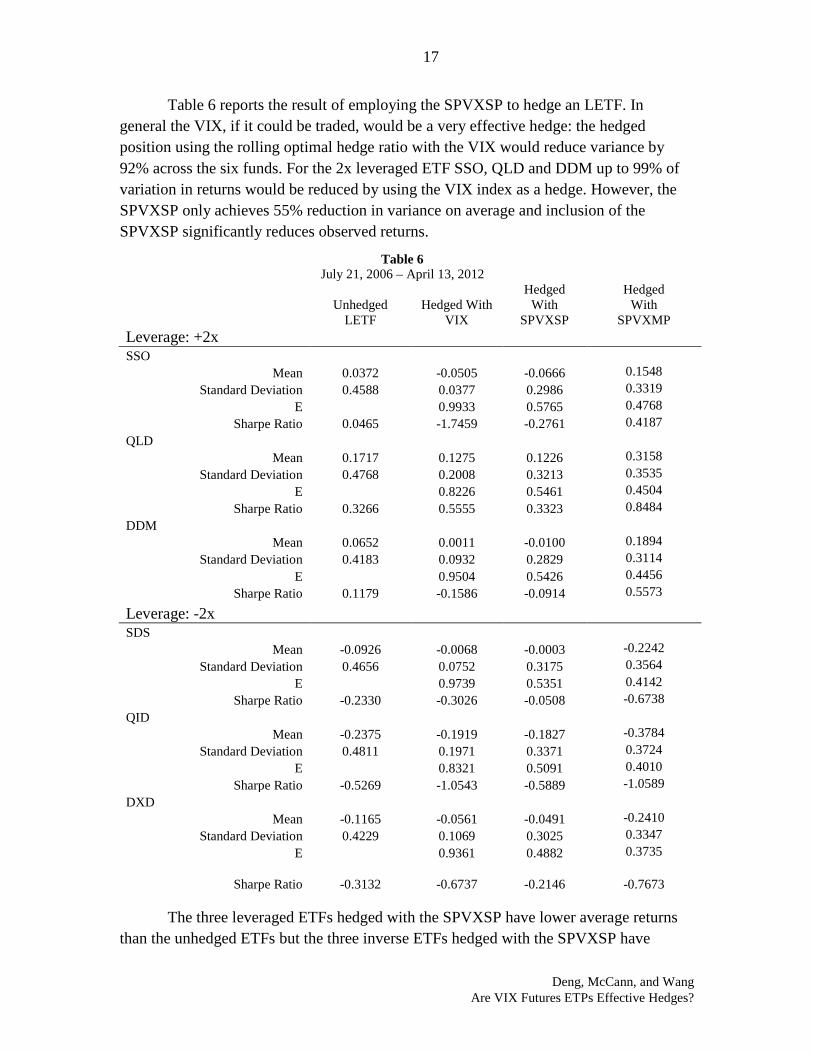
Table 6 reports the result of employing the SPVXSP to hedge an LETF. In general the VIX, if it could be traded, would be a very effective hedge: the hedged position using the rolling optimal hedge ratio with the VIX would reduce variance by 92% across the six funds. For the 2x leveraged ETF SSO, QLD and DDM up to 99% of variation in returns would be reduced by using the VIX index as a hedge. However, the SPVXSP only achieves 55% reduction in variance on average and inclusion of the SPVXSP significantly reduces observed returns.
Table 6 July 21, 2006 – April 13, 2012
Unhedged LETF
Hedged With VIX
Hedged With
SPVXSP
Hedged With
SPVXMP Leverage: +2x SSO
Mean 0.0372 -0.0505 -0.0666 0.1548 Standard Deviation 0.4588 0.0377 0.2986 0.3319
E
0.9933 0.5765 0.4768 Sharpe Ratio 0.0465 -1.7459 -0.2761 0.4187
QLD
Mean 0.1717 0.1275 0.1226 0.3158
Standard Deviation 0.4768 0.2008 0.3213 0.3535 E
0.8226 0.5461 0.4504
Sharpe Ratio 0.3266 0.5555 0.3323 0.8484 DDM
Mean 0.0652 0.0011 -0.0100 0.1894 Standard Deviation 0.4183 0.0932 0.2829 0.3114
E
0.9504 0.5426 0.4456 Sharpe Ratio 0.1179 -0.1586 -0.0914 0.5573
Leverage: -2x SDS
Mean -0.0926 -0.0068 -0.0003 -0.2242 Standard Deviation 0.4656 0.0752 0.3175 0.3564
E
0.9739 0.5351 0.4142 Sharpe Ratio -0.2330 -0.3026 -0.0508 -0.6738
QID
Mean -0.2375 -0.1919 -0.1827 -0.3784
Standard Deviation 0.4811 0.1971 0.3371 0.3724 E
0.8321 0.5091 0.4010
Sharpe Ratio -0.5269 -1.0543 -0.5889 -1.0589 DXD
Mean -0.1165 -0.0561 -0.0491 -0.2410 Standard Deviation 0.4229 0.1069 0.3025 0.3347
E
0.9361 0.4882 0.3735
Sharpe Ratio -0.3132 -0.6737 -0.2146 -0.7673
The three leveraged ETFs hedged with the SPVXSP have lower average returns than the unhedged ETFs but the three inverse ETFs hedged with the SPVXSP have

18
Securities Litigation and Consulting Group, Inc. © 2012.
higher average returns than the unhedged ETFs This shows that although the VIX index would be a hedge for certain LETFs if the VIX were it investable, the SPVXSP is a poor hedge. The SPVXMP provides a good hedge for 2x leveraged funds, but a poor hedge for -2x leveraged funds.
VI. Other Hedging Strategies We explore alternative hedging strategies in addition to the rolling hedge ratio
strategy employed in the previous two sections. First, we use a naïve hedge ratio of 0.6 for both the VIX index and the SPVXSP index. This means in the context of hedging the S&P 500 Stock Total Return Index with the VIX, we use the following formula:
111 *6.0 +++ −= ttt VIXSPHSP
where 1+tHSP is the return of the hedged portfolio at time t+1. The same experiment is also run for a constant hedge ratio of 0.2. In both cases, both the VIX and the SPVXSP index were completely ineffective as hedging instruments: the variances of the hedged portfolios are always larger than the variances of the unhedged portfolios. This shows that without a dynamic hedging strategy, an investor who just bought certain portion of VIX futures ETPs in the hope of hedging against stock market movement may well increase the volatility of his or her portfolio.
The positions hypothetically hedged with the VIX often produce higher standard deviations than those using the SPVXSP because the VIX is more volatile than the SPVXSP. Table 7 shows the result in the naïve hedge ratio case.
Table 7 July 21, 2006 – April 13, 2012
100% VTSMX
Unhedged 0.6, VIX 0.2, VIX 0.6, SPVXSP 0.2, SPVXSP
Mean 0.0698 -0.2559 -0.0388 0.2153 0.1183 Standard Deviation 0.2280 0.8282 0.4118 0.5870 0.3387 Sharpe Ratio 0.2223 -0.3320 -0.1404 0.3341 0.2928
60% VTSMX and 40% VBMFX Mean 0.0677 -0.2581 -0.0409 0.2132 0.1162 Standard Deviation 0.1346 0.7498 0.3252 0.5037 0.2487 Sharpe Ratio 0.3604 -0.3695 -0.1843 0.3851 0.3900
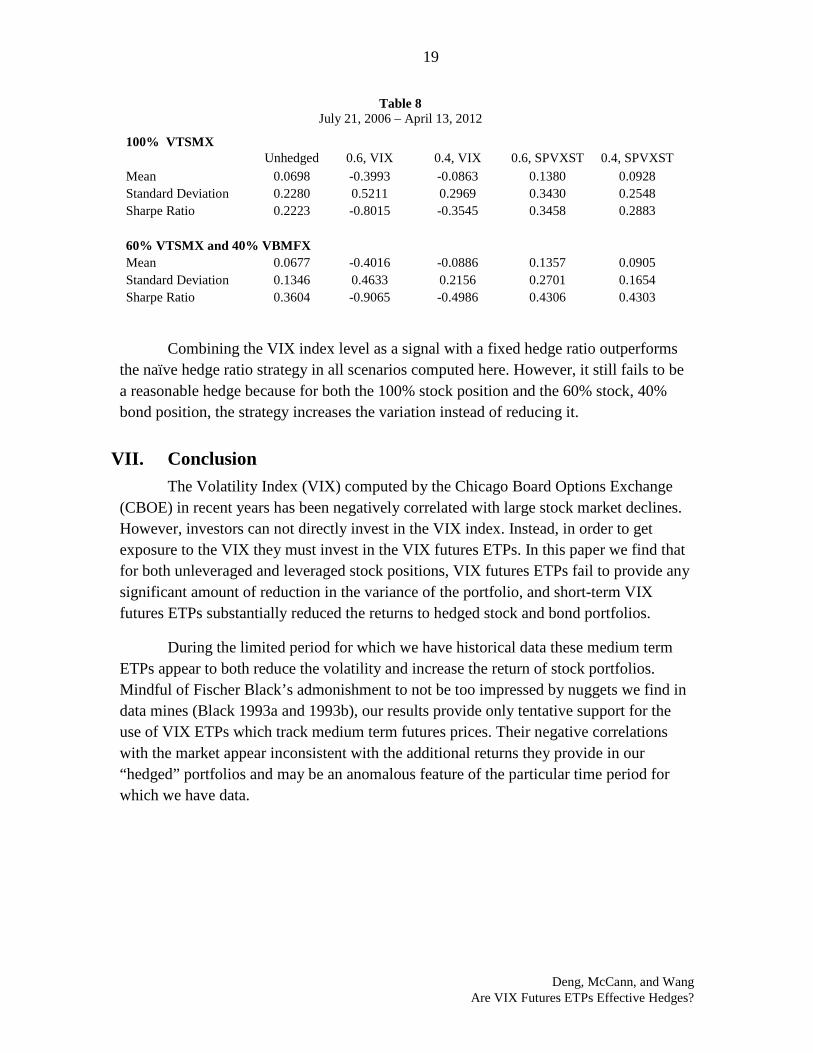
We also examine the VIX index as a trade indicator of the general market volatility, similar to the strategy proposed in Trainor (2011), adopting the following rule: if the VIX level in the previous period is larger than 20, no hedge is used; otherwise either the VIX index or the SPVXSP index is used as a hedge with a constant ratio of 0.6 or 0.2. The result based on a weekly dataset is reported in Table 8.
19
Deng, McCann, and Wang
Are VIX Futures ETPs Effective Hedges?
Table 8 July 21, 2006 – April 13, 2012
100% VTSMX
Unhedged 0.6, VIX 0.4, VIX 0.6, SPVXST 0.4, SPVXST
Mean 0.0698 -0.3993 -0.0863 0.1380 0.0928 Standard Deviation 0.2280 0.5211 0.2969 0.3430 0.2548 Sharpe Ratio 0.2223 -0.8015 -0.3545 0.3458 0.2883
60% VTSMX and 40% VBMFX Mean 0.0677 -0.4016 -0.0886 0.1357 0.0905 Standard Deviation 0.1346 0.4633 0.2156 0.2701 0.1654 Sharpe Ratio 0.3604 -0.9065 -0.4986 0.4306 0.4303
Combining the VIX index level as a signal with a fixed hedge ratio outperforms the naïve hedge ratio strategy in all scenarios computed here. However, it still fails to be a reasonable hedge because for both the 100% stock position and the 60% stock, 40% bond position, the strategy increases the variation instead of reducing it.
VII. Conclusion The Volatility Index (VIX) computed by the Chicago Board Options Exchange
(CBOE) in recent years has been negatively correlated with large stock market declines. However, investors can not directly invest in the VIX index. Instead, in order to get exposure to the VIX they must invest in the VIX futures ETPs. In this paper we find that for both unleveraged and leveraged stock positions, VIX futures ETPs fail to provide any significant amount of reduction in the variance of the portfolio, and short-term VIX futures ETPs substantially reduced the returns to hedged stock and bond portfolios.
During the limited period for which we have historical data these medium term ETPs appear to both reduce the volatility and increase the return of stock portfolios. Mindful of Fischer Black’s admonishment to not be too impressed by nuggets we find in data mines (Black 1993a and 1993b), our results provide only tentative support for the use of VIX ETPs which track medium term futures prices. Their negative correlations with the market appear inconsistent with the additional returns they provide in our “hedged” portfolios and may be an anomalous feature of the particular time period for which we have data.
20
Securities Litigation and Consulting Group, Inc. © 2012.
VIII. Bibliography Alexander, Carol and Dimiris Korovilas (a), Diversification of Equity with VIX Futures: Personal Views and Skewness Preference, working paper, March 2012, available at http://papers.ssrn.com/sol3/papers.cfm?abstract_id=2027580.
Alexander, Carol and Dimiris Korovilas (b), Understanding ETNs on VIX Futures, working paper, April 2012, available at http://papers.ssrn.com/sol3/papers.cfm?abstract_id=2043061.
Black, Fischer, “Beta and Return” Journal of Portfolio Management, 1993a, 74-84.
Black, Fischer, “Estimating Expected Return” Financial Analysts Journal, 1993b, 36-38.
Chen, Hsuan-Chi, San-Lin Chung, and Keng-Yu Ho, “The Diversification Effects of Volatility-related Assets”, Journal of Banking and Finance, Vol. 35, Issue 5, 1179-1189, 2010.
Avellaneda, Marco and Stanley Jian Zhang, “Path-Dependence of Leveraged ETF Returns”, SIAM Journal of Financial Mathematics, 1, 586-603, 2010.
Cheng, Minder and Ananth Madhavan, “The Dynamics of Leveraged and Inverse-Exchange Traded Funds” Journal of Investment Management, Vol.7, No. 4, 43-62, 2009.
Daigler, Robert T., and Laura Rossi, “A Portfolio of Stocks and Volatility”, The Journal of Investing, Vol.15, No. 2, 99–106, 2006.
Dash, Srikant, and Matthew T. Moran, “VIX as a Companion for Hedge Fund Portfolios”, The Journal of Alternative Investments, Vol. 8, No. 3, 75–80, 2005.
Daskalaki, Charoula and George S. Skiadopoulos, “Should Investors Include Commodities in Their Portfolios After All? New Evidence”, Journal of Banking and Finance 35, No.10, 2011.
Deng, Geng and Craig McCann, “The Properties of Short Term Investing in Leveraged ETFs”, Journal of Financial Transformation, forthcoming, 2012.
Figlewski, Stephen, “Hedging with Stock Index Futures: Theory and Application in a New Market”, Journal of Futures Markets, Vol. 5, Issue. 2, 183-199, summer 1985.
Giliberto, S.Michael, “Measuring Real Estate Returns: The Hedged REIT Index”, Journal of Portfolio Management, Vol. 19, No. 3, 94-99, spring 1993.
Gorton, Gary and K. Geert Rouwenhorst, “Facts and Fantasies about Commodity Futures”, Financial Analysts Journal, Vol. 62, No. 2, 47- 68, 2006.
Guedj, Ilan, Guohua Li, and Craig McCann, Leveraged ETFs, Holding Periods and Investment Shortfalls, Journal of Index Investing, Vol. 1, No. 3, 45-57, 2010.
21
Deng, McCann, and Wang
Are VIX Futures ETPs Effective Hedges?
Hafner, Reinhold, and Martin Wallmeier, “Optimal Investments in Volatility,” Financial Markets and Portfolio Management, Vol. 22, No.2, 147–167, 2008.
Hull, John C., Options, Futures & Other Derivatives, Prentice-Hall International, Inc., eighth edition, 2000.
Husson, Tim and Craig McCann, “The VXX ETN and Volatility Exposure” PIABA Bar Journal, Vol 18, No. 24, 235-252, 2011.
Liang, Youguo, Arjun Chatrath, and Willard McIntosh, “Apartment REITs and Apartment Real Estate” Journal of Real Estate Research, Vol.11, Issue 3, 277-290, 1996.
Liang, Youguo, Michael J. Seiler, and Arjun Chatrath, “Are REIT Returns Hedgeable?” Journal of Real Estate Research, Vol.16, Issue 1, 87-98, 1998.
McCann, Craig J., A Note On Stock Trading Models, SLCG working paper, 2001, available at http://slcg.com/pdf/workingpapers/McCann_on_trading_models.pdf.
Standard & Poor’s, S&P 500 Dynamic VIX Futures Index Methodology, 2011, available at http://www.standardandpoors.com/indices/sp-500-dynamic-vix-futures/en/us/?indexId=spcommdvx-usdw-ixp-us------.
Szado, Edward, “VIX Futures and Options – A Case Study of Portfolio Diversification During the 2008 Financial Crisis” The Journal of Alternative Investments 12, 68-85, 2009.
Trainor, William J. Jr., “Solving the Leveraged ETF Compounding Problem”, Journal of Index Investing, Spring 2011.
Warren, Geoffrey J., “Can Investing in Volatility Help Meet Your Portfolio Objectives?”, Journal of Portfolio Management, Vol. 38, No.2, 82-98,Winter 2011.
Zhu, Song-Ping and Guang-Hua Lian, “An Analytical Formula for VIX Futures and its Applications” Journal of Futures Markets, Vol.32, No.2, 166-190, February 2012.