area profile for: teignbridge council
TRANSCRIPT

Page 1 of 52
Area Profile for: Teignbridge Council
Introduction
This area profile provides an overview of the demography of Teignbridge, with
straightforward statistical charts and tables to support this. We provide the
information for local authorities to support their work with ONS field staff, such
as census engagement managers (CEMs) and community advisers (CAs). The data
will help field staff develop their understanding of the area they’ll be working in
during Census 2021, especially ‘hard-to-count’ communities. We took the
information from 2018 mid-year population estimates and responses from the
2011 Census.
Introduction ........................................................................................................................................ 1
1. Population ...................................................................................................................................... 2
2. Hard to Count (HtC) breakdown ............................................................................................ 2
3. Age groups .................................................................................................................................... 5
4. Ethnic groups – non-White British/Irish Population ....................................................... 6
5. Languages in Teignbridge - residents that do not speak English well/cannot
speak English (aged 3+) .............................................................................................................. 13
6. Types of dwelling in Teignbridge ....................................................................................... 20
7. Household spaces in Teignbridge ...................................................................................... 21
8. Top five languages spoken by electoral ward ................................................................ 22
9. Top five ethnic groups by electoral ward ........................................................................ 26
10. Dwelling types by electoral ward ..................................................................................... 31
11. Household spaces by electoral ward .............................................................................. 47

Page 2 of 52
1. Population
Here is an estimated overview of the entire population of Teignbridge, as well as
an estimate of the non-White British/Irish population in Teignbridge.
• The 2018 mid-year population estimate is: 132,844
• The 2011 Census non-White British/Irish population estimate is: 4,241 - (3%
of the 2011 population)
2. Hard to Count (HtC) breakdown
The hard-to-count (HtC) index is a measure of the likelihood of residents in
Teignbridge taking part in Census 2021. There are two domains in the hard-to-
count index. The ‘willingness’ domain measures the likelihood of residents
completing their questionnaires without intervention (that is, without the need
for field follow-up visits or reminder letters). We primarily based this on response
patterns to the 2011 Census and then used administrative data sources to update
the characteristics of an area that determine the index. The ‘digital’ domain
measures the likelihood of residents completing their Census 2021 questionnaire
online. We measure this domain using information about driving licence
applications (online or on paper), broadband uptake and median age group.
Every Lower Super Output Area (LSOA) in England and Wales is assigned a
separate score for the ‘willingness’ and ‘digital’ domains of the HtC index based
on model outcomes. LSOAs are then ranked according to their scores. As the final
line in the table shows, the:
• top 40% of LSOAs in England and Wales are categorised as HtC 1 (easiest-to-
count areas)
• next 40% are categorised as HtC 2
• following 10% are categorised as HtC 3
• next 8% as HtC group 4
• final 2% as HtC group 5 (the hardest-to-count areas)

Page 3 of 52
The maps below show the separate LSOAs in Teignbridge and how they are
individually represented in the ‘willingness’ and ‘digital’ domains. Dark green
areas represent wards that are HtC 1, while red areas are LSOAs identified as
being HtC 5.
Teignbridge HtC 1 HtC 2 HtC 3 HtC 4 HtC 5
Willingness 81% 19% 0% 0% 0%
Digital 23% 45% 24% 8% 0%
England &
Wales
40% 40% 10% 8% 2%
Source: ONS
© OpenStreetMap contributors, © CartoDB

Page 4 of 52
© OpenStreetMap contributors, © CartoDB

Page 5 of 52
3. Age groups
Here is a breakdown of the age of residents in Teignbridge, with averages across
England and Wales included for comparison.
Age Group Age
d 0-
15
Age
d 16-
24
Age
d 25-
49
Age
d 50-
64
Age
d 65-
69
Age
d 70-
74
Age
d 75-
79
Age
d 80-
84
Age
d
85+
Teignbridg
e
16% 8% 27% 23% 7% 7% 5% 3% 4%
England &
Wales
Average
19% 10% 32% 20% 5% 5% 4% 3% 3%
Source: ONS 2018 mid-year population estimates

Page 6 of 52
4. Ethnic groups – non-White British/Irish Population
Here is a breakdown of the non-White British/Irish population, in terms of ethnic
groups, in Teignbridge. The table includes a population count for each non-White
British/Irish ethnic group in Teignbridge. The table also shows how each ethnic
group is represented as a percentage of all non-White British/Irish residents in
Teignbridge.
Ethnic Group Count Percentage
Other White 2,066 49%
Mixed or multiple
ethnic groups
925 22%
Asian Chinese 347 8%
Other Asian 286 7%
Asian Indian 165 4%
Gypsy or Irish Traveller 118 3%
Any other ethnic group 96 2%
Asian Bangladeshi 78 2%
Black Caribbean 52 1%
Black African 48 1%
Other Arab 26 1%
Asian Pakistani 17 0%
Other Black 17 0% Source: ONS 2011 Census Table KS201EW

Page 7 of 52

Page 8 of 52
© OpenStreetMap contributors, © CartoDB

Page 9 of 52
© OpenStreetMap contributors, © CartoDB

Page 10 of 52
© OpenStreetMap contributors, © CartoDB

Page 11 of 52
© OpenStreetMap contributors, © CartoDB

Page 12 of 52
© OpenStreetMap contributors, © CartoDB

Page 13 of 52
5. Languages in Teignbridge - residents that do not
speak English well/cannot speak English (aged 3+)
Here is a breakdown of the languages spoken in Teignbridge by residents who
cannot speak English well or cannot speak English. The population is represented
as a count and as a percentage of all residents who cannot speak English well or
cannot speak English. The data does not include languages spoken less than 1%
of this population in Teignbridge.
Language Count Percentage
Other European
Language (EU): Polish
98 32%
East Asian Language:
All other Chinese
languages
35 11%
East Asian Language:
Cantonese Chinese
32 10%
Russian 18 6%
South Asian Language:
Bengali (with Sylheti
and Chatgaya)
16 5%
Other European
Language (EU):
Lithuanian
12 4%
East Asian Language:
Mandarin Chinese
9 3%
Other European
Language (EU): Slovak
6 2%
Other European
Language (EU):
Hungarian
5 2%
Turkish 4 1%
East Asian Language:
Thai
4 1%
Source: ONS 2011 Census Table CT1132/QS205EW

Page 14 of 52

Page 15 of 52
© OpenStreetMap contributors, © CartoDB

Page 16 of 52
© OpenStreetMap contributors, © CartoDB

Page 17 of 52
© OpenStreetMap contributors, © CartoDB

Page 18 of 52
© OpenStreetMap contributors, © CartoDB

Page 19 of 52
© OpenStreetMap contributors, © CartoDB

Page 20 of 52
6. Types of dwelling in Teignbridge
This table provides a breakdown of the types of residence in Teignbridge. There
is a count of each dwelling type, plus a percentage showing how each dwelling
type is represented among all dwelling types in Teignbridge.
Dwelling type Count Percentage
Whole house or
bungalow: Detached
21,165 37%
Whole house or
bungalow: Semi-
detached
13,883 24%
Whole house or
bungalow: Terraced
(including end-terrace)
13,082 23%
Flat, maisonette or
apartment: Purpose-
built block of flats or
tenement
4,874 8%
Flat, maisonette or
apartment: Part of a
converted or shared
house (including
bedsits)
2,919 5%
Caravan or other
mobile or temporary
structure
1,174 2%
Flat, maisonette or
apartment: In a
commercial building
719 1%
Source: ONS 2011 Census Table KS401EW

Page 21 of 52
7. Household spaces in Teignbridge
This breakdown shows the split between households where there is at least one
usual resident and those where there are no usual residents in Teignbridge. These
data give an idea of the number of second homes or holiday homes there are in
Teignbridge. There is a total for each household space type and a percentage
showing how that household type is represented among all households in
Teignbridge.
Household spaces Count Percentage
Household spaces with
at least one usual
resident
54,003 93%
Household spaces with
no usual residents
3,813 7%
Source: ONS 2011 Census Table KS401EW

Page 22 of 52
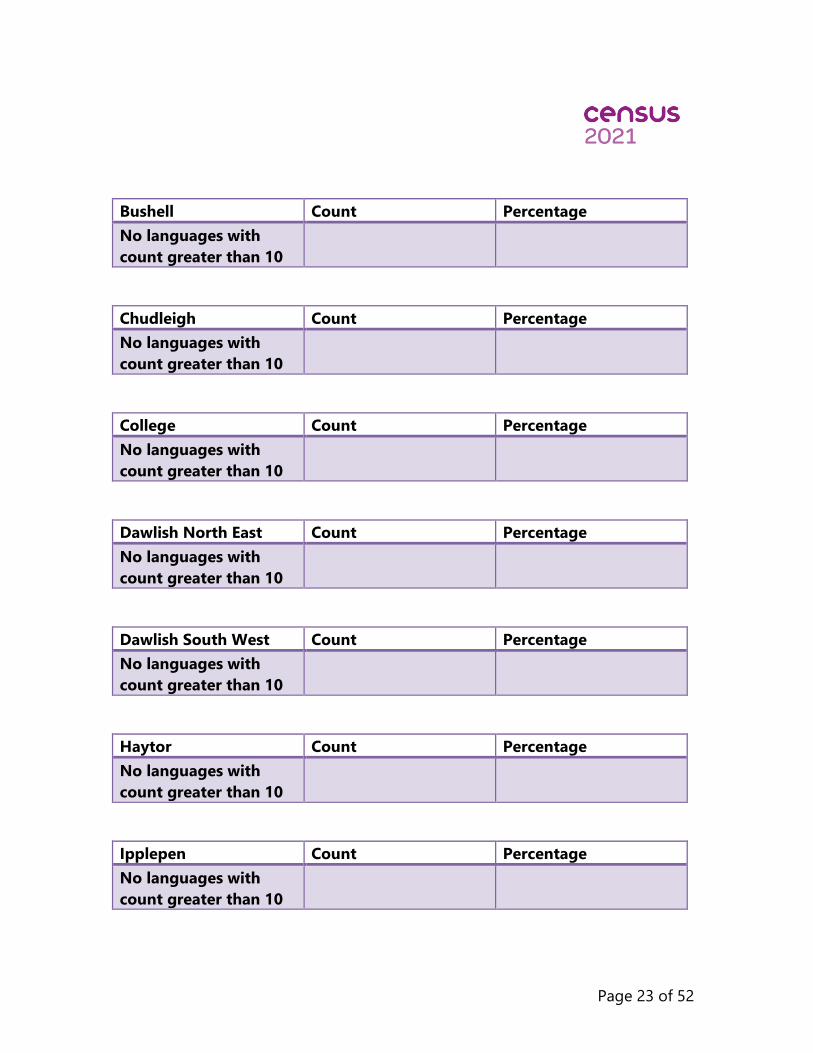
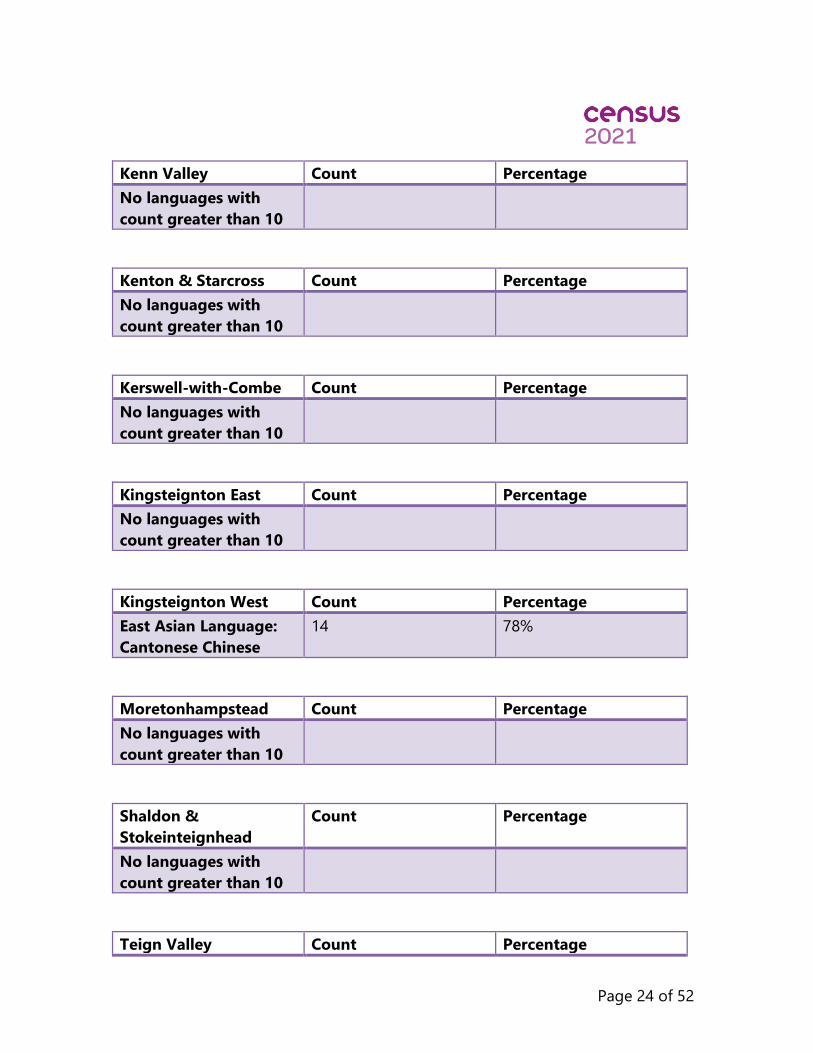
8. Top five languages spoken by electoral ward
The tables below show the top five languages spoken by residents in Teignbridge
who cannot speak English well or cannot speak English. The population is
represented as a count and as a percentage of all residents who cannot speak
English well or cannot speak English. Only languages with a count of more than
10 people are presented.
Ambrook Count Percentage
No languages with
count greater than 10
Ashburton &
Buckfastleigh
Count Percentage
No languages with
count greater than 10
Bishopsteignton Count Percentage
No languages with
count greater than 10
Bovey Count Percentage
No languages with
count greater than 10
Bradley Count Percentage
Other European
Language (EU): Polish
45 87%
Buckland & Milber Count Percentage
No languages with
count greater than 10
Page 23 of 52
Bushell Count Percentage
No languages with
count greater than 10
Chudleigh Count Percentage
No languages with
count greater than 10
College Count Percentage
No languages with
count greater than 10
Dawlish North East Count Percentage
No languages with
count greater than 10
Dawlish South West Count Percentage
No languages with
count greater than 10
Haytor Count Percentage
No languages with
count greater than 10
Ipplepen Count Percentage
No languages with
count greater than 10
Page 24 of 52
Kenn Valley Count Percentage
No languages with
count greater than 10
Kenton & Starcross Count Percentage
No languages with
count greater than 10
Kerswell-with-Combe Count Percentage
No languages with
count greater than 10
Kingsteignton East Count Percentage
No languages with
count greater than 10
Kingsteignton West Count Percentage
East Asian Language:
Cantonese Chinese
14 78%
Moretonhampstead Count Percentage
No languages with
count greater than 10
Shaldon &
Stokeinteignhead
Count Percentage
No languages with
count greater than 10
Teign Valley Count Percentage

Page 25 of 52
No languages with
count greater than 10
Teignmouth Central Count Percentage
East Asian Language:
Cantonese Chinese
11 39%
Teignmouth East Count Percentage
No languages with
count greater than 10
Teignmouth West Count Percentage
No languages with
count greater than 10
Source: ONS 2011 Census Table CT1132/QS205EW

Page 26 of 52
9. Top five ethnic groups by electoral ward
The following tables show the five most populous non-White British/Irish ethnic
groups within separate electoral wards in Teignbridge. There’s a population count
for each ethnic group. The tables also show how each ethnic group is
represented as a percentage of all non-White British/Irish residents in that
electoral ward. Only those ethnic groups with a count of more than 10 are
included here.
Ambrook Count Percentage
Other White 56 38%
Mixed or multiple
ethnic groups
47 32%
Black Caribbean 14 10%
Ashburton &
Buckfastleigh
Count Percentage
Other White 235 57%
Mixed or multiple
ethnic groups
121 29%
Other Asian 20 5%
Bishopsteignton Count Percentage
Other White 32 52%
Mixed or multiple
ethnic groups
13 21%
Bovey Count Percentage
Other White 120 55%
Mixed or multiple
ethnic groups
46 21%
Asian Chinese 23 11%

Page 27 of 52
Bradley Count Percentage
Other White 116 65%
Mixed or multiple
ethnic groups
26 15%
Asian Chinese 11 6%
Buckland & Milber Count Percentage
Other White 80 48%
Mixed or multiple
ethnic groups
42 25%
Asian Chinese 13 8%
Bushell Count Percentage
Other White 189 47%
Mixed or multiple
ethnic groups
69 17%
Asian Chinese 42 10%
Other Asian 32 8%
Chudleigh Count Percentage
Other White 77 46%
Mixed or multiple
ethnic groups
44 26%
Other Asian 15 9%
College Count Percentage
Other White 110 44%
Mixed or multiple
ethnic groups
52 21%
Asian Indian 25 10%

Page 28 of 52
Dawlish North East Count Percentage
Other White 85 48%
Mixed or multiple
ethnic groups
46 26%
Asian Indian 15 8%
Dawlish South West Count Percentage
Other White 114 45%
Mixed or multiple
ethnic groups
45 18%
Asian Indian 27 11%
Haytor Count Percentage
Other White 51 73%
Mixed or multiple
ethnic groups
11 16%
Ipplepen Count Percentage
Other White 24 49%
Kenn Valley Count Percentage
Other White 135 52%
Mixed or multiple
ethnic groups
48 19%
Other Asian 31 12%
Kenton & Starcross Count Percentage
Other White 36 44%
Mixed or multiple
ethnic groups
15 18%

Page 29 of 52
Kerswell-with-Combe Count Percentage
Other White 65 42%
Mixed or multiple
ethnic groups
43 28%
Asian Chinese 15 10%
Kingsteignton East Count Percentage
Other White 62 40%
Mixed or multiple
ethnic groups
43 28%
Other Asian 16 10%
Kingsteignton West Count Percentage
Asian Chinese 45 29%
Mixed or multiple
ethnic groups
42 27%
Other White 37 24%
Gypsy or Irish Traveller 16 10%
Moretonhampstead Count Percentage
Other White 81 65%
Mixed or multiple
ethnic groups
22 18%
Shaldon &
Stokeinteignhead
Count Percentage
Other White 40 57%
Mixed or multiple
ethnic groups
15 21%
Teign Valley Count Percentage

Page 30 of 52
Other White 61 66%
Mixed or multiple
ethnic groups
22 24%
Teignmouth Central Count Percentage
Other White 88 40%
Asian Chinese 67 30%
Mixed or multiple
ethnic groups
32 15%
Other Asian 18 8%
Teignmouth East Count Percentage
Other White 126 53%
Mixed or multiple
ethnic groups
35 15%
Asian Chinese 17 7%
Teignmouth West Count Percentage
Other White 46 34%
Mixed or multiple
ethnic groups
38 28%
Other Asian 14 10% Source: ONS 2011 Census Table KS201EW

Page 31 of 52
10. Dwelling types by electoral ward
These tables provide a breakdown of the types of residences in separate electoral
wards in Teignbridge. For each ward, there’s a count of each dwelling type. The
tables also show how many of each dwelling type there are as a percentage of all
dwelling types in each electoral ward.
Ambrook Count Percentage
Whole house or
bungalow: Detached
918 53%
Whole house or
bungalow: Semi-
detached
400 23%
Whole house or
bungalow: Terraced
(including end-terrace)
340 20%
Caravan or other
mobile or temporary
structure
42 2%
Ashburton &
Buckfastleigh
Count Percentage
Whole house or
bungalow: Detached
1,722 36%
Whole house or
bungalow: Terraced
(including end-terrace)
1,342 28%
Whole house or
bungalow: Semi-
detached
1,158 24%
Flat, maisonette or
apartment: Purpose-
built block of flats or
tenement
199 4%
Flat, maisonette or
apartment: Part of a
192 4%

Page 32 of 52
converted or shared
house (including
bedsits)
Caravan or other
mobile or temporary
structure
86 2%
Flat, maisonette or
apartment: In a
commercial building
77 2%
Bishopsteignton Count Percentage
Whole house or
bungalow: Detached
773 59%
Whole house or
bungalow: Terraced
(including end-terrace)
206 16%
Whole house or
bungalow: Semi-
detached
198 15%
Caravan or other
mobile or temporary
structure
59 5%
Flat, maisonette or
apartment: Part of a
converted or shared
house (including
bedsits)
39 3%
Flat, maisonette or
apartment: Purpose-
built block of flats or
tenement
28 2%
Bovey Count Percentage
Whole house or 1,100 37%

Page 33 of 52
bungalow: Detached
Whole house or
bungalow: Terraced
(including end-terrace)
694 23%
Whole house or
bungalow: Semi-
detached
671 23%
Caravan or other
mobile or temporary
structure
260 9%
Flat, maisonette or
apartment: Purpose-
built block of flats or
tenement
125 4%
Flat, maisonette or
apartment: Part of a
converted or shared
house (including
bedsits)
73 2%
Flat, maisonette or
apartment: In a
commercial building
51 2%
Bradley Count Percentage
Whole house or
bungalow: Semi-
detached
835 39%
Whole house or
bungalow: Detached
637 30%
Whole house or
bungalow: Terraced
(including end-terrace)
529 25%
Flat, maisonette or
apartment: Purpose-
built block of flats or
114 5%

Page 34 of 52
tenement
Flat, maisonette or
apartment: Part of a
converted or shared
house (including
bedsits)
24 1%
Buckland & Milber Count Percentage
Whole house or
bungalow: Detached
1,078 34%
Whole house or
bungalow: Semi-
detached
1,039 33%
Whole house or
bungalow: Terraced
(including end-terrace)
810 26%
Flat, maisonette or
apartment: Purpose-
built block of flats or
tenement
208 7%
Flat, maisonette or
apartment: Part of a
converted or shared
house (including
bedsits)
20 1%
Bushell Count Percentage
Whole house or
bungalow: Terraced
(including end-terrace)
1,126 34%
Flat, maisonette or
apartment: Purpose-
built block of flats or
tenement
693 21%

Page 35 of 52
Whole house or
bungalow: Semi-
detached
679 20%
Whole house or
bungalow: Detached
456 14%
Flat, maisonette or
apartment: Part of a
converted or shared
house (including
bedsits)
263 8%
Flat, maisonette or
apartment: In a
commercial building
108 3%
Chudleigh Count Percentage
Whole house or
bungalow: Detached
924 34%
Whole house or
bungalow: Terraced
(including end-terrace)
790 29%
Whole house or
bungalow: Semi-
detached
672 25%
Flat, maisonette or
apartment: Purpose-
built block of flats or
tenement
115 4%
Flat, maisonette or
apartment: Part of a
converted or shared
house (including
bedsits)
84 3%
Caravan or other
mobile or temporary
structure
73 3%

Page 36 of 52
Flat, maisonette or
apartment: In a
commercial building
25 1%
College Count Percentage
Whole house or
bungalow: Terraced
(including end-terrace)
852 36%
Whole house or
bungalow: Semi-
detached
476 20%
Whole house or
bungalow: Detached
413 18%
Flat, maisonette or
apartment: Purpose-
built block of flats or
tenement
311 13%
Flat, maisonette or
apartment: Part of a
converted or shared
house (including
bedsits)
311 13%
Flat, maisonette or
apartment: In a
commercial building
23 1%
Dawlish North East Count Percentage
Whole house or
bungalow: Detached
1,025 34%
Whole house or
bungalow: Semi-
detached
891 29%
Whole house or
bungalow: Terraced
524 17%

Page 37 of 52
(including end-terrace)
Flat, maisonette or
apartment: Purpose-
built block of flats or
tenement
348 11%
Caravan or other
mobile or temporary
structure
125 4%
Flat, maisonette or
apartment: Part of a
converted or shared
house (including
bedsits)
116 4%
Flat, maisonette or
apartment: In a
commercial building
17 1%
Dawlish South West Count Percentage
Whole house or
bungalow: Detached
1,038 30%
Whole house or
bungalow: Terraced
(including end-terrace)
773 22%
Flat, maisonette or
apartment: Purpose-
built block of flats or
tenement
721 21%
Whole house or
bungalow: Semi-
detached
527 15%
Flat, maisonette or
apartment: Part of a
converted or shared
house (including
bedsits)
379 11%

Page 38 of 52
Flat, maisonette or
apartment: In a
commercial building
80 2%
Haytor Count Percentage
Whole house or
bungalow: Detached
729 59%
Whole house or
bungalow: Semi-
detached
249 20%
Whole house or
bungalow: Terraced
(including end-terrace)
152 12%
Caravan or other
mobile or temporary
structure
68 6%
Flat, maisonette or
apartment: Purpose-
built block of flats or
tenement
16 1%
Flat, maisonette or
apartment: Part of a
converted or shared
house (including
bedsits)
15 1%
Ipplepen Count Percentage
Whole house or
bungalow: Detached
585 52%
Whole house or
bungalow: Semi-
detached
317 28%
Whole house or
bungalow: Terraced
183 16%

Page 39 of 52
(including end-terrace)
Flat, maisonette or
apartment: Purpose-
built block of flats or
tenement
21 2%
Flat, maisonette or
apartment: Part of a
converted or shared
house (including
bedsits)
20 2%
Kenn Valley Count Percentage
Whole house or
bungalow: Detached
1,562 49%
Whole house or
bungalow: Semi-
detached
724 23%
Whole house or
bungalow: Terraced
(including end-terrace)
604 19%
Flat, maisonette or
apartment: Purpose-
built block of flats or
tenement
107 3%
Flat, maisonette or
apartment: Part of a
converted or shared
house (including
bedsits)
91 3%
Caravan or other
mobile or temporary
structure
61 2%
Flat, maisonette or
apartment: In a
commercial building
22 1%

Page 40 of 52
Kenton & Starcross Count Percentage
Whole house or
bungalow: Detached
439 31%
Whole house or
bungalow: Semi-
detached
438 31%
Whole house or
bungalow: Terraced
(including end-terrace)
429 30%
Flat, maisonette or
apartment: Part of a
converted or shared
house (including
bedsits)
59 4%
Flat, maisonette or
apartment: Purpose-
built block of flats or
tenement
52 4%
Kerswell-with-Combe Count Percentage
Whole house or
bungalow: Detached
1,249 48%
Whole house or
bungalow: Semi-
detached
764 29%
Whole house or
bungalow: Terraced
(including end-terrace)
315 12%
Flat, maisonette or
apartment: Part of a
converted or shared
house (including
bedsits)
117 4%

Page 41 of 52
Flat, maisonette or
apartment: Purpose-
built block of flats or
tenement
93 4%
Caravan or other
mobile or temporary
structure
62 2%
Flat, maisonette or
apartment: In a
commercial building
18 1%
Kingsteignton East Count Percentage
Whole house or
bungalow: Detached
988 38%
Whole house or
bungalow: Semi-
detached
891 34%
Whole house or
bungalow: Terraced
(including end-terrace)
533 20%
Flat, maisonette or
apartment: Purpose-
built block of flats or
tenement
146 6%
Flat, maisonette or
apartment: Part of a
converted or shared
house (including
bedsits)
40 2%
Caravan or other
mobile or temporary
structure
29 1%
Kingsteignton West Count Percentage

Page 42 of 52
Whole house or
bungalow: Detached
822 35%
Whole house or
bungalow: Semi-
detached
710 30%
Whole house or
bungalow: Terraced
(including end-terrace)
671 29%
Flat, maisonette or
apartment: Purpose-
built block of flats or
tenement
61 3%
Flat, maisonette or
apartment: Part of a
converted or shared
house (including
bedsits)
42 2%
Caravan or other
mobile or temporary
structure
26 1%
Flat, maisonette or
apartment: In a
commercial building
18 1%
Moretonhampstead Count Percentage
Whole house or
bungalow: Detached
746 50%
Whole house or
bungalow: Semi-
detached
343 23%
Whole house or
bungalow: Terraced
(including end-terrace)
316 21%
Flat, maisonette or
apartment: Part of a
39 3%

Page 43 of 52
converted or shared
house (including
bedsits)
Flat, maisonette or
apartment: In a
commercial building
23 2%
Flat, maisonette or
apartment: Purpose-
built block of flats or
tenement
21 1%
Shaldon &
Stokeinteignhead
Count Percentage
Whole house or
bungalow: Detached
577 41%
Whole house or
bungalow: Terraced
(including end-terrace)
341 24%
Whole house or
bungalow: Semi-
detached
266 19%
Flat, maisonette or
apartment: Part of a
converted or shared
house (including
bedsits)
111 8%
Flat, maisonette or
apartment: Purpose-
built block of flats or
tenement
99 7%
Flat, maisonette or
apartment: In a
commercial building
19 1%
Caravan or other
mobile or temporary
12 1%

Page 44 of 52
structure
Teign Valley Count Percentage
Whole house or
bungalow: Detached
1,088 55%
Whole house or
bungalow: Semi-
detached
392 20%
Caravan or other
mobile or temporary
structure
242 12%
Whole house or
bungalow: Terraced
(including end-terrace)
197 10%
Flat, maisonette or
apartment: Part of a
converted or shared
house (including
bedsits)
31 2%
Flat, maisonette or
apartment: Purpose-
built block of flats or
tenement
11 1%
Flat, maisonette or
apartment: In a
commercial building
10 1%
Teignmouth Central Count Percentage
Whole house or
bungalow: Detached
867 39%
Whole house or
bungalow: Semi-
detached
470 21%
Whole house or 413 18%

Page 45 of 52
bungalow: Terraced
(including end-terrace)
Flat, maisonette or
apartment: Purpose-
built block of flats or
tenement
291 13%
Flat, maisonette or
apartment: Part of a
converted or shared
house (including
bedsits)
206 9%
Teignmouth East Count Percentage
Whole house or
bungalow: Detached
853 31%
Flat, maisonette or
apartment: Purpose-
built block of flats or
tenement
749 27%
Flat, maisonette or
apartment: Part of a
converted or shared
house (including
bedsits)
495 18%
Whole house or
bungalow: Terraced
(including end-terrace)
286 10%
Whole house or
bungalow: Semi-
detached
231 8%
Flat, maisonette or
apartment: In a
commercial building
168 6%

Page 46 of 52
Teignmouth West Count Percentage
Whole house or
bungalow: Terraced
(including end-terrace)
656 29%
Whole house or
bungalow: Detached
576 25%
Whole house or
bungalow: Semi-
detached
542 24%
Flat, maisonette or
apartment: Purpose-
built block of flats or
tenement
338 15%
Flat, maisonette or
apartment: Part of a
converted or shared
house (including
bedsits)
145 6%
Flat, maisonette or
apartment: In a
commercial building
16 1%
Source: ONS 2011 Census Table KS401EW

Page 47 of 52
11. Household spaces by electoral ward
These tables show the split between households with at least one usual resident
and those where there are no usual residents in separate electoral wards in
Teignbridge. This information gives an idea of the number of second homes or
holiday homes in each ward in Teignbridge. The tables show each space type as a
count and as a percentage of all households in electoral wards in Teignbridge.
Ambrook Count Percentage
Household spaces with
at least one usual
resident
1,668 97%
Household spaces with
no usual residents
52 3%
Ashburton &
Buckfastleigh
Count Percentage
Household spaces with
at least one usual
resident
4,444 93%
Household spaces with
no usual residents
332 7%
Bishopsteignton Count Percentage
Household spaces with
at least one usual
resident
1,216 93%
Household spaces with
no usual residents
93 7%
Bovey Count Percentage
Household spaces with
at least one usual
resident
2,862 96%

Page 48 of 52
Household spaces with
no usual residents
112 4%
Bradley Count Percentage
Household spaces with
at least one usual
resident
2,076 97%
Household spaces with
no usual residents
67 3%
Buckland & Milber Count Percentage
Household spaces with
at least one usual
resident
3,058 97%
Household spaces with
no usual residents
103 3%
Bushell Count Percentage
Household spaces with
at least one usual
resident
3,145 95%
Household spaces with
no usual residents
181 5%
Chudleigh Count Percentage
Household spaces with
at least one usual
resident
2,534 94%
Household spaces with
no usual residents
149 6%
College Count Percentage

Page 49 of 52
Household spaces with
at least one usual
resident
2,236 94%
Household spaces with
no usual residents
153 6%
Dawlish North East Count Percentage
Household spaces with
at least one usual
resident
2,759 91%
Household spaces with
no usual residents
287 9%
Dawlish South West Count Percentage
Household spaces with
at least one usual
resident
3,216 91%
Household spaces with
no usual residents
307 9%
Haytor Count Percentage
Household spaces with
at least one usual
resident
1,176 96%
Household spaces with
no usual residents
55 4%
Ipplepen Count Percentage
Household spaces with
at least one usual
resident
1,078 95%
Household spaces with 57 5%

Page 50 of 52
no usual residents
Kenn Valley Count Percentage
Household spaces with
at least one usual
resident
3,000 95%
Household spaces with
no usual residents
171 5%
Kenton & Starcross Count Percentage
Household spaces with
at least one usual
resident
1,336 94%
Household spaces with
no usual residents
92 6%
Kerswell-with-Combe Count Percentage
Household spaces with
at least one usual
resident
2,462 94%
Household spaces with
no usual residents
156 6%
Kingsteignton East Count Percentage
Household spaces with
at least one usual
resident
2,503 95%
Household spaces with
no usual residents
128 5%
Kingsteignton West Count Percentage

Page 51 of 52
Household spaces with
at least one usual
resident
2,228 95%
Household spaces with
no usual residents
122 5%
Moretonhampstead Count Percentage
Household spaces with
at least one usual
resident
1,339 90%
Household spaces with
no usual residents
155 10%
Shaldon &
Stokeinteignhead
Count Percentage
Household spaces with
at least one usual
resident
1,154 81%
Household spaces with
no usual residents
271 19%
Teign Valley Count Percentage
Household spaces with
at least one usual
resident
1,822 92%
Household spaces with
no usual residents
149 8%
Teignmouth Central Count Percentage
Household spaces with
at least one usual
resident
2,097 93%

Page 52 of 52
Household spaces with
no usual residents
159 7%
Teignmouth East Count Percentage
Household spaces with
at least one usual
resident
2,445 88%
Household spaces with
no usual residents
337 12%
Teignmouth West Count Percentage
Household spaces with
at least one usual
resident
2,149 95%
Household spaces with
no usual residents
125 5%
Source: ONS 2011 Census Table KS401EW