areachangeofglaciersacrossnorthernellesmereisland,nunavut ......mm of precipitation per year...
TRANSCRIPT

Area change of glaciers across Northern Ellesmere Island, Nunavut,between ∼1999 and ∼2015
ADRIENNE WHITE, LUKE COPLAND
Department of Geography, Environment, and Geomatics, University of Ottawa, Ottawa, Ontario, CanadaCorrespondence: Adrienne White <[email protected]>
ABSTRACT. Using a variety of optical satellite scenes, this study quantifies the change in the areal extentof 1773 glaciers across Northern Ellesmere Island between ∼1999 and ∼2015. Our results show that theregional ice coverage decreased by 1705.3 km2 over the ∼16-year period, a loss of ∼5.9%. Ice shelveshad the greatest losses relative to their size, of ∼42.4%. Glaciers feeding into ice shelves reduced in areaby 4.7%, while tidewater glaciers reduced in area by 3.3%. Marine-terminating glaciers with floating icetongues reduced in area by 4.9%, and 19 of these 27 ice tongues disintegrated, causing these glaciers toretreat to their grounding lines. Land-terminating glaciers lost 4.9% of their 1999 area, including thecomplete loss of three small ice caps (<1.5 km2). Our study highlights the high sensitivity of the icecover of Northern Ellesmere Island to recent climate warming and the continued losses that are likelyto occur in the future. In particular, the ice masses most susceptible to further losses are marine-termin-ating glaciers with floating termini and small land-terminating ice caps at low elevations.
KEYWORDS: Arctic glaciology, climate change, glacier fluctuations
1. INTRODUCTIONThe Canadian Arctic Archipelago (CAA) contains ∼150 000km2 of glacier ice, making this region the most glaciated inthe world outside of Greenland and Antarctica (Pfeffer andothers, 2014). Based on satellite gravimetry measurements,this region has become the single largest contributor toeustatic sea-level rise outside of the major ice sheets since2003 (Harig and Simons, 2016), during a period of rapidwarming of glacier surface temperatures (Mortimer andothers, 2016). The ice in this area can be separated intotwo groups, the southern area that spans Baffin (∼36 839km2) and Bylot (∼4859 km2) islands, and the northern area(107 488 km2) that spans the Queen Elizabeth Islands, ofwhich 27 556 km2 (all ∼1960 areas) is located on NorthernEllesmere Island (Fig. 1; Andrews, 2002; Sharp and others,2014).
The first detailed measurements of glacier thickness andvolume change across Northern Ellesmere Island were con-ducted by Abdalati and others (2004), who used repeat air-borne altimetry measurements over the period 1995–2000to calculate changes of −3.52 km3 a−1 (the highest rate ofice volume loss compared with all other ice caps in theCAA). Sharp and others (2014) performed measurements ofthe area change of glaciers (excluding ice shelves) onNorthern Ellesmere Island up to the year 2000, by using iceextents from 1956 to 1961 derived from aerial photographyand 2000 extents delineated using an unsupervised classifi-cation of Landsat 7 ETM+ and ASTER imagery. Their studyrevealed that Northern Ellesmere experienced a reductionin glaciated area of 927 km2 (3.4% of initial area) over thisperiod, the greatest area loss of all regions measured acrossthe CAA. The largest mean percentage area changes forNorthern Ellesmere occurred from glaciers <1 km2 in area,which lost an average of 29.2% of their initial ice area.Since 2000, a few studies have been conducted onNorthern Ellesmere Island to assess changes in ice shelfarea (e.g., Copland and others, 2007; Mueller and others,
2017a, b) and the changes of individual ice caps (Braunand others, 2004; Serreze and others, 2017), but no detailedregional assessment of glacier changes has been conducted.
Here we present a comprehensive inventory of thenumber and extent of all glaciers on Northern EllesmereIsland, using satellite data acquired between 1999 and2016. This is the first study to present recent area changemeasurements for this region and to analyze the spatial vari-ability in glacier change in relation to terrain controls. Ourdata will be made available in the Global Land IceMeasurements from Space (GLIMS) database (http://www.glims.org).
1.1. Study areaEllesmere Island is the largest island in the Queen ElizabethIslands, with an area of 196 236 km2 and a length of 830km (Fig. 1). The island is the most mountainous in the CAAand can be separated into different ice regions from northto south that includes Northern Ellesmere Icefield, AgassizIce Cap, Prince of Wales Icefield, Manson Icefield andSydkap Icefield (Fig. 1). The study area of NorthernEllesmere is separated from the rest of Ellesmere Island bythe Hazen Plateau and Greely Fiord and has a maximum ele-vation of 2616 m at Barbeau Peak (Fig. 2). Lake Hazen is alarge inland lake, with a surface area of 537.5 km2, whichstretches in a southwest-northeast direction in the southeastpart of Northern Ellesmere (Fig. 2). The Northern EllesmereIcefield spans the majority of the island, while ice shelvesand marine-terminating glaciers flow off the northern coast-line. Smaller ice caps, such as Grant and Ad Astra, surroundthe main ice caps, but the majority are unnamed.
The climate regime of Northern Ellesmere varies betweenthe coastal regions, interior lowlands and highlands. Thecoastal waters contain a mix of first- and multi-year ice. Insummer, fall and early winter (during the sea-ice consolida-tion period), the varying coverage of sea ice and open
Journal of Glaciology (2018), Page 1 of 15 doi: 10.1017/jog.2018.49© The Author(s) 2018. This is an Open Access article, distributed under the terms of the Creative Commons Attribution licence (http://creativecommons.org/licenses/by/4.0/), which permits unrestricted re-use, distribution, and reproduction in any medium, provided the original work is properly cited.

water leads to high frequencies of fog and low cloud over thechannels and along the coastlines (Maxwell, 1981). Theinterior lowlands are surrounded by mountains whichcause a rain shadow that results in low mean precipitation,while exposed slopes at higher elevations receive >200mm of precipitation per year (Maxwell, 1981). At Eurekaweather station, ∼100 km to the southwest of the NorthernEllesmere Icefield, mean monthly precipitable water rangedfrom 1.8 mm in late winter to 12 mm in July between 1961and 2007, with a 10% increase in mean annual precipitablewater over this period (Fig. 1; Lesins and others, 2010). Theincrease in precipitable water has been dominated byincreases during the spring, summer and fall, with the great-est increase occurring during summer at a rate of 0.3 mmdecade−1 since 1961. Over the 54-year period, the stationrecorded a mean air temperature of −19.1°C.
2. DATA AND METHODSArea changes for each glacier were determined from opticalsatellite imagery within the periods ∼1999 (period 1) and∼2015 (period 2) (Table 1). These periods were selected toprovide the broadest temporal range with the highest reso-lution imagery, primarily from Landsat 7 (ETM+) andLandsat 8 (OLI). The north coast of Ellesmere Island wasbeyond the orbit of Landsat 7 in 1999, so ASTER imagery
from 2002 and 2003 was used instead, covering 5.2% ofthe total glaciated area. Glacier coverage for Ward HuntIce Shelf and for glaciers along the far north-east coast ofNorthern Ellesmere (comprising ∼4.5% of the total glaciatedarea) was not available for 1999–2003, so Formosat-2imagery from 2008 and ASTER imagery from 2009 wasused in its place for period 1. Due to the lack of satellitecoverage over the Markham Ice Shelf for period 1 (Fig. 2),the extent (from 2003) was obtained from Mueller andothers (2017a). In the second period, Landsat 8 imageryfrom 2015 and 2016 provided complete coverage of thestudy area.
2.1. Basin boundariesThe ice cover across Northern Ellesmere Island was dividedinto individual drainage basins using a combination of eleva-tion data and optical satellite imagery. Basins were deli-neated using a pre-release version of the ArcticDEM, aDEM with 8 m resolution constructed by the PolarGeospatial Center (University of Minnesota) from in-track,high-resolution (∼0.5 m) Digital Globe imagery from 2012–15. A polygon shapefile was delineated for each drainagebasin by using the Basin tool in ESRI ArcGIS 10.3.1. Tocreate the basins, sinks were filled and an eight-direction(D8) flow model was used, which determines the flow direc-tion of each raster cell based on the steepest path of the eightsurrounding cells (Jenson and Domingue, 1988). The auto-mated basin outlines were verified visually against the2015/16 Landsat 8 mosaic using visible features such asflow lines, and adjusted as necessary.
2.2. Glacier outlinesAn outline of the ice extent was delineated for each glacierand nunatak from orthorectified ASTER (15 m resolution)and Landsat imagery (30 m resolution enhanced with the15 m panchromatic band) and georeferenced Formosat-2imagery (8 m resolution) (Table 1). Images with little to nocloud cover acquired during late summer were preferentiallyselected due to their minimal snow cover. Pan-sharpenedLandsat 8 images acquired in 2015/16 were mosaickedand used as the master image against which all other satelliteimages were aligned (Fig. 2; bolded scenes in Table 1). EightASTER images and one Formosat-2 image were georefer-enced to the Landsat mosaic using 13–20 ground controlpoints (GCPs), depending on the amount of flat and stablebedrock available in the scene. Georectification was com-pleted using a zero-order polynomial shift in ESRI ArcGIS10.3.1, which resulted in root mean square errors (RMSE)ranging from 15.02 to 21.80 m (Table 1). One Formosat-2image was transformed using a first-order polynomial trans-formation and had an RMSE of 21.81 m. All other imagerywas well-aligned and did not require modification.
During the digitization process, pan-sharpened Landsatscenes were displayed in both true colour and false colour;the false colour composites were represented with bands 4,3 and 1 (for both Landsat 7 and Landsat 8) in the red, greenand blue (RGB) channels, respectively. ASTER scenes wererepresented with bands 3, 2 and 1 in the RGB channels. Toavoid misclassification, only glaciers >0.1 km2 in area(in 1999) were digitized in this study, although glaciers thatshrank to areas <0.1 km2 during the second period ofstudy were included for continuity of the dataset.
Fig. 1. Queen Elizabeth Islands, Canada. The study region is shownby the dark grey area on Northern Ellesmere Island. Ice outlines (inlight grey) from 1999 for Axel Heiberg, Devon, and SouthernEllesmere Island were acquired from GLIMS (http://www.glims.org/maps/glims).
2 White and Copland: Area change of glaciers across Northern Ellesmere Island, Nunavut, between ∼1999 and ∼2015

Once the ice extents and ice divides had been defined,nunataks were subtracted from these outlines so that eachpolygon represented only the area of ice and not internalrock. The image acquisition dates were used to convertmeasured area (in km2) of the two time periods into standar-dized rates of percentage change per decade. Each glacierwas assigned a unique ID following the format outlinedby GLIMS, which incorporates centroid coordinates ofeach glacier (Raup and Khalsa, 2010). The official namewas included for glaciers with a name assigned in theCanadian Geographical Names Data Base of NaturalResources Canada (http://www4.rncan.gc.ca/search-place-names/search).
2.3. Terrain parametersIn total, 11 terrain variables were derived for the glaciers (in∼2015) measured in this study to examine the influence ofphysiography on area losses. The coordinates of the centroidof each glacier were extracted. The minimum, maximum andmean elevation, mean slope, flow length and mean aspect foreach glacier were extracted from the ArcticDEM using theSpatial Analyst extension in ArcGIS 10.3.1. The east-westand north-south scalar aspects were derived from the sineand cosine of the mean of these scalar aspects (Copland,1998). The main terminus for each glacier was visuallyassessed and classified into one of five types:
(a) Land-terminating glaciers refers to all outlet glaciersand ice caps that terminate on land, and in this
study includes glaciers with proglacial lakes or glaciersthat calve into the proglacial lakes of neighbouringglaciers.
(b) Tidewater glaciers are marine-terminating ice massesthat are grounded on the sea floor (Dowdeswell andJeffries, 2017). These glaciers were distinguished bytheir lack of extension away from the coastline andlack of tidal cracks. This category also includesglaciers flowing into ice shelves but without visual evi-dence of becoming incorporated into the ice shelf.Also included are coastal ice caps that flow into thesea. Note that if any land is apparent between the ter-minus and the coastline, the glacier is classified asland-terminating.
(c) Ice tongues are the floating extensions of single valleyglaciers over the ocean (Mueller and others, 2017a, b).In this study, ice tongues are classified as floatingtermini that extend into a bay or fiord and include icefragments clustered together and frozen in place bysea ice around the terminus.
(d) Ice shelves comprise extensive, permanent floatinglandfast ice features that are >20 m thick (Dowdeswelland Jeffries, 2017). In this study, ice shelves were iden-tifiable by their characteristic undulating surface topog-raphy and their infilling of bays and fiords along thenorthern coastline.
(e) Ice shelf-terminating refers to glaciers that flow into iceshelves. Although these glaciers contribute directly tothe ice shelves, they are separated from the ice shelf asper the GLIMS procedure (Raup and Khalsa, 2010).
Fig. 2. Landsat OLI/TIRS mosaic (Table 1) of Northern Ellesmere Island showing the outlines classified by terminating environment in (a)1999–2008; (b) 2015/16. Labels show the locations of the basins referred to throughout the study. Note: Northern Ellesmere Icefield isoutlined with a thick black line.
3White and Copland: Area change of glaciers across Northern Ellesmere Island, Nunavut, between ∼1999 and ∼2015

2.4. Changes in accumulation area ratio (AAR)To provide an estimate of the changes in AAR of the ice coverof Northern Ellesmere Island, the hypsometry of this regionwas compared with estimates of the changes in equilibriumline altitude (ELA) over the study period. The ELA acrossNorthern Ellesmere Island at the start of period 1 was deter-mined from digitizing the map of Wolken and others(2008), which in turn was recreated from Miller and others(1975). Wolken and others (2008) describe this map as repre-senting the ELA in 1960, but we assume that this ELA isbroadly representative of conditions at the start of period1. This is based on mass-balance measurements on otherQueen Elizabeth Islands ice caps which show generallyweak trends over this period (Koerner, 2005; Thomson andothers, 2017), and the observation that average glaciermass balance was five times more negative between 2005and 2009 than 1963–2004 (Sharp and others, 2014). Since1999, we estimate that the ELA on Northern Ellesmere hasrisen by ∼100–300 m, based on measurements at WhiteGlacier (Fig. 1) (mean ELA 1960–1998= 1022 m; meanELA 1999–2014= 1205 m; Thomson and others, 2017)and measurements on northern Agassiz Ice Cap that indicate
the 2014/15 ELA was 300 m above the 1977–2015 mean(Burgess, 2017).
2.5. Error analysisTo calculate error associated with the alignment and reso-lution of the satellite imagery, we used the method definedby Hall and others (2003). The uncertainty in the change ofthe ice extent in the linear dimension (d) between two satel-lite images was calculated from (after Williams and others,1997):
d ¼ffiffiffiffiffiffiffiffiffiffiffiffiffiffiffir21 þ r22
qþ RMSE; ð1Þ
where r1 is the cell size of the first image, r2 is the cell sizeof the second image and RMSE is the error calculatedduring the georectification process (Table 1). The finest reso-lution (15 m) and the highest RMSE value (21.81 m) wereused in this calculation. The linear uncertainty was convertedto area uncertainty using (after Hall and others, 2003):
a ¼ A2dx
� �; ð2Þ
Table 1. Satellite scenes used to delineate glacier extents in this study. Landsat and ASTER images were obtained from the US GeologicalSurvey Earth Explorer (https://earthexplorer.usgs.gov/). Formosat-2 image obtained from Planet Action (http://www.planet-action.org/#).Images used in the 2015/16 mosaic (Fig. 2; the master image against which all other imagery was georeferenced) are shown in bold
Sensor Scene ID Acquisition date Resolution Number of GCPs RMSEm m
ASTER AST_L1 T_00306212002211846 30-Jul-02 15 15 20.21ASTER AST_L1 T_00308142002222030 10-Aug-02 15 23 15.02ASTER AST_L1 T_00308142002222039 10-Aug-02 15 15 19.13ASTER AST_L1 T_00308142002222021 10-Aug-02 15 15 21.80ASTER AST_L1 T_00307182003220559 08-Aug-03 15 13 17.99ASTER AST_L1 T_00307182003220550 08-Aug-03 15 – –
ASTER AST_L1 T_00307182003220541 08-Aug-03 15 15 18.63ASTER AST_L1 T_00307162009204046 23-Jul-09 15 20 18.62ASTER AST_L1 T_00307102009211741 30-Jul-09 15 – –
ASTER AST_L1 T_00307102009211750 30-Jul-09 15 15 17.94Landsat ETM+ LE70462481999202EDC00 21-Jul-99 15 – –
Landsat ETM+ LE70622471999202EDC00 21-Jul-99 15 – –
Landsat ETM+ LE70442471999204EDC00 23-Jul-99 15 – –
Landsat ETM+ LE70442481999204EDC00 23-Jul-99 15 – –
Landsat ETM+ LE70512461999205EDC01 24-Jul-99 15 – –
Landsat ETM+ LE70512471999205EDC01 24-Jul-99 15 – –
Landsat ETM+ LE70512481999205EDC01 24-Jul-99 15 – –
Landsat ETM+ LE70612461999211EDC00 30-Jul-99 15 – –
Formosat-2 FS2_20080828_171027_MS_124580000 28-Aug-08 8 13 21.81
Landsat OLI LC80512472015193LGN00 12-Jul-15 15 – –
Landsat OLI LC80492472015195LGN00 14-Jul-15 15 – –
Landsat OLI LC80492482015195LGN00 14-Jul-15 15 – –
Landsat OLI LC80402482015196LGN00 15-Jul-15 15 – –
Landsat OLI LC80562472015196LGN00 15-Jul-15 15 – –
Landsat OLI LC80522472015200LGN00 19-Jul-15 15 – –
Landsat OLI LC80482482015204LGN00 23-Jul-15 15 – –
Landsat OLI LC80462472015222LGN00 10-Aug-15 15 – –
Landsat OLI LC80462482015222LGN00 10-Aug-15 15 – –
Landsat OLI LC80442472015224LGN00 12-Aug-15 15 – –
Landsat OLI LC80512472015225LGN00 13-Aug-15 15 – –
Landsat OLI LC80422472015226LGN00 14-Aug-15 15 – –
Landsat OLI LC80422482015226LGN00 14-Aug-15 15 – –
Landsat OLI LC80582472015226LGN00 14-Aug-15 15 – –
Landsat OLI LC80580012015226LGN00 14-Aug-15 15 – –
Landsat OLI LC80602472015240LGN00 28-Aug-15 15 – –
Landsat OLI LC80402472016199LGN00 17-Jul-16 15 – –
4 White and Copland: Area change of glaciers across Northern Ellesmere Island, Nunavut, between ∼1999 and ∼2015

where A= x2 and x= linear side dimension (15 m). This cal-culation produced an error of ±0.0013 km2.
To calculate human error that may occur during the digit-ization process, the same operator digitized three differentglaciers from the dataset for Northern Ellesmere, of differingsizes, environments, and locations, at a consistent scale of1: 10 000. Each glacier was digitized five times for eachtime period using imagery from the study. G85164W81925N,G75159W81335N and G69499W82211N were selectedbased on their range in size, distribution and terminal environ-ment: G85164W81925N (5.99 km2 in 1999) is a marine-terminating glacier in the northeast, G75159W81335N (1.00km2 in 1999) is a small ice cap in the southern region, andG69499W82211N (254.52 km2 in 1999) is a large land-terminating glacier in the western region (Fig. 2). The meanerror for both time periods varied between 0.004 km2
(0.07%) for G85164W81925N, 0.004 km2 (0.69%) forG75159W81335N and 0.136 km2 (0.05%) for G69499W82211N. The largest of these errors (0.14 km2) wassummed with the satellite error (0.0013 km2) to provide atotal error. Based on these error calculations, glacier areachanges were considered significant if they were>0.14 km2.
2.6. Climate dataTo examine climate conditions since 1950, NCEP/NCARReanalysis monthly mean data was downloaded from theNOAA Earth System Research Laboratory website (http://www.esrl.noaa.gov/psd/data/reanalysis/reanalysis.shtml).These data are drawn from an assimilated gridded (2.5° × 2.5°grid) dataset, based on observations from the land surface,ship, rawinsonde, piloted balloon, aircraft, satellite andother data (Kalnay and others, 1996). It should be notedthat NCEP/NCAR data prior to 1979 are of a lower qualityto the lack of assimilation data, although this is consideredto be of minor significance as this study is primarily con-cerned with changes in conditions since ∼1999. For thisstudy, mean monthly surface air temperatures from 1948 to2016 were analyzed for grid cells centered on NorthernEllesmere Island from 80.587–83.190°N to 60.678–92.296°W. This climate dataset was verified by comparing observa-tions collected by an automatic weather station in PurpleValley (Fig. 2) over the period 2008–16 to the NCEP/NCAR
data gridcell centered on this region (82.500°N, −80.999°W). The close resemblance between these datasets (Fig. 3)suggests that the reanalysis data are suitable for assessingtrends in air temperature across Northern Ellesmere.
3. RESULTS
3.1. Regional glacier inventoryFor ∼2015 a total of 1768 glaciers were identified, compris-ing 1702 land-terminating glaciers, 45 tidewater glaciers,eight marine-terminating glaciers with ice tongues, six iceshelf terminating glaciers and seven ice shelves or remnantice shelves (Table 2; Fig. 2b and Fig. 4a). Land-terminatingglaciers made up the highest proportion of the total icearea (63.4%), followed by tidewater glaciers (18.2%)(Table 2; Fig. 4a). Glaciers between 0.1 and 1 km2 in sizemade up 43.3% of the total number of glaciers, but only1.2% of their total area (Fig. 4b). In contrast, the majority(40.8%) of glaciers were between 100 and 1000 km2 insize (Fig. 4b). The largest single ice mass is M’ClintockGlacier (G75759W82147N), a marine-terminating glacierwith an ice tongue, measuring 1468.4 km2 in area and witha centreline flow length of ∼44 km (Fig. 2). The majority ofindividual glaciers had a north-east facing aspect, while themajority of the total ice area had a north-facing aspect(Fig. 4c).
Mean glacier elevation ranged from 19 m a.s.l. (M’ClintockIce Shelf; G77428W83023N) to 1519 m a.s.l. (G73513W81780N). Turnstone Glacier (G74388W81792N) had thehighest maximum elevation (2603 m a.s.l.) as it flowedfrom Barbeau Peak. Overall, 54.1% of glaciers had a meanelevation between 500 and 1000 m a.s.l., with <1%having a mean elevation <100 m a.s.l. (Fig. 4d). There wasa fairly strong relationship (r2= 0.253, P= 3.23 × 10−44)between maximum elevation and glacier area (Fig. 4e),with the highest elevations concentrated from east to westalong the main spine of the icefields. Glaciers with icetongues had the highest mean difference in the highest andlowest points of elevation: 1595.0 m, compared with iceshelves with the lowest mean relief of 33.4 m. Glacierslope varied inversely with glacier area (r2= 0.3055, P=5.53 × 10⁻¹⁹), with smaller glaciers tending to be steeper(Fig. 4f). By glacier type, ice shelves tended to have the
Fig. 3. Comparison of NCEP/NCAR Reanalysis and AWS mean monthly surface air temperature datasets from May 2008 to November 2016for Purple Valley, Northern Ellesmere Island. November 2012 AWS data omitted due to sensor error.
5White and Copland: Area change of glaciers across Northern Ellesmere Island, Nunavut, between ∼1999 and ∼2015
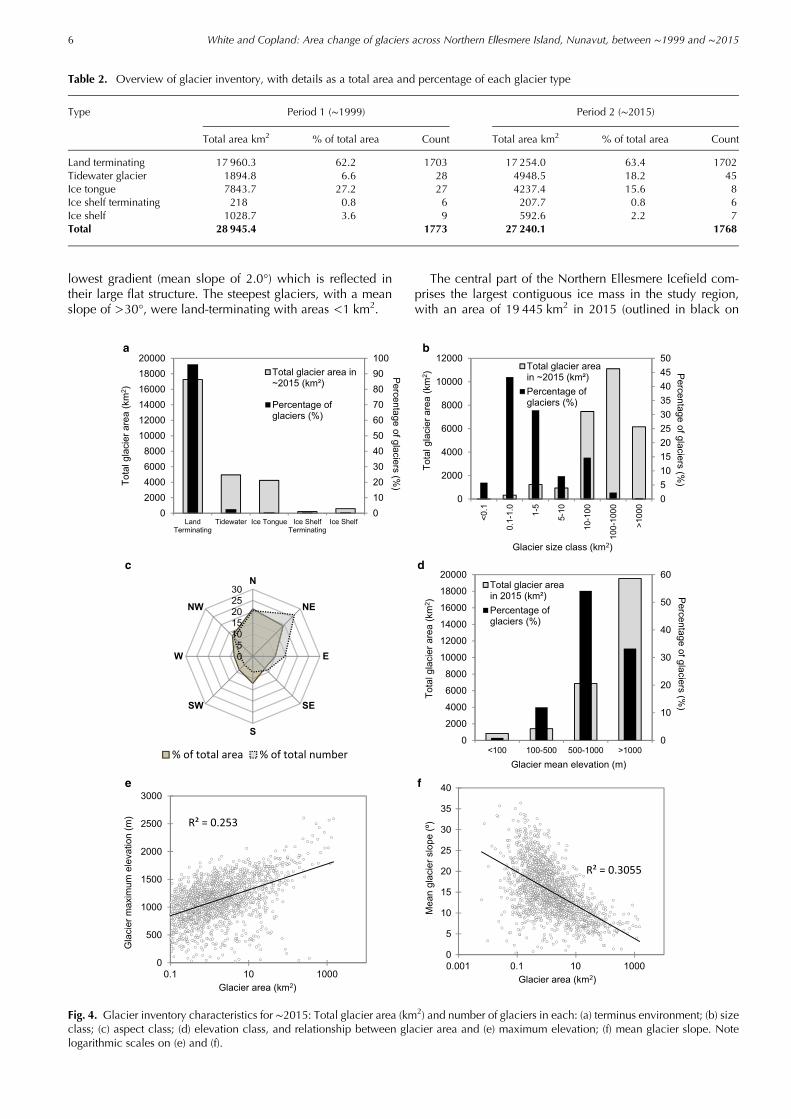
lowest gradient (mean slope of 2.0°) which is reflected intheir large flat structure. The steepest glaciers, with a meanslope of >30°, were land-terminating with areas <1 km2.
The central part of the Northern Ellesmere Icefield com-prises the largest contiguous ice mass in the study region,with an area of 19 445 km2 in 2015 (outlined in black on
Table 2. Overview of glacier inventory, with details as a total area and percentage of each glacier type
Type Period 1 (∼1999) Period 2 (∼2015)
Total area km2 % of total area Count Total area km2 % of total area Count
Land terminating 17 960.3 62.2 1703 17 254.0 63.4 1702Tidewater glacier 1894.8 6.6 28 4948.5 18.2 45Ice tongue 7843.7 27.2 27 4237.4 15.6 8Ice shelf terminating 218 0.8 6 207.7 0.8 6Ice shelf 1028.7 3.6 9 592.6 2.2 7Total 28 945.4 1773 27 240.1 1768
Fig. 4. Glacier inventory characteristics for ∼2015: Total glacier area (km2) and number of glaciers in each: (a) terminus environment; (b) sizeclass; (c) aspect class; (d) elevation class, and relationship between glacier area and (e) maximum elevation; (f) mean glacier slope. Notelogarithmic scales on (e) and (f).
6 White and Copland: Area change of glaciers across Northern Ellesmere Island, Nunavut, between ∼1999 and ∼2015
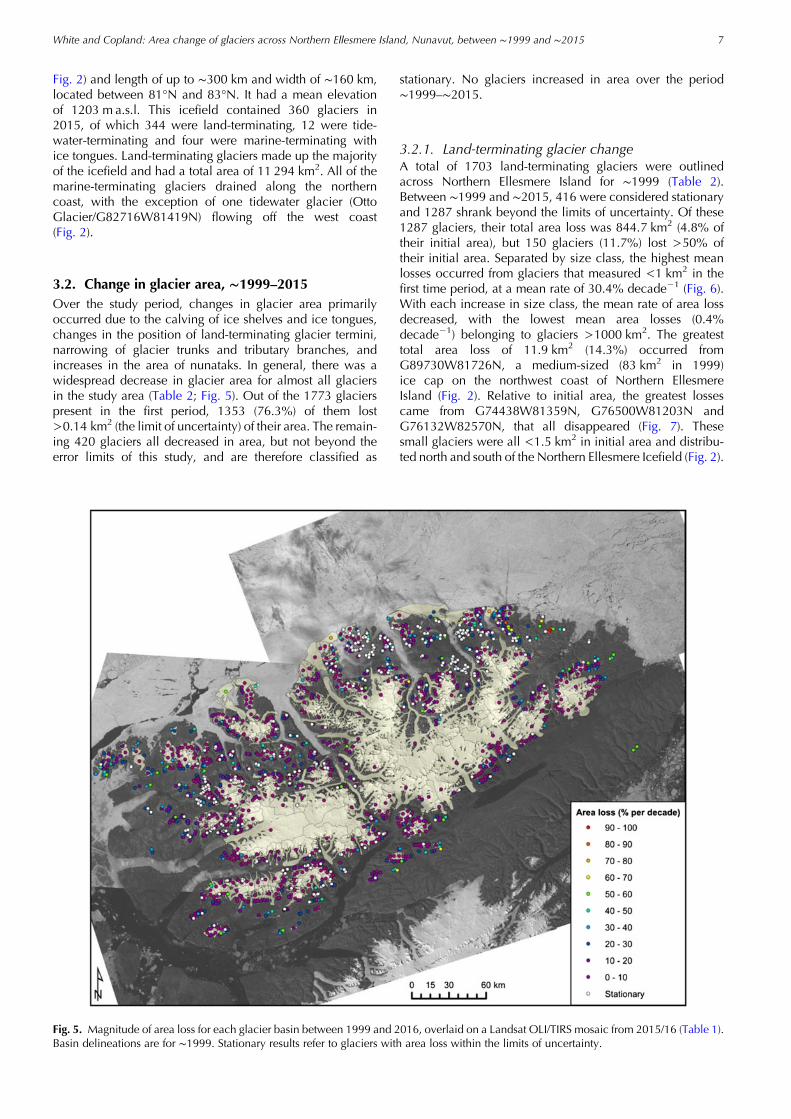
Fig. 2) and length of up to ∼300 km and width of ∼160 km,located between 81°N and 83°N. It had a mean elevationof 1203 m a.s.l. This icefield contained 360 glaciers in2015, of which 344 were land-terminating, 12 were tide-water-terminating and four were marine-terminating withice tongues. Land-terminating glaciers made up the majorityof the icefield and had a total area of 11 294 km2. All of themarine-terminating glaciers drained along the northerncoast, with the exception of one tidewater glacier (OttoGlacier/G82716W81419N) flowing off the west coast(Fig. 2).
3.2. Change in glacier area, ∼1999–2015Over the study period, changes in glacier area primarilyoccurred due to the calving of ice shelves and ice tongues,changes in the position of land-terminating glacier termini,narrowing of glacier trunks and tributary branches, andincreases in the area of nunataks. In general, there was awidespread decrease in glacier area for almost all glaciersin the study area (Table 2; Fig. 5). Out of the 1773 glacierspresent in the first period, 1353 (76.3%) of them lost>0.14 km2 (the limit of uncertainty) of their area. The remain-ing 420 glaciers all decreased in area, but not beyond theerror limits of this study, and are therefore classified as
stationary. No glaciers increased in area over the period∼1999–∼2015.
3.2.1. Land-terminating glacier changeA total of 1703 land-terminating glaciers were outlinedacross Northern Ellesmere Island for ∼1999 (Table 2).Between ∼1999 and ∼2015, 416 were considered stationaryand 1287 shrank beyond the limits of uncertainty. Of these1287 glaciers, their total area loss was 844.7 km2 (4.8% oftheir initial area), but 150 glaciers (11.7%) lost >50% oftheir initial area. Separated by size class, the highest meanlosses occurred from glaciers that measured <1 km2 in thefirst time period, at a mean rate of 30.4% decade−1 (Fig. 6).With each increase in size class, the mean rate of area lossdecreased, with the lowest mean area losses (0.4%decade−1) belonging to glaciers >1000 km2. The greatesttotal area loss of 11.9 km2 (14.3%) occurred fromG89730W81726N, a medium-sized (83 km2 in 1999)ice cap on the northwest coast of Northern EllesmereIsland (Fig. 2). Relative to initial area, the greatest lossescame from G74438W81359N, G76500W81203N andG76132W82570N, that all disappeared (Fig. 7). Thesesmall glaciers were all <1.5 km2 in initial area and distribu-ted north and south of the Northern Ellesmere Icefield (Fig. 2).
Fig. 5. Magnitude of area loss for each glacier basin between 1999 and 2016, overlaid on a Landsat OLI/TIRS mosaic from 2015/16 (Table 1).Basin delineations are for ∼1999. Stationary results refer to glaciers with area loss within the limits of uncertainty.
7White and Copland: Area change of glaciers across Northern Ellesmere Island, Nunavut, between ∼1999 and ∼2015

3.2.2. Tidewater glacier changeA total of 28 glaciers were classified as tidewater in ∼1999,with a total area of 1894.8 km2 (Table 2). By ∼2015, 24 tide-water glaciers had shrunk and lost a total area of 61.9 km2,3.3% of the initial ice area, at a mean rate of 8.7%decade−1. Four glaciers did not lose area beyond the limitof uncertainty and were therefore classified as stationary.According to size class, the smallest tidewater glaciers(three glaciers measuring 1–5 km2) had the greatest meanloss of 22.9% decade−1 (Fig. 6). Similar to land-terminatingglaciers, as the size class increased the mean rate of iceloss decreased with the exception of tidewater glaciersbetween 500 and 1000 km2 that had a higher mean loss(2.7% decade−1) than glaciers 100–500 km2 (1.8%decade−1). The greatest total area loss occurred from OttoGlacier (G82716W81419N), the largest tidewater glacieron Northern Ellesmere, which lost 19.5 km2, 1.6% of itsinitial ice area. However, this glacier is a known surge-typeglacier (Hattersley-Smith, 1969; Copland and others, 2003),which may explain some of these losses. The highestrelative rate of area loss occurred from G74911W83042Nand G91546W81713N which both lost ∼27% decade−1.Two glaciers (Bent Glacier/G78692W81412N, andG85628W82087N) retreated to the point of becomingland-terminating.
3.2.3. Ice tongue changeIn the first period, 27 marine-terminating glaciers with icetongues were identified along the northern coast ofEllesmere Island, covering an area of 7843.7 km2 (Table 2).All 23 glaciers shrank by the year ∼2015, with a total lossof 313.98 km2, or 3.6% of their initial area at a mean rateof 6.1% decade−1. Classed by size, glaciers with icetongues between 1 and 5 km2 had the highest mean arealoss of 11.4% decade−1 (Fig. 6). Of the 23 glaciers with icetongues measured, only eight remained by the secondperiod: G79570W82808N, Ayles (G80489W82741N),Serson (G84958W82170N), G79117W82870N, G80481W81907N, Disraeli (G72723W82423N), Milne (G78878W82327N) and M’Clintock (G75759W82147N) glaciers.The remaining 19 retreated toward their grounding lines,causing the glaciers to lose their ice tongues and becomeclassified as tidewater glaciers instead (Fig. 8). The greatesttotal area loss occurred from Disraeli Glacier, with a loss of35.6 km2, equivalent to 2.7% of its initial area. The greatestrate of area loss, relative to its area, occurred fromG80169W82886N at 15.5% decade−1.
3.2.4. Ice shelf changeBetween 1999 and 2009, nine ice shelves and/or iceshelf remnants were identified along the northern coastline
Fig. 6. Mean rate of glacier loss (% decade−1) for glaciers that lost mass between ∼1999 and ∼2015 for each glacier type (as classifiedinitially), separated into size classes.
Fig. 7. Outlines from 1999 of small ice caps that lost 100% of their area: (a) G74438W81359N overlaid on Landsat 8 image from 12 July 2015(#7 on Fig. 2a); (b) G76500W81203N (eastern-most basin) overlaid on Landsat 8 image from 14 July 2015 (#13 on Fig. 2a); and (c)G76132W82570N overlaid on Landsat 8 image from 12 July 2015 (#12 on Fig. 2a).
8 White and Copland: Area change of glaciers across Northern Ellesmere Island, Nunavut, between ∼1999 and ∼2015

of Northern Ellesmere Island with a total area of 1028.7 km2
(Table 2). From west to east, these comprise theSerson (G86130W82356N), Wooton (G84583W82434N),Petersen (G82050W82526N), Milne (G81511W82702N),Ayles (G80719W82854N), East Ayles (G79679W82827N),M’Clintock (G77428W83023N), Ward Hunt (G74723W83074N) and Markham (G71378W83067N) ice shelves.By ∼2015, the ice shelves lost 436.1 km2 of ice area,42.4% of their original area. The greatest total area lossoccurred from the Serson Ice Shelf (G86130W82356N),which lost 137.58 km2, leaving behind a small ice shelffragment on the northeast coast of Serson Bay. The Markham(G71378W83067N; 49.1 km2) and Ayles (G80719W82854N; 75.4 km2) ice shelves lost their entire area.
3.2.5. Ice shelf terminatingIn ∼1999, six glaciers terminating into ice shelves occurredalong the northern coast of Ellesmere Island, contributingmass to the Petersen, Milne and East Ayles ice shelves. By∼2015, these glaciers continued to flow into these iceshelves, but had lost a total area of 10.3 km2, at a meanrate of 4.2% decade−1. The greatest total area loss of 3.5km2 occurred from G81767W82616N, a glacier flowinginto the south-west region of the Milne Ice Shelf(G81511W82702N). The greatest loss relative to initial sizeoccurred to G81776W82542N, a glacier flowing into thenorth-east side of Petersen Ice Shelf, which lost 15.4% at arate of 9% decade−1.
3.3. Relationship between area changes and terrainTo better understand the potential relationships between arealosses and physiography, 11 terrain variables (Section 2.3;Table 3) were acquired from the 1346 glaciers that under-went shrinkage between ∼1999 and ∼2015 and had cover-age in the ArcticDEM. The terminus environment foreach glacier was classified as 1 if it terminated off the
coast and 0 if it terminated on land. Glaciers that under-went considerable change prior to the acquisition of the2012–15 satellite imagery used to generate theArcticDEM, such as Serson Ice Shelf, were excluded fromthe terrain analysis.
Once the terrain analysis had been completed, principalcomponent analysis (PCA) was used to determine the rela-tionship between terrain variables and remove collinearitybetween them. The PCA identified four significant compo-nents (eigenvalue >1) (Table 3). Component 1 is primarilyan altitude factor that describes glaciers with highminimum, maximum and mean elevations, which tend tohave steeper slopes and terminate on land. Component 2 isprimarily a size factor that describes glaciers with longerflow lengths and larger areas, which also tend to reach tohigher maximum and mean elevations. Component 3 is alocation factor, dominated by glaciers that are located inareas that are further north and east than average.Component 4 is a north-facing aspect factor.
Over the period of study, components 2 and 3 were sig-nificantly (P< 0.0001) correlated with the % decade−1
area changes (Table 3). Component 2 was the most importantfactor (r=−0.461), which indicates that the biggest %decade−1 changes occurred on relatively short and small gla-ciers at lower elevations. Component 3 (r= 0.205) suggeststhat greater area losses occurred in the north-east. Whenthe terrain factors for component 2 are plotted against areachanges (Fig. 9), this reaffirms the fact that the terrainfactors within component 2 are significantly correlated witharea loss (P< 0.0001). The component 3 terrain factors, lati-tude and longitude, have a significant (P< 0.001) but theweak positive relationship with area changes; r2= 0.022and r2= 0.007, respectively.
From these analyses, it is apparent that glacier size, ele-vation and flow length have been the dominant topographiccontrols on glacier shrinkage over the period ∼1999–2015.In this case, the highest shrinkage rates occurred on small,short, low elevation glaciers. This is consistent with ourresults that show higher area changes from the small iso-lated remnant ice caps that surround the main icefields(Figs 6, 7). For example, ice masses that lost >50%decade−1 (with the exception of ice shelves) had initialareas <5.4 km2, maximum elevations <1676 m and flowlengths <4745 m.
Fig. 8. Outlines showing the loss of floating ice tongues between1999 and 2015 from glaciers entering Yelverton Bay, NorthernEllesmere Island: (a) G81795W82368N (south; #27 on Fig. 2); and(b) G822234W82440N (north; #29 on Fig. 2), overlaid on Landsat8 image from 12 July 2015.
Table 3. Factor loadings for each significant principal component(eigenvalue >1) identified in the PCA. Bolded values indicate dom-inant terrain parameter(s) for each principal component
Principal component 1 2 3 4
Latitude −0.248 −0.015 0.898 −0.102Longitude 0.333 0.263 0.799 −0.225Minimum elevation 0.839 −0.134 0.000 −0.055Maximum elevation 0.540 0.750 −0.013 0.082Mean elevation 0.831 0.512 −0.065 0.044Mean slope 0.590 −0.244 0.139 0.407Flow length −0.325 0.891 −0.077 0.048Area (1999–2003) −0.263 0.807 −0.038 0.153Mean east-west aspect −0.003 −0.155 0.248 0.162Mean north-south aspect −0.114 −0.141 0.201 0.845Land or water terminating −0.541 0.331 0.139 0.134
Eigenvalue 2.687 2.569 1.598 1.022
9White and Copland: Area change of glaciers across Northern Ellesmere Island, Nunavut, between ∼1999 and ∼2015

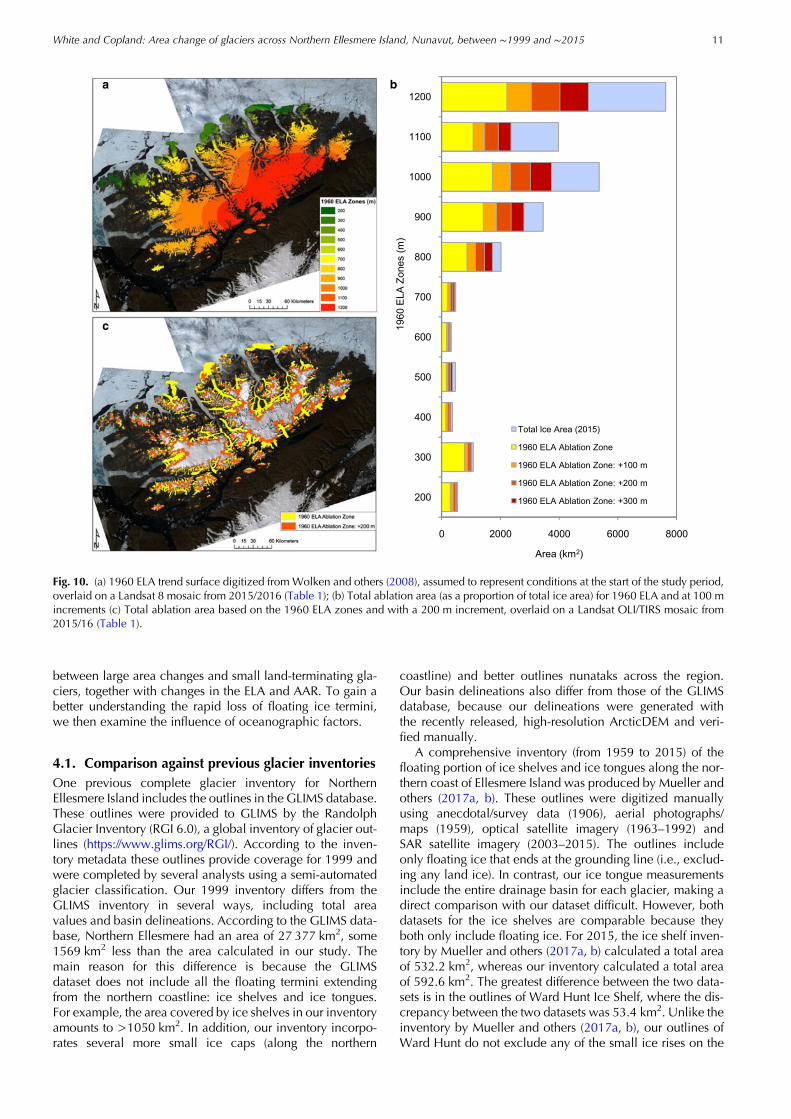
3.4. AAR changesIn order to examine the past and future susceptibility of theglacier cover across Northern Ellesmere to melt, the ELA atthe start of the study period (Fig. 10a) was used to calculatethe regional size of the ablation zone, and from that theregional AAR. In 1999, 35.2% of the ice area was in the abla-tion zone (AAR= 0.648) (Fig. 10b, c). If this ELA rose by aconservative 100 m, the ablation zone would comprise47.1% of the total glacier cover (AAR= 0.529). If it rose by200 or 300 m, as seems plausible based on measurementson nearby ice caps (Burgess, 2017; Thomson and others,2017), the ablation zone area would then comprise 60.2%(AAR= 0.398) or 72.3% (AAR= 0.277) of the overallglacier cover, respectively.
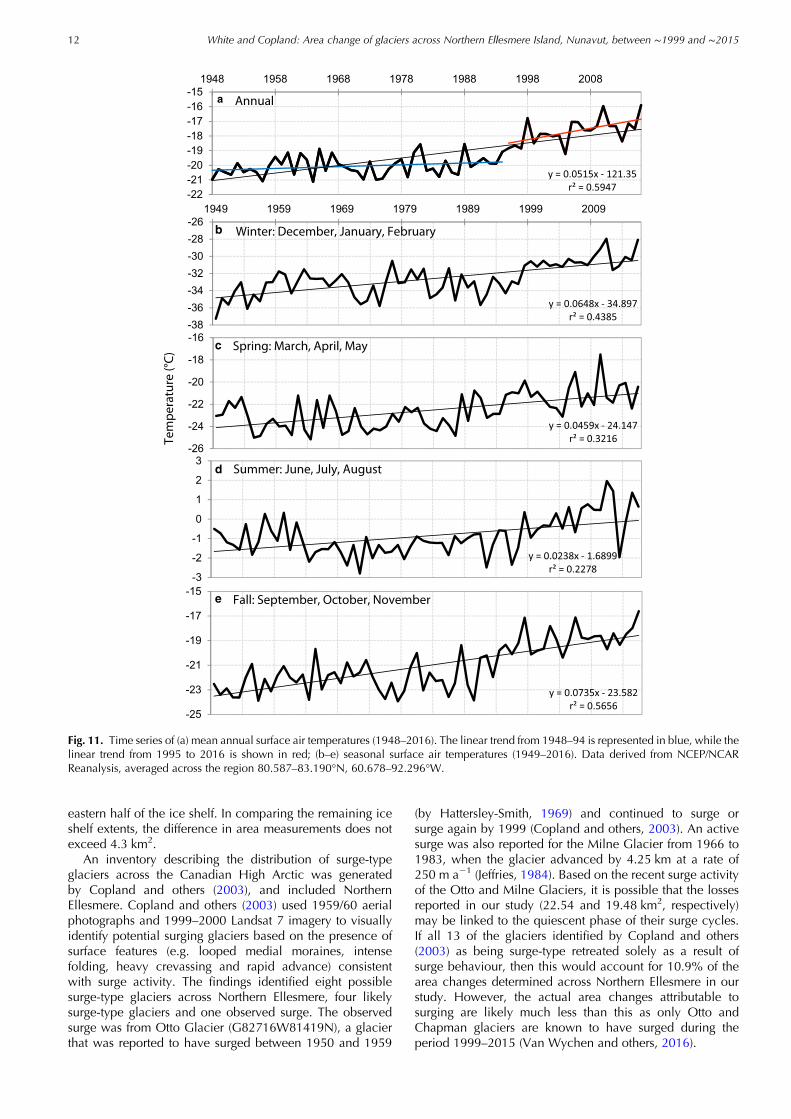
3.5. Climate analysisMean annual surface air temperatures across NorthernEllesmere Island increased by 3.6°C (0.5°C decade−1)between 1948 and 2016 (r2= 0.59, P= 9.01 × 10⁻¹⁵;Fig. 11a). A shift seems to have occurred in the mid-1990swhen temperature increases accelerated from 0.12°Cdecade−1 from 1948 to 1994 to 0.78°C decade−1 from1995 to 2016. Since 1948, fall (September, October,November) has shown the greatest overall increase inmean monthly surface temperature by 0.74°C decade−1
(P= 1.45 × 10⁻¹³), followed by winter (December, January,February) at 0.65°C decade−1 (P= 7.75 × 10⁻¹⁰) and spring(March, April, May) at 0.46°C decade−1 (Fig. 11). Summer(June, July, August) had the weakest rate of warming at0.24°C decade−1 (P= 3.86 × 10−05), although there hasbeen a regime shift from mean negative to mean positivesummer surface air temperatures since the year 2000. Ofthe 20 warmest mean annual surface air temperatures since1946, 16 have occurred since 2000. Every summer since2000 has exceeded the climatological summer mean tem-perature (−0.7°C) by 0.6–2.7°C. Compared with the climato-logical mean from 1981 to 2010, mean monthly temperatureanomalies have been consistently above the 30-year averagesince 2000.
4. DISCUSSIONFrom the above results, it is clear that the ice cover ofNorthern Ellesmere Island has been undergoing widespreadloss since 1999, with two trends standing out among theobservations: (1) The dominance of the shrinkage of rela-tively small, low elevation glaciers in terms of relative arealoss; (2) The substantial loss of floating ice from ice shelvesand ice tongues along the northern coast. In the followinganalysis, we begin by comparing our inventory with othersof the study region. We then examine the relationships
r
r
r
r
Fig. 9. Relationship between loss (% decade−1) and: (a) mean elevation; (b) maximum elevation; (c) flow length (note log scale on x-axis) and;(d) glacier area (note log scale on x-axis).
10 White and Copland: Area change of glaciers across Northern Ellesmere Island, Nunavut, between ∼1999 and ∼2015
between large area changes and small land-terminating gla-ciers, together with changes in the ELA and AAR. To gain abetter understanding the rapid loss of floating ice termini,we then examine the influence of oceanographic factors.
4.1. Comparison against previous glacier inventoriesOne previous complete glacier inventory for NorthernEllesmere Island includes the outlines in the GLIMS database.These outlines were provided to GLIMS by the RandolphGlacier Inventory (RGI 6.0), a global inventory of glacier out-lines (https://www.glims.org/RGI/). According to the inven-tory metadata these outlines provide coverage for 1999 andwere completed by several analysts using a semi-automatedglacier classification. Our 1999 inventory differs from theGLIMS inventory in several ways, including total areavalues and basin delineations. According to the GLIMS data-base, Northern Ellesmere had an area of 27 377 km2, some1569 km2 less than the area calculated in our study. Themain reason for this difference is because the GLIMSdataset does not include all the floating termini extendingfrom the northern coastline: ice shelves and ice tongues.For example, the area covered by ice shelves in our inventoryamounts to >1050 km2. In addition, our inventory incorpo-rates several more small ice caps (along the northern
coastline) and better outlines nunataks across the region.Our basin delineations also differ from those of the GLIMSdatabase, because our delineations were generated withthe recently released, high-resolution ArcticDEM and veri-fied manually.
A comprehensive inventory (from 1959 to 2015) of thefloating portion of ice shelves and ice tongues along the nor-thern coast of Ellesmere Island was produced by Mueller andothers (2017a, b). These outlines were digitized manuallyusing anecdotal/survey data (1906), aerial photographs/maps (1959), optical satellite imagery (1963–1992) andSAR satellite imagery (2003–2015). The outlines includeonly floating ice that ends at the grounding line (i.e., exclud-ing any land ice). In contrast, our ice tongue measurementsinclude the entire drainage basin for each glacier, making adirect comparison with our dataset difficult. However, bothdatasets for the ice shelves are comparable because theyboth only include floating ice. For 2015, the ice shelf inven-tory by Mueller and others (2017a, b) calculated a total areaof 532.2 km2, whereas our inventory calculated a total areaof 592.6 km2. The greatest difference between the two data-sets is in the outlines of Ward Hunt Ice Shelf, where the dis-crepancy between the two datasets was 53.4 km2. Unlike theinventory by Mueller and others (2017a, b), our outlines ofWard Hunt do not exclude any of the small ice rises on the
Fig. 10. (a) 1960 ELA trend surface digitized from Wolken and others (2008), assumed to represent conditions at the start of the study period,overlaid on a Landsat 8 mosaic from 2015/2016 (Table 1); (b) Total ablation area (as a proportion of total ice area) for 1960 ELA and at 100 mincrements (c) Total ablation area based on the 1960 ELA zones and with a 200 m increment, overlaid on a Landsat OLI/TIRS mosaic from2015/16 (Table 1).
11White and Copland: Area change of glaciers across Northern Ellesmere Island, Nunavut, between ∼1999 and ∼2015
eastern half of the ice shelf. In comparing the remaining iceshelf extents, the difference in area measurements does notexceed 4.3 km2.
An inventory describing the distribution of surge-typeglaciers across the Canadian High Arctic was generatedby Copland and others (2003), and included NorthernEllesmere. Copland and others (2003) used 1959/60 aerialphotographs and 1999–2000 Landsat 7 imagery to visuallyidentify potential surging glaciers based on the presence ofsurface features (e.g. looped medial moraines, intensefolding, heavy crevassing and rapid advance) consistentwith surge activity. The findings identified eight possiblesurge-type glaciers across Northern Ellesmere, four likelysurge-type glaciers and one observed surge. The observedsurge was from Otto Glacier (G82716W81419N), a glacierthat was reported to have surged between 1950 and 1959
(by Hattersley-Smith, 1969) and continued to surge orsurge again by 1999 (Copland and others, 2003). An activesurge was also reported for the Milne Glacier from 1966 to1983, when the glacier advanced by 4.25 km at a rate of250 m a−1 (Jeffries, 1984). Based on the recent surge activityof the Otto and Milne Glaciers, it is possible that the lossesreported in our study (22.54 and 19.48 km2, respectively)may be linked to the quiescent phase of their surge cycles.If all 13 of the glaciers identified by Copland and others(2003) as being surge-type retreated solely as a result ofsurge behaviour, then this would account for 10.9% of thearea changes determined across Northern Ellesmere in ourstudy. However, the actual area changes attributable tosurging are likely much less than this as only Otto andChapman glaciers are known to have surged during theperiod 1999–2015 (Van Wychen and others, 2016).
Fig. 11. Time series of (a) mean annual surface air temperatures (1948–2016). The linear trend from 1948–94 is represented in blue, while thelinear trend from 1995 to 2016 is shown in red; (b–e) seasonal surface air temperatures (1949–2016). Data derived from NCEP/NCARReanalysis, averaged across the region 80.587–83.190°N, 60.678–92.296°W.
12 White and Copland: Area change of glaciers across Northern Ellesmere Island, Nunavut, between ∼1999 and ∼2015

4.2. Loss of small ice capsBased on the terrain analysis presented in Section 3.3, thelargest area changes occurred from small, low elevation gla-ciers. Separated by size class, the largest area changesoccurred from land-terminating glaciers that were <1 km2,with a mean loss of 30.4% decade−1 (Fig. 6). Based on theresults from Sharp and others (2014), this trend was alsoapparent on Northern Ellesmere between ∼1960 and∼2000, when 218 glaciers <1 km2 and 1–5 km2 in sizehad the highest mean losses of 29.2% (0.73% decade−1)and 25.6% (0.64% decade−1), respectively. For the othersize classes described by Sharp and others (2014), lossesranged from 22.2% for glaciers 5–10 km2 in area, decreas-ing to 2% for glaciers >10 000 km2. Sharp and others(2014) also noted this trend on Agassiz Ice Cap, Prince ofWales Icefield, South Ellesmere Island, Axel HeibergIsland and Devon Island. Similarly, Thomson and others(2011) described a trend of significant retreat of small inde-pendent ice masses on Axel Heiberg Island, which includedice caps <25 km2, along with the complete disappearanceof 90% of ice masses smaller than 0.2 km2 over the period1958–2000.
Braun and others (2004) examined the mass balance andarea fluctuations of four ice caps on the Hazen Plateau ofNorthern Ellesmere from 1959 to 2002, including theSt. Patrick Bay (also in our study; Fig. 2), Murray andSimmons Ice Caps. In their study, the substantial lossobserved from these small ice caps was attributed to lowwinter snow accumulation, the absence of ice flow andsmall vertical relief. Braun and others (2004) describedthese small ice masses as relicts of the Little Ice Age, nolonger sustainable in the current climate as the ELA risesabove their summits (>1103 m). Rising ELAs have alsobeen observed in the mass-balance records of WhiteGlacier, Axel Heiberg Island, the nearest long-term mass-balance monitoring site to Northern Ellesmere (Fig. 1). Ifthe ELA at the start of our study period in ∼1999 ascendedas much as the ∼200 m rise in ELA recorded at WhiteGlacier since 1999 (Thomson and others, 2017), then60.2% of the regional glacier cover across NorthernEllesmere would be in the ablation zone (AAR= 0.398),and 589 (33.3%) glaciers would be completely below theELA. According to Dyurgerov and others (2009) most glacierswith balanced regimes will have an AAR of ∼0.40 to 0.80,which would suggest that Northern Ellesmere is out ofbalance with the current climate. If the ELA were to rise300 m, 940 (53.2%) glaciers would be completely belowthe ELA and the regional AAR would only be 0.277 (Fig. 10).
Serreze and others (2017) described the continued loss ofthe Hazen Plateau ice caps up to 2016, and revealed that theSt. Patrick Bay Ice Caps only had 5% of their 1959 arearemaining (10.42 km2 in 1959 vs 0.50 km2 in 2016). Theauthors noted that the ice caps even shrank noticeablybetween 2014 and 2015, in direct response to the particu-larly warm summer of 2015. The rapid loss of these icecaps was also attributed to the more pronounced appearanceof dirt layers on the ice surface, leading to a decrease insummer surface albedo. In 2016 the Murray and Simmonsice caps still had 39% and 25% of their 1959 ice areasremaining, respectively, which was linked to their highermean elevations (up to ∼290 m higher), thus providing rela-tively cooler summer conditions.
4.3. Loss of floating glacier terminiBetween 1999 and 2015, there was a marked loss in floatingglacier termini, including the loss of 18 ice tongues, the com-plete loss of the Ayles andMarkham ice shelves, and substan-tial decreases in the Serson and Ward Hunt ice shelves.Unlike land-terminating glaciers that typically shrink grad-ually under atmospheric forcing, marine-terminating glaciersand ice shelves are subject to oceanographic forcing and canlose mass rapidly through calving.
Detailed studies have been conducted on several Arcticice shelves, including the Petersen and Ayles, that documentthe events leading up to calving events (Copland and others,2017). In the study by White and others (2015), the PetersenIce Shelf is shown to have undergone a series of calvingevents between 2005 and 2012, during record highsummer temperatures, that resulted in a ∼61% loss in icearea. The calving events were initiated by the loss of >50-year-old multi-year landfast sea ice (MLSI) that fringed theice shelf front in 2005, and by open water events in 2008,2011 and 2012. White and others (2015) also reported thatin situ thinning and pre-existing fractures in the ice shelfwould have weakened it, thus allowing ice islands to separ-ate from the ice shelf during open water events and driftaway. Copland and others (2007) described the conditionsleading to the complete collapse of the Ayles Ice Shelf inAugust 2005 that resulted in it calving within the space of afew hours and producing an 87.1 km2 ice island. Similar tothe Petersen, Copland and others (2007, 2017) reportedthat this collapse was initiated by record high summer tem-peratures in 2005, and by the loss of landfast sea ice thathad previously fringed the ice shelf. Copland and others(2007) also reported that high offshore winds occurredduring the event.
For marine-terminating glaciers with floating termini, thepresence of ice mélange and sea ice provides a seasonallydependent stabilizing mechanism that allows the termini toremain intact and possibly advance (Reeh and others,2001; Pimentel and others, 2017). This has been evidentwith ice tongues composed of agglomerated ice blockssuch as at the front of Jakobshavn Isbrae, Greenland(Amundsen and others, 2010). During winter, sea ice formsand binds the ice mélange and prevents glacier calving,while the retreat of sea ice in spring causes the mélange toweaken and calving to recommence. Todd andChristoffersen (2014) examined the calving dynamics ofStore Glacier in West Greenland and found that the presenceof ice mélange was principally responsible for the observedseasonal advance of the terminus.
These factors may have also played an important role inthe loss of the floating ice tongues observed in this study, par-ticularly in Yelverton Inlet and Bay where several ice tonguesdisappeared over the study period. According to Pope andothers (2012), 932.6 km2 of MLSI occupied Yelverton Inletand Bay, including Kulutingwak Fiord in 1959. By August2005, ∼330 km2 of MLSI broke away from Yelverton Bayand was soon followed by the fragmentation of 690 km2 ofolder MLSI from Yelverton Inlet. In summer 2008 fragmentsof MLSI in Yelverton Bay and Kulutingwak Fiord brokeapart and drifted away. In summer 2010 the last remainingplug of MLSI in Yelverton Inlet broke away, along with sec-tions of MLSI from Kulutingwak Fiord. The loss of MLSIfrom this region means that the glaciers flowing into this
13White and Copland: Area change of glaciers across Northern Ellesmere Island, Nunavut, between ∼1999 and ∼2015

system would then be exposed to an entirely new environ-ment consisting of open water and young, thinner sea ice.It is likely that the loss of the floating ice tongues was adirect response to the loss of the back pressure previouslyprovided by the thick and semi-permanent MLSI cover.
5. SUMMARY AND CONCLUSIONAccording to our observations between ∼1999 and ∼2015,regional ice coverage has decreased by 5.89% (3.68%decade−1) over the 16-year study period. This equates toan area loss of 822 km2 decade−1. From 1948–2016, thehighest rate of warming occurred during fall and winter at0.74 and 0.65°C decade−1, respectively. Although summershowed the lowest rate of temperature increase (0.24°Cdecade−1), the change in the mean summer temperatureover time has resulted in a change from mean negative tem-peratures to mean positive temperatures since 2007 (with theexception of 2014). There is evidence for a small increase inprecipitation over time on Ellesmere Island at Eureka (∼10%between 1961 and 2007; Lesins and others, 2010), but this isinsufficient to compensate for the rapid recent increase in airtemperatures.
Recent area losses from some glaciers, such as the Milne(G78878W82327N) and Otto (G82716W81419N), couldbe explained by retreat during quiescent periods after poten-tial surge-type behaviour observed over past decades(Hattersley-Smith, 1969; Jeffries, 1984; Copland and others,2003), but this is likely much <10% of the regional total.Two main trends for the remaining glaciers include therapid loss of small, low elevation land-terminating glaciersand the loss of floating glacier termini in the form of icetongues and ice shelves. The loss of small glaciers is atrend that has continued since the 1950s, and has beenobserved in other regions across the CAA as well (Braunand others, 2004; Thomson and others, 2011; Sharp andothers, 2014; Serreze and others, 2017). Our analysis alsorevealed the complete loss of three small ice caps. Theincreased loss of small ice caps on Northern Ellesmerecan be attributed to their increased sensitivity to the accel-erated warming in the region, and the decrease in theirsurface albedo due to the accumulation of surface debris(Serreze and others, 2017). Small glaciers with relativelyhigher mean elevation are slightly less sensitive due totheir cooler summer temperatures at high altitudes(Serreze and others, 2017). This is apparent in our study,where for land-terminating glaciers <10 km2, glacierswith mean elevations <700 m had a mean loss of 25.7%decade−1 whereas glaciers with mean elevations >700 mhad a mean loss of 16.0% decade−1.
Over our 16-year study period, there was a substantialchange in the amount of floating ice. Ice shelves lost∼42.4% of their initial ice area, including the complete lossof the Ayles Ice Shelf (−83.5 km2) and nearly the completeloss of the Serson Ice Shelf (−184.0 km2). Our inventoryalso identified the loss of 18 floating ice tongues, causingthese marine-terminating glaciers to retreat to their groundinglines. Past studies have linked the loss of ice shelves towarmer summer temperatures, offshore winds and the lossof the protective barrier created by MLSI (Copland andothers, 2007, 2017; White and others, 2015). These factorsmay have also played an important role in the loss of floatingice tongues observed in this study, particularly in YelvertonInlet and Bay where several ice tongues have disappeared
since the loss of MLSI in this region in summers 2008 and2009 (Pope and others, 2012).
This study demonstrates that the icescape of NorthernEllesmere is changing and, if current temperatures persist orcontinue to increase, small ice caps will be the first tovanish and coastal zones will become free of floatingglacier termini and ice shelves. If the ELA has risen by 300m since 1960 levels, which seems possible given the rapidrecent changes recorded by mass-balance programs onother nearby ice caps, then >50% of glaciers are currentlycompletely in the ablation zone. It is important that regionalinventories such as this one continue to be created andupdated to monitor changing glacial landscapes in awarming climate.
ACKNOWLEDGEMENTSThis work was funded by grants from the Natural Sciences andEngineering Research Council (NSERC) of Canada, CanadaFoundation for Innovation, University of Ottawa, PolarContinental Shelf Program, the Royal Canadian GeographicSociety and ArcticNet, a Network of Centres of Excellence ofCanada. We would like to acknowledge the Polar GeospatialCenter (University of Minnesota) for providing early access tothe ArcticDEM. Adrienne White was supported by graduatescholarships from NSERC, the Ontario Graduate Scholarship,the Association of Canadian Universities for NorthernStudies, the Garfield Weston Foundation and awards fromthe Northern Scientific Training Program.
REFERENCESAbdalati W and 9 others (2004) Elevation changes of ice caps in the
Canadian Arctic Archipelago. J. Geophys. Res., 109(F04007)(doi: 10.1029/2003JF000045)
Amundsen JM and 5 others (2010) Ice mélange dynamics and impli-cations for terminus stability, Jakobshavn Isbrae, Greenland.J. Geophys. Res., 115(F1) (doi: 10.1029/2009JF001405)
Andrews JT (2002) Glaciers of Baffin Island. In Williams RS, Jr andFerrigno JG eds. Satellite Image Atlas of the World, U.S.Geological Survey Professional Paper, 1386-J-1, J165–J195.United States Government Printing Office, Washington
Braun C, Hardy DR and Bradley RS (2004) Mass balance and areachanges of four High Arctic plateau ice caps. Geogr. Ann.,86A(1), 43–52 (doi: 10.1111/j.0435-3676.2004.00212.x)
Burgess DO (2017) Mass balance of ice caps in the Queen ElizabethIslands, Arctic Canada: 2014–2015.Geol. Survey Canada, OpenFile 8223, 38 p. (doi: 10.4095/300231)
Copland L (1998) The use of terrain analysis in the evaluation ofsnow cover over an alpine glacier, In Lane SN, Richards KSand Chandler JH, eds. Landform Monitoring, Modelling andAnalysis. John Wiley & Sons, Chichester, 385–404
Copland L, Sharp M and Dowdeswell J (2003) The distribution andflow characteristics of surge-type glaciers in the Canadian HighArctic. Ann. Glaciol., 36, 73–81
Copland L, Mueller DR andWeir L (2007) Rapid loss of the Ayles IceShelf, Ellesmere Island, Canada. Geophys. Res. Lett., 34(21),L21501 (doi: 10.1029/2007GL031809)
Copland L, Mortimer C, White A, Richer McCallum M andMueller DR (2017) Factors contributing to recent Arctic iceshelf losses. In Copland L and Mueller D, eds. Arctic IceShelves and Ice Islands, Springer, Dordrecht, 263–286
Dowdeswell JA and Jeffries MO (2017) Arctic ice shelves: an intro-duction. In Copland L and Mueller DR, eds. Arctic Ice Shelvesand Ice Islands, Springer, Dordrecht, 3–21
14 White and Copland: Area change of glaciers across Northern Ellesmere Island, Nunavut, between ∼1999 and ∼2015

Dyurgerov M, Meier MF and Bahr DB (2009) A new index ofglacier area change: a tool for glacier monitoring. J. Glaciol.,55(192), 710–716
Hall DK, Baa KJ, Schöner W, Bindschadler RA and Chien JYL (2003)Consideration of the errors inherent in mapping historical glacierpositions in Austria from the ground and space (1893–2001).Remote Sens. Environ., 86, 566–577
Harig C and Simons FJ (2016) Ice mass loss in Greenland, the Gulf ofAlaska, and the Canadian Archipelago: seasonal cycles anddecadal trends. Geophys. Res. Lett., 43(7), 3150–3159 (doi:10.1002/2016GL067759)
Hattersley-Smith G (1969) Recent observations on the surgingOtto Glacier, Ellesmere Island. Can. J. Earth Sci., 6(4), Part 2,883–889
Jeffries MO (1984) Milne Glacier, Northern Ellesmere Island, N.W.T., Canada: a surging glacier? J. Glaciol., 30(105), 251–253
Jenson SK and Domingue JO (1988) Extracting topographicstructure from digital elevation data for geographicinformation analysis. Photogramm. Eng. Remote Sens., 54(11), 1593–1600
Kalnay E and 21 others (1996) The NCEP/NCAR Reanalysis 40-yearproject. B. Am. Meteorol. Soc., 77(3), 437–471
Koerner RM (2005) Mass balance of glaciers in the Queen ElizabethIslands, Nunavut, Canada. Ann. Glaciol., 42, 417–423
Lesins G, Duck TJ and Drummond JR (2010) Climate trends atEureka in the Canadian high Arctic. Atmos. Ocean, 48(2), 59–80 (doi: 10.3137/AO1103.2010)
Maxwell JB (1981) Climatic regions of the Canadian Arctic islands.Arctic, 34(3), 225–240
Miller GH, Bradley RS and Andrews JT (1975) The glaciation leveland lowest equilibrium line altitude in the high CanadianArctic: maps and climatic interpretations. Arct. Alpine Res., 7(2), 155–168 (doi: 10.2307/1550318)
Mortimer CA, Sharp M and Wouters B (2016) Glacier surface tem-peratures in the Canadian High Arctic, 2000–15. J. Glaciol., 62(235), 963–975 (doi: 10.1017/jog.2016.80)
Mueller DR, Copland L and Jeffries MO (2017a) NorthernEllesmere Island ice shelf and ice tongue extents, v. 1.0(1906–2015). Nordicana, D28 (doi: 10.5885/45455XD-24C73A8A736446CC)
Mueller DR, Copland L and Jeffries MO (2017b) Changes inCanadian Arctic ice shelf extent since 1906. In Copland L andMueller DR, eds. Arctic Ice Shelves and Ice Islands, Springer,Dordrecht, 109–148
Pfeffer WT and 18 others and the Randolph Consortium (2014) TheRandolph Glacier Inventory: a globally complete inventory ofglaciers. J. Glaciol., 60(221) (doi: 10.3189/2014JoG13J176)
Pimentel S and 7 others (2017) Modelling intra-annual dynamics of amajor marine-terminating Arctic glacier. Ann. Glaciol., 58(74),118–130 (doi: 10.1017/aog.2017.23)
Pope S, Copland L and Mueller D (2012) Loss of multiyear landfastsea ice from Yelverton Bay, Ellesmere Island, Nunavut, Canada.Arct. Antarct. Alp. Res., 44(2), 210–221 (doi: 10.1657/1938-4246-44.2.210)
Raup B and Khalsa SJS (2010) GLIMS analysis tutorial. NationalSnow and Ice Data Center, Boulder, CO, https://www.glims.org/MapsAndDocs/assets/GLIMS_Analysis_Tutorial_a4.pdf
Reeh N, Thomsen HH, Higgins AK and Weidick A (2001) Sea iceand the stability of north and northeast Greenland floatingglaciers. Ann. Glaciol., 33(1), 474–480 (doi: 10.3189/172756401781818554)
Serreze MC, Raup B, Braun C, Hardy DR and Bradley RS (2017)Rapid wastage of the Hazen Plateau ice caps, northeasternEllesmere Island, Nunavut, Canada. Cryosphere, 11, 169–177(doi: 10.5194/tc-11-169-2017)
Sharp M and 12 others (2014) Remote sensing of recent glacierchanges in the Canadian Arctic. In Kargel JS, Bishop MP,Kaab A, Raup BH and Leonard G, eds. Global Land IceMeasurements from Space: Satellite Multispectral Imaging ofGlaciers. Springer-Praxis. Springer-Verlag, Berlin, Heidelberg,205–228 (doi: 10.1007/978-3-540-79818-7_9)
Thomson LI, Osinski GR and Ommanney SL (2011) Glacier changeon Axel Heiberg Island, Nunavut, Canada. J. Glaciol., 57(206),1079–1086 (doi: 10.3189/002214311798843287)
Thomson LI, Zemp M, Copland L, Cogley JG and Ecclestone MA(2017) Comparison of geodetic and glaciological mass budgetsfor White Glacier, Axel Heiberg Island, Canada. J. Glaciol., 63(237), 55–66 (doi: 10.1017/jog.2016.112)
Todd J and Christoffersen P (2014) Are seasonal calving dynamicsforced by buttressing from ice mélange or undercutting bymelting? Outcomes from full-Stokes simulations of StoreGlacier, West Greenland. Cryosphere, 8, 2353–2365 (doi:10.5194/tc-8-2353-2014)
VanWychenW and 6 others (2016) Characterizing interannual vari-ability of glacier dynamics and dynamic discharge (1999–2015)for the ice masses of Ellesmere and Axel Heiberg Islands,Nunavut, Canada. J. Geophys. Res.-Earth, 121(1), 39–63 (doi:10.1002/2015JF003708)
White A, Copland L, Mueller D and Van Wychen W (2015)Assessment of historical changes (1959–2012) and the cause ofrecent break-ups of the Petersen Ice Shelf, Nunavut, Canada.Ann. Glaciol., 56(69), 65–76 (doi: 10.3189/2015AoG69A687)
Williams RS, Hall DK, Sigur �dsson O and Chien JYL (1997)Comparison of satellite-derived with ground-based measure-ments of the fluctuations of the margins of Vatnajökull, Iceland,1973–92. Ann. Glaciol., 24, 72–80
Wolken GJ, England JH and Dyke AS (2008) Changes in late-neogla-cial perennial snow/ice extent and equilibrium-line altitudes inthe Queen Elizabeth Islands, Arctic Canada. Holocene, 18(4),615–627 (doi: 10.1177/0959683608089215)
MS received 29 January 2018 and accepted in revised form 15 May 2018
15White and Copland: Area change of glaciers across Northern Ellesmere Island, Nunavut, between ∼1999 and ∼2015