argentine natural gas markets at regional inflection point: what's ahead?
TRANSCRIPT

© 2016 IHS
ihs.com
IHS ENERGY
Argentine natural gas markets at regional
inflection point: what’s ahead?
IHS 2016 Argentina Energy Symposium
Buenos Aires, 26 July 2016
Roberto Ferreira da Cunha
Associate Director
IHS Energy
© 2016 IHS 2
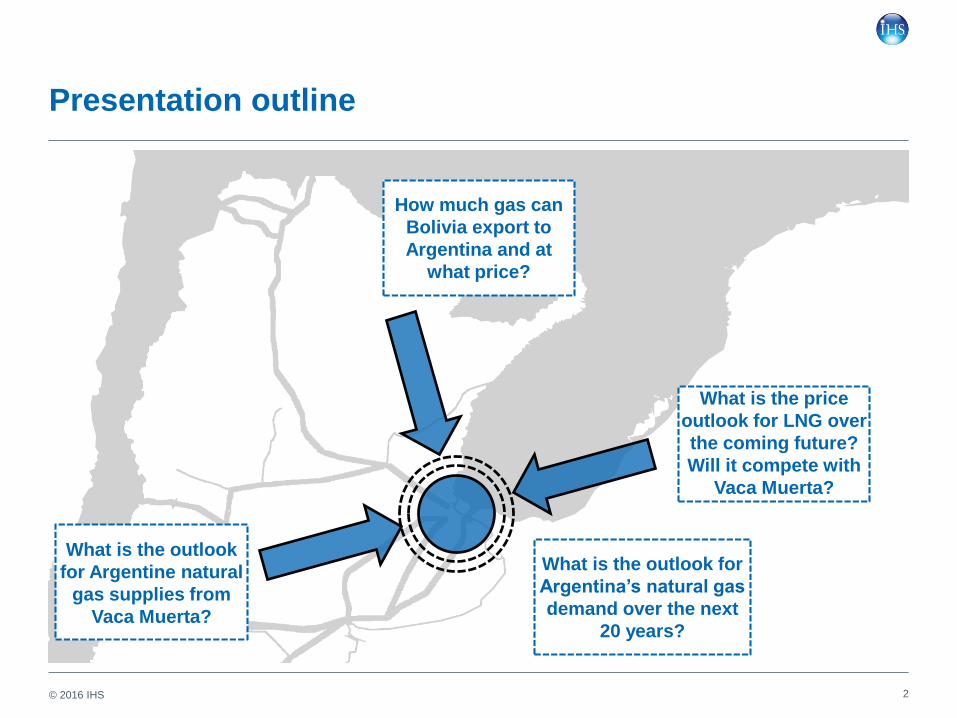
Presentation outline
What is the outlook
for Argentine natural
gas supplies from
Vaca Muerta?
What is the price
outlook for LNG over
the coming future?
Will it compete with
Vaca Muerta?
How much gas can
Bolivia export to
Argentina and at
what price?
What is the outlook for
Argentina’s natural gas
demand over the next
20 years?

© 2016 IHS 3
1 - Natural gas demand is set to grow.
What is the outlook for
Argentina’s natural gas
demand over the next
20 years?

© 2016 IHS. ALL RIGHTS RESERVED.
End-user natural gas prices have been regulated at
subsidized levels since the 2000s.
4
-
1
2
3
4
5
6
0
2
4
6
8
10
12
14
16
18
Jan-0
0
Jun-0
0
No
v-0
0
Apr-
01
Sep-0
1
Feb
-02
Jul-0
2
De
c-0
2
Ma
y-0
3
Oct-
03
Ma
r-0
4
Aug-0
4
Jan-0
5
Jun-0
5
No
v-0
5
Apr-
06
Sep-0
6
Feb
-07
Jul-0
7
De
c-0
7
Ma
y-0
8
Oct-
08
Ma
r-0
9
Aug-0
9
Jan-1
0
Jun-1
0
No
v-1
0
Apr-
11
Sep-1
1
Feb
-12
Jul-1
2
De
c-1
2
Ma
y-1
3
Oct-
13
Ma
r-1
4
Aug-1
4
Jan-1
5
Jun-1
5
No
v-1
5
Domestic Supplies Bolivian imports LNG imports Old contracts price Bolivian import price LNG imports price
Historical natural gas supplies and prices
© 2016 IHS
US
$/M
MB
tu
Notes: Old contracts price refer to the legacy contracts prior to the subsidy programs implemented by the Argentine governmentSource: IHS Energy, Ministerio de Energía y Mineria (Argentina)
Bc
f/d
IHS 2016 Argentina Energy Symposium
© 2016 IHS. ALL RIGHTS RESERVED.
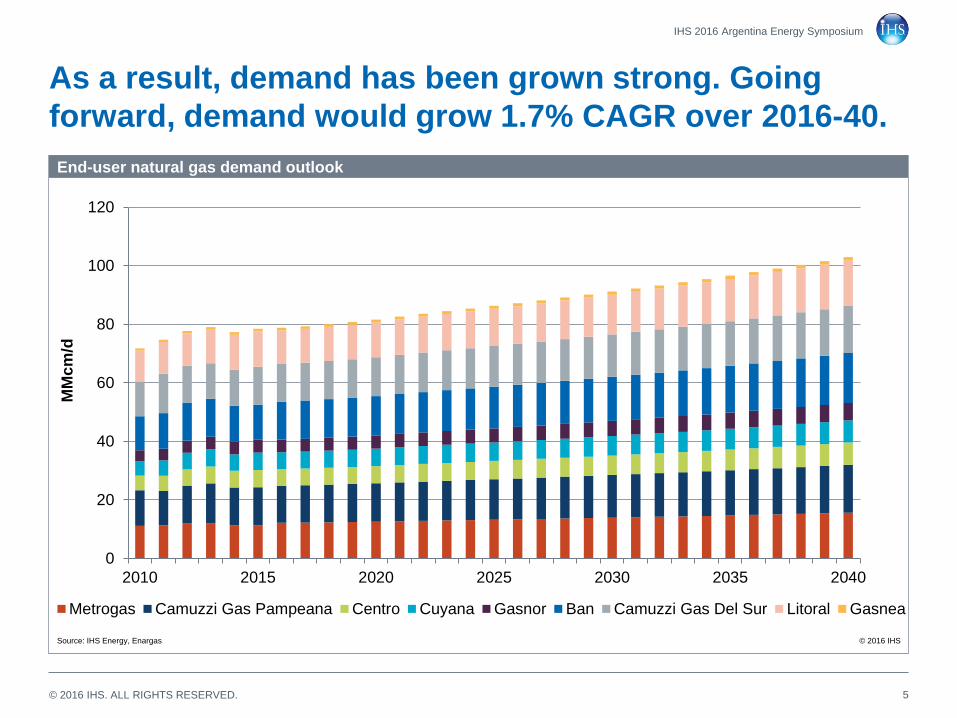
As a result, demand has been grown strong. Going
forward, demand would grow 1.7% CAGR over 2016-40.
5
0
20
40
60
80
100
120
2010 2015 2020 2025 2030 2035 2040
Metrogas Camuzzi Gas Pampeana Centro Cuyana Gasnor Ban Camuzzi Gas Del Sur Litoral Gasnea
End-user natural gas demand outlook
Source: IHS Energy, Enargas © 2016 IHS
MM
cm
/d
IHS 2016 Argentina Energy Symposium

© 2016 IHS. ALL RIGHTS RESERVED.
Power sector would grow twice as fast at 2.8% CAGR
between 2016-40, mainly led by residential sector.
6
-3%
-2%
0%
2%
3%
5%
6%
8%
9%
11%
12%
14%
15%
0
50
100
150
200
250
300
2005 2007 2009 2011 2013 2015 2017 2019 2021 2023 2025 2027 2029 2031 2033 2035 2037 2039
Industrial Residential Commercial Agricultural Transport Demand growth (%)
Argentina annual power demand by sector
© 2016 IHS
Te
raw
att
-ho
urs
Source: IHS Energy
Dem
an
d g
row
th (
%)
CAGR (%) 2005-15 2015-25 2025-40
Total sales 3.8% 2.3% 2.9%
Industrial 2.2% 1.9% 2.5%
Residential 6.8% 2.8% 3.2%
Commercial 3.0% 2.3% 3.1%
IHS 2016 Argentina Energy Symposium

© 2016 IHS. ALL RIGHTS RESERVED.
Additional LNG import capacity to support winter-time
demand peaks will depend on Vaca Muerta build-up.
7
0
20
40
60
80
100
120
140
160
2013 2014 2015 2016 2017 2018 2019 2020 2021
Resid./Comm./Public OtherPower generation(from gas) Power generation(from diesel)
Argentina's seasonal natural gas demand outlook
© 2016 IHS
MM
cm
/d
Source: IHS
0
20
40
60
80
100
120
140
160
2013 2014 2015 2016 2017 2018 2019 2020 2021
Total Supply - low case Total Supply - base case
Potential Demand
Argentina’s seasonal gas supply outlook
© 2016 IHS
MM
cm
/d
Source: IHS
IHS 2016 Argentina Energy Symposium

© 2016 IHS. ALL RIGHTS RESERVED.
2 - Changing landscape for Bolivian gas supplies.
How much gas can
Bolivia export to
Argentina and at
what price?

© 2016 IHS. ALL RIGHTS RESERVED. 9
Bolivian natural gas supply outlook remains constrained
by a lack of large discoveries since 2004.
Source: IHS Energy
0
10
20
30
40
50
60
70
80
90
2000 2001 2002 2003 2004 2005 2009 2013
1P 2P 3P
Official natural gas reserve assessments
Note: 1P = proven reserves; 2P = probably reserves; 3P = possible reserves.
Source: Ministerio de Hidrocarburos y Energía (Bolivia) © 2016 IHS
Tc
f
0
500
1,000
1,500
2,000
2,500
3,000
3,500
4,000
1998 1999 2000 2001 2002 2003 2004 2007 2010 2014 2015
Gas,condensate Gas,condensate,oil Oil Oil,gas
Hydrocarbon discoveries
Notes: Add here or delete
Source: IHS Energy © 2016 IHS
MM
bo
e
Hydrocarbon
nationalization
Sabalo
Itau
Margarita-
Huyacaya
Incahuasi
IHS 2016 Argentina Energy Symposium

© 2016 IHS. ALL RIGHTS RESERVED. 10
0
20
40
2000 2003 2006 2009 2012 2015Chapare High and Cambrian Basin Chaco Foothill Belt (Chaco Basin)
Beni Sub-Andean Zone (Beni Basin) Beni Foothill Belt (Beni Basin)
Chaco Sub-basin (Chaco Basin) Chaco Sub-Andean Zone (Chaco Basin)
Number of drilled exploratory wells
Source: IHS Energy, EDIN © 2016 IHS
0%
10%
20%
30%
40%
50%
60%
70%
80%
90%
100%
2000 2001 2002 2003 2004 2005 2006 2007 2008 2009 2010 2011 2012 2013 2014 2015
NFW sucess rate
© 2016 IHS
Note: Include oil, gas and condensate discoveries
Source: IHS
0
100
200
300
400
500
600
700
800
0 5 10 15 20
Gas recoverable reserve discovery (2P)
© 2016 IHS
MM
Bo
e
Notes: Add here or delete
Source: IHS
7,200 MMBoe per
discovery
10 new exploratory
wells per year
38% success rate
0
2
4
6
8
10
12
2013 2014 2015 2016 2017 2018 2019 2020 2021 2022 2023 2024 2025 20262P YTF
9-pt - IHS line chart - 2016
© 2016 IHS
Tcf
Source: IHS Energy
Natural gas reserve outlook (2P)
Central question about Bolivian natural gas supply
outlook remains its “Yet-to-Find” supply outlook.
IHS 2016 Argentina Energy Symposium
© 2016 IHS. ALL RIGHTS RESERVED. 11
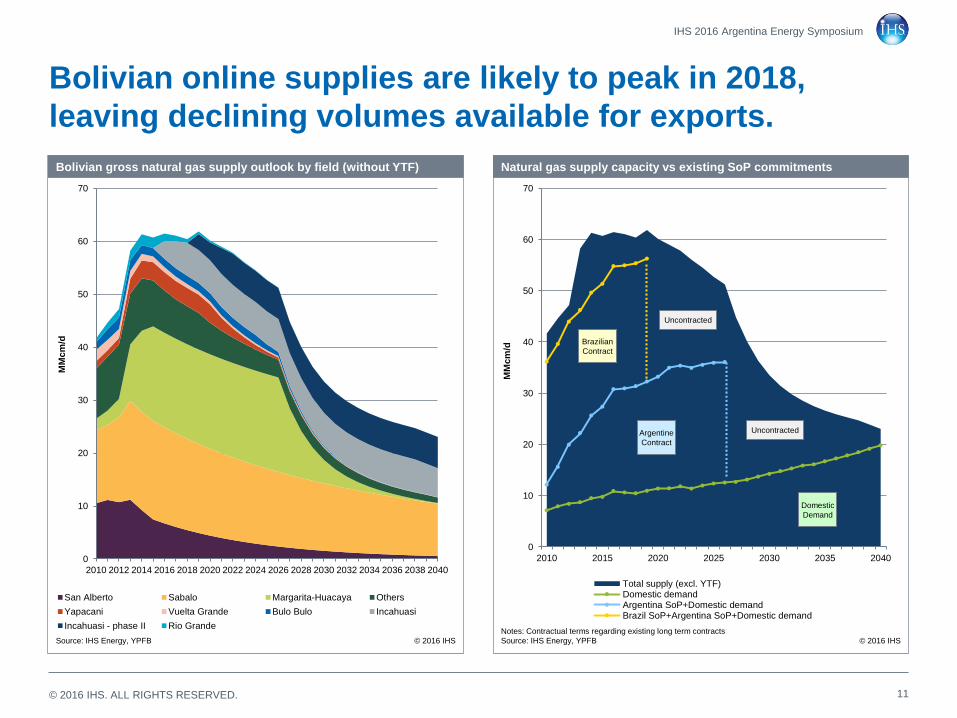
Bolivian online supplies are likely to peak in 2018,
leaving declining volumes available for exports.
0
10
20
30
40
50
60
70
2010 2015 2020 2025 2030 2035 2040
Total supply (excl. YTF)Domestic demandArgentina SoP+Domestic demandBrazil SoP+Argentina SoP+Domestic demand
Natural gas supply capacity vs existing SoP commitments
© 2016 IHS
MM
cm
/d
Notes: Contractual terms regarding existing long term contracts
Source: IHS Energy, YPFB
Domestic
Demand
Uncontracted
Brazilian
Contract
Argentine
Contract
Uncontracted
0
10
20
30
40
50
60
70
2010 2012 2014 2016 2018 2020 2022 2024 2026 2028 2030 2032 2034 2036 2038 2040
San Alberto Sabalo Margarita-Huacaya Others
Yapacani Vuelta Grande Bulo Bulo Incahuasi
Incahuasi - phase II Rio Grande
Bolivian gross natural gas supply outlook by field (without YTF)
© 2016 IHS
MM
cm
/d
Source: IHS Energy, YPFB
IHS 2016 Argentina Energy Symposium

© 2016 IHS. ALL RIGHTS RESERVED. 12
Petrobras could reduce its Bolivian imports, potentially
freeing volumes for increased exports to Argentina.
0
10
20
30
40
50
60
70
2015 2016 2017 2018 2019 2020 2021 2022 2023 2024 2025 2026
Domestic demand Argentina SoP Brazil SoP Brazil SoP - renewal Net supply
Natural gas supply capacity vs existing SoP commitments
© 2016 IHS
MM
cm
/d
Notes: Contractual terms regarding existing long term contracts
Source: IHS Energy, YPFB
Natural gas supply capacity vs existing SoP commitments (without YTF)
IHS 2016 Argentina Energy Symposium
© 2016 IHS. ALL RIGHTS RESERVED.
3 - Global LNG supply abundance keep spot prices low.
What is the price
outlook for LNG over
the coming future?
© 2016 IHS. ALL RIGHTS RESERVED.
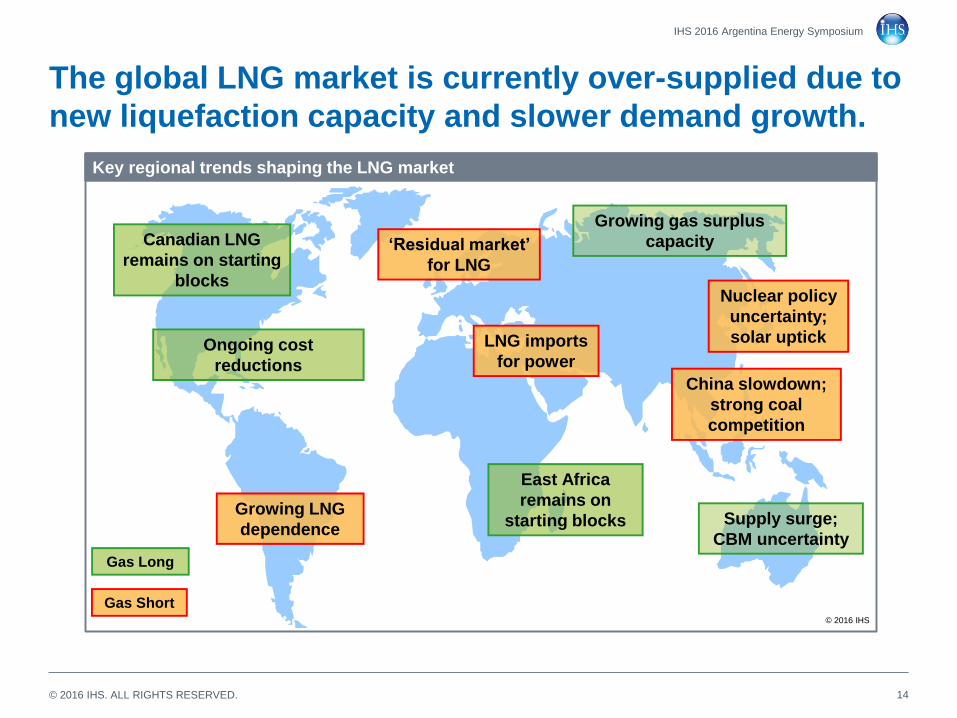
The global LNG market is currently over-supplied due to
new liquefaction capacity and slower demand growth.
14
Key regional trends shaping the LNG market
© 2016 IHS
China slowdown;
strong coal
competition
‘Residual market’
for LNG
Ongoing cost
reductions
LNG imports
for power
Growing LNG
dependenceSupply surge;
CBM uncertainty
Nuclear policy
uncertainty;
solar uptick
East Africa
remains on
starting blocks
Growing gas surplus
capacity Canadian LNG
remains on starting
blocks
Gas Long
Gas Short
IHS 2016 Argentina Energy Symposium
© 2016 IHS. ALL RIGHTS RESERVED.
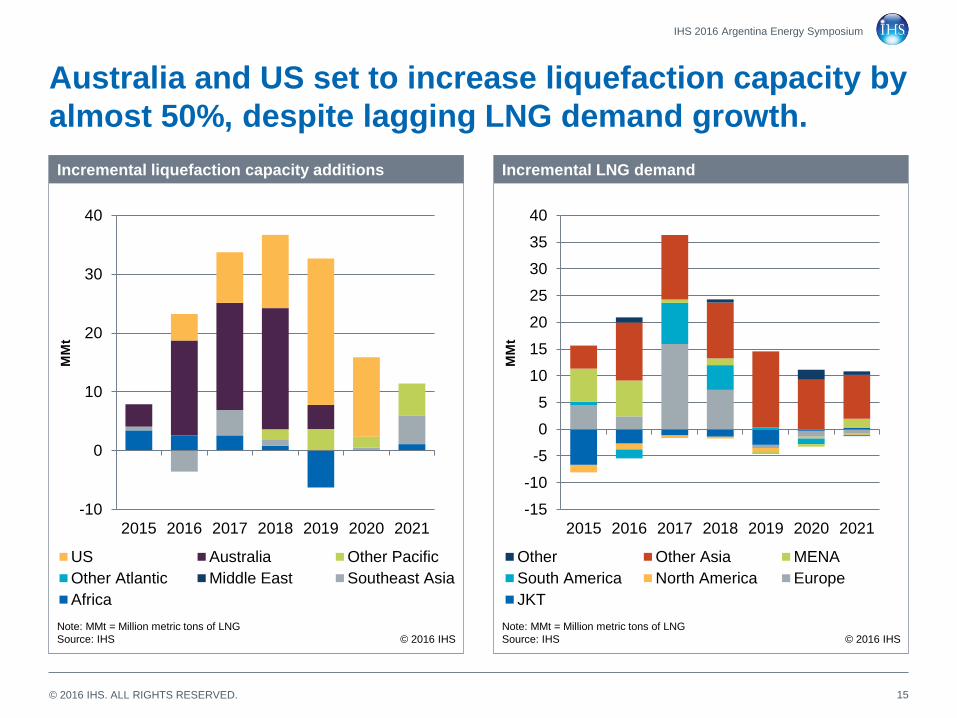
Australia and US set to increase liquefaction capacity by
almost 50%, despite lagging LNG demand growth.
15
-10
0
10
20
30
40
2015 2016 2017 2018 2019 2020 2021
US Australia Other Pacific
Other Atlantic Middle East Southeast Asia
Africa
Incremental liquefaction capacity additions
Note: MMt = Million metric tons of LNG
Source: IHS © 2016 IHS
MM
t
-15
-10
-5
0
5
10
15
20
25
30
35
40
2015 2016 2017 2018 2019 2020 2021
Other Other Asia MENA
South America North America Europe
JKT
Incremental LNG demand
Note: MMt = Million metric tons of LNG
Source: IHS © 2016 IHS
MM
t
IHS 2016 Argentina Energy Symposium

© 2016 IHS. ALL RIGHTS RESERVED.
Excess capacity will pressure LNG spot prices over the
next 5 years, favoring LNG imports in Argentina.
16
0
2
4
6
8
10
12
14
16
18
20
2007 2008 2009 2010 2011 2012 2013 2014 2015 2016 2017 2018 2019 2020
ARA Brent Asia spot price Japan LNG term average Henry Hub NBP
Global energy and LNG prices
Note: MMBtu = Million British thermal units. ARA coal price has been heat-rate adjusted to gas plant efficiency equivalence.
Source: IHS © 2016 IHS
$/M
MB
tu
Asian-European spot
price differential to
erode as LNG trade
optimizes
Asia contract prices to
rebound with modest
oil price recovery
NBP will face
pressure as Europe
becomes LNG market
of last resort; but coal
provides a floor
Low-cost resource
base to hold down
Henry Hub
IHS 2016 Argentina Energy Symposium
© 2016 IHS. ALL RIGHTS RESERVED.
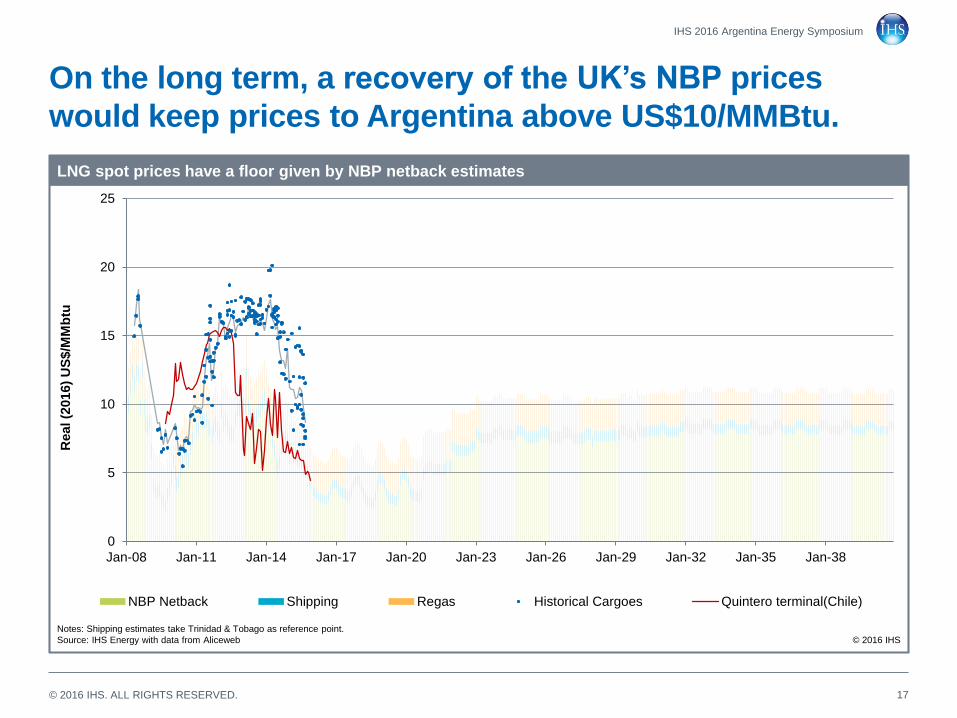
On the long term, a recovery of the UK’s NBP prices
would keep prices to Argentina above US$10/MMBtu.
17
IHS 2016 Argentina Energy Symposium
0
5
10
15
20
25
Jan-08 Jan-11 Jan-14 Jan-17 Jan-20 Jan-23 Jan-26 Jan-29 Jan-32 Jan-35 Jan-38
NBP Netback Shipping Regas Historical Cargoes Quintero terminal(Chile)
LNG spot prices have a floor given by NBP netback estimates
© 2016 IHS
Real (2
016)
US
$/M
Mb
tu
Notes: Shipping estimates take Trinidad & Tobago as reference point.
Source: IHS Energy with data from Aliceweb

© 2016 IHS. ALL RIGHTS RESERVED.
4 – Pricing policies are key sign-post for Vaca Muerta.
What is the outlook
for Argentine natural
gas supplies from
Vaca Muerta?

© 2016 IHS. ALL RIGHTS RESERVED.
Macri’s election improves the long term investment
potential of Vaca Muerta, but how much?
19
0
50
100
150
200
250
2000 2005 2010 2015 2020 2025 2030 2035 2040
Incremental - High case Incremental - Base case Unconventional supplies - Low caseConventional + Tight Reference Demand
Argentina - Illustrative natural gas deficit scenarios under Argentina supply cases
Source: IHS EnergyNotes: Demand outlook assuming all flexible generation from oil derived fuels takes place with natural gas.
© 2016 IHS
MM
cm
/d
IHS 2016 Argentina Energy Symposium

© 2016 IHS. ALL RIGHTS RESERVED.
Gas pricing policies are the key sign-post to investment
attractiveness, but political challenges remain.
20
0
2
4
6
8
10
12
14
16
18
20
Ja
n-0
8
Ap
r-0
8
Ju
l-0
8
Oct-
08
Ja
n-0
9
Ap
r-0
9
Ju
l-0
9
Oct-
09
Ja
n-1
0
Ap
r-1
0
Ju
l-1
0
Oct-
10
Ja
n-1
1
Ap
r-1
1
Ju
l-1
1
Oct-
11
Jan-1
2
Ap
r-1
2
Ju
l-1
2
Oct-
12
Ja
n-1
3
Ap
r-1
3
Ju
l-1
3
Oct-
13
Ja
n-1
4
Ap
r-1
4
Jul-1
4
Oct-
14
Ja
n-1
5
Ap
r-1
5
Ju
l-1
5
Oct-
15
Old contracts price Bolivian import price LNG imports price Gas Plus Program price
Gas Plus program in place since 2008
© 2016 IHS
US
$/M
MB
tu
Source: IHS Energy, Ministerio de Energía y Mineria (Argentina)
IHS 2016 Argentina Energy Symposium
© 2016 IHS. ALL RIGHTS RESERVED.
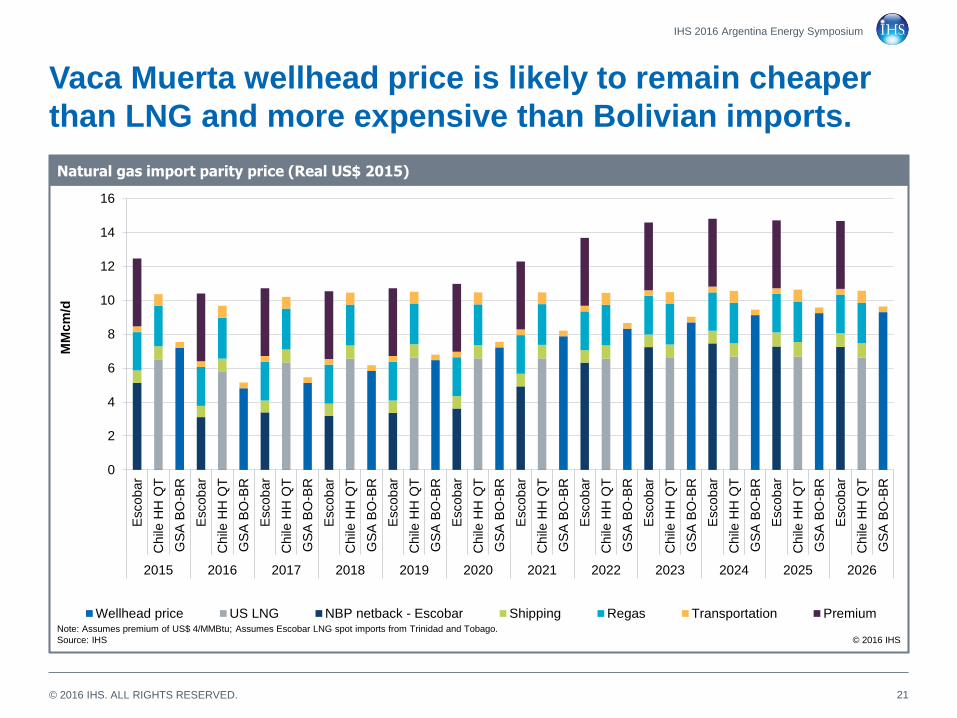
Vaca Muerta wellhead price is likely to remain cheaper
than LNG and more expensive than Bolivian imports.
21
0
2
4
6
8
10
12
14
16
Escob
ar
Ch
ile H
H Q
T
GS
A B
O-B
R
Escob
ar
Ch
ile H
H Q
T
GS
A B
O-B
R
Escob
ar
Ch
ile H
H Q
T
GS
A B
O-B
R
Escob
ar
Ch
ile H
H Q
T
GS
A B
O-B
R
Escob
ar
Ch
ile H
H Q
T
GS
A B
O-B
R
Escob
ar
Ch
ile H
H Q
T
GS
A B
O-B
R
Escob
ar
Ch
ile H
H Q
T
GS
A B
O-B
R
Escob
ar
Ch
ile H
H Q
T
GS
A B
O-B
R
Escob
ar
Ch
ile H
H Q
T
GS
A B
O-B
R
Escob
ar
Ch
ile H
H Q
T
GS
A B
O-B
R
Escob
ar
Ch
ile H
H Q
T
GS
A B
O-B
R
Escob
ar
Ch
ile H
H Q
T
GS
A B
O-B
R
2015 2016 2017 2018 2019 2020 2021 2022 2023 2024 2025 2026
Wellhead price US LNG NBP netback - Escobar Shipping Regas Transportation Premium
Natural gas import parity price (Real US$ 2015)
Note: Assumes premium of US$ 4/MMBtu; Assumes Escobar LNG spot imports from Trinidad and Tobago.
Source: IHS © 2016 IHS
MM
cm
/d
IHS 2016 Argentina Energy Symposium
© 2016 IHS. ALL RIGHTS RESERVED.
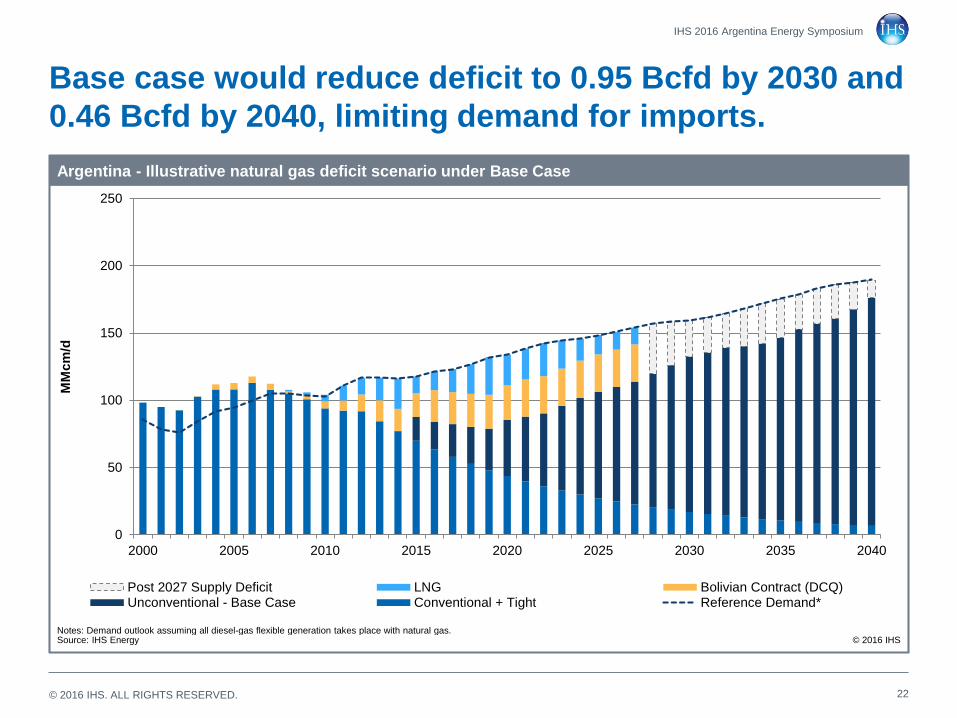
Base case would reduce deficit to 0.95 Bcfd by 2030 and
0.46 Bcfd by 2040, limiting demand for imports.
22
IHS 2016 Argentina Energy Symposium
0
50
100
150
200
250
2000 2005 2010 2015 2020 2025 2030 2035 2040
Post 2027 Supply Deficit LNG Bolivian Contract (DCQ)Unconventional - Base Case Conventional + Tight Reference Demand*
Argentina - Illustrative natural gas deficit scenario under Base Case
Source: IHS EnergyNotes: Demand outlook assuming all diesel-gas flexible generation takes place with natural gas.
© 2016 IHS
MM
cm
/d

© 2016 IHS. ALL RIGHTS RESERVED.
Key take-aways
Vaca Muerta well
positioned to meet
demand growth, but
pricing is key.
LNG prices are likely
to remain low over
the next 5 years,
pressuring VM
supplies.
Bolivian imports
could increase if
Petrobras does not
fully renew in 2019.
Argentina natural gas
demand is set to grow
over the next 20 years,
requiring incremental
supplies.
IHSTM ENERGY
COPYRIGHT NOTICE AND DISCLAIMER © 2016 IHS. For internal use of IHS clients only.
No portion of this report may be reproduced, reused, or otherwise distributed in any form without prior written consent, with the exception of any internal client distribution as may be permitted in the license agreement between client and IHS. Content
reproduced or redistributed with IHS permission must display IHS legal notices and attributions of authorship. The information contained herein is from sources considered reliable, but its accuracy and completeness are not warranted, nor are the
opinions and analyses that are based upon it, and to the extent permitted by law, IHS shall not be liable for any errors or omissions or any loss, damage, or expense incurred by reliance on information or any statement contained herein. In particular,
please note that no representation or warranty is given as to the achievement or reasonableness of, and no reliance should be placed on, any projections, forecasts, estimates, or assumptions, and, due to various risks and uncertainties, actual events
and results may differ materially from forecasts and statements of belief noted herein. This report is not to be construed as legal or financial advice, and use of or reliance on any information in this publication is entirely at client’s own risk. IHS and the
IHS logo are trademarks of IHS.
IHS Customer Care:
Americas: +1 800 IHS CARE (+1 800 447 2273); [email protected]
Europe, Middle East, and Africa: +44 (0) 1344 328 300; [email protected]
Asia and the Pacific Rim: +604 291 3600; [email protected]