arginase and sucrase potential in the fission … filearginase and sucrase potential in the fission...
TRANSCRIPT
J. Cell Set. 46, 399-431 (1980) 399Printed in Great Britain © Company of Biologists Limited igSo
ARGINASE AND SUCRASE POTENTIAL IN THE
FISSION YEAST SCHIZOSACCHAROMYCES
POMBE
TAHIA BENITEZ,* P. NURSEf AND J. M. MITCHISON
Department of Zoology, University of Edinburgh, West Mains Road,Edinburgh, EHg 3JT, Scotland
SUMMARY
The induction potentials of 2 enzymes, sucrase and arginase, have been measured in asyn-chronous and synchronous cultures of the fission yeast Schizosaccharomyces pombe.
The effect on potential of inhibiting DNA synthesis in asynchronous cultures has beenstudied using 2 temperature-sensitive ede mutants, one blocked in DNA replication and theother blocked in mitosis. The results show that despite inhibition of DNA synthesis, sucraseand arginase potential both continue to increase exponentially for at least a generation ofgrowth after shifting the ede mutants from the permissive to the restrictive temperature. Asecond method of inhibiting DNA synthesis, using deoxyadenosine, has also been tested.Cells treated with deoxyadenosine stop the increase in potential for a short period. However,experiments carried out using a ede mutant together with deoxyadenosine show that the blockto the increase in potential is due to a side effect of the inhibitor.
It appears that increase in potential is not dependent upon continued DNA replication,and that gene dosage does not control potential in the normal cell cycle. This conclusion issupported by measurements on mutants of different cell sizes. Potential is proportional to size(protein content per cell in asynchronous culture) and not to DNA content.
Although potential is not gene limited in normal cells, it does appear to be so in theabnormally large cells produced by a ede block. If ede mutants of different sizes are grownasynchronously, and DNA synthesis is inhibited by a shift to the restrictive temperature,potential continues to increase until the cells reach a critical DNA/protein ratio beyond whichthere is no increase in potential. This critical ratio is different for the 2 enzymes, but for eachenzyme it is similar in all the mutants tested. When large cells (produced by a mutant blockfor 4 5 h) are shifted down in temperature, there are synchronous rounds of DNA synthesisand division and also step doublings in potential.
In synchronous cultures of wild type cells, both enzymes show a stepwise doubling ofpotential at 0 2 of a cycle after DNA replication. In synchronous cultures of ede mutantsblocked either in replication or in mitosis, the potential steps continue with the normal timingobserved in wild type cells. This shows that the steps are not dependent on the events of theDNA-division cycle but are controlled by another mechanism. Attainment of a critical sizemight be part of this mechanism, but tests with size mutants argue against this.
• Present address: Departamento de Genetica, Facultad de Ciencias, Universidad deSevilla, Sevilla, Spain.
f Present address: School of Biological Sciences, University of Sussex, Falmer, Brighton,BNi Q.QG, Sussex, England.
Correspondence to: Professor J. M. Mitchison, Department of Zoology, West Mains Road,Edinburgh EHo 3JT, Scotland.
400 T. Benitez, P. Nurse and J. M. Mitchison
INTRODUCTION
The synthesis of some enzymes in cell cultures can be induced or derepressed bychanging the growth medium. The maximum rate of increase of enzyme activityduring induction is called the enzyme 'potential' (Kuempel, Masters & Pardee, 1965;Schmidt, 1974)- This increase is usually assumed to be due to enzyme synthesis,though in most cases without strict justification. It is worth emphasizing that enzymepotential is a rate measurement under conditions of challenge and does not necessarilybear any relation to the basal or the fully induced level of the enzyme in a culture.
During the last 14 years, there has been a substantial amount of work on changesin enzyme potential during the cell cycle using samples taken from synchronouscultures. In a large majority of the cases in prokaryotes, potential is not restrictedduring the cycle and shows a stepwise doubling at one stage (references in Mitchison,1971). It has been suggested that this step is a gene-dosage effect and that the potentialof a cell for a particular enzyme is limited by the number of copies of the structuralgene present in that cell. When the gene doubles during DNA replication, potentialalso doubles. This hypothesis is supported by 3 sets of experiments. First, sucrasepotential in Bacillus subtilis doubles at the same time in the cycle as does the sucrasetransforming ability of the DNA (Masters & Pardee, 1965). Secondly, the potentialsteps in the Escherichia coli cell cycle have the same order and spacing as the geneson the chromosome (Donachie & Masters, 1969; Helmstetter, 1968; Pato & Glaser,1968). Thirdly, increases in potential in E. coli are blocked by inhibition of DNAsynthesis (Donachie & Masters, 1966; Pato & Glaser, 1968). These last experimentsare particularly telling since they test dependency rather than simply demonstratingtemporal coincidence.
In contrast, the situation in eukaryotes is much less clear. In some cases, there is astep (or at any rate a sharp rise) which is roughly coincident with the 5-period(Turner, Gronostajski & Schmidt, 1978; Woodward & Merrett, 1975). In others,there is a step which is not coincident with the 5-period (Baechtel, Hopkins &Schmidt, 1970; Mitchison & Creanor, 1969; Mitchison & Creanor, 1971; Sebastian,Carter & Halvorson, 1973). But there are also patterns which are not simple stepsand show one or more peaks (Knutsen, 1965,1968; Lien&Knutsen, 1972; McCullough& John, 1972; Schreiner, Lien & Knutsen, 1975). In addition, mammalian cells canshow potential which is restricted to particular parts of the cycle (Kapp & Okada,1972; Martin, Tomkins & Granner, 1969). The gene-dosage hypothesis cannottherefore apply in a simple way to all the eukaryotic situations.
In this and the following 2 papers, we explore the controls on enzyme potential ina simple eukaryote, SMzosaccharomyces pontbe. We exploit cdc mutants that can beblocked in their progress through the 'DNA-Division cycle' (Mitchison, 1971), andalso mutants, such as wee mutants, that divide at different sizes.
Enzyme potential in yeast 401
MATERIALS AND METHODS
Organisms
A wild type strain 972h~ of Schizosaccharomyces pombe (originally obtained from ProfessorU. Leupold, Bern) and its mutants were used for nearly all experiments. One experiment(in Fig. 6) was done with strain N.C.Y.C. 132 (A.T.C.C. 24751) of S. pombe. The mutantswee 1.50, wee 2.1 and wee 1.6 divide at half the size of the wild type strain (Nurse, 1975;Thuriaux, Nurse & Carter, 1978) and the mutants cdc 2.33, cdc 10.129, c<& 11.136, cdc 13.117,cdc 15.140 and cdc 2M35 are temperature sensitives which form colonies at 25 °C but not at35 °C (Nurse, Thuriaux & Nasmyth, 1976). cdc 25.22 was derived from the sterile strain ED22(Nurse et al. 1976) by spheroplast fusion (Sipiczki, M., Thuriaux, P. and Fantes, P., unpub-lished), cdc 10.129 is blocked in the initiation of DNA replication when shifted to the restrictivetemperature. The early cell plate mutants, cdc 11.136 and cdc 15.140 are blocked in cell divisionbut nuclear division and DNA replication continue. The rest of the cdc mutants are blockedbefore or during mitosis when shifted to the restrictive temperature. The double mutantswee 1.6-cdc 2.33 and wee l.b-cdc 10.129 were constructed by the appropriate crosses and tetradanalysis. All the mutants have similar generation times to wild type, that is, about 4 h at 25 °Cand 25 h at 35 °C when growing in minimal medium.
Media and growth conditions
The minimal medium used in sucrase experiments was EMM2 (Mitchison, 1970) which wasmodified by replacing the acetate buffer by potassium hydrogen phthalate at 15 mM to reduceclumping (Nurse, 1975). In the arginase experiments the ammonium salt of the EMM2 modi-fied medium was replaced by 20 mM glutamate as the nitrogen source. Cultures were grownwith stirring at 35° and 25 °C.
Synchronous cultures
Synchronous cultures were prepared by selecting small cells from lactose gradients aftercentrifuging either in a zonal rotor or in tubes (Mitchison & Carter, 1975). Cells were grownin EMM2 modified medium at 35 °C and harvested during the exponential phase of growth(2-3 x io8 cells/ml) by filtration through a 50-cm diameter Whatman No. 50 filter paper. Thecells were resuspended in 25 ml minimal medium and layered on top of a 7-5~30 % lactosegradient made up in minimal medium established in a MSE type A zonal rotor. Cells wereseparated at 2000 rev/min and fractions of the separated cells collected. Small cells from thetop of the gradient were inoculated into 200 ml of minimal medium at 35 °C with a density of2 x io9 cells/ml.
In some experiments the cells were collected by filtration on a Whatman No. 50 paper, madeup to 5 ml and then layered on to the top of an 80-ml linear gradient of 7'5~3O% lactose inminimal medium in a 100-ml centrifuge tube. After centrifuging for 4-5 min at 1500 rev/min,about 1-2 ml of the top layer of small cells were removed by a syringe and added to 100—200 ml of fresh medium at 35 °C to give a concentration of 1-5-2 x io6 cells/ml. Synchronouscultures were followed for 6-7 h with samples taken periodically for arginase induction orsucrase derepression, for cell number and for protein.
Asynchronous control cultures were made in exactly the same way as the synchronouscultures except that the whole content of the gradient tube was shaken up and mixed togetherafter centrifuging. 1—2 ml from the cell suspension was then added to fresh medium to give thesame cell concentration as the synchronous culture.
Determination of cell number, protein, DNA, sucrase and arginase
Cell number was determined with a Coulter Counter. For protein determination, samples,were placed into trichloroacetic acid at a final concentration of 5 %, kept overnight at o °Cand finally filtered through Millipore filters and washed twice with distilled water. Thesamples were then kept frozen at —20 °C. Proteins were extracted from the cells with 1 M.
402 T. Benitez, P. Nurse and J. M. Mitchison
NaOH containing 0-4 % deoxycholate at room temperature for 1 h, and were measured by theFolin reaction (Lowry, Rosebrough, Farr & Randall, 1951). The rates of DNA synthesis weremeasured by pulsing o-4-ml aliquots of the cultures with [3H]uracil for 30 min and removingthe label not incorporated into DNA as described by Nasmyth, Nurse & Fraser (1979). Theenzyme assays were done on cells which had been frozen and thawed. Assay methods were asdescribed in the following references: sucrase (E.C. 3.2.1.26), (Dahlqvist, 1966), arginase(E.C. 3.5.3.1) slightly modified from Middlehoven (1964), sucrase in cells treated withhydroxyquinoline (Creanor, May & Mitchison, 1975). Maltase (E.C. 3.2.1.20) was assayedin the same way as sucrase except that maltose was used as the substrate (Mitchison & Creanor,1971). The assay mixtures were incubated at 30 °C for 30 min.
Chemicals
8-hydroxyquinoline was dissolved at 5 mg/ml in ethanol and added to cultures to give afinal concentration of 50 /ig/ml. Cycloheximide was dissolved in phosphate buffer pH 6-7 andused at a final concentration of 100/tg/ml. 2-deoxyadenosine was used at a final concentrationof 3 mM (with strain 132) or 4 mM (with strain 972).
RESULTS
Lack of dependency of potential increase on DNA replication
In this section, methods of measuring sucrase and arginase potential are described,together with the response of these enzymes to inhibition of protein and RNAsynthesis. Potential is shown to increase for 1-2 generations of growth in asynchronouscultures of cdc mutants where DNA synthesis is blocked. Deoxyadenosine, aninhibitor of DNA synthesis, is shown to have side effects on potential.
Derepression of sucrase and induction of arginase
Sucrase can be derepressed in S. pombe strain 132 by diluting a growing cultureinto a medium containing 0-05 % glucose (Mitchison & Creanor, 1969). However,strain 972 was found to grow very slowly in 0-05 % (w/v) glucose (a generation timeof 6-8 h compared with 2-5 h in the usual 1 % glucose) and its growth was furtherinhibited by the dilution procedure itself. To avoid these problems sucrase wasderepressed by filtering cells from the main culture through Oxoid filters and re-suspending them in a subculture of medium containing 0-15 % (w/v) glucose. Using0-15% glucose the generation time was almost unchanged although sucrase activityonly increased about 4-fold (Fig. 1) compared to the 5- to 6-fold using 0-05 % glucose(Mitchison & Creanor, 1969). The filtration process did not seem to inhibit the cellsas growth resumed immediately after resuspension. From the subcultures, samplesof 250 fi\ were taken, filtered through Millipore filters, washed with 50 mM MgCl2
and frozen in dry ice.Arginase was induced by adding arginine to cells growing in medium containing
glutamate as the sole nitrogen source to give a final concentration of arginine of 20 mM.From these subcultures 2OO-/d samples were taken, filtered through Millipore filters,washed with o-oi M Tris buffer pH 8 containing 0-024 M MnCl2, and frozen in dryice. A modified procedure was also used whereby the 2oo-/tl sample was placed in atube containing 10/tl o-i M Tris buffer pH 8 containing 0-25 M MnCl2, and frozen
Enzyme potential in yeast
20
4°3
50
2
050
10
II> 201cen<
#-•*
10
1
Time, h
Fig. i
' 2
Time, h
Fig. 2
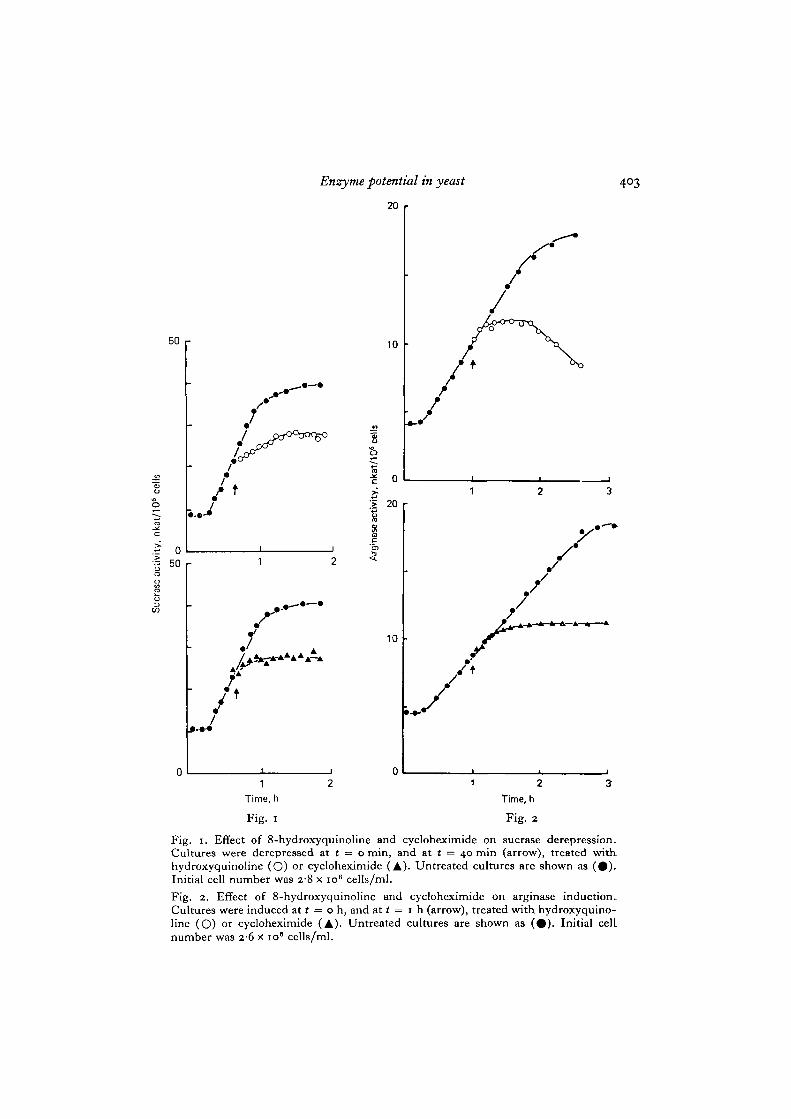
Fig. i. Effect of 8-hydroxyquinoline and cycloheximide on sucrase derepression.Cultures were derepressed at t = o min, and at t = 40 min (arrow), treated withhydroxyquinoline (O) or cycloheximide (A). Untreated cultures are shown as ( • ) .Initial cell number was 28 x io8 cells/ml.
Fig. 2. Effect of 8-hydroxyquinoline and cycloheximide on arginase induction.Cultures were induced at t = o h, and at t = 1 h (arrow), treated with hydroxyquino-line (O) or cycloheximide (A). Untreated cultures are shown as ( • ) . Initial celLnumber was 26 x 10' cells/ml.
404 T. Benitez, P. Nurse and J. M. Mitchison
as above. In both cases arginase activity increased about 4-fold after addition ofarginine (Fig. 2).
To investigate whether the appearance of enzyme activity required protein andRNA synthesis, the inhibitors cycloheximide and 8-hydroxyquinoline were added tocells undergoing derepression of sucrase and induction or arginase. Cycloheximide,an inhibitor of protein synthesis, prevented further increase in enzyme activity afterabout 15 min for sucrase (Fig. 1) and 40 min for arginase (Fig. 2). This result suggeststhat continued protein synthesis is required for increase in enzyme activity althoughthere may be a short ' precursor delay' between synthesis of the enzymes and theireventual activation (Mitchison & Creanor, 1969).
The response of the 2 enzymes to 8-hydroxyquinoline, an inhibitor of RNAsynthesis (Fraser & Creanor, 1974), differed. When the inhibitor was added to cellsderepressing sucrase, enzyme synthesis continued for 40 min but at a declining rate(Fig. 1), suggesting that an unstable RNA species (presumably mRNA for sucrase)was responsible for the increase in enzyme activity. Similar results were obtainedwith strain 132 at low cell density (Creanor et al. 1975). The plateau eventuallyobserved in sucrase after cycloheximide and hydroxyquinoline treatments indicatesthat it is stable under both conditions. When 8-hydroxyquinoline was added to cellsderepressing arginase, increase in enzyme activity stopped immediately. The mechan-ism of inhibition by 8-hydroxyquinoline appears to be chelation of divalent ionsrequired for RNA synthesis (Fraser & Creanor, 1975). Since arginase requires Mn2+
before it can become activated, it is likely that the inhibition of further increase inenzyme activity was due to a chelating effect of 8-hydroxyquinoline directly preventingarginase activation. To overcome this problem arginase was activated in vitro byincubating samples for 15 min at 50 °C with o-oi M Tris buffer pH 8 containing10 mM MnCl2. Using this procedure to assay arginase in cells being induced in thepresence of 8-hydroxyquinoline, enzyme synthesis was found to continue for a shorttime with a declining rate (Fig. 2). As with sucrase, this result suggests that anunstable mRNA was responsible for the increase in enzyme activity. On prolongedincubation the arginase activity began to fall indicating that the enzyme is unstableunder these conditions. Since arginase was stable under conditions of cycloheximideinhibition (Fig. 2), arginase instability may involve de novo synthesis of inactivatingenzymes which are not inhibited by 8-hydroxyquinoline, but are by cycloheximide.
The estimate of potential was made by measuring the slope of the steepest linearpart of the derepression or induction curve. This procedure together with that usedto give the estimate of potential with respect to the beginning of the derepression orinduction, have been described in detail previously (Mitchison & Creanor, 1969).
Sucrase and arginase potential in cdc 10.129 aru^ c^° 2-33 after shift from 250 to 35 °CTo test whether increase in potential was dependent upon DNA replication sucrase
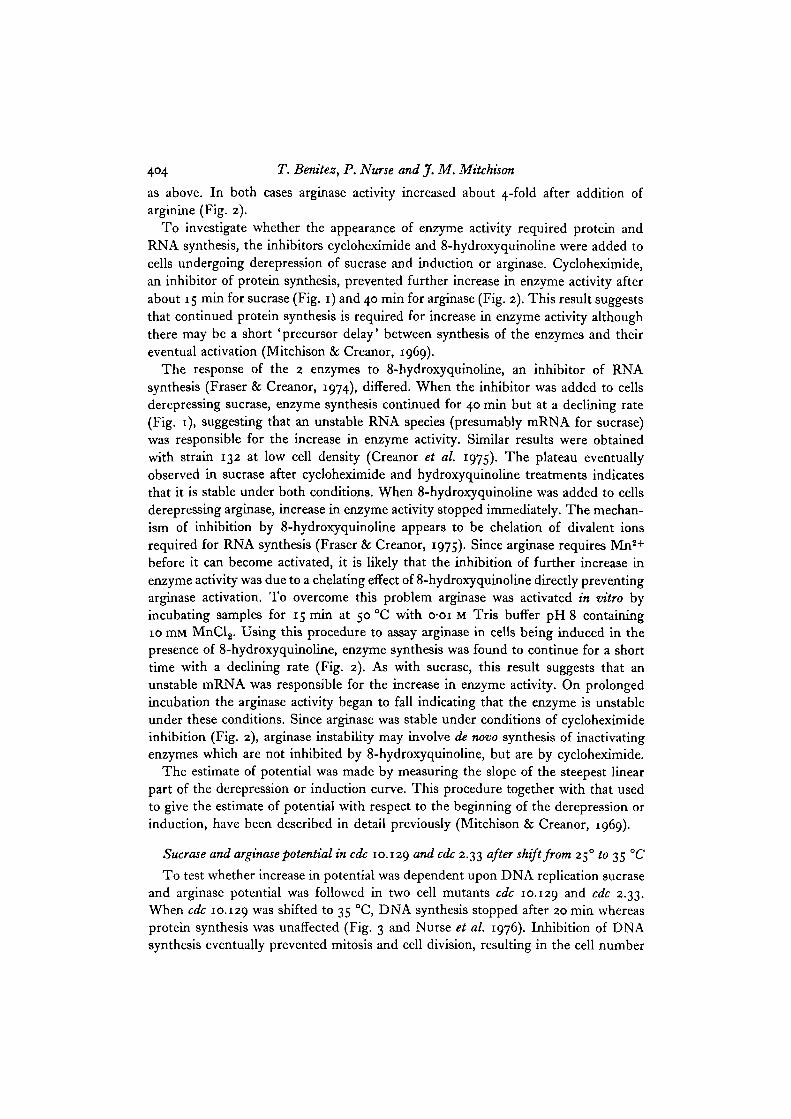
and arginase potential was followed in two cell mutants cdc 10.129 an<^ c<^c 2-33-When cdc 10.129 w a s shifted to 35 °C, DNA synthesis stopped after 20 min whereasprotein synthesis was unaffected (Fig. 3 and Nurse et al. 1976). Inhibition of DNAsynthesis eventually prevented mitosis and cell division, resulting in the cell number
Enzyme potential in yeast 405
reaching a plateau after about a doubling. In this, and most cdc mutants, protein/genome increases when DNA synthesis stops and protein/cell (cell size) increaseswhen cell division stops. Despite the prevention of DNA replication, sucrase potentialincreased for 5-6 h and arginase potential for 4 h, after which times they both ceasedrising (Fig. 3). This result indicates that potential can still increase for 1-2 generationsof growth in the absence of any DNA replication.
10 r
'c
I
Time, h
Fig. 3. Asynchronous culture of cdc 10.129 shifted from 250 to 35 °C at t = o h.Protein ( • ) , i A.U. = 8-4 fig protein/ml; cell no. (O), i A.U. = 1-3 x io ' cells/ml;sucrase potential (A), 1 A.U. = sonkat/h/ml; arginase potential ( • ) , 1 A.U. =7-0 nkat/h/ml.
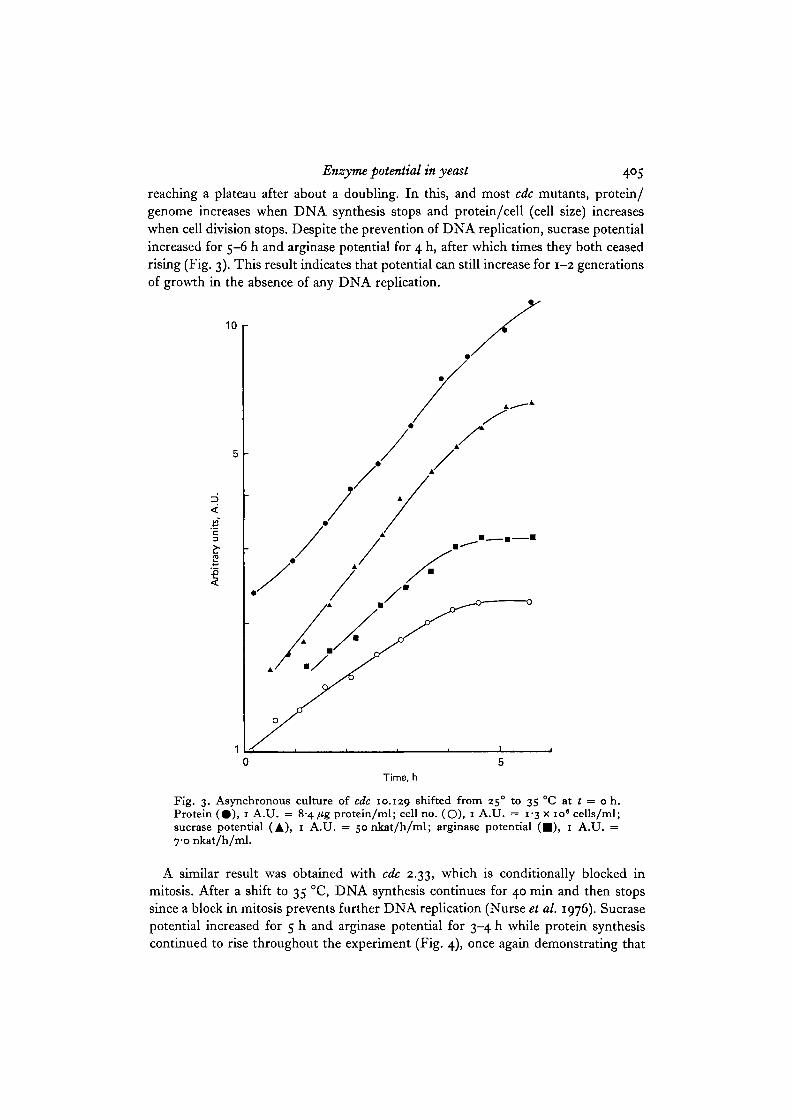
A similar result was obtained with cdc 2.33, which is conditionally blocked inmitosis. After a shift to 35 °C, DNA synthesis continues for 40 min and then stopssince a block in mitosis prevents further DNA replication (Nurse et al. 1976). Sucrasepotential increased for 5 h and arginase potential for 3-4 h while protein synthesiscontinued to rise throughout the experiment (Fig. 4), once again demonstrating that
406 T. Benitez, P. Nurse and J. M. Mitchison
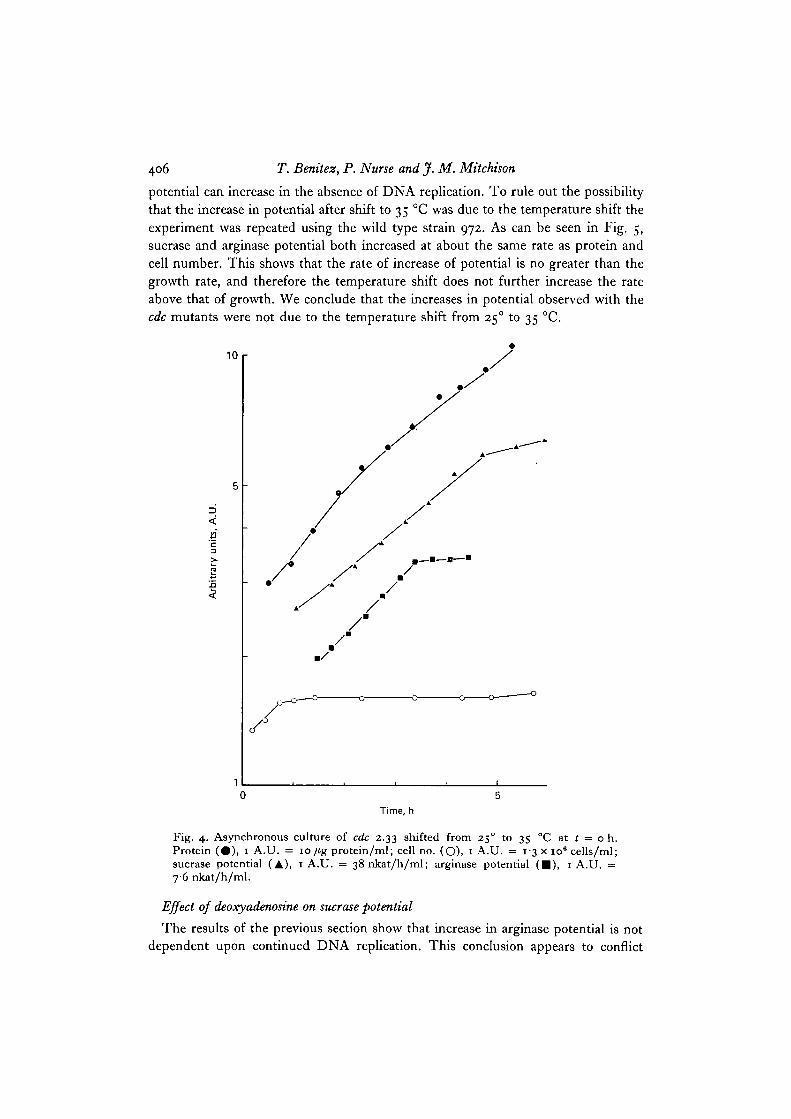
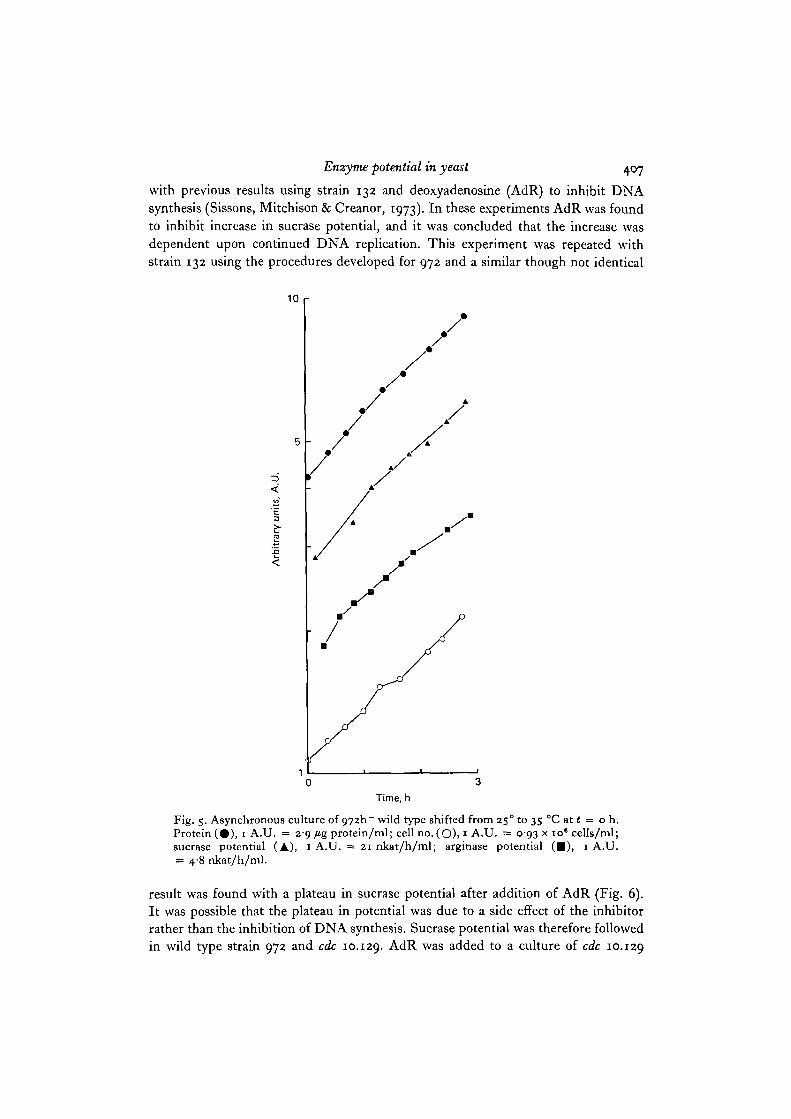
potential can increase in the absence of DNA replication. To rule out the possibilitythat the increase in potential after shift to 35 °C was due to the temperature shift theexperiment was repeated using the wild type strain 972. As can be seen in Fig. 5,sucrase and arginase potential both increased at about the same rate as protein andcell number. This shows that the rate of increase of potential is no greater than thegrowth rate, and therefore the temperature shift does not further increase the rateabove that of growth. We conclude that the increases in potential observed with thecdc mutants were not due to the temperature shift from 250 to 35 °C.
10 r
4'c
Time, h
Fig. 4. Asynchronous culture of cdc 2.33 shifted from 25° to 35 °C at t = o h.Protein (#), 1 A.U. = 10/ig protein/ml; cell no. (O), 1 A.U. = 13 x io6 cells/ml;sucrase potential (A), 1 A.U. = 38 nkat/h/ml; arginase potential ( • ) , 1 A.U. =76 nkat/h/ml.
Effect of deoxyadenosine on sucrase potential
The results of the previous section show that increase in arginase potential is notdependent upon continued DNA replication. This conclusion appears to conflict
Enzyme potential in yeast 407
with previous results using strain 132 and deoxyadenosine (AdR) to inhibit DNAsynthesis (Sissons, Mitchison & Creanor, 1973). In these experiments AdR was foundto inhibit increase in sucrase potential, and it was concluded that the increase wasdependent upon continued DNA replication. This experiment was repeated withstrain 132 using the procedures developed for 972 and a similar though not identical
Time, h
Fig. 5. Asynchronous culture of 972I1- wild type shifted from 250 to 35 °C at t = o h.Protein ( • ) , 1 A.U. = 29 fig protein/ml; cell no. (O). J A. U. = 093 x io6 cells/ml;sucrase potential (A), 1 A.U. = 21 nkat/h/ml; arginase potential ( • ) , 1 A.U.= 4-8 nkat/h/ml.
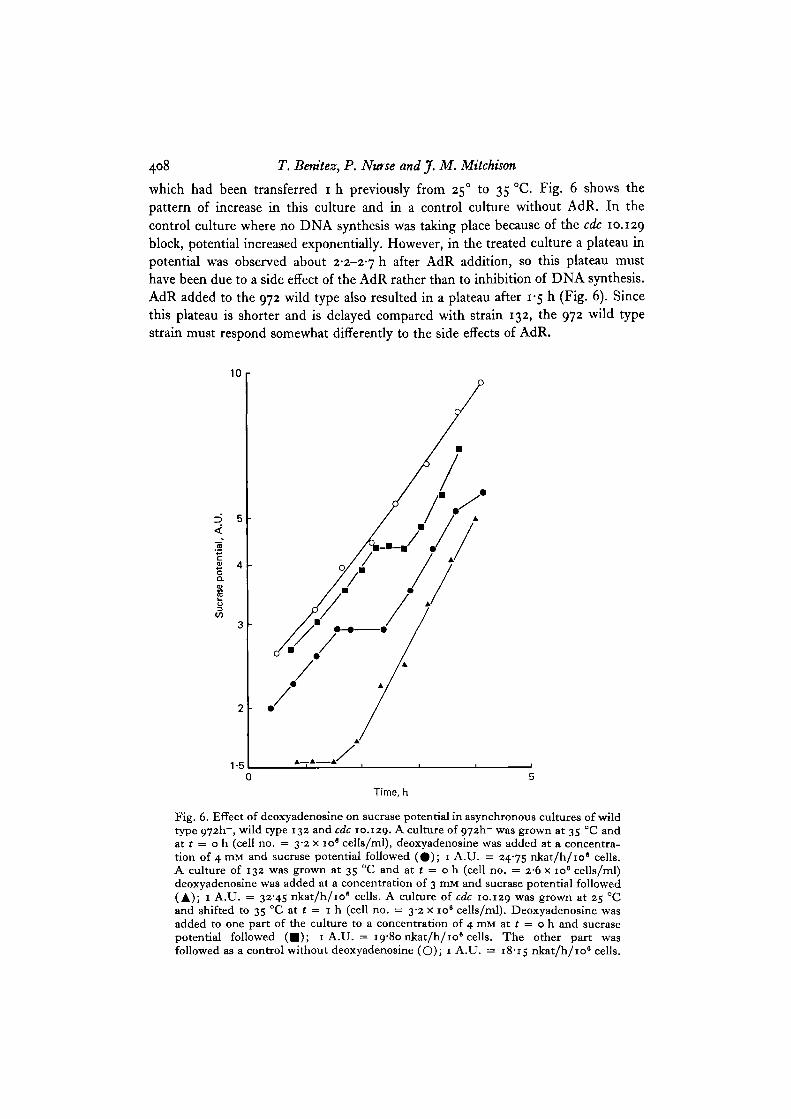
result was found with a plateau in sucrase potential after addition of AdR (Fig. 6).It was possible that the plateau in potential was due to a side effect of the inhibitorrather than the inhibition of DNA synthesis. Sucrase potential was therefore followedin wild type strain 972 and cdc 10.129. AdR was added to a culture of cdc 10.129
408 T. Benitez, P. Nutse and J. M. Mitchison
which had been transferred i h previously from 25° to 35 °C. Fig. 6 shows thepattern of increase in this culture and in a control culture without AdR. In thecontrol culture where no DNA synthesis was taking place because of the cdc 10.129block, potential increased exponentially. However, in the treated culture a plateau inpotential was observed about 2-2-2-7 h after AdR addition, so this plateau musthave been due to a side effect of the AdR rather than to inhibition of DNA synthesis.AdR added to the 972 wild type also resulted in a plateau after 1-5 h (Fig. 6). Sincethis plateau is shorter and is delayed compared with strain 132, the 972 wild typestrain must respond somewhat differently to the side effects of AdR.
Time, h
Fig. 6. Effect of deoxyadenosine on sucrase potential in asynchronous cultures of wildtype 972h~, wild type 132 and cdc 10.129. A culture of 972h~ was grown at 35 °C andat t = o h (cell no. = 3-2 x io° cells/ml), deoxyadenosine was added at a concentra-tion of 4 mM and sucrase potential followed (# ) ; 1 A.U. = 24-75 nkat/h/109 cells.A culture of 132 was grown at 35 °C and at t = o h (cell no. = 2-6 x io6 cells/ml)deoxyadenosine was added at a concentration of 3 mM and sucrase potential followed(A); 1 A.U. = 32-45 nkat/h/io" cells. A culture of cdc 10.129 w a s grown at 25 °Cand shifted to 35 CC at t = 1 h (cell no. = 3-2 x 10s cells/ml). Deoxyadenosine wasadded to one part of the culture to a concentration of 4 mM at ( = o h and sucrasepotential followed ( • ) ; 1 A.U. = 19-80 nkat/h/10* cells. The other part wasfollowed as a control without deoxyadenosine (O); 1 A.U. = 18-15 nkat/h/106 cells.
Enzyme potential in yeast 409
The effect of DNA /protein ratio on arginase and sucrose potential
In this section, mutants of different sizes are used to show that potential in asyn-chronous cultures is proportional to protein content and not to gene dosage. Whenthese mutants are cdc and DNA synthesis is blocked, potential increases up to acritical protein/DNA ratio and then stops increasing. This critical ratio is the samefor mutants of different initial size. Gene limitation of potential appears to operate inthese abnormally large cells. When they are released from the block, potential increasesconcomitantly with DNA synthesis.
.= 2O
I 1
°" 0
4
< 3
-1—I—I—I—I—[—
10 20Protein, pg/cell
30
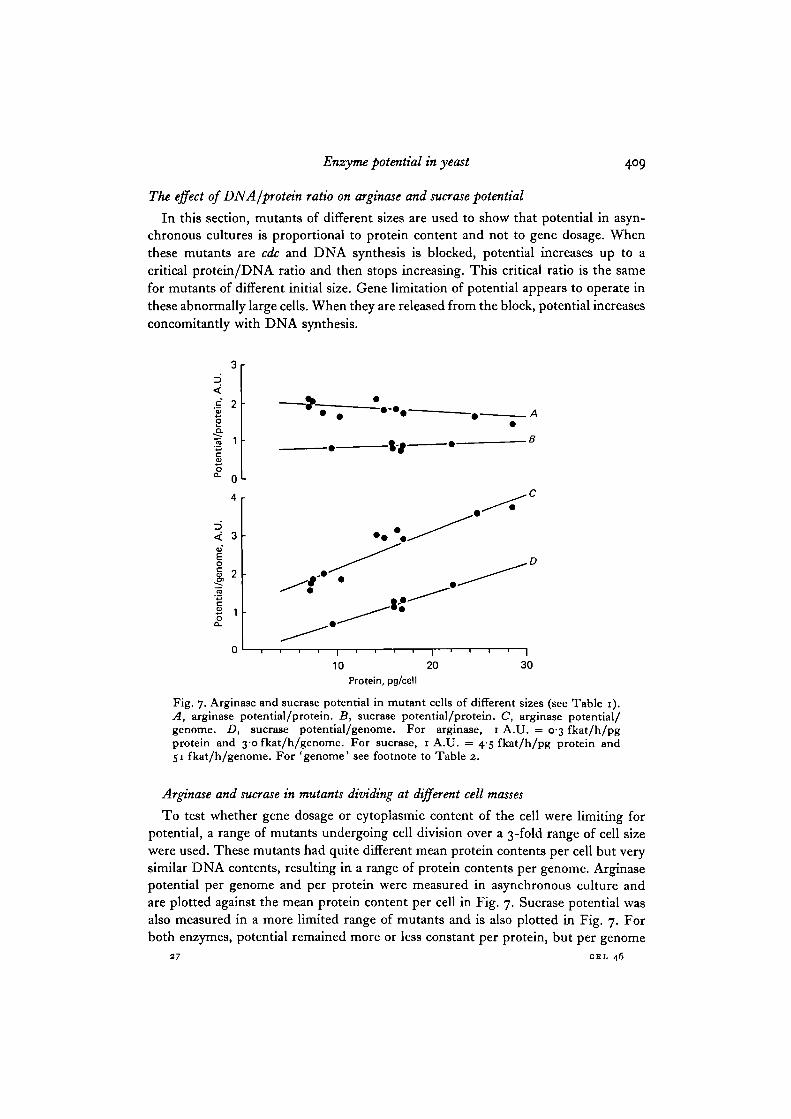
Fig. 7. Arginase and sucrase potential in mutant cells of different sizes (see Table 1).A, arginase potential/protein. B, sucrase potential/protein. C, arginase potential/genome. D, sucrase potential/genome. For arginase, 1 A.U. = 0-3 fkat/h/pgprotein and 30 fkat/h/genome. For sucrase, 1 A.U. = 4-5 fkat/h/pg protein and51 fkat/h/genome. For 'genome' see footnote to Table 2.
Arginase and sucrase in mutants dividing at different cell masses
To test whether gene dosage or cytoplasmic content of the cell were limiting forpotential, a range of mutants undergoing cell division over a 3-fold range of cell sizewere used. These mutants had quite different mean protein contents per cell but verysimilar DNA contents, resulting in a range of protein contents per genome. Arginasepotential per genome and per protein were measured in asynchronous culture andare plotted against the mean protein content per cell in Fig. 7. Sucrase potential wasalso measured in a more limited range of mutants and is also plotted in Fig. 7. Forboth enzymes, potential remained more or less constant per protein, but per genome
27 CKL 46
Tab
le I
. En
zyme
act
ivit
y in
cel
ls o
f dz
flere
nt s
izes
in S
. pom
be
Rel
ativ
e pr
otei
n :
Arg
inas
e S
ucra
se
Mal
tase
P
rote
in p
er c
ell/
Pro
tein
per
&
-
t
0
cell
of
wil
d ty
pe 972
Bas
al
Ind
uce
d
Bas
al
Der
epre
ssed
B
asal
D
erep
ress
ed
972 w
ild
type
w
ee 2.1
EA
/cel
l E
A/p
rot.
wee
1.6
EA
/cel
l E
A/p
rot.
wee
1.50
EA
/cel
l E
A/p
rot.
wee
1.6 cdc 10.129
EA
/cel
l E
A/p
rot.
wee
1.6 c
dc 2.33
EA
/cel
l E
A/p
rot.
cdc 10.129
EA
/cel
l E
A/p
rot.
cdc 25.22
EA
/cel
l E
A/p
rot.
cdc 2M35
EA
lcel
l E
A/p
rot.
EA
/cel
l =
Enz
yme
acti
vity
per
cel
l/E
nzym
e ac
tivi
ty p
er c
ell
of w
ild
type
972.
EA
/pro
t. =
Enz
yme
acti
vity
per
pro
tein
/Enz
yme
acti
vity
per
pro
tein
of
wil
d ty
pe 972.
Enzyme potential in yeast 411
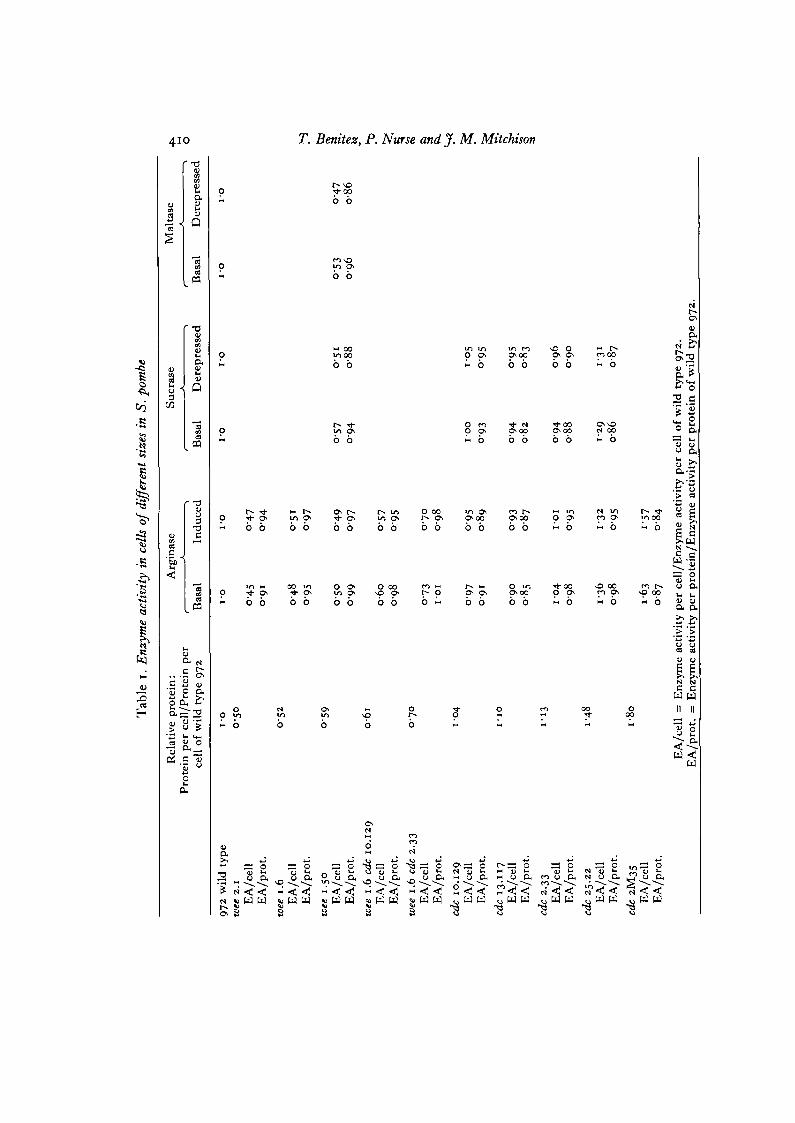
it increased as the mean protein content per cell increased. This indicates thatpotential is not limited by gene dosage, but by cell size. In the same experiment thebasal and fully induced or derepressed levels of arginase and sucrase were alsomeasured (Table 1). Once again the enzyme levels per cell increased as mass atdivision increased, but remained reasonably constant per unit of protein.
10
3
CO
Time, h
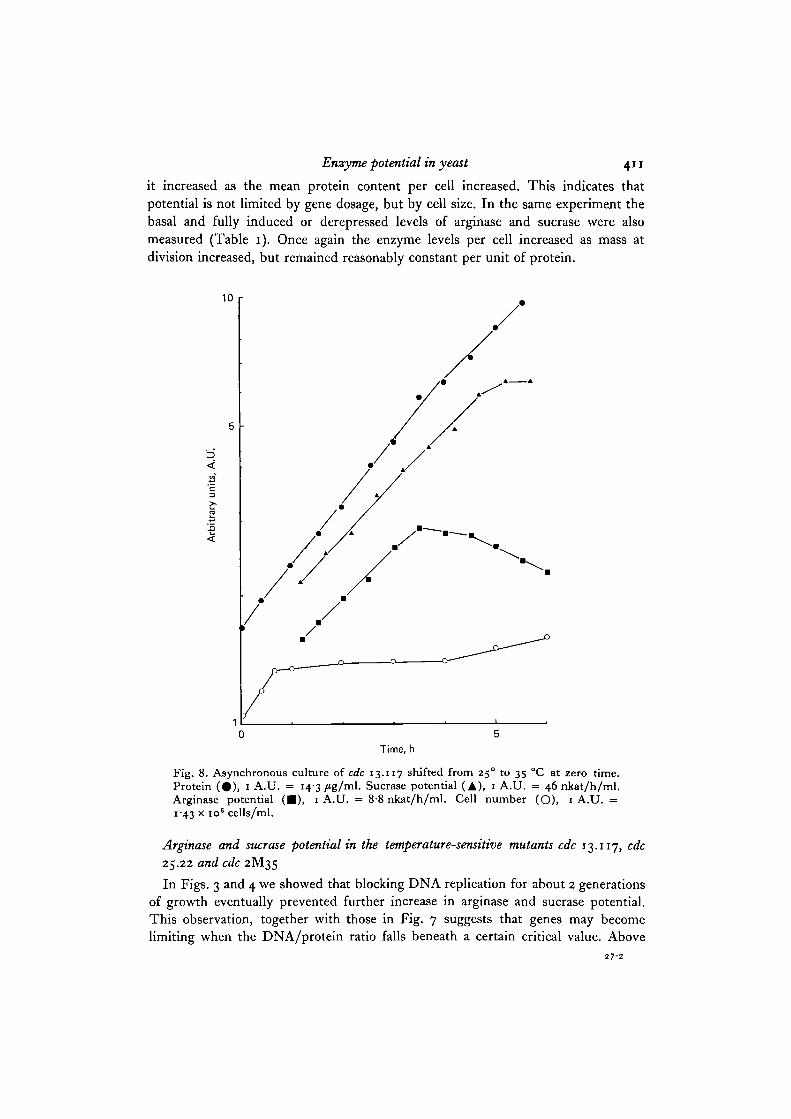
Fig. 8. Asynchronous culture of cdc 13.117 shifted from 250 to 35 °C at zero time.Protein (#) , 1 A.U. = 14-3/tg/ml. Sucrase potential (A), 1 A.U. = 46 nkat/h/ml.Arginase potential ( • ) , 1 A.U. = 8-8 nkat/h/ml. Cell number (O), 1 A.U. =1 43 x io" cells/ml.
Arginase and sucrase potentialin the temperature-sensitive mutants cdc 13.117, cdc25.22 and cdc 2M35
In Figs. 3 and 4 we showed that blocking DNA replication for about 2 generationsof growth eventually prevented further increase in arginase and sucrase potential.This observation, together with those in Fig. 7 suggests that genes may becomelimiting when the DNA/protein ratio falls beneath a certain critical value. Above
27-2
412 T. Benitez, P. Nurse and J. M. Mitchison
that value, as in normal growth, the size or protein content of the cell is limiting,whilst beneath it, as in a cdc mutant blocked in DNA replication for some time,genes can become limiting. The critical DNA/protein ratio can be investigated usinga series of size mutants. If DNA replication is blocked in such mutants, those with thelowest DNA/protein ratio will stop increasing their potential first. This is becausethey will be reduced more rapidly to the critical DNA/protein ratio where genes
10 r
•a'c
.Q
<
Time, h
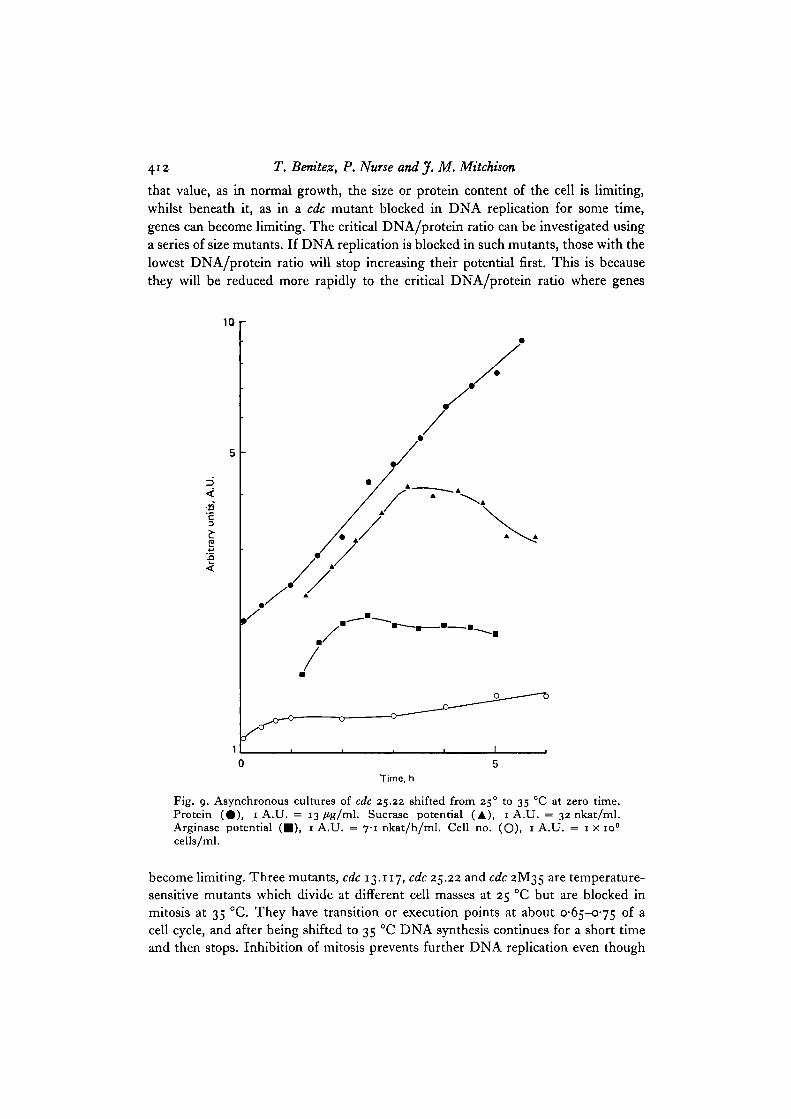
Fig. 9. Asynchronous cultures of cdc 25.22 shifted from 25° to 35 °C at zero time.Protein ( • ) , 1 A.U. = 13 fig/ml. Sucrase potential (A), 1 A.U. = 32 nkat/ml.Arginase potential ( • ) , 1 A.U. = 7-1 nkat/h/ml. Cell no. (O), 1 A.U. = 1 x io8
cells/ml.
become limiting. Three mutants, cdc 13.117, cdc 25.22 and cdc 2M35 are temperature-sensitive mutants which divide at different cell masses at 25 °C but are blocked inmitosis at 35 °C. They have transition or execution points at about 0-65-0-75 of acell cycle, and after being shifted to 35 °C DNA synthesis continues for a short timeand then stops. Inhibition of mitosis prevents further DNA replication even though
Enzyme potential in yeast 413
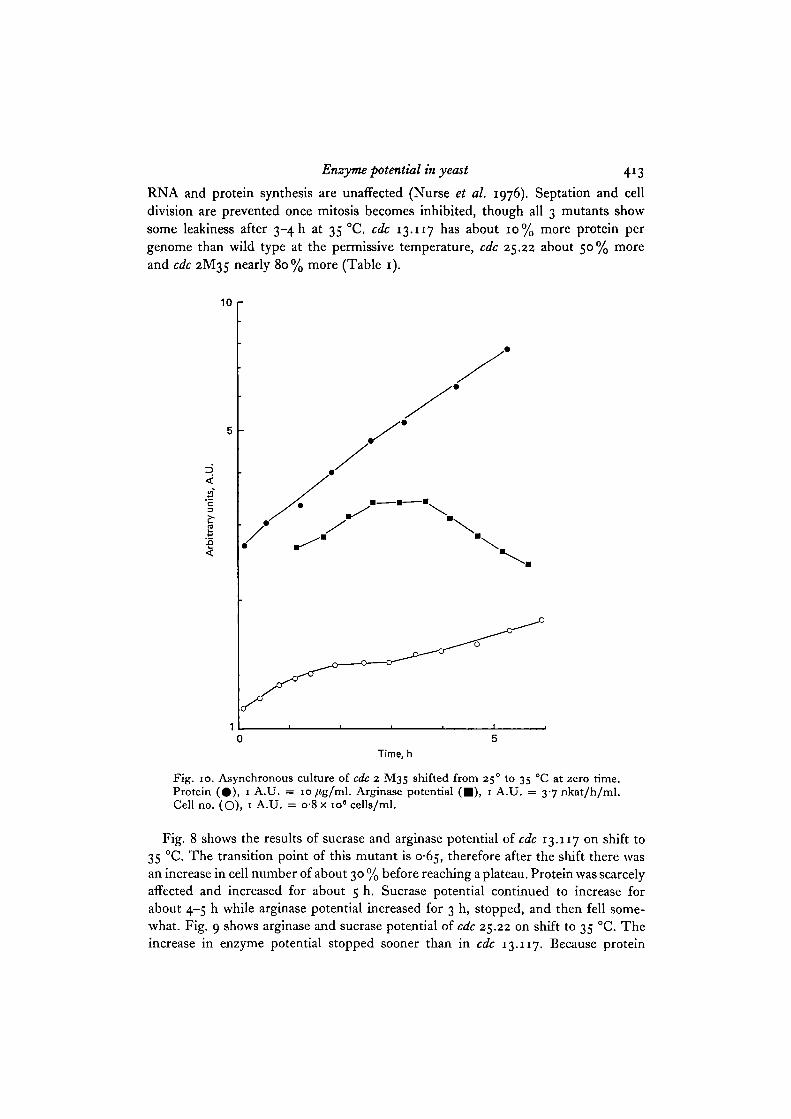
RNA and protein synthesis are unaffected (Nurse et al. 1976). Septation and celldivision are prevented once mitosis becomes inhibited, though all 3 mutants showsome leakiness after 3-4 h at 35 °C. cdc 13.117 has about 10% more protein pergenome than wild type at the permissive temperature, cdc 25.22 about 50% moreand cdc 2M35 nearly 80% more (Table 1).
10 r
I
Time, h
Fig. 10. Asynchronous culture of cdc 2 M35 shifted from 250 to 35 °C at zero time.Protein (#) , 1 A.U. = 10/tg/ml. Arginase potential ( • ) , 1 A.U. = 3-7 nkat/h/ml.Cell no. (O), 1 A.U. = o-8 x io« cells/ml.
Fig. 8 shows the results of sucrase and arginase potential of cdc 13.117 on shift to35 °C. The transition point of this mutant is 0-65, therefore after the shift there wasan increase in cell number of about 30 % before reaching a plateau. Protein was scarcelyaffected and increased for about 5 h. Sucrase potential continued to increase forabout 4-5 h while arginase potential increased for 3 h, stopped, and then fell some-what. Fig. 9 shows arginase and sucrase potential of cdc 25.22 on shift to 35 °C. Theincrease in enzyme potential stopped sooner than in cdc 13.117. Because protein
Tab
le 2
. P
oten
tial
and
prot
ein
cont
ent o
f cd
c m
utan
ts a
fter
shi
ft t
o 35
"C
wee
1.6-
wee
1.6-
C&
2M35
C& 25.22
Cdc 2.33
Cdc 13.117
C& 10.129
C&
2.33
CdC 10.129
Y
Pro
tein
/cel
l o
n s
hif
t to
35 OC,
pg
28.5
~q
.8
17.1
16.3
15.2
I 0.4
8.6
? P
rote
in/g
eno
mem
at
star
t of
pla
teau
2
in p
oten
tial
of:
3
Arg
inas
e 41'5
40.0
37'7
39'3
39'3
36.0
42'0
-
'tl
Su
cras
e 52.1
51.6
52'7
55.1
-
-
3
Po
ten
tial
/gen
om
em a
t st
art
of p
late
au
in p
ote
nti
al o
f:
Arg
inas
e S
ucr
ase
. -
Po
ten
tial
/pro
tein
, fk
at/h
/pg
, at
sta
rt
of p
late
au i
n po
tent
ial
of:
% A
rgin
ase
0'47
0.5 I
0.54
0.59
0.57
0'32
-
-
0.34
s S
ucr
ase
2.6
2.6
2.1
2.6
-
fi
%
+
Th
e u
nit
s of
pro
tein
/gen
ome
and
pot
enti
al/g
enom
e ar
e pg
/cel
l an
d f
kat
/h/c
ell
resp
ecti
vely
, b
ut
each
has
bee
n c
orr
ecte
d f
or
the
aver
age ''
gen
om
e (D
NA
) p
er c
ell
in a
sync
hron
ous
cult
ure
. T
he
co
rrec
tio
n f
acto
r is
2 f
or cdc 10 (w
hic
h i
s bl
ocke
d in
GJ,
1.17 fo
r w
ee (
wh
ich
has
a l
on
ger
8
GI
than
WT
) an
d I
fo
r th
e o
ther
mu
tan
ts.
Enzyme potential in yeast 415
continued to increase in cdc 25.22 for about the same length of time as in cdc 13.177,it cannot be argued that the plateau in potential increase is due to protein synthesisbeing affected. Similar results were observed with the mutant cdc 2M35 in whichthe increase in arginase potential after temperature shift was only 1-25-fold whileprotein increased for at least 4 h at an exponential rate (Fig. 10). Potential usuallyfell after attaining the plateau as cells continued to increase in mass. This is veryobvious for cdc 2M35 but is also seen in the other mutants. The significance of thefall is considered in the Discussion.
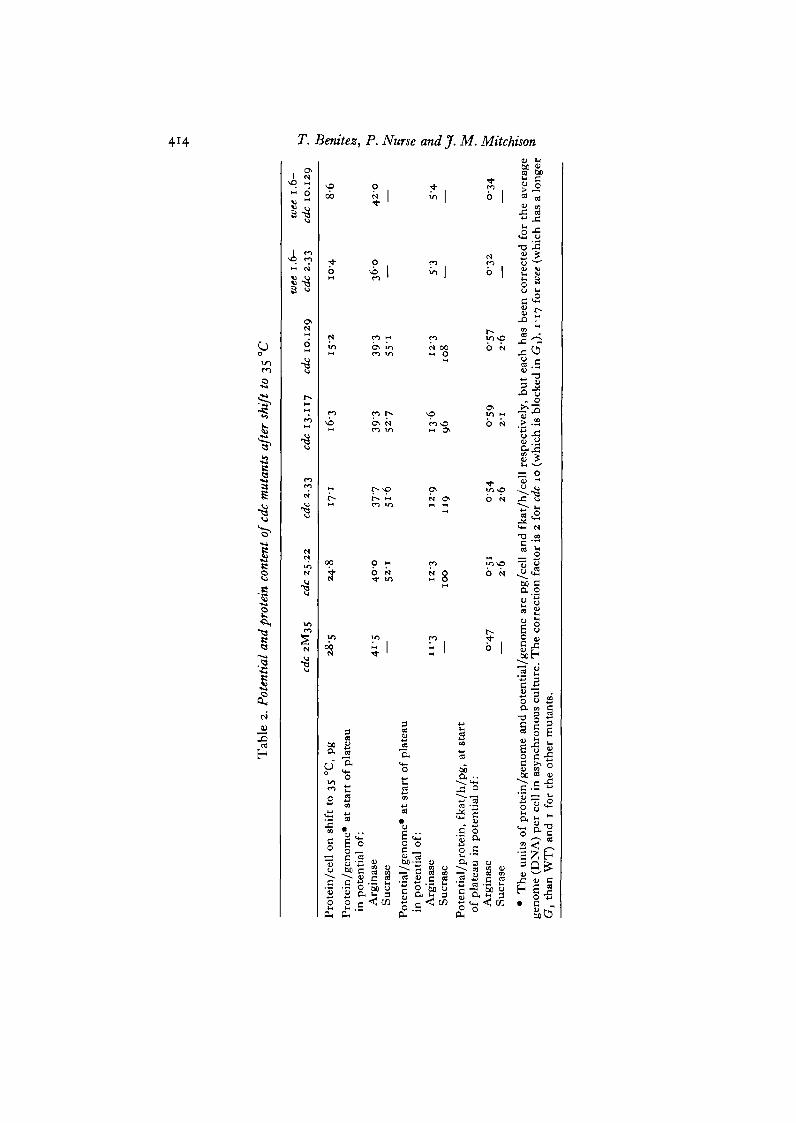
These results show that cells which are large at the beginning of the block in DNAreplication stop their increase in potential earlier than cells which are small. Inaddition arginase potential is more sensitive than sucrase potential since it stoppedrising first (Figs. 8, 9). To amplify the observations, the protein content per genomewas measured at the time the cells stopped their increase in potential. Data from these3 mutants and from cdc 2.33 and cdc 10.129 are shown in Table 2. Regardless of thecell mass and potential at the beginning of the experiment, at the time the potentialincrease stopped the protein content per genome was similar. The value for arginasewas much lower than that for sucrase.
Arginase potential in the mutants wee i.6~cdc 2.33, wee 1.6-cdc 10.129 and wee 1.6
It could be argued that the failure of potential to continue increasing could be dueto unhealthy side effects of the cdc mutations and that the initially larger mutantsstopped quicker because of these side effects.
To rule out this possibility, the double mutants wee 1.6—cdc 2.33 and wee 1.6-cdc 10.129 were constructed. These mutants were much smaller at 25 °C than cdc 2.33or cdc 10.129 a l°n e- If) therefore, it is the DNA protein ratio which becomes limiting,these mutants should be able to increase potential for longer after a block in DNAreplication.
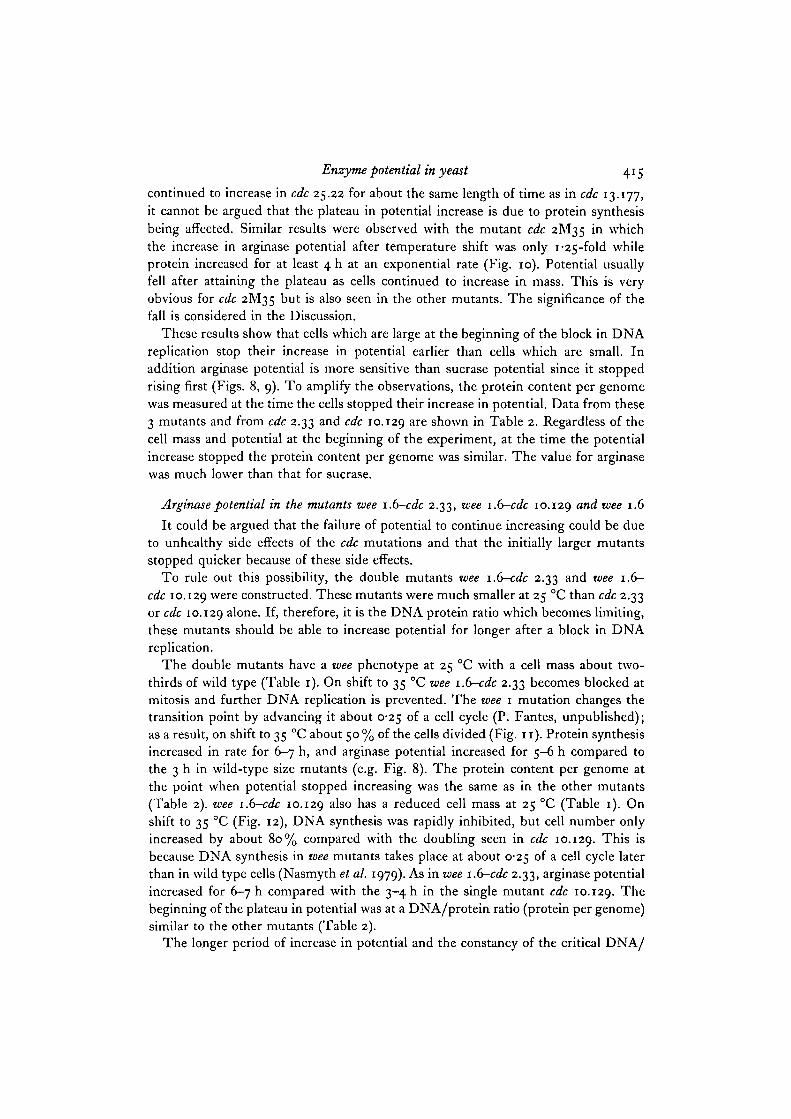
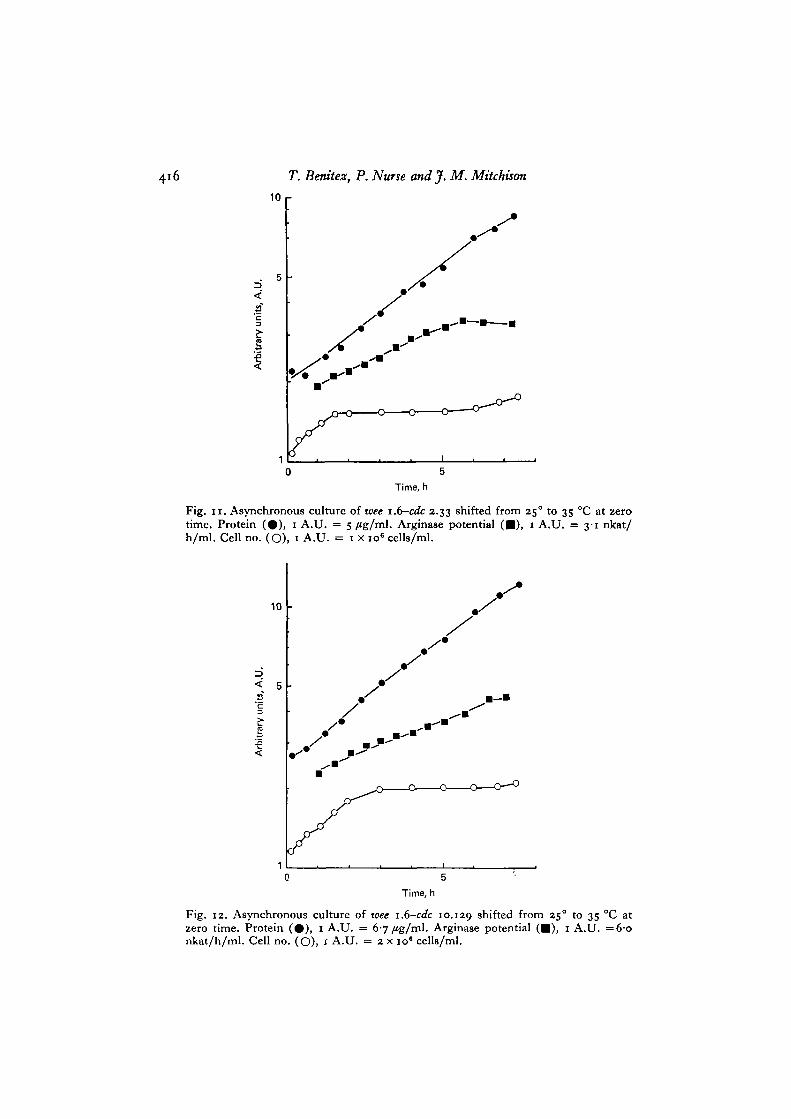
The double mutants have a wee phenotype at 25 °C with a cell mass about two-thirds of wild type (Table 1). On shift to 35 °C wee 1.6-cdc 2.33 becomes blocked atmitosis and further DNA replication is prevented. The wee 1 mutation changes thetransition point by advancing it about 0-25 of a cell cycle (P. Fantes, unpublished);as a result, on shift to 35 °C about 50 % of the cells divided (Fig. n ) . Protein synthesisincreased in rate for 6-7 h, and arginase potential increased for 5-6 h compared tothe 3 h in wild-type size mutants (e.g. Fig. 8). The protein content per genome atthe point when potential stopped increasing was the same as in the other mutants(Table 2). wee 1.6-cdc 10.129 a^s0 ^ a s a reduced cell mass at 25 °C (Table 1). Onshift to 35 °C (Fig. 12), DNA synthesis was rapidly inhibited, but cell number onlyincreased by about 80% compared with the doubling seen in cdc 10.129. This isbecause DNA synthesis in wee mutants takes place at about 0-25 of a cell cycle laterthan in wild type cells (Nasmyth et al. 1979). As in wee i.(y-cdc 2.33, arginase potentialincreased for 6-7 h compared with the 3-4 h in the single mutant cdc 10.129. Thebeginning of the plateau in potential was at a DNA/protein ratio (protein per genome)similar to the other mutants (Table 2).
The longer period of increase in potential and the constancy of the critical DNA/
416 T. Benitez, P. Nurse and J. M. Mttchtson
10
4'c
2-
s
Time, h
Fig. I I . Asynchronous culture of wee i.6—cdc 2.33 shifted from 25° to 35 °C at zerotime. Protein (#) , 1 A.U. = 5 fig/ml. Arginase potential ( • ) , 1 A.U. = 3-1 nkat/h/ml. Cell no. (O), 1 A.U. = 1 x io6 cells/ml.
10
Time, h
Fig. 12. Asynchronous culture of wee 1.6-cdc 10.129 shifted from 250 to 35 °C atzero time. Protein ( • ) , 1 A.U. = 6-7 /Jg/ml. Arginase potential ( • ) , 1 A.U. =6-onkat/h/ml. Cell no. (O), 1 A.U. = 2 x 10" cells/ml.
Enzyme potential in yeast 417
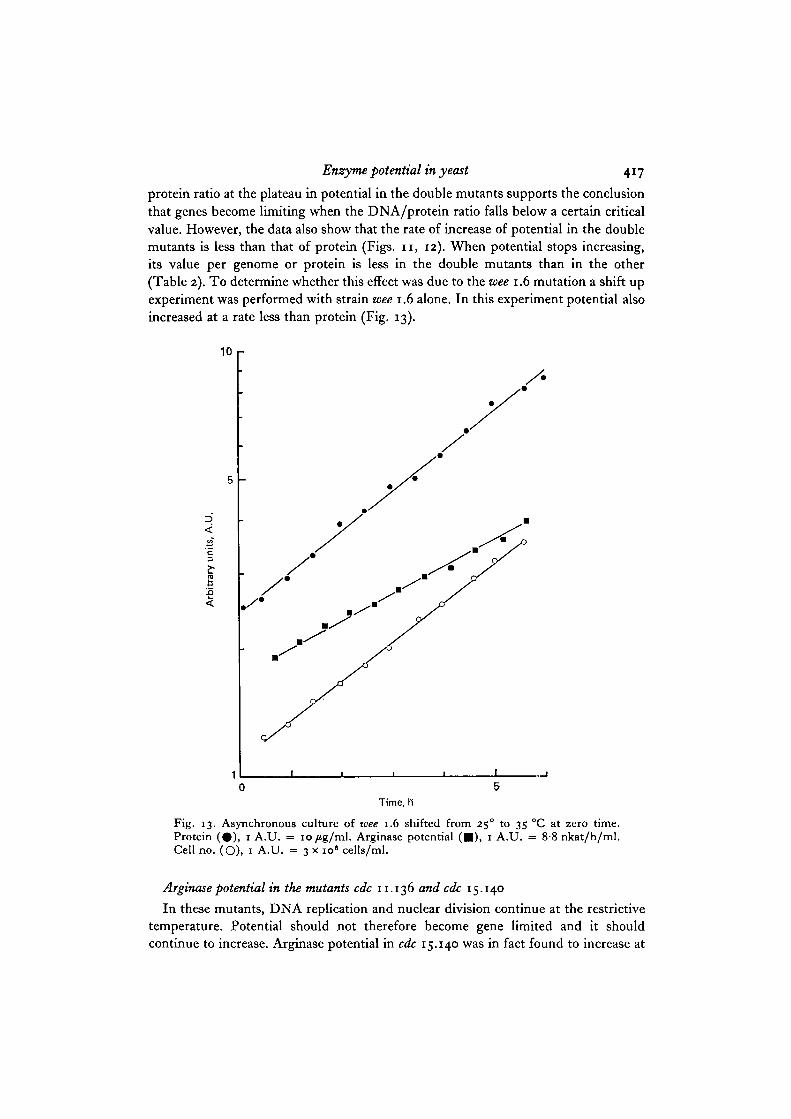
protein ratio at the plateau in potential in the double mutants supports the conclusionthat genes become limiting when the DNA/protein ratio falls below a certain criticalvalue. However, the data also show that the rate of increase of potential in the doublemutants is less than that of protein (Figs. 11, 12). When potential stops increasing,its value per genome or protein is less in the double mutants than in the other(Table 2). To determine whether this effect was due to the wee 1.6 mutation a shift upexperiment was performed with strain wee 1.6 alone. In this experiment potential alsoincreased at a rate less than protein (Fig. 13).
10 r
4
'a
I
Time, H
Fig. 13. Asynchronous culture of wee 1.6 shifted from 25° to 35 °C at zero time.Protein (#) , 1 A.U. = io/Jg/ml. Arginase potential ( • ) , 1 A.U. = 8-8 nkat/h/ml.Cell no. (O), 1 A.U. = 3 x io8 cells/ml.
Arginase potential in the mutants cdc 11.136 and cdc 15.140
In these mutants, DNA replication and nuclear division continue at the restrictivetemperature. Potential should not therefore become gene limited and it shouldcontinue to increase. Arginase potential in cdc 15.140 was in fact found to increase at
418 T. Bemtez, P. Nurse and J. M. Mitchison
35 CC for a longer period than in cdc 2.33, but neither of these early cell plate mutantswere satisfactory tools. The growth rate of cdc 15.140 was much reduced and the cellsfailed to elongate and become swollen. The block to division in cdc 11.136 was onlypartial and cell numbers continued to increase. Experiments on both mutants weretherefore discontinued.
20
10
8
I 2
-n 2
XEa.u
4 6Time, h
10
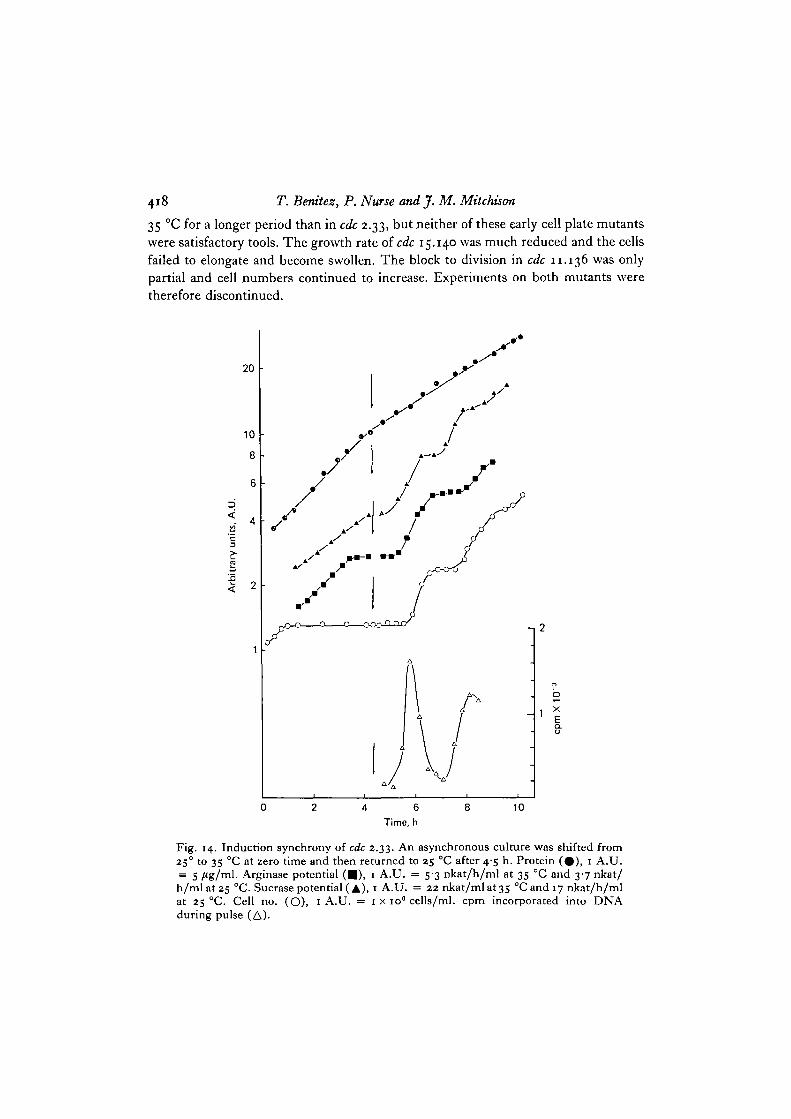
Fig. 14. Induction synchrony of cdc 2.33. An asynchronous culture was shifted from250 to 35 °C at zero time and then returned to 25 °C after 4-5 h. Protein (#) , 1 A.U.= s /tg/tnl. Arginase potential ( • ) , 1 A.U. = 5-3 nkat/h/ml at 35 °C and 3-7 nkat/h/ml at 25 °C. Sucrase potential (A), 1 A.U. = 22 nkat/mlat3S 0Candi7 nkat/h/mlat 25 °C. Cell no. (O), 1 A.U. = 1 x io" cells/ml, cpm incorporated into DNAduring pulse (A).
Enzyme potential in yeast 419
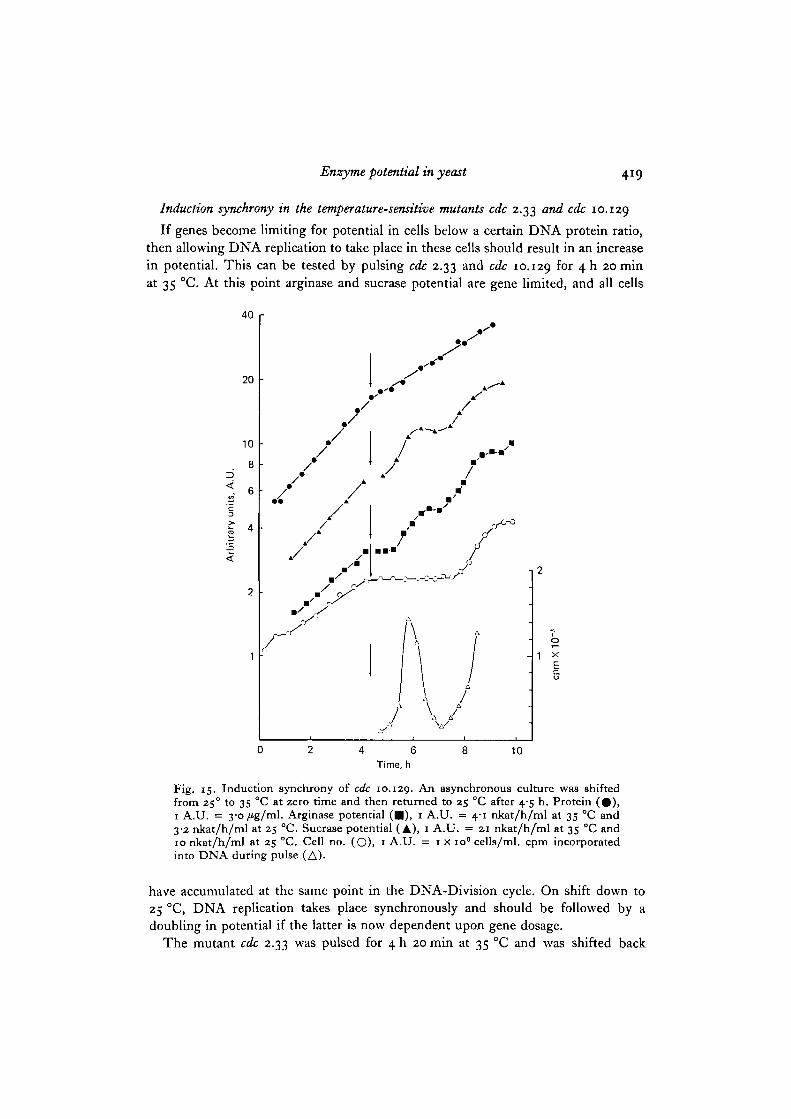
Induction synchrony in the temperature-sensitive mutants cdc 2.33 and cdc 10.129
If genes become limiting for potential in cells below a certain DNA protein ratio,then allowing DNA replication to take place in these cells should result in an increasein potential. This can be tested by pulsing cdc 2.33 and cdc 10.129 for 4 h 20 minat 35 °C. At this point arginase and sucrase potential are gene limited, and all cells
40 r
20
10
8
a.
4 6Time, h
10
Fig. 15. Induction synchrony of cdc 10.129. An asynchronous culture was shiftedfrom 25° to 35 °C at zero time and then returned to 25 °C after 4-5 h. Protein ( • ) ,1 A.U. = 3'O/tg/ml. Arginase potential ( • ) , 1 A.U. = 4-1 nkat/h/ml at 35 °C and3-2 nkat/h/ml at 25 °C. Sucrase potential (A), 1 A.U. = 21 nkat/h/ml at 35 °C and10 nkat/h/ml at 25 °C. Cell no. (O). 1 A.U. = 1 x io6 cells/ml, cpm incorporatedinto DNA during pulse (A).
have accumulated at the same point in the DNA-Division cycle. On shift down to25 °C, DNA replication takes place synchronously and should be followed by adoubling in potential if the latter is now dependent upon gene dosage.
The mutant cdc 2.33 was pulsed for 4 h 20 min at 35 °C and was shifted back
420 T. Benitez, P. Nurse and J. M. Mitchison
down to 25 °C. After a short lag DNA synthesis took place and the cells dividedsynchronously and about 2 h later they divided again although less synchronously(Fig. 14). Arginase and sucrase potential also increased in a step pattern coincidentwith the time of DNA replication. The cdc 10.129 mutant, on shift to 25 °C after4 h 20 min at 35 °C showed the same sort of behaviour as cdc 2.33 (Fig. 15). After ashort lag DNA synthesis took place and the cells divided synchronously about 2-3 hlater followed by a second less synchronous round of division 2-3 h later. Thelonger lag observed with cdc 10.129 is because it is blocked in DNA replicationand after release cells have to proceed through all of G2 and mitosis before celldivision, cdc 2.33, which is blocked just before mitosis, only has to complete this eventbefore it can divide. The arginase and sucrase potential doubled as steps soon afterthe shift down close to the time of DNA replication. Since no such steps are seenwhen a wild type culture is shifted from 350 to 25 °C (data not shown), the steps inpotential observed in the shifted-down mutants can be assumed to be associateddirectly with the synchronous rounds of DNA replication. This supports the conceptthat in the blocked mutants gene limitation prevents further increases in potential.
Cell cycle timing of steps in potential
In this section, potential is followed in synchronous cultures. Periodic steps inpotential are shown not only in wild type cells but also in cdc mutants where DNAsynthesis and division is blocked.
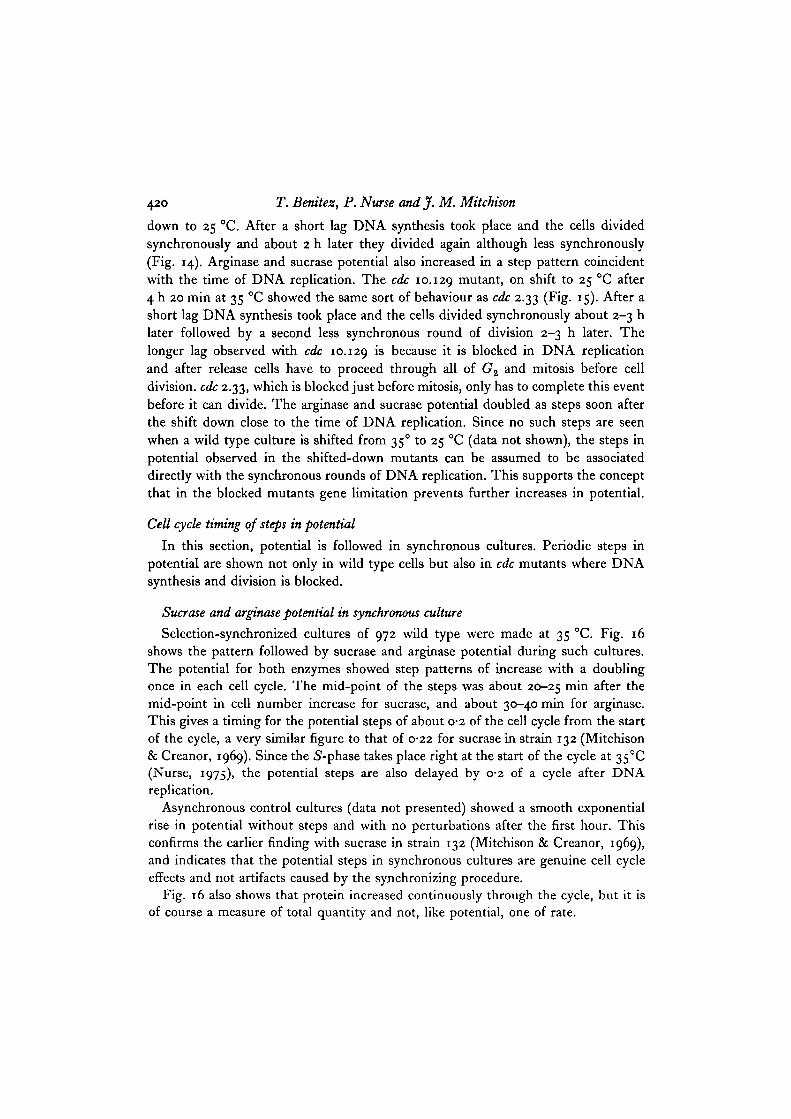
Sucrase and arginase potential in synchronous culture
Selection-synchronized cultures of 972 wild type were made at 35 °C. Fig. 16shows the pattern followed by sucrase and arginase potential during such cultures.The potential for both enzymes showed step patterns of increase with a doublingonce in each cell cycle. The mid-point of the steps was about 20-25 m m after themid-point in cell number increase for sucrase, and about 30-40 min for arginase.This gives a timing for the potential steps of about 0-2 of the cell cycle from the startof the cycle, a very similar figure to that of 0-22 for sucrase in strain 132 (Mitchison& Creanor, 1969). Since the 5-phase takes place right at the start of the cycle at 35°C(Nurse, 1975), the potential steps are also delayed by 0-2 of a cycle after DNAreplication.
Asynchronous control cultures (data not presented) showed a smooth exponentialrise in potential without steps and with no perturbations after the first hour. Thisconfirms the earlier finding with sucrase in strain 132 (Mitchison & Creanor, 1969),and indicates that the potential steps in synchronous cultures are genuine cell cycleeffects and not artifacts caused by the synchronizing procedure.
Fig. 16 also shows that protein increased continuously through the cycle, but it isof course a measure of total quantity and not, like potential, one of rate.
Enzyme potential in yeast 421
10
8
"j 4
.D
<
Time, h
Fig. 16. Synchronous culture of 972h~ wild type at 35 °C. Protein ( • ) , 1 A.U. = 20/tgprotein/ml. Cell no. (O), 1 A.U. = 1-65 x io'cells/ml. Sucrase potential (A),1 A.U. = 131 nkat/h/ml. Arginase potential ( • ) , 1 A.U. = 25 nkat/h/ml.
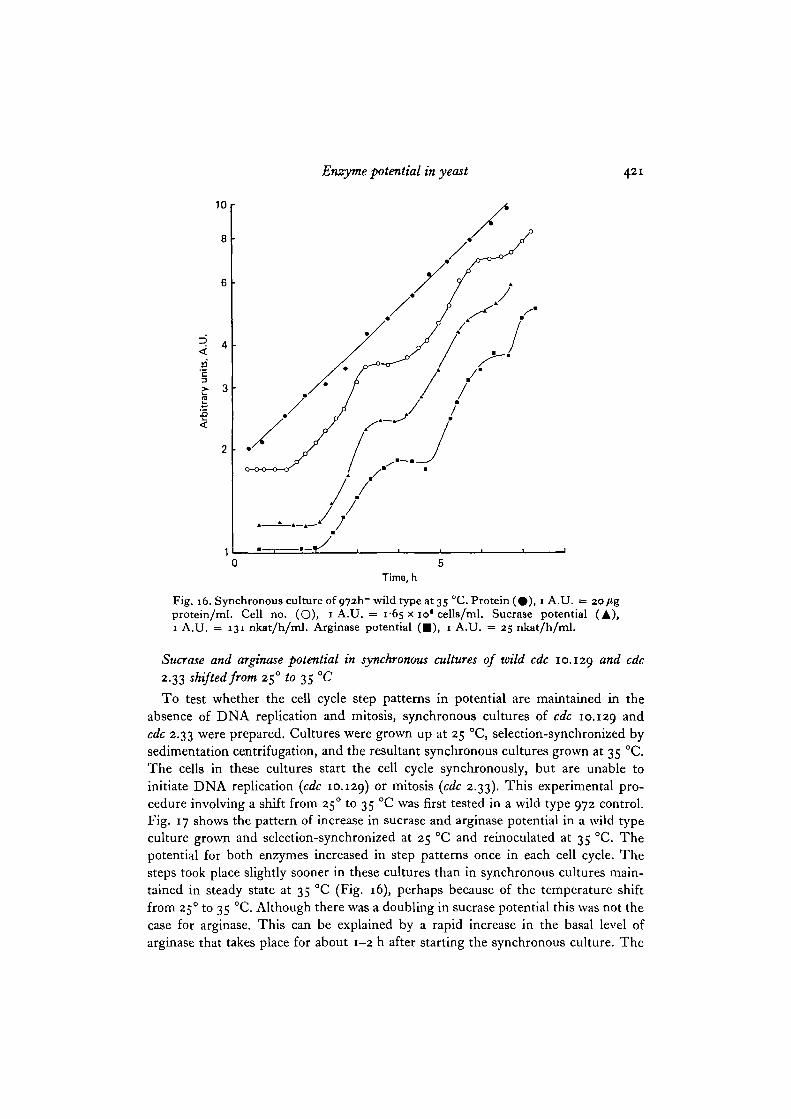
Sucrase and arginase potential in synchronous cultures of wild cdc 10.129 and cdc2.33 shifted from 250 to 35 °C
To test whether the cell cycle step patterns in potential are maintained in theabsence of DNA replication and mitosis, synchronous cultures of cdc 10.129 andcdc 2.33 were prepared. Cultures were grown up at 25 °C, selection-synchronized bysedimentation centrifugation, and the resultant synchronous cultures grown at 35 °C.The cells in these cultures start the cell cycle synchronously, but are unable toinitiate DNA replication (cdc 10.129) o r mitosis (cdc 2.33). This experimental pro-cedure involving a shift from 250 to 35 °C was first tested in a wild type 972 control.Fig. 17 shows the pattern of increase in sucrase and arginase potential in a wild typeculture grown and selection-synchronized at 25 °C and reinoculated at 35 °C. Thepotential for both enzymes increased in step patterns once in each cell cycle. Thesteps took place slightly sooner in these cultures than in synchronous cultures main-tained in steady state at 35 °C (Fig. 16), perhaps because of the temperature shiftfrom 25° to 35 °C. Although there was a doubling in sucrase potential this was not thecase for arginase. This can be explained by a rapid increase in the basal level ofarginase that takes place for about 1-2 h after starting the synchronous culture. The
422 T. Bemtez, P. Nurse and J. M. Mitchison
increase in basal level of arginase results in the experimental measurements ofpotential being overestimated at the beginning of the synchronous culture, and as aconsequence the first step is less than a doubling.
10
3<
Time, h
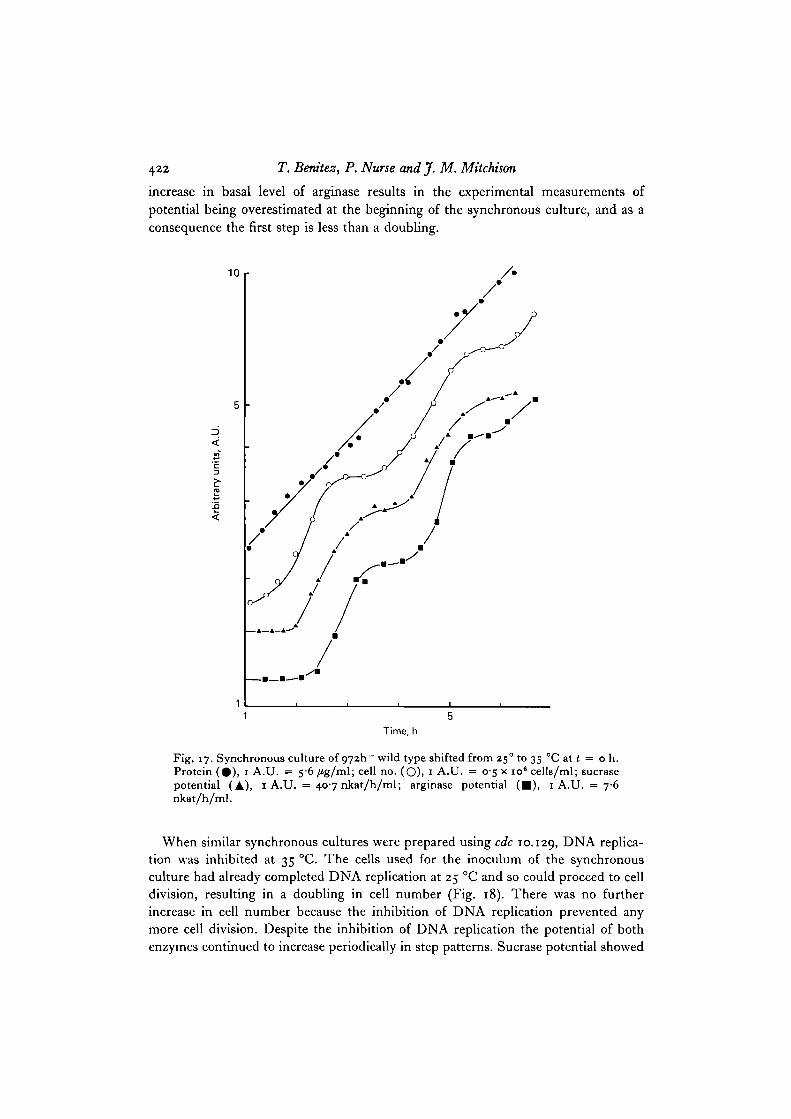
Fig. 17. Synchronous culture of O72h~ wild type shifted from 250 to 35 CC at t = o h.Protein (#) , 1 A.U. = 56/ig/ml; cell no. (O), 1 A.U. = 05 x io6 cells/ml; sucrasepotential (A), 1 A.U. = 407 nkat/h/ml; arginase potential ( • ) , 1 A.U. = 7-6nkat/h/ml.
When similar synchronous cultures were prepared using cdc 10.129, DNA replica-tion was inhibited at 35 °C. The cells used for the inoculum of the synchronousculture had already completed DNA replication at 25 °C and so could proceed to celldivision, resulting in a doubling in cell number (Fig. 18). There was no furtherincrease in cell number because the inhibition of DNA replication prevented anymore cell division. Despite the inhibition of DNA replication the potential of bothenzymes continued to increase periodically in step patterns. Sucrase potential showed
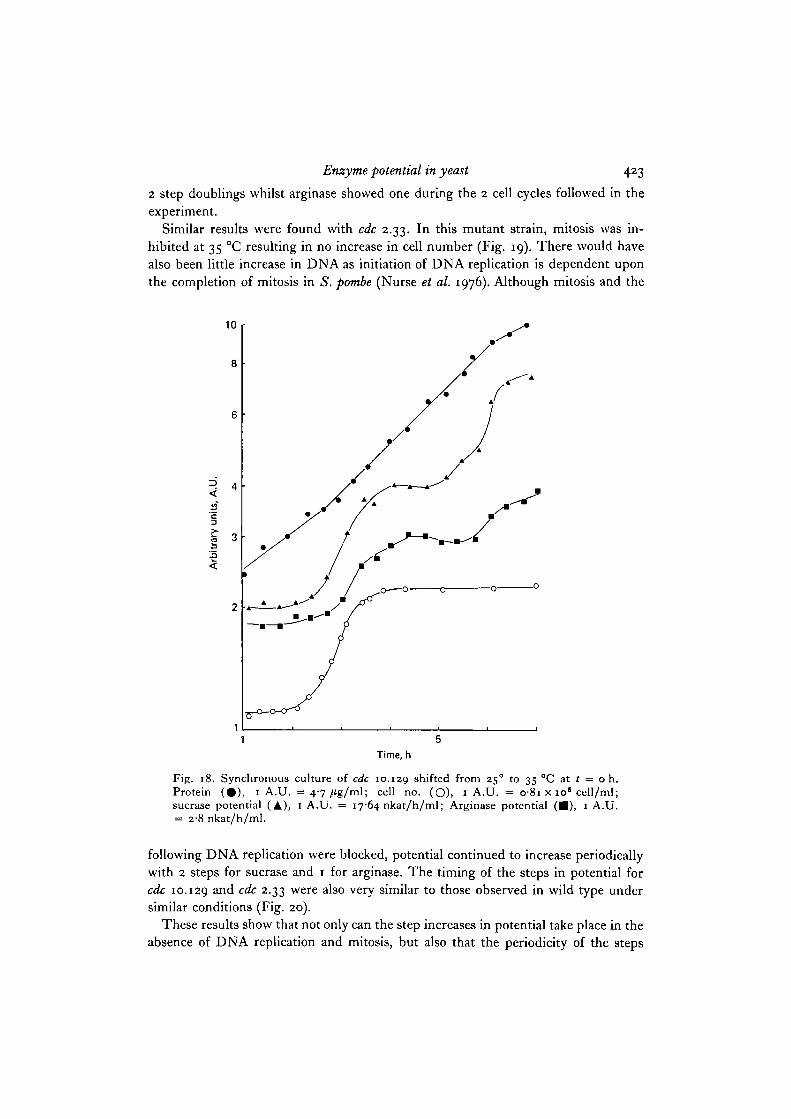
Enzyme potential in yeast 423
2 step doublings whilst arginase showed one during the 2 cell cycles followed in theexperiment.
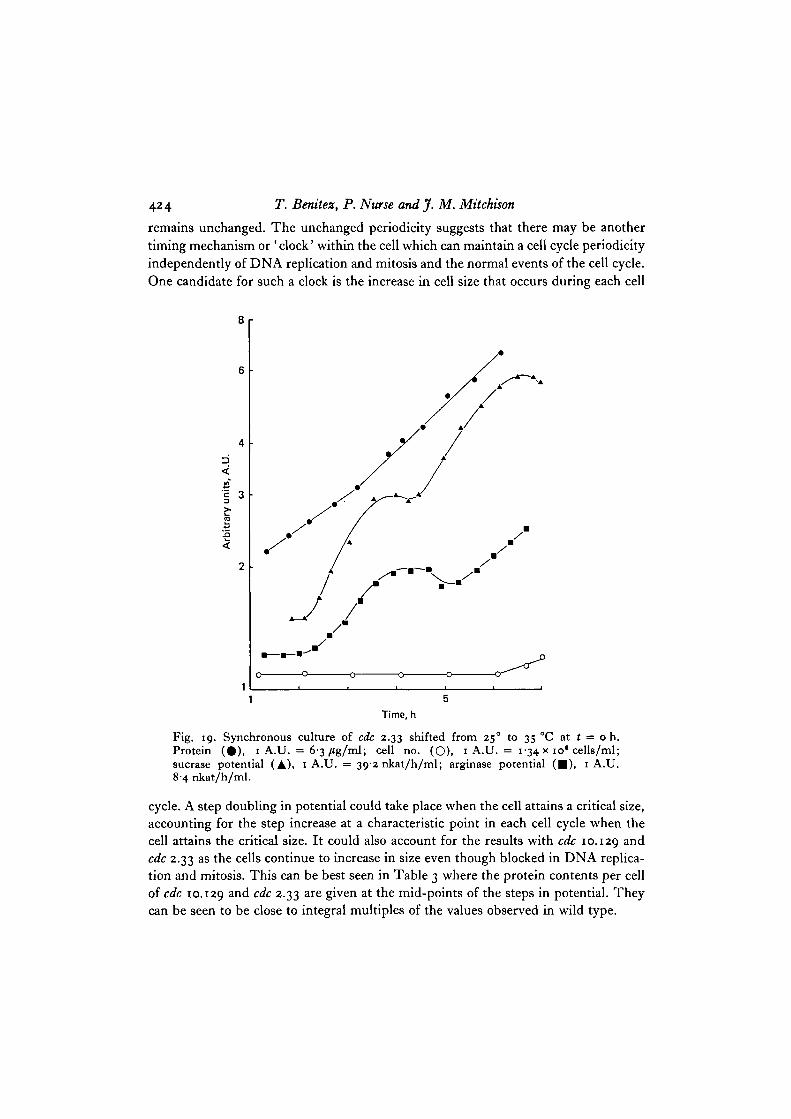
Similar results were found with cdc 2.33. In this mutant strain, mitosis was in-hibited at 35 °C resulting in no increase in cell number (Fig. 19). There would havealso been little increase in DNA as initiation of DNA replication is dependent uponthe completion of mitosis in S. pombe (Nurse et al. 1976). Although mitosis and the
10
'c3
1'.a
Time, h
Fig. 18. Synchronous culture of cdc 10.129 shifted from 250 to 35 °C at 1 = o h.Protein (#) , 1 A.U. = 4-7/tg/ml; cell no. (O), 1 A.U. = 081 x io« cell/ml;sucrase potential (A), 1 A.U. = 1764 nkat/h/ml; Arginase potential ( • ) , 1 A.U.= 2-8 nkat/h/ml.
following DNA replication were blocked, potential continued to increase periodicallywith 2 steps for sucrase and 1 for arginase. The timing of the steps in potential forcdc 10.129 and cdc 2.33 were also very similar to those observed in wild type undersimilar conditions (Fig. 20).
These results show that not only can the step increases in potential take place in theabsence of DNA replication and mitosis, but also that the periodicity of the steps
424 T. Benitez, P. Nurse and J. M. Mitchison
remains unchanged. The unchanged periodicity suggests that there may be anothertiming mechanism or 'clock' within the cell which can maintain a cell cycle periodicityindependently of DNA replication and mitosis and the normal events of the cell cycle.One candidate for such a clock is the increase in cell size that occurs during each cell
I
Time, h
Fig. 19. Synchronous culture of cdc 2.33 shifted from 25° to 35 CC at t = o h.Protein (#) , 1 A.U. = 6-3/tg/ml; cell no. (O), 1 A.U. = 1-34 x io* cells/ml;sucrase potential (A), 1 A.U. = 39-2 nkat/h/ml; arginase potential ( • ) , 1 A.U.8-4 nkat/h/ml.
cycle. A step doubling in potential could take place when the cell attains a critical size,accounting for the step increase at a characteristic point in each cell cycle when thecell attains the critical size. It could also account for the results with cdc 10.129 andcdc 2.33 as the cells continue to increase in size even though blocked in DNA replica-tion and mitosis. This can be best seen in Table 3 where the protein contents per cellof cdc 10.129 and cdc 2.33 are given at the mid-points of the steps in potential. Theycan be seen to be close to integral multiples of the values observed in wild type.
Enzyme potential in yeast 425
Wild type
T TArginase W V V V Time, h
r 1 'A A1 ' ' ' '0 A. 8
cdc 2.33
Wild typeT y
Arginase Vy_ V V V Time, h
0 ± 8
cdc 10.129
Wild type
T TSucrase . , \XAA/ ^V . ^V Time, h
1 1 /y\ 1 A A ' '0 A • 8
cc/c 2.33
Wild type
T TSucrase X )SW. ^ V , YV Time, h
1 1 1 A '/V\ ' ' AA ' ' '0 • • 8
cdc 10.129
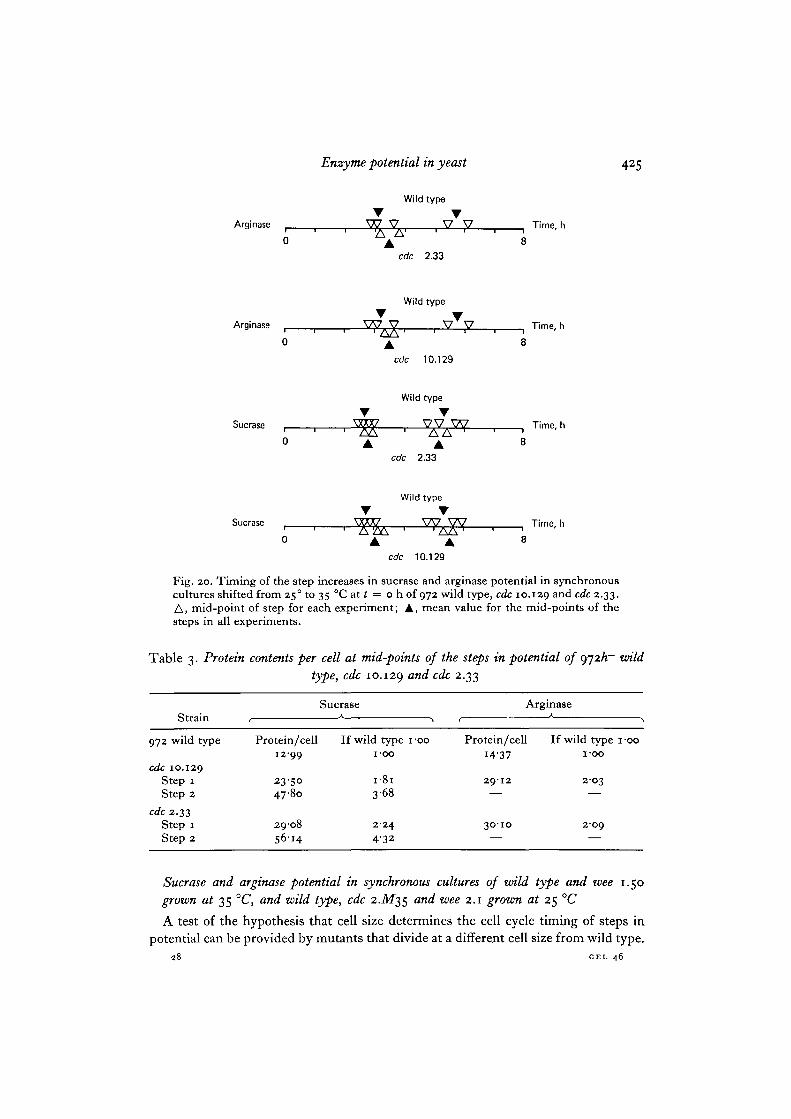
Fig. 20. Timing of the step increases in sucrase and arginase potential in synchronouscultures shifted from 25° to 35 °C at t = o h of 972 wild type, cdc 10.129 and C&2.33.A, mid-point of step for each experiment; A, mean value for the mid-points of thesteps in all experiments.
Table 3. Protein contents per cell at mid-points of the steps in potential of 972/1" wild
type, cdc 10.129 an<^ c^c 2-33
Sucrase Arginase
972 wild type
cdc 10.129Step 1Step 2
cdc 2.33Step 1Step 2
Protein/cell1299
23-5047-80
29-0856-14
If wild type i-ooi-oo
I - 8 I
368
2-244-32
Protein/cell14-37
2912—
30-10—
If wild type i-ooi-oo
2 0 3
—
2-09—
Sucrase and arginase potential in synchronous cultures of wild type and wee 1.50grown at 35 °C, and wild type, cdc 2.M35 and wee 2.1 grown at 25 °C
A test of the hypothesis that cell size determines the cell cycle timing of steps inpotential can be provided by mutants that divide at a different cell size from wild type.
28 CEL 46
426 T. Benitez, P. Nurse and J. M. Mitchison
If potential doubles as a step when a certain critical cell size is attained, then the stepwill be later in the cell cycle of a mutant dividing at a smaller size than wild type,and earlier in one dividing at a larger size. We have carried out this experiment usingstrains wee 1.50 and wee 2.1 which divide at smaller sizes than wild type and cdc2.M35 which divides at a larger size.
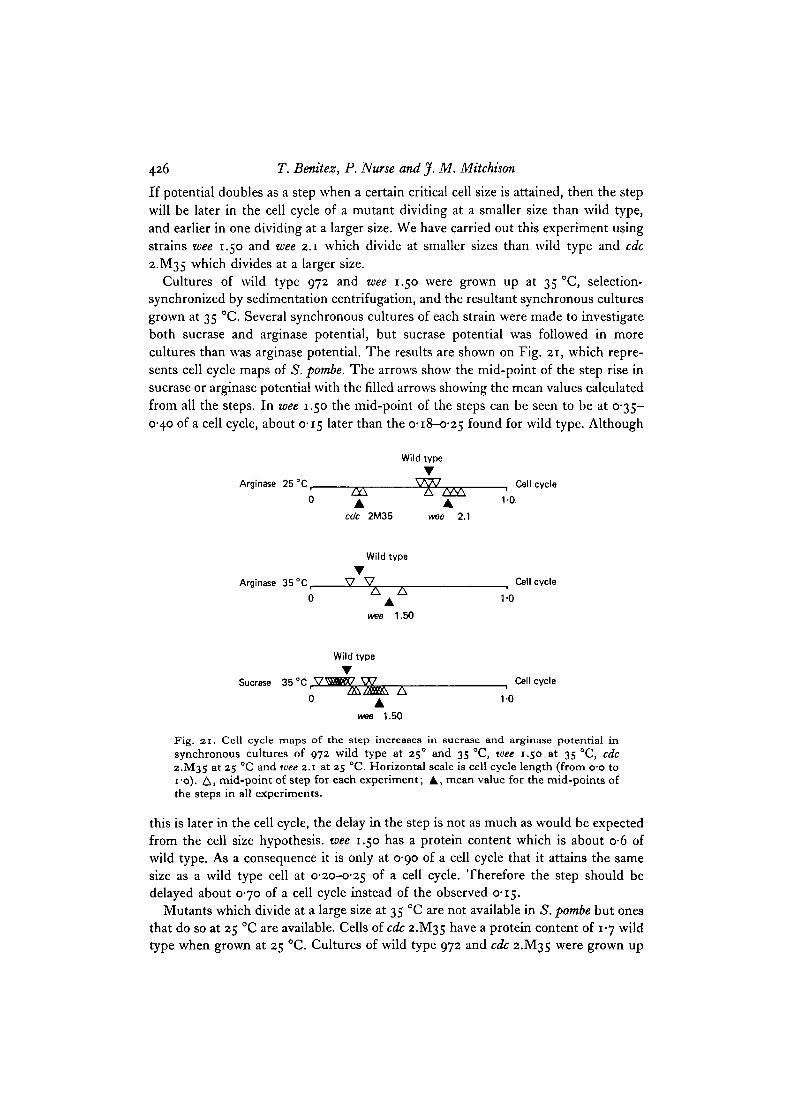
Cultures of wild type 972 and wee 1.50 were grown up at 35 °C, selection-synchronized by sedimentation centrifugation, and the resultant synchronous culturesgrown at 35 °C. Several synchronous cultures of each strain were made to investigateboth sucrase and arginase potential, but sucrase potential was followed in morecultures than was arginase potential. The results are shown on Fig. 21, which repre-sents cell cycle maps of S. pombe. The arrows show the mid-point of the step rise insucrase or arginase potential with the filled arrows showing the mean values calculatedfrom all the steps. In wee 1.50 the mid-point of the steps can be seen to be at 0-35-0-40 of a cell cycle, about 0-15 later than the 0-18-0-25 found for wild type. Although
Wild type
TArginase 25 °C, ^ W , Cell cycle1 SX A / w \ '
0 A A i-ocdc 2M35 wee 2.1
Wild type
TArginase 35 °C, V V , Cell cycle
0 A 1-0
wee 1.50
Wild type
TSucrase ' " ; ° r . ^ ^ W r ? . W _ . , Cell cycle
Fig. 21. Cell cycle maps of the step increases in sucrase and arginase potential insynchronous cultures of 972 wild type at 25° and 35 °C, wee 1.50 at 35 °C, cdc2.M35 at 25 °C and wee 2.1 at 25 °C. Horizontal scale is cell cycle length (from o-o toro), £\, mid-point of step for each experiment; A, mean value for the mid-points ofthe steps in all experiments.
this is later in the cell cycle, the delay in the step is not as much as would be expectedfrom the cell size hypothesis, wee 1.50 has a protein content which is about o-6 ofwild type. As a consequence it is only at 0-90 of a cell cycle that it attains the samesize as a wild type cell at O-2O-O-25 of a cell cycle. Therefore the step should bedelayed about 0-70 of a cell cycle instead of the observed 0-15.
Mutants which divide at a large size at 35 °C are not available in S. pombe but onesthat do so at 25 °C are available. Cells of cdc 2.M35 have a protein content of 1-7 wildtype when grown at 25 °C. Cultures of wild type 972 and cdc 2.M35 were grown up
Enzyme potential in yeast 427
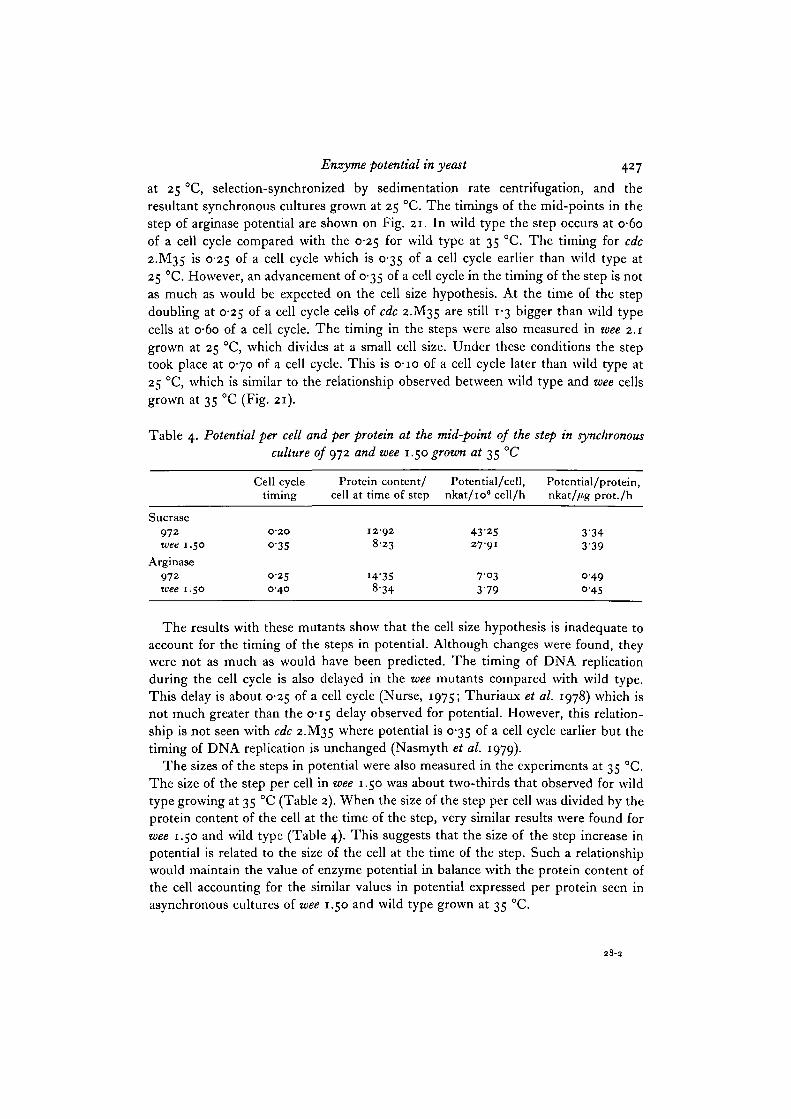
at 25 °C, selection-synchronized by sedimentation rate centrifugation, and theresultant synchronous cultures grown at 25 °C. The timings of the mid-points in thestep of arginase potential are shown on Fig. 21. In wild type the step occurs at o-6oof a cell cycle compared with the 0-25 for wild type at 35 °C. The timing for cdc2.M35 is 0-25 of a cell cycle which is 0-35 of a cell cycle earlier than wild type at25 °C. However, an advancement of 0-35 of a cell cycle in the timing of the step is notas much as would be expected on the cell size hypothesis. At the time of the stepdoubling at 0-25 of a cell cycle cells of cdc 2.M35 are still 1-3 bigger than wild typecells at o-6o of a cell cycle. The timing in the steps were also measured in wee 2.1grown at 25 °C, which divides at a small cell size. Under these conditions the steptook place at 0-70 of a cell cycle. This is o-io of a cell cycle later than wild type at25 °C, which is similar to the relationship observed between wild type and wee cellsgrown at 35 °C (Fig. 21).
Table 4. Potential per cell and per protein at the mid-point of the step in synchronousculture of 972 and wee 1.50 grown at 35 °C
Sucrase972wee 1.50
Arginase972wee 1.50
Cell cycletiming
0-20O'3S
0-250 4 0
Protein content/cell at time of step
1292
8-23
J4-358-34
Potential/cell,nkat/106 cell/h
43-2527-91
7-O33 7 9
Potential/protein,nkat//tg prot./h
3-343 3 9
0 4 9o-45
The results with these mutants show that the cell size hypothesis is inadequate toaccount for the timing of the steps in potential. Although changes were found, theywere not as much as would have been predicted. The timing of DNA replicationduring the cell cycle is also delayed in the wee mutants compared with wild type.This delay is about 0-25 of a cell cycle (Nurse, 1975; Thuriaux et al. 1978) which isnot much greater than the 0-15 delay observed for potential. However, this relation-ship is not seen with cdc 2.M35 where potential is 0-35 of a cell cycle earlier but thetiming of DNA replication is unchanged (Nasmyth et al. 1979).
The sizes of the steps in potential were also measured in the experiments at 35 °C.The size of the step per cell in wee 1.50 was about two-thirds that observed for wildtype growing at 35 °C (Table 2). When the size of the step per cell was divided by theprotein content of the cell at the time of the step, very similar results were found forwee 1.50 and wild type (Table 4). This suggests that the size of the step increase inpotential is related to the size of the cell at the time of the step. Such a relationshipwould maintain the value of enzyme potential in balance with the protein content ofthe cell accounting for the similar values in potential expressed per protein seen inasynchronous cultures of wee 1.50 and wild type grown at 35 °C.
28-2
428 T. Benitez, P. Nurse and J. M. Mitchison
DISCUSSION
Earlier results with strain 132 of S. potnbe suggested that the doubling of genedosage during DNA replication was an important event in the control of enzymepotential and enzyme synthesis. In selection-synchronized cultures, there were stepdoublings both in the potential of sucrase and maltase and in the apparent rate ofsynthesis of three basal level enzymes (Mitchison & Creanor, 1969, 1971). Althoughthese steps were at approximately the same time in the cycle (0-2), this time was laterthan the S-period (o-o) and a subsidiary hypothesis had to be invoked to explain thelack of temporal coincidence. Further experiments using deoxyadenosine, an inhibitorof DNA synthesis, appeared to corroborate the gene dosage suggestion (Sissons et al.1973). Addition of the inhibitor to a normal asynchronous culture stopped furtherincrease in sucrase and maltase potential, whilst in cells induced into synchrony by along pulse of the inhibitor, potential was synchronized and increased in steps whichwere coupled with the cell cycle. The timing of these steps was, however, earlier inthe cycle than after selection synchrony, and remained unexplained.
The present work shows that there are the same sucrase potential steps in strain972 as in strain 132. Arginase potential also behaves in a similar way. Taking the 2strains together, the potentials of 3 enzymes (sucrase, maltase and arginase) all showstep doublings at about 0-2 of the cycle. We must, however, discard the originalhypothesis of a gene dosage effect as the cause of these steps in normal cells. Depen-dency on DNA synthesis is a much more critical test than temporal coincidence.When DNA synthesis is inhibited in the mutants cdc 2.33 and cdc 10.129, enzymepotential increases for 2 generations of growth for sucrase and 1 for arginase. Whatis more, the capacity of the sucrase and arginase structural genes to be derepressedor induced must be greater than is observed in the normal growth of wild type cells.
The earlier experiments with deoxyadenosine appeared to show a dependency ofpotential increase on DNA synthesis. The present experiments, particularly thosewhen the inhibitor was added to the blocked mutant cdc 10.129, are evidence thatthere can be side effects with deoxyadenosine which invalidate its use in dependencytests. In view of these results, and of the difference in step timings after deoxy-adenosine pulses, we cannot accept the conclusion of the earlier experiments. We alsohave reservations about the only other experiment that has been done in eukaryoteson the dependency of enzyme potential on DNA synthesis. Turner et al. (1978)treated synchronous cultures of Chlorella sorokiniana with deoxyadenosine and foundno increase in the potential of glutamate dehydrogenase. This inhibitor should besuspect for the reasons given above, but there was also a marked drop (by a factorof about 3) in potential when the inhibitor was added.
Gene dosage is a simple and attractive explanation of potential changes and itseems to apply in prokaryotes, as we discussed in the Introduction. But it does notfit the facts in the normal cell cycle of S. pombe, and in many eukaryotes. It is notconsistent with the potential increases after a cdc block or with the fact that potentialis proportional to size (and not DNA content) in a series of size mutants where thereis a 3-fold change in the DNA/protein ratio.
Enzyme potential in yeast 429
The situation, however, is different in abnormally large cells produced by mutantblocks. Here it does seem that gene dosage or gene limitation is important. Potentialceases to increase at the same average size (DNA/protein ratio) in mutants which areof very different initial sizes when the block is applied. In many cases, further growthcauses the potential to fall. When the block is removed, there are step increases inpotential concomitant with gene doublings. An important point is that the criticalDNA/protein ratio at which potential increase stops is not the same for the 2 enzymes,sucrase and arginase.
There is little concrete that can be said as yet about the mechanism of genelimitation. A simple hypothesis is that it becomes operative when transcription ofmRNA has reached a maximum rate for the structural gene involved. This rate couldvary between genes because of differences in the inductive stimulus. But such ahypothesis would not explain the fall in potential after it has reached its maximumand a second control would have to be invoked.
In strains containing the wee 1.6 mutation, the rate of increase of arginase potentialafter a shift to 35 °C is less than the rate of increase of protein. The reasons for thisare not clear. Potential increase is less than number increase with sucrase in strain 132(Mitchison & Creanor, 1969). It may be that this imbalance is shown at an early stagein batch culture growth of strains harbouring wee 1, because of the known pleiotropiceffects of this mutation.
Gene limitation appears to become operative at different DNA/protein ratios forsucrase and arginase potentials. It is therefore conceivable that some enzymes existin S. pombe where gene limitation may be the mechanism controlling potential innormal cells as well as in large cells with an abnormally low DNA/protein ratio.Other cell types may also vary in the importance of gene dosage control. Evidencementioned earlier suggests that such a control may be the important one in pro-karyotes, but not in many eukaryotes.
Asynchronous cultures show potential increases after a cdc block. Synchronouscultures yield another important piece of information, that the normal step increasesin potential also persist after the block. This supports the suggestion of a 'growthcycle' with periodic events which continue with cell cycle timing even though theDNA-division cycle is blocked (Mitchison, 1971). These persistent periodic eventshave been shown with carbon dioxide evolution and oxygen uptake in S. pombe(Creanor, 1978 a, b) and with surface tension changes in non-nucleate sea-urchin eggfragments (Yoneda, Ikeda & Washitani, 1978).
Although the mechanism which controls the steps in potential is unknown, wehave established some of its properties. It seems to ensure that the size of a potentialstep is related to cell size at the time of the step. It is not gene dosage or an event ofthe DNA-division cycle. It is not related in a simple way to cell size, as was suggestedfor mRNA synthesis by Fraser & Nurse (1978 a, b). It could perhaps be an oscillatornormally entrained by the DNA-division cycle but running free after a cdc block(Goodwin, 1966). There is, however, no positive evidence for this and it would bedifficult to observe continued steps after a block since gene limitation comes in tostop them.
43° T. Benitez, P. Nurse and J. M. Mitchison
REFERENCES
BAECHTEL, F. S., HOPKINS, H. A. & SCHMIDT, R. R. (1970). Continuous inducibility of iso-citrate lyase during the cell cycle of the eucaryote Chlorella. Biochim. biophys. Ada 217,216-219.
CREANOR, J. (1978a). Carbon dioxide evolution during the cell cycle of the fission yeastSchizosaccharomyces pombe.J. Cell Sci. 33, 385-397.
CREANOR, J. (19786). Oxygen uptake during the cell cycle of the fission yeast Schizosaccharo-myces pombe.J. Cell Sci. 33, 399-411.
CREANOR, J., MAY, J. W. & MITCHISON, J. M. (1975). The effect of 8-hydroxyquinoline onenzyme synthesis in the fission yeast Schizosaccharomycespombe. Eur.J. Biochem. 60,487-493.
DAHLQVIST, A. (1966). Intestinal disaccharidases. Meth. Enzym. 8, 584-591.DONACHIE, W. D. & MASTERS, M. (1966). Evidence for polarity of chromosome replication in
F~ strains of Escherichia coli. Genet. Res. 8, 119-124.DONACHIE, W. D. & MASTERS, M. (1969). Temporal control of gene expression in bacteria.
In The Cell Cycle. Gene-enzyme Interactions (ed. G. M. Padilla, G. L. Whitson & I. L.Cameron), pp. 37-76. New York & London: Academic Press.
FRASER, R. S. S. & CREANOR, J. (1974). Rapid and selective inhibition of RNA synthesis inyeast by 8-hydroxyquinoline. Eur.J. Biochem. 46, 67-73.
FRASER, R. S. S. & CREANOR, J. (1975). The mechanism of inhibition of ribonucleic acidsynthesis by 8-hydroxyquinoline and the antibiotic lomofungin. Biochem. J. 147, 401-410.
FRASER, R. S. S. & NURSE, P. (1978a). Novel cell cycle control of RNA synthesis in yeast.Nature, Lond. 271, 726-730.
FRASER, R. S. S. & NURSE, P. (19786). Altered patterns of ribonucleic acid synthesis duringthe cell cycle: a mechanism compensating for variation in gene concentration. J. Cell Sci.35, 25-4O-
GOODWIN, B. (1966). An entrainment model for timed enzyme synthesis in Bacteria. Nature,Lond. 209, 479-481.
HELMSTETTER, C. E. (1968). Origin and sequence of chromosome replication in Escherichia coli.J. Bad. 95, 1634-1641.
KAPP, L. N. & OKADA, S. (1972). Actinomycin D induction of acid phosphatase in synchronisedL5178Y mouse leukemia cells. Expl Cell Res. 72, 473-479.
KNUTSEN, G. (1965). Induction of nitrite reductase in synchronized cultures of Chlorellapyrenoidosa. Biochim. biophys. Ada 161, 205-214.
KNUTSEN, G. (1968). Repressed and derepressed synthesis of phosphatases during synchronousgrowth of Chlorella pyrenoidosa. Biochim. biophys. Ada 161, 205-214.
KUEMPEL, P. L., MASTERS, M. & PARDEE, A. B. (1965). Bursts of enzyme synthesis in thebacterial duplication cycle. Biochem. biophys. Res. Commun. 18, 858-867.
LIEN, T. & KNUTSEN, G. (1972). Synchronous cultures oiChlamydomonas reinhardtii. Synthesisof repressed and derepressed phosphatase during the life cycle. Biochim. biophys. Ada287, 154-163.
LOWRY, O. H., ROSEBROUGH, N. J., FARR, A. L. & RANDALL, R. J. (1951). Protein measurementwith the folin phenol reagent. .7. biol. Chem. 193, 265-275.
MARTIN, D. W., TOMKINS, G. M. & GRANNER, D. (1969). Synthesis and induction of tyrosineaminotransferase in synchronized hepatoma cells in culture. Proc. natn. Acad. Sci. U.S.A.62, 248-255.
MASTERS, M. & PARDEE, A. B. (1965). Sequence of enzyme synthesis and gene replication duringthe cell cycle of Bacillus subtilis. Proc. natn. Acad. Sci. U.S.A. 54, 64-70.
MCCULLOUGH, W. & JOHN, P. C. L. (1972). A temporal control of de novo synthesis of iso-citrate lyase during the cell cycle of the eucaryote Chlorella pyrenoidosa. Biochim. biophys.Ada 269, 287-296.
MIDDLEHOVEN, W. J. (1964). The pathway of arginine breakdown in Saccharomyces cerevisiae.Biochim. biophys. Acta 93, 650-652.
MITCHISON, J. M. (1970). Physiological and cytological methods for Schizosacdiaromycespombe. In Methods in Cell Physiology, vol. 4 (ed. D. M. Prescott), pp. 131-165. New York& London: Academic Press.
Enzyme potential in yeast 431
MITCHISON, J. M. (1971). The Biology of the Cell Cycle. London: Cambridge University Press.MITCHISON, J. M. & CARTER, B. L. A. (1975). Cell cycle analysis. In Methods in Cell Biology,
vol. 11 (ed. D. M. Prescott), pp. 201-219. New York & London: Academic Press.MITCHISON, J. M. & CREANOR, J. (1969). Linear synthesis of sucrase and phosphatases during
the cell cycle of Schizosaccharomyces pombe. jf. Cell Set. 5, 373-391.MITCHISON, J. M. & CREANOR, J. (1971). Further measurements of DNA synthesis and enzyme
potential during cell cycle of fission yeast Schizosaccharomyces pombe. Expl Cell Res. 69,244-247-
NASMYTH, K., NURSE, P. & FRASER, R. S. S. (1979). The effect of cell mass on the cell cycletiming and duration of S-phase in fission yeast. J. Cell Set. 39, 215-233.
NURSE, P. (1975). Genetic control of cell size at cell division. Nature, Lond. 256, 547-551.NURSE, P., THURLAUX, P. & NASMYTH, K. (1976). Genetic control of the cell division cycle in
the fission yeast Sckizosaccliaromyces pombe. Molec. gen. Genet. 146, 167—178.PATO, M. L. & GLASER, D. A. (1968). The origin and direction of replication of the chromosome
of Escherichia coli B/r. Proc. natn. Acad Sci. U.S.A. 60, 1268-1274.SCHMIDT, R. R. (1974). Transcriptional and post-transcriptional control of enzyme levels in
eucaryotic microorganism. In Cell Cycle Controls (ed. G. M. Padilla, I. L. Cameron &A. Zimmerman), pp. 201-233. New York & London: Academic Press.
SCHREINER, 0., LIEN, T. & KNUTSEN, G. (1975). The capacity for arylsulfates synthesis insynchronous and synchronized cultures of Chlamydomonas reinhardtii. Biochim. biophys. Acta384, 180-193.
SEBASTIAN, J., CARTER, B. L. A. & HALVORSON, H. O. (1973). Induction capacity of enzymesynthesis during the cell cycle of Sacciiaromyces cerevisiae. Eur.J. Biochem. 37, 516-522.
SISSONS, C. H., MITCHISON, J. M. & CREANOR, J. (1973). Enzyme synthesis and potentialduring induction synchrony in the fission yeast Schizosaccharomyces pombe. Expl Cell Res.82, 63-72.
THURIAUX, P., NURSE, P. & CARTER, B. (1978). Mutants altered in the control co-ordinatingcell division with cell growth in the fission yeast Schizosaccharomyces pombe. Molec. gen.Genet. 161, 215-220.
TURNER, K. J., GRONOSTAJSKI, R. M. & SCHMIDT, R. R. (1978). Regulation of initial rate ofinduction of nicotinamide adenine dinucleotide phosphate-specific glutamate dehydrogenaseduring the cell cycle of synchronous Chlorella.J. Bad. 134, 1013-1019.
WOODWARD, J. & MERRETT, M. J. (1975). Induction potential for glyoxylate cycle enzymesduring the cell cycle oiEuglena gracilis. Eur.J. Biochem. 55, 555-559.
YONEDA, M., IKEDA, M. & WASHITANI, S. (1978). Periodic changes in the tension at the surfaceof activated non-nucleate fragments of sea-urchin eggs. Devel. Growtli & Differ. 20, 329—336.
(Received 30 January 1980 -Revised 21 April 1980)
