arizona...tenant if they evict a non-paying renter, they are much more likely to do so, and do so...
TRANSCRIPT

1
ARIZONA2018 Housing At-a-glance
2
The Arizona Department of Housing is pleased to provide its 2018 Housing At-a-Glance Report, with information concerning Arizona’s current housing market and its overall affordability. This short document provides a summary view of the market, with additional housing data available to download from the Department’s website at azhousing.gov.
Housing is a market-driven industry, as it should be. Yet, despite a growing economy, some members of our community have found it increasingly difficult to stretch their limited incomes to cover the rising cost of housing and other necessary living expenses. For a significant number of Arizona’s households, housing is their greatest single expense each month.
The U.S. economy completed 2017 on firm footing, and relatively strong economic growth is expected in 2018 and 2019. This growth will be accompanied by further tightening in the labor markets and unemployment rates reaching historic lows.
However, the price of housing has also escalated and interest rates are rising. Income growth across the nation has been modest during this economic expansion, thus further impacting housing affordability. In fact, housing affordability has become an important public policy issue across the nation as a whole, but each state has a different story.
Housing Economics in Arizona
Prior to the Great Recession, the mix of housing production in the state was 85% single family, and 15% multi-family (for 2006). The dynamics have since changed. In 2017, 71% of production was single family and 29% was multi-family. A lag in the number of new single family homes being built over prior boom periods, and a concerted effort by investors to purchase existing
Few things are more important to the quality of our lives than the place we lay our heads each night, which emphasizes why the availability, quality and sustainability of our housing stock is so very important to the growth of the State and the wellbeing of its citizens. We are all better off as a society when people are adequately housed.
If you are reading this report, we know you share our concern about Arizona’s ever evolving housing landscape and hope you find this information helpful in understanding Arizona’s current housing market and its challenges.
single family homes for rental purposes, has adversely impacted the entry level housing market, especially in the urban areas of the state as well as a few hot markets in rural Arizona. Rental housing being built in Arizona’s urban areas has also skewed to the luxury market, as some formerly affordable properties have been lost to redevelopment or are no longer attainable for lower-to-moderate income earners due to substantial rent increases.
The economic downturn, along with changing demographic issues, especially the Millennial generations preferences in housing, resulted in a fundamental change in how housing has been demanded and delivered in the past decade. As the economy continues to improve there will be additional demands for single-family products, but the demand for multi-family units will continue to be much higher than previous trends. The affordability of apartment units is now just as important as with single-family homes, and both are now a concern. A growing senior population, as the baby boomer generation retires, many with limited retirement savings, will also strongly impact Arizona’s need for affordable, non-luxury rental products, as well as smaller single-family homes.
2018 Housing Market . . . The Economic Considerations
3
New Home Construction and Homeownership
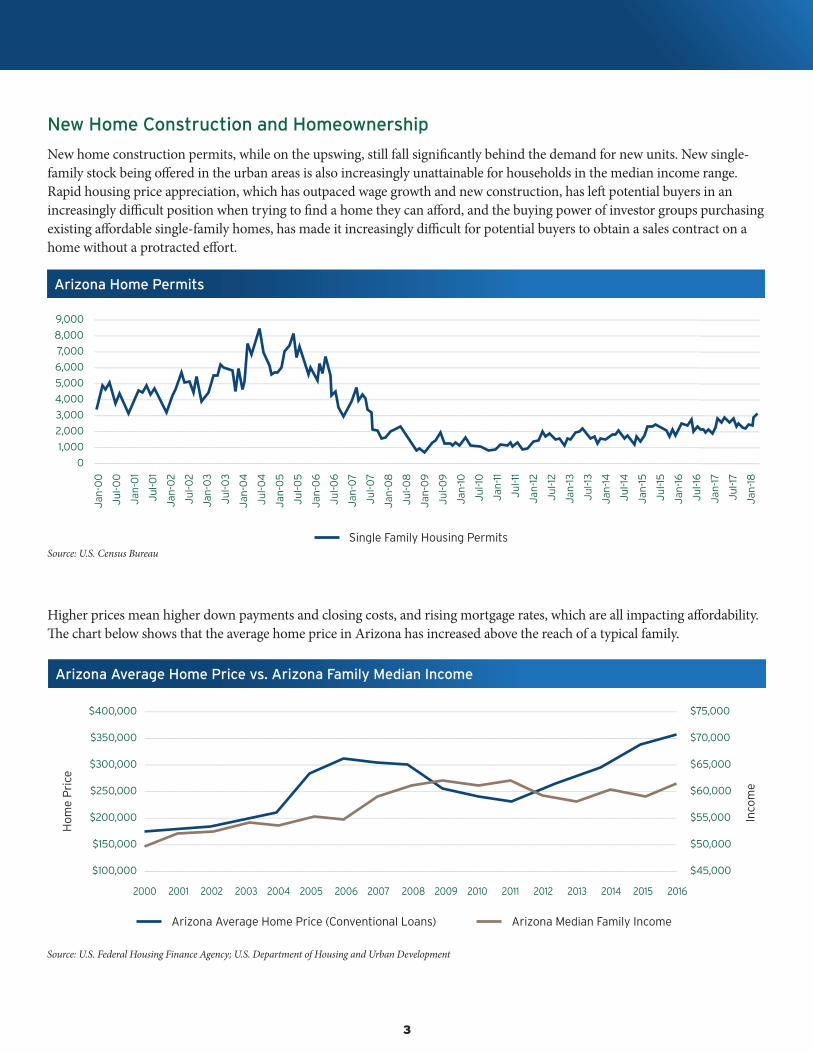
New home construction permits, while on the upswing, still fall significantly behind the demand for new units. New single-family stock being offered in the urban areas is also increasingly unattainable for households in the median income range. Rapid housing price appreciation, which has outpaced wage growth and new construction, has left potential buyers in an increasingly difficult position when trying to find a home they can afford, and the buying power of investor groups purchasing existing affordable single-family homes, has made it increasingly difficult for potential buyers to obtain a sales contract on a home without a protracted effort.
Source: U.S. Census Bureau
9,000 _______________________________________________________________________________________________________________________________
8,000 _______________________________________________________________________________________________________________________________
7,000 _______________________________________________________________________________________________________________________________
6,000 _______________________________________________________________________________________________________________________________
5,000 _______________________________________________________________________________________________________________________________
4,000 _______________________________________________________________________________________________________________________________
3,000 _______________________________________________________________________________________________________________________________
2,000 _______________________________________________________________________________________________________________________________
1,000 _______________________________________________________________________________________________________________________________
0 _______________________________________________________________________________________________________________________________
Jan
-00
Ju
l-00
Jan
-01
Ju
l-01
Jan
-02
Ju
l-02
Jan
-03
Ju
l-03
Jan
-04
Ju
l-04
Jan
-05
Ju
l-05
Jan
-06
Ju
l-06
Jan
-07
Ju
l-07
Jan
-08
Ju
l-08
Jan
-09
Ju
l-09
Jan
-10
Ju
l-10
Jan
-11
Ju
l-11
Jan
-12
Ju
l-12
Jan
-13
Ju
l-13
Jan
-14
Ju
l-14
Jan
-15
Ju
l-15
Jan
-16
Ju
l-16
Jan
-17
Ju
l-17
Jan
-18
Arizona Home Permits
SingleFamilyHousingPermits
$400,000 ______________________________________________________________________________________________________ $75,000
$350,000 ______________________________________________________________________________________________________ $70,000
$300,000 ______________________________________________________________________________________________________ $65,000
$250,000 ______________________________________________________________________________________________________ $60,000
$200,000 ______________________________________________________________________________________________________ $55,000
$150,000 ______________________________________________________________________________________________________ $50,000
$100,000 ______________________________________________________________________________________________________ $45,000
Arizona Average Home Price vs. Arizona Family Median Income
20002001200220032004200520062007200820092010201120122013201420152016
ArizonaAverageHomePrice(ConventionalLoans) ArizonaMedianFamilyIncome
Ho
me
Pri
ce
Inco
me
Source: U.S. Federal Housing Finance Agency; U.S. Department of Housing and Urban Development
Higher prices mean higher down payments and closing costs, and rising mortgage rates, which are all impacting affordability. The chart below shows that the average home price in Arizona has increased above the reach of a typical family.

4
There are a variety of factors influencing whether a household chooses to own or rent (such as financial situations, expected length of stay, and perceived benefits), so there is no ideal homeownership rate. While the homeownership rate in Arizona seems to have bottomed out at 61.7% in 2016, it is still well below the pre-recession high. From the peak at 71.6% in 2006, the homeownership rate stood at 64.4% as of 2017. It is too early to tell if the recent increase in homeownership rates is a start to a trend to return to previous levels of homeownership in Arizona. However, the aforementioned impediments to ownership are likely to impact this trend.
Rental Housing
With homeownership becoming less attainable and state in-migration rates increasing, the demand for rental units has expanded beyond the demand created by the aforementioned demographic and economic conditions. Over the past year, the median rent for multi-family housing rose 4.8% to $1,192 in Arizona. Similarly, the rental price of single-family homes in Arizona increased 4.2% over the same time period to $1,356. If a household does not aim to spend more than 30% of its income on housing, a household income of $47,680 is required to pay the median multi-family unit rent and a household income of $54,240 would be required to cover the median single-family rent. These higher prices are out of reach for many lower and moderate-income households leaving them with fewer options in a very tight market.
72.0% _______________________________________________________________________________________________________________________________
70.0% ______________________________________________________________________________________________________________________________
68.0% _______________________________________________________________________________________________________________________________
66.0% _______________________________________________________________________________________________________________________________
64.0% _______________________________________________________________________________________________________________________________
62.0% _______________________________________________________________________________________________________________________________
60.0% _______________________________________________________________________________________________________________________________
Arizona Homeownership Rate
200020012002200320042005200620072008200920102011201220132014201520162017
HomeownershipRateSource: U.S. Census Bureau
$1,400 ______________________________________________________________________________________________________________________________
$1,300 ______________________________________________________________________________________________________________________________
$1,200 ______________________________________________________________________________________________________________________________
$1,100 ______________________________________________________________________________________________________________________________
$1,000 ______________________________________________________________________________________________________________________________
$900 ______________________________________________________________________________________________________________________________
$800 ______________________________________________________________________________________________________________________________
Jan
-15
Apr
-15
Ju
l-15
Oct
-15
Jan
-16
Apr
-16
Ju
l-16
Oct
-16
Jan
-17
Apr
-17
Ju
l-17
Oct
-17
Jan
-18
Apr
-18
Ju
l-18
Oct
-18
Jan
-19
Apr
-19
Ju
l-19
Oct
-19
Jan
-20
Apr
-20
Ju
l-20
Oct
-20
Jan
-21
Apr
-21
Ju
l-21
Oct
-21
Jan
-22
Apr
-22
Arizona Median Rental Rates
Multi-FamilyRentalRate SingleFamilyRentalRateSource: Zillow Research
The housing affordability challenges, particularly for lower and moderate-income households, is something that cannot be overlooked. Cost burdened households may struggle to afford other necessitates such as food, clothing, transportation, and medical expenses, as too much of their income is being used to pay for housing. Many rent-burdened households are one paycheck away from eviction. According to the National Low Income Housing Coalition, Arizona has a shortgage of 159,599 affordable and available rentals for extremely low income renter households.
5
Foreclosures
Foreclosures in Arizona have fallen to pre-recession levels (less than .1% at the end of 2017.) While foreclosures are considered significant stressors for any household experiencing foreclosure, today’s foreclosure levels are not considered to be a crisis level. Because housing prices have increased over the past few years, homeowners with equity who cannot meet their current mortgages have more options available to them than a few short years ago when the mortgage foreclosure crisis resulted in serious negative equity issues for many homeowners. For the largest part, Arizona’s housing market has gone from being one of the hardest hit by foreclosures, to having one of the best recoveries with a low foreclosure rate. However, there are some pockets within the state that have not recovered on par with the state as a whole.
When analyzing a community to determine whether or not it is still experiencing a distressed housing market, several different economic factors may be considered, including changes in sales prices compared to the previous year, REO and short sale rates, the percentage of properties with negative equity, and the number of foreclosures within a geographical area compared to the rest of the state. As of the end of 2017, data shows that there are 26 zip codes located in twelve specific housing markets that have not recovered at the same rate as the rest of the state. Those still-distressed zip codes are located in Bullhead City (1), Casa Grande (1), Glendale (1), Green Valley (1), Kingman (1), Phoenix (5), Rio Rico (1), Sahuarita (1), Sierra Vista (2), Tucson (8), Vail (1), Yuma (3).
Evictions
Evictions appear to be on the rise in Arizona. In 2017, at least 34,823 Writs of Restitution were issued by Arizona’s court system for landlords seeking to evict tenants, with 25,009 issued in Maricopa County alone. The next highest counties were Pima with 3,937 and Pinal with 2,239. In Maricopa County, Writs granted by the Court system increased 12.5 percent between 2016 and 2017. While we can tell there is a rising eviction rate by tracking the actions of the court – this does not tell the whole story. The eviction process starts when a landlord serves a tenant with an Eviction Notice, which means there are likely untold numbers who may vacate their units prior
to the landlord ever filing with the courts. Evictions are devastating to households in that they generally result in increased difficulties in renting their next home and sometimes result in at least short term homelessness. One reason for the rise in evictions is the tight rental market. When the supply of available, affordable units is low, and landlords know they will have no problem finding another tenant if they evict a non-paying renter, they are much more likely to do so, and do so more quickly. Increased evictions are one of the primary factors in an increase in incidences of homelessness in Arizona. Many households are not able to re-house themselves after an eviction without financial assistance from family, friends, charity or public assistance.
Homelessness
Determining how many Arizonans experience homelessness is a complex issue. Many individuals and households who have lost their permanent housing are never reported as homeless, because they temporarily live with family or friends or otherwise find short-term accommodations. Based on information from the State’s Homeless Management Information System (HMIS), we know that 37,404 unduplicated individuals sought assistance with homeless services during the 12 month period ending June 30, 2017. However, that high figure only demonstrates how many people sought assistance over the period of one year.
To assess how many people are experiencing homelessness at any given day of the year, advocates rely on an annual Point in Time (PIT) Count conducted by the State’s three Continuum of Care regions. Between 2017 and 2018, Arizona’s PIT homeless population increased by approximately 918 individuals (10%), from 8,947 in January 2017 to 9,865 in January 2018. Increases were attributable to increases in Maricopa County and the 13 rural counties. Especially troubling are increases in unsheltered individuals which have increased by about a quarter each year in Maricopa County for the past several years. Increases in homelessness pose a risk to the basic health and safety of many residents, and ultimately comes at a cost to society in forms of increased public health and safety expenses and taxpayer assistance.
6
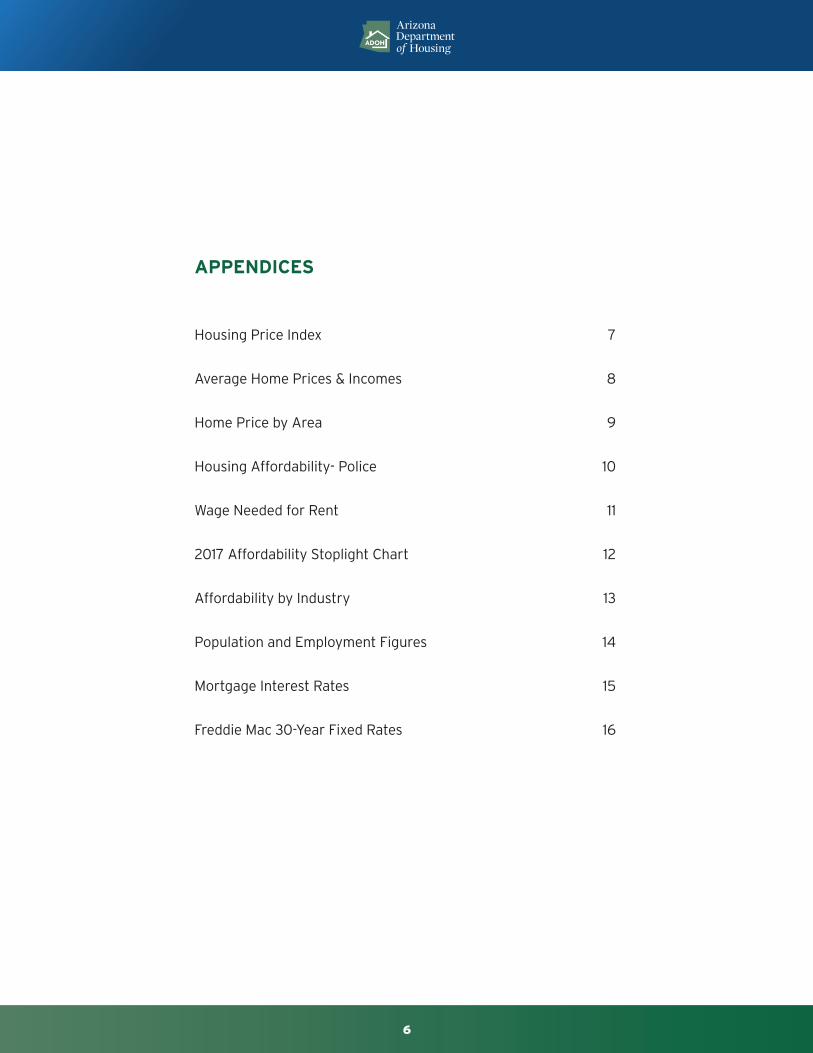
APPENDICES
HousingPriceIndex 7
AverageHomePrices&Incomes 8
HomePricebyArea 9
HousingAffordability-Police 10
WageNeededforRent 11
2017AffordabilityStoplightChart 12
AffordabilitybyIndustry 13
PopulationandEmploymentFigures 14
MortgageInterestRates 15
FreddieMac30-YearFixedRates 16

7
Arizona Housing Price Increase or Decrease Ranking
Based on the Housing Price Index (HPI) issued by the Federal Housing Finance Agency (FHFA), housing price appreciation in Arizona was ranked number seven nationally for the first quarter 2018, where it has remained steadily over the past few years. During the Great Recession, Arizona’s housing appreciation rate was ranked amongst the worst in the nation, so this sustained improvement is a clear indication of the strength of Arizona’s recovery since the financial crises.
Source: U.S. Federal Housing Finance Agency, Housing Price Index Seasonally Adjusted, Purchase-Only HPI, 2018Q1
State Rank Year-Over-Year %
Nevada 1 13.71Washington 2 13.06
Idaho 3 11.12Colorado 4 10.63
Utah 5 9.91Oregon 6 9.61Arizona 7 9.46
Hawai'i 8 9.22California 9 8.87
North Carolina 10 8.42Florida 11 8.37
Nebraska 12 8.30Michigan 13 7.78Delaware 14 7.72Tennessee 15 7.67Georgia 16 7.65Indiana 17 7.45Texas 18 7.43
South Carolina 19 7.41Ohio 20 7.30
U.S. Average 6.89
8
YearMedian Price (FHFA) Avg. Purchase Price
(FHFA)Fiscal Year Median Income
2000 $140,600 $169,000 FY 2000 $47,800
2001 $143,900 $175,800 FY 2001 $49,700
2002 $146,000 $180,800 FY 2002 $51,900
2003 $156,500 $193,600 FY 2003 $52,700
2004 $169,000 $207,200 FY 2004 $53,300
2005 $240,000 $280,480 FY 2005 $53,300
2006 $260,000 $313,360 FY 2006 $54,900
2007 $246,000 $302,830 FY 2007 $54,400
2008 $240,000 $299,440 FY 2008 $58,500
2009 $192,450 $252,150 FY 2009 $60,400
2010 $190,000 $237,080 FY 2010 $61,500
2011 $170,000 $232,400 FY 2011 $60,800
2012 $196,500 $255,870 FY 2012 $61,600
2013 $220,000 $277,120 FY 2013 $58,800
2014 $240,500 $300,880 FY 2014 $57,500
2015 $265,000 $334,350 FY 2015 $59,800
2016 - $350,940 FY 2016 $58,700
2017 - - FY 2017 $61,600
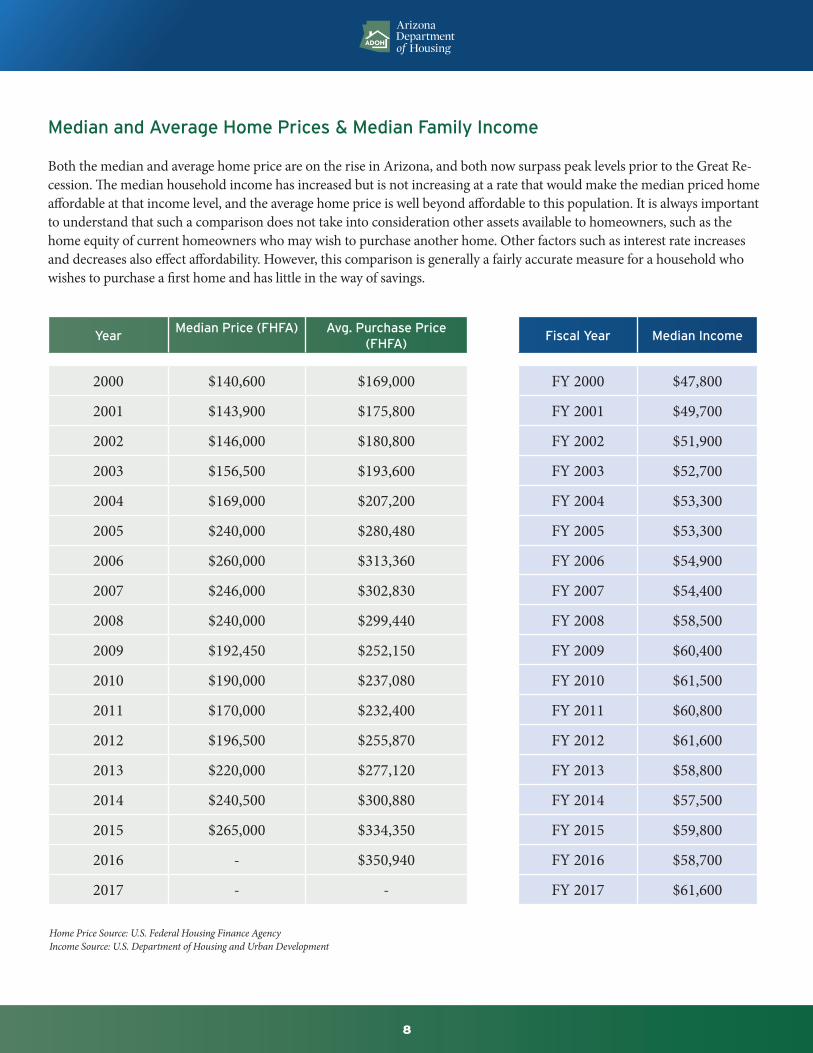
Median and Average Home Prices & Median Family Income
Both the median and average home price are on the rise in Arizona, and both now surpass peak levels prior to the Great Re-cession. The median household income has increased but is not increasing at a rate that would make the median priced home affordable at that income level, and the average home price is well beyond affordable to this population. It is always important to understand that such a comparison does not take into consideration other assets available to homeowners, such as the home equity of current homeowners who may wish to purchase another home. Other factors such as interest rate increases and decreases also effect affordability. However, this comparison is generally a fairly accurate measure for a household who wishes to purchase a first home and has little in the way of savings.
Home Price Source: U.S. Federal Housing Finance Agency Income Source: U.S. Department of Housing and Urban Development
9
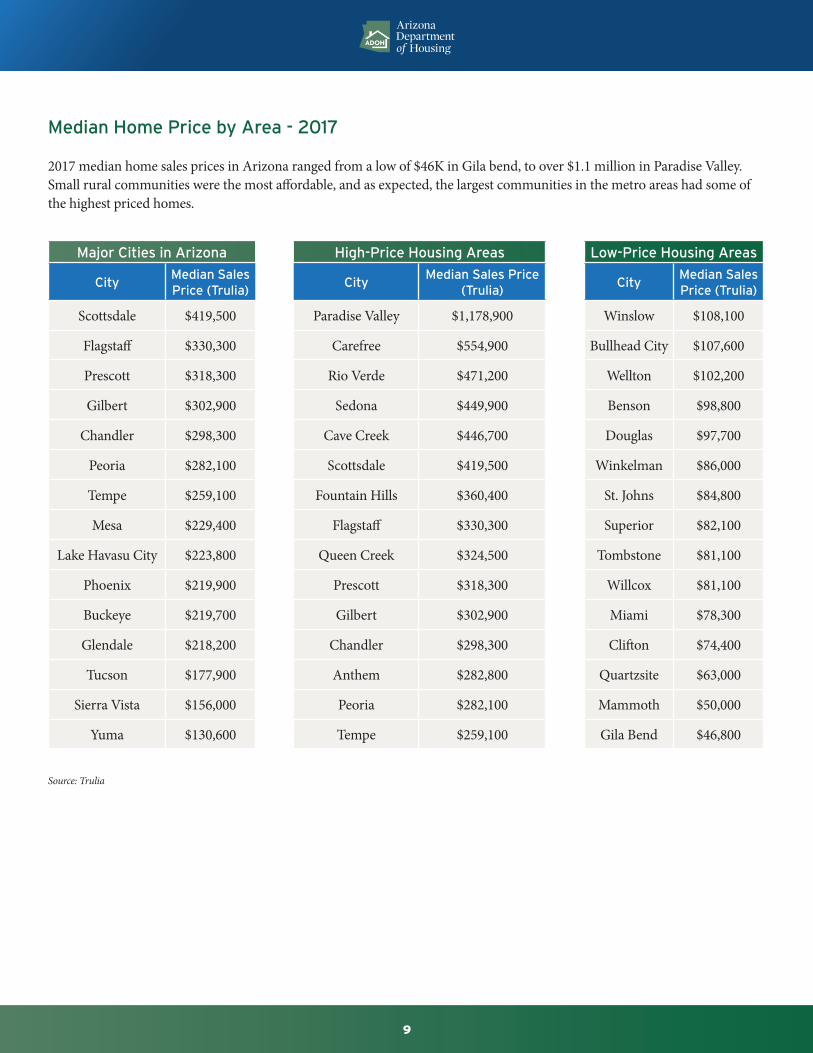
Median Home Price by Area - 2017
2017 median home sales prices in Arizona ranged from a low of $46K in Gila bend, to over $1.1 million in Paradise Valley. Small rural communities were the most affordable, and as expected, the largest communities in the metro areas had some of the highest priced homes.
Major Cities in Arizona High-Price Housing Areas Low-Price Housing Areas
CityMedian Sales Price (Trulia)
CityMedian Sales Price
(Trulia)City
Median Sales Price (Trulia)
Scottsdale $419,500 Paradise Valley $1,178,900 Winslow $108,100
Flagstaff $330,300 Carefree $554,900 Bullhead City $107,600
Prescott $318,300 Rio Verde $471,200 Wellton $102,200
Gilbert $302,900 Sedona $449,900 Benson $98,800
Chandler $298,300 Cave Creek $446,700 Douglas $97,700
Peoria $282,100 Scottsdale $419,500 Winkelman $86,000
Tempe $259,100 Fountain Hills $360,400 St. Johns $84,800
Mesa $229,400 Flagstaff $330,300 Superior $82,100
Lake Havasu City $223,800 Queen Creek $324,500 Tombstone $81,100
Phoenix $219,900 Prescott $318,300 Willcox $81,100
Buckeye $219,700 Gilbert $302,900 Miami $78,300
Glendale $218,200 Chandler $298,300 Clifton $74,400
Tucson $177,900 Anthem $282,800 Quartzsite $63,000
Sierra Vista $156,000 Peoria $282,100 Mammoth $50,000
Yuma $130,600 Tempe $259,100 Gila Bend $46,800
Source: Trulia

10
Housing Affordability Based on a Police Officer’s Salary
The tables below show the ability of a police officer to purchase a median priced home in certain communities.
Mortgage Assumptions
Down Payment 5.00%Interest Rate 4.25%Loan Term in Years 30Annual Property Tax 0.72%
One Income Earner per Household Two Income Earner per Household
City CountyMedian Sales Price (2017)
Annual Salary Required
Hourly Wage Required (Buy)
Hourly Median Wage of a Police Officer
Affordability StatusHourly Wage of a Police Officer and Another Income Earner*
Affordability Status
Bullhead City Mohave $107,600 $25,746 $12.38 $25.32 Affordable $43.04 Affordable
Casa Grande Pinal $166,700 $39,886 $19.18 $24.87 Affordable $42.28 Affordable
Chandler Maricopa $298,300 $71,374 $34.31 $34.96 Affordable $59.43 Affordable
Chino Valley Yavapai $203,600 $48,715 $23.42 $28.58 Affordable $48.59 Affordable
Coolidge Pinal $122,700 $29,358 $14.11 $24.87 Affordable $42.28 Affordable
Douglas Cochise $97,700 $23,377 $11.24 $25.57 Affordable $43.47 Affordable
Flagstaff Coconino $330,300 $79,031 $38.00 $24.80 Not Affordable $42.16 Affordable
Florence Pinal $157,400 $37,661 $18.11 $24.87 Affordable $42.28 Affordable
Glendale Maricopa $218,200 $52,209 $25.10 $34.96 Affordable $59.43 Affordable
Globe Gila $112,100 $26,822 $12.90 $24.45 Affordable $41.57 Affordable
Kingman Mohave $125,200 $29,957 $14.40 $25.32 Affordable $43.04 Affordable
Lake Havasu City Mohave $223,800 $53,549 $25.74 $25.32 Not Affordable $43.04 Affordable
Lakeside Navajo $166,100 $39,743 $19.11 $24.11 Affordable $40.99 Affordable
Marana Pima $215,300 $51,515 $24.77 $28.53 Affordable $48.50 Affordable
Maricopa Pinal $183,400 $43,882 $21.10 $24.87 Affordable $42.28 Affordable
Mesa Maricopa $229,400 $54,889 $26.39 $34.96 Affordable $59.43 Affordable
Peoria Maricopa $282,100 $67,498 $32.45 $34.96 Affordable $59.43 Affordable
Phoenix Maricopa $219,900 $52,616 $25.30 $34.96 Affordable $59.43 Affordable
Pine Gila $213,200 $51,012 $24.53 $24.45 Not Affordable $41.57 Affordable
Pinetop Navajo $241,400 $57,760 $27.77 $24.11 Not Affordable $40.99 Affordable
Prescott Yavapai $318,300 $76,160 $36.62 $28.58 Not Affordable $48.59 Affordable
Rio Rico Santa Cruz $122,200 $29,239 $14.06 $21.75 Affordable $36.98 Affordable
Safford Graham $132,700 $31,751 $15.26 $23.57 Affordable $40.07 Affordable
Sahuarita Pima $142,200 $34,024 $16.36 $28.53 Affordable $48.50 Affordable
Scottsdale Maricopa $419,500 $100,374 $48.26 $34.96 Not Affordable $59.43 Affordable
Sedona Yavapai/Coconino $449,900 $107,648 $51.75 $26.69 Not Affordable $45.37 Not Affordable
Show Low Navajo $117,900 $28,210 $13.56 $24.11 Affordable $40.99 Affordable
Sierra Vista Cochise $156,000 $37,326 $17.95 $25.57 Affordable $43.47 Affordable
Snowflake Navajo $127,400 $30,483 $14.66 $24.11 Affordable $40.99 Affordable
Somerton Yuma $142,900 $34,192 $16.44 $23.09 Affordable $39.25 Affordable
Surprise Maricopa $228,700 $54,721 $26.31 $34.96 Affordable $59.43 Affordable
Tempe Maricopa $259,500 $62,091 $29.85 $34.96 Affordable $59.43 Affordable
Tucson Pima $176,200 $42,159 $20.27 $28.53 Affordable $48.50 Affordable
Yuma Yuma $130,600 $31,249 $15.02 $23.09 Affordable $39.25 Affordable
Arizona $230,300 $55,104 $26.49 32.69 Affordable $55.57 Affordable
Annual Home Insurance Premium 0.35%Annual PMI Premium 0.50%% of Income Devoted to Mortage Payment 30.00%
Source: Trulia; Zillow; Tax-Rates.org; Freddie Mac; Arizona Office of Economic Opportunity
11
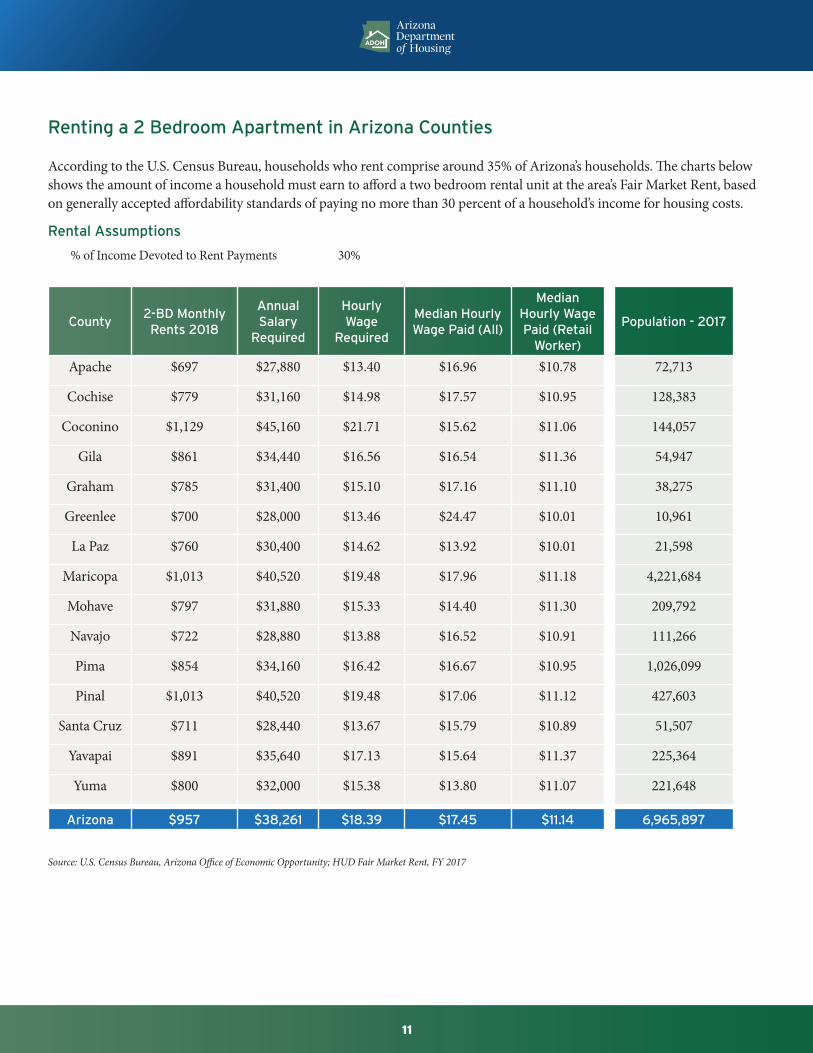
Renting a 2 Bedroom Apartment in Arizona Counties
According to the U.S. Census Bureau, households who rent comprise around 35% of Arizona’s households. The charts below shows the amount of income a household must earn to afford a two bedroom rental unit at the area’s Fair Market Rent, based on generally accepted affordability standards of paying no more than 30 percent of a household’s income for housing costs.
Rental Assumptions
% of Income Devoted to Rent Payments 30%
County2-BD Monthly Rents 2018
Annual Salary
Required
Hourly Wage
Required
Median Hourly Wage Paid (All)
Median Hourly Wage Paid (Retail
Worker)
Population - 2017
Apache $697 $27,880 $13.40 $16.96 $10.78 72,713
Cochise $779 $31,160 $14.98 $17.57 $10.95 128,383
Coconino $1,129 $45,160 $21.71 $15.62 $11.06 144,057
Gila $861 $34,440 $16.56 $16.54 $11.36 54,947
Graham $785 $31,400 $15.10 $17.16 $11.10 38,275
Greenlee $700 $28,000 $13.46 $24.47 $10.01 10,961
La Paz $760 $30,400 $14.62 $13.92 $10.01 21,598
Maricopa $1,013 $40,520 $19.48 $17.96 $11.18 4,221,684
Mohave $797 $31,880 $15.33 $14.40 $11.30 209,792
Navajo $722 $28,880 $13.88 $16.52 $10.91 111,266
Pima $854 $34,160 $16.42 $16.67 $10.95 1,026,099
Pinal $1,013 $40,520 $19.48 $17.06 $11.12 427,603
Santa Cruz $711 $28,440 $13.67 $15.79 $10.89 51,507
Yavapai $891 $35,640 $17.13 $15.64 $11.37 225,364
Yuma $800 $32,000 $15.38 $13.80 $11.07 221,648
Arizona $957 $38,261 $18.39 $17.45 $11.14 6,965,897
Source: U.S. Census Bureau, Arizona Office of Economic Opportunity; HUD Fair Market Rent, FY 2017
12
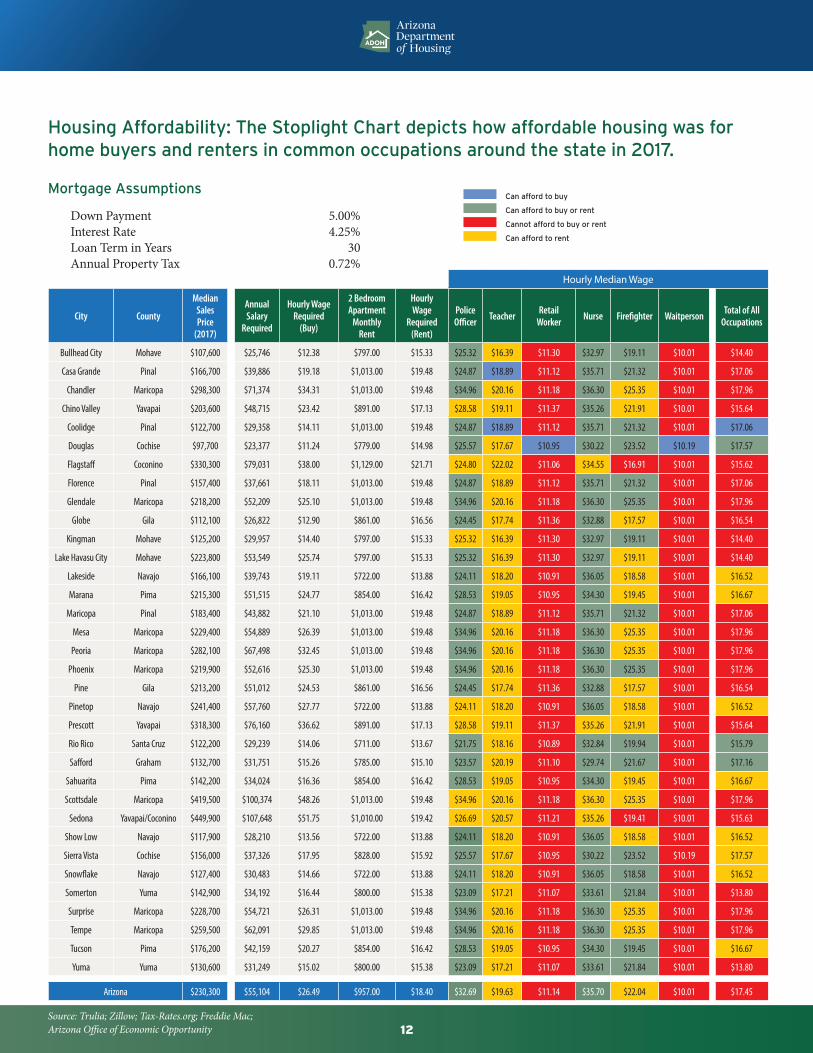
Housing Affordability: The Stoplight Chart depicts how affordable housing was for home buyers and renters in common occupations around the state in 2017.
Mortgage Assumptions
Down Payment 5.00%Interest Rate 4.25%Loan Term in Years 30Annual Property Tax 0.72%
Hourly Median Wage
City County
Median Sales Price
(2017)
Annual Salary
Required
Hourly Wage Required
(Buy)
2 Bedroom Apartment
Monthly Rent
Hourly Wage
Required (Rent)
Police Officer Teacher Retail
Worker Nurse Firefighter Waitperson Total of All Occupations
Bullhead City Mohave $107,600 $25,746 $12.38 $797.00 $15.33 $25.32 $16.39 $11.30 $32.97 $19.11 $10.01 $14.40
Casa Grande Pinal $166,700 $39,886 $19.18 $1,013.00 $19.48 $24.87 $18.89 $11.12 $35.71 $21.32 $10.01 $17.06
Chandler Maricopa $298,300 $71,374 $34.31 $1,013.00 $19.48 $34.96 $20.16 $11.18 $36.30 $25.35 $10.01 $17.96
Chino Valley Yavapai $203,600 $48,715 $23.42 $891.00 $17.13 $28.58 $19.11 $11.37 $35.26 $21.91 $10.01 $15.64
Coolidge Pinal $122,700 $29,358 $14.11 $1,013.00 $19.48 $24.87 $18.89 $11.12 $35.71 $21.32 $10.01 $17.06
Douglas Cochise $97,700 $23,377 $11.24 $779.00 $14.98 $25.57 $17.67 $10.95 $30.22 $23.52 $10.19 $17.57
Flagstaff Coconino $330,300 $79,031 $38.00 $1,129.00 $21.71 $24.80 $22.02 $11.06 $34.55 $16.91 $10.01 $15.62
Florence Pinal $157,400 $37,661 $18.11 $1,013.00 $19.48 $24.87 $18.89 $11.12 $35.71 $21.32 $10.01 $17.06
Glendale Maricopa $218,200 $52,209 $25.10 $1,013.00 $19.48 $34.96 $20.16 $11.18 $36.30 $25.35 $10.01 $17.96
Globe Gila $112,100 $26,822 $12.90 $861.00 $16.56 $24.45 $17.74 $11.36 $32.88 $17.57 $10.01 $16.54
Kingman Mohave $125,200 $29,957 $14.40 $797.00 $15.33 $25.32 $16.39 $11.30 $32.97 $19.11 $10.01 $14.40
Lake Havasu City Mohave $223,800 $53,549 $25.74 $797.00 $15.33 $25.32 $16.39 $11.30 $32.97 $19.11 $10.01 $14.40
Lakeside Navajo $166,100 $39,743 $19.11 $722.00 $13.88 $24.11 $18.20 $10.91 $36.05 $18.58 $10.01 $16.52
Marana Pima $215,300 $51,515 $24.77 $854.00 $16.42 $28.53 $19.05 $10.95 $34.30 $19.45 $10.01 $16.67
Maricopa Pinal $183,400 $43,882 $21.10 $1,013.00 $19.48 $24.87 $18.89 $11.12 $35.71 $21.32 $10.01 $17.06
Mesa Maricopa $229,400 $54,889 $26.39 $1,013.00 $19.48 $34.96 $20.16 $11.18 $36.30 $25.35 $10.01 $17.96
Peoria Maricopa $282,100 $67,498 $32.45 $1,013.00 $19.48 $34.96 $20.16 $11.18 $36.30 $25.35 $10.01 $17.96
Phoenix Maricopa $219,900 $52,616 $25.30 $1,013.00 $19.48 $34.96 $20.16 $11.18 $36.30 $25.35 $10.01 $17.96
Pine Gila $213,200 $51,012 $24.53 $861.00 $16.56 $24.45 $17.74 $11.36 $32.88 $17.57 $10.01 $16.54
Pinetop Navajo $241,400 $57,760 $27.77 $722.00 $13.88 $24.11 $18.20 $10.91 $36.05 $18.58 $10.01 $16.52
Prescott Yavapai $318,300 $76,160 $36.62 $891.00 $17.13 $28.58 $19.11 $11.37 $35.26 $21.91 $10.01 $15.64
Rio Rico Santa Cruz $122,200 $29,239 $14.06 $711.00 $13.67 $21.75 $18.16 $10.89 $32.84 $19.94 $10.01 $15.79
Safford Graham $132,700 $31,751 $15.26 $785.00 $15.10 $23.57 $20.19 $11.10 $29.74 $21.67 $10.01 $17.16
Sahuarita Pima $142,200 $34,024 $16.36 $854.00 $16.42 $28.53 $19.05 $10.95 $34.30 $19.45 $10.01 $16.67
Scottsdale Maricopa $419,500 $100,374 $48.26 $1,013.00 $19.48 $34.96 $20.16 $11.18 $36.30 $25.35 $10.01 $17.96
Sedona Yavapai/Coconino $449,900 $107,648 $51.75 $1,010.00 $19.42 $26.69 $20.57 $11.21 $35.26 $19.41 $10.01 $15.63
Show Low Navajo $117,900 $28,210 $13.56 $722.00 $13.88 $24.11 $18.20 $10.91 $36.05 $18.58 $10.01 $16.52
Sierra Vista Cochise $156,000 $37,326 $17.95 $828.00 $15.92 $25.57 $17.67 $10.95 $30.22 $23.52 $10.19 $17.57
Snowflake Navajo $127,400 $30,483 $14.66 $722.00 $13.88 $24.11 $18.20 $10.91 $36.05 $18.58 $10.01 $16.52
Somerton Yuma $142,900 $34,192 $16.44 $800.00 $15.38 $23.09 $17.21 $11.07 $33.61 $21.84 $10.01 $13.80
Surprise Maricopa $228,700 $54,721 $26.31 $1,013.00 $19.48 $34.96 $20.16 $11.18 $36.30 $25.35 $10.01 $17.96
Tempe Maricopa $259,500 $62,091 $29.85 $1,013.00 $19.48 $34.96 $20.16 $11.18 $36.30 $25.35 $10.01 $17.96
Tucson Pima $176,200 $42,159 $20.27 $854.00 $16.42 $28.53 $19.05 $10.95 $34.30 $19.45 $10.01 $16.67
Yuma Yuma $130,600 $31,249 $15.02 $800.00 $15.38 $23.09 $17.21 $11.07 $33.61 $21.84 $10.01 $13.80
Arizona $230,300 $55,104 $26.49 $957.00 $18.40 $32.69 $19.63 $11.14 $35.70 $22.04 $10.01 $17.45
Can afford to buy
Can afford to buy or rent
Cannot afford to buy or rent
Can afford to rent
Source: Trulia; Zillow; Tax-Rates.org; Freddie Mac; Arizona Office of Economic Opportunity
13
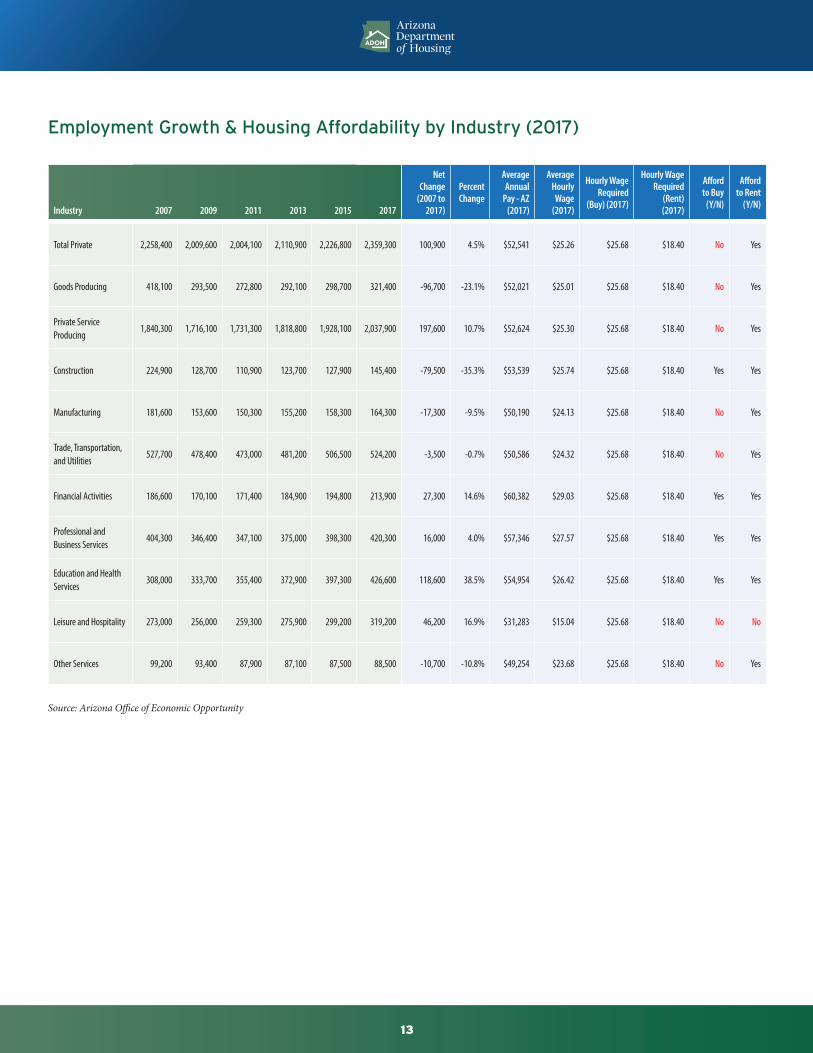
Employment Growth & Housing Affordability by Industry (2017)
Industry 2007 2009 2011 2013 2015 2017
Net Change
(2007 to 2017)
Percent Change
Average Annual
Pay - AZ (2017)
Average Hourly Wage
(2017)
Hourly Wage Required
(Buy) (2017)
Hourly Wage Required
(Rent) (2017)
Afford to Buy
(Y/N)
Afford to Rent
(Y/N)
Total Private 2,258,400 2,009,600 2,004,100 2,110,900 2,226,800 2,359,300 100,900 4.5% $52,541 $25.26 $25.68 $18.40 No Yes
Goods Producing 418,100 293,500 272,800 292,100 298,700 321,400 -96,700 -23.1% $52,021 $25.01 $25.68 $18.40 No Yes
Private Service Producing
1,840,300 1,716,100 1,731,300 1,818,800 1,928,100 2,037,900 197,600 10.7% $52,624 $25.30 $25.68 $18.40 No Yes
Construction 224,900 128,700 110,900 123,700 127,900 145,400 -79,500 -35.3% $53,539 $25.74 $25.68 $18.40 Yes Yes
Manufacturing 181,600 153,600 150,300 155,200 158,300 164,300 -17,300 -9.5% $50,190 $24.13 $25.68 $18.40 No Yes
Trade, Transportation, and Utilities
527,700 478,400 473,000 481,200 506,500 524,200 -3,500 -0.7% $50,586 $24.32 $25.68 $18.40 No Yes
Financial Activities 186,600 170,100 171,400 184,900 194,800 213,900 27,300 14.6% $60,382 $29.03 $25.68 $18.40 Yes Yes
Professional and Business Services
404,300 346,400 347,100 375,000 398,300 420,300 16,000 4.0% $57,346 $27.57 $25.68 $18.40 Yes Yes
Education and Health Services
308,000 333,700 355,400 372,900 397,300 426,600 118,600 38.5% $54,954 $26.42 $25.68 $18.40 Yes Yes
Leisure and Hospitality 273,000 256,000 259,300 275,900 299,200 319,200 46,200 16.9% $31,283 $15.04 $25.68 $18.40 No No
Other Services 99,200 93,400 87,900 87,100 87,500 88,500 -10,700 -10.8% $49,254 $23.68 $25.68 $18.40 No Yes
Source: Arizona Office of Economic Opportunity
14
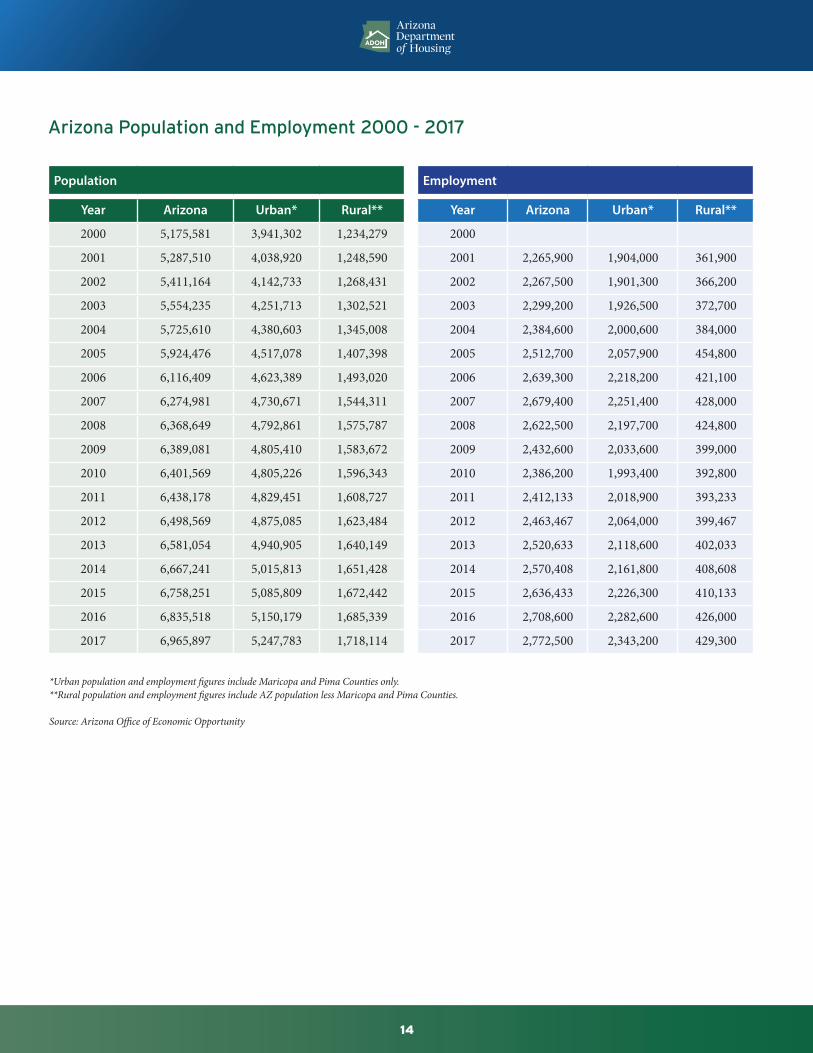
Arizona Population and Employment 2000 - 2017
Population Employment
Year Arizona Urban* Rural** Year Arizona Urban* Rural**
2000 5,175,581 3,941,302 1,234,279 2000
2001 5,287,510 4,038,920 1,248,590 2001 2,265,900 1,904,000 361,900
2002 5,411,164 4,142,733 1,268,431 2002 2,267,500 1,901,300 366,200
2003 5,554,235 4,251,713 1,302,521 2003 2,299,200 1,926,500 372,700
2004 5,725,610 4,380,603 1,345,008 2004 2,384,600 2,000,600 384,000
2005 5,924,476 4,517,078 1,407,398 2005 2,512,700 2,057,900 454,800
2006 6,116,409 4,623,389 1,493,020 2006 2,639,300 2,218,200 421,100
2007 6,274,981 4,730,671 1,544,311 2007 2,679,400 2,251,400 428,000
2008 6,368,649 4,792,861 1,575,787 2008 2,622,500 2,197,700 424,800
2009 6,389,081 4,805,410 1,583,672 2009 2,432,600 2,033,600 399,000
2010 6,401,569 4,805,226 1,596,343 2010 2,386,200 1,993,400 392,800
2011 6,438,178 4,829,451 1,608,727 2011 2,412,133 2,018,900 393,233
2012 6,498,569 4,875,085 1,623,484 2012 2,463,467 2,064,000 399,467
2013 6,581,054 4,940,905 1,640,149 2013 2,520,633 2,118,600 402,033
2014 6,667,241 5,015,813 1,651,428 2014 2,570,408 2,161,800 408,608
2015 6,758,251 5,085,809 1,672,442 2015 2,636,433 2,226,300 410,133
2016 6,835,518 5,150,179 1,685,339 2016 2,708,600 2,282,600 426,000
2017 6,965,897 5,247,783 1,718,114 2017 2,772,500 2,343,200 429,300
*Urban population and employment figures include Maricopa and Pima Counties only.**Rural population and employment figures include AZ population less Maricopa and Pima Counties.
Source: Arizona Office of Economic Opportunity
15
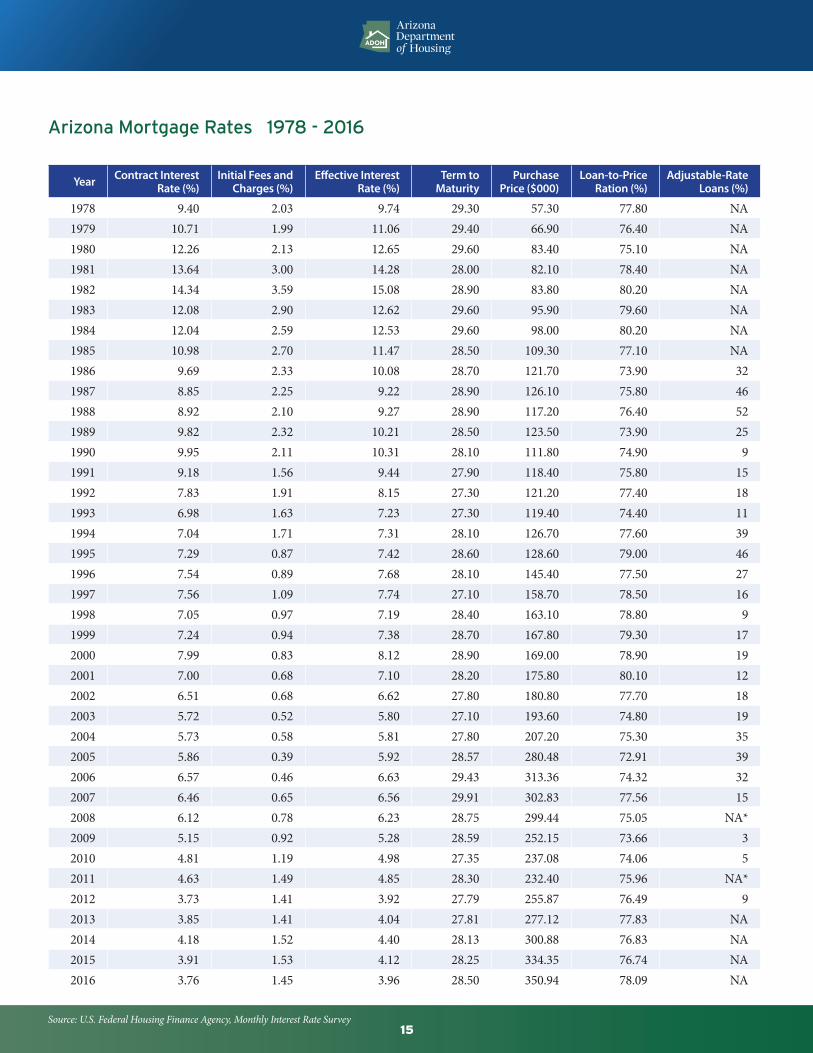
Arizona Mortgage Rates 1978 - 2016
Year Contract Interest Rate (%)
Initial Fees and Charges (%)
Effective Interest Rate (%)
Term to Maturity
Purchase Price ($000)
Loan-to-Price Ration (%)
Adjustable-Rate Loans (%)
1978 9.40 2.03 9.74 29.30 57.30 77.80 NA1979 10.71 1.99 11.06 29.40 66.90 76.40 NA1980 12.26 2.13 12.65 29.60 83.40 75.10 NA1981 13.64 3.00 14.28 28.00 82.10 78.40 NA1982 14.34 3.59 15.08 28.90 83.80 80.20 NA1983 12.08 2.90 12.62 29.60 95.90 79.60 NA1984 12.04 2.59 12.53 29.60 98.00 80.20 NA1985 10.98 2.70 11.47 28.50 109.30 77.10 NA1986 9.69 2.33 10.08 28.70 121.70 73.90 321987 8.85 2.25 9.22 28.90 126.10 75.80 461988 8.92 2.10 9.27 28.90 117.20 76.40 521989 9.82 2.32 10.21 28.50 123.50 73.90 251990 9.95 2.11 10.31 28.10 111.80 74.90 91991 9.18 1.56 9.44 27.90 118.40 75.80 151992 7.83 1.91 8.15 27.30 121.20 77.40 181993 6.98 1.63 7.23 27.30 119.40 74.40 111994 7.04 1.71 7.31 28.10 126.70 77.60 391995 7.29 0.87 7.42 28.60 128.60 79.00 461996 7.54 0.89 7.68 28.10 145.40 77.50 271997 7.56 1.09 7.74 27.10 158.70 78.50 161998 7.05 0.97 7.19 28.40 163.10 78.80 91999 7.24 0.94 7.38 28.70 167.80 79.30 172000 7.99 0.83 8.12 28.90 169.00 78.90 192001 7.00 0.68 7.10 28.20 175.80 80.10 122002 6.51 0.68 6.62 27.80 180.80 77.70 182003 5.72 0.52 5.80 27.10 193.60 74.80 192004 5.73 0.58 5.81 27.80 207.20 75.30 352005 5.86 0.39 5.92 28.57 280.48 72.91 392006 6.57 0.46 6.63 29.43 313.36 74.32 322007 6.46 0.65 6.56 29.91 302.83 77.56 152008 6.12 0.78 6.23 28.75 299.44 75.05 NA*2009 5.15 0.92 5.28 28.59 252.15 73.66 32010 4.81 1.19 4.98 27.35 237.08 74.06 52011 4.63 1.49 4.85 28.30 232.40 75.96 NA*2012 3.73 1.41 3.92 27.79 255.87 76.49 92013 3.85 1.41 4.04 27.81 277.12 77.83 NA2014 4.18 1.52 4.40 28.13 300.88 76.83 NA2015 3.91 1.53 4.12 28.25 334.35 76.74 NA2016 3.76 1.45 3.96 28.50 350.94 78.09 NA
Source: U.S. Federal Housing Finance Agency, Monthly Interest Rate Survey

16
Arizona Mortgage Rates
30-Year Fixed Rate Mortgages 15-Year Fixed Rate Mortgages 5/1 Hybrid Adjustable Rate Mortgages
Year Rate Points Year Rate Points Year Rate Points Margin
May-18 4.59 0.4 May-18 4.07 0.4 May-18 3.79 0.3 2.77Apr-18 4.47 0.5 Apr-18 3.93 0.4 Apr-18 3.66 0.3 2.76Mar-18 4.44 0.5 Mar-18 3.91 0.5 Mar-18 3.65 0.4 2.75Feb-18 4.33 0.6 Feb-18 3.79 0.5 Feb-18 3.60 0.4 2.75Jan-18 4.03 0.5 Jan-18 3.48 0.5 Jan-18 3.47 0.4 2.75
2017 3.99 0.5 2017 3.28 0.5 2017 3.20 0.4 2.742016 3.65 0.5 2016 2.93 0.5 2016 2.87 0.5 2.742015 3.85 0.6 2015 3.09 0.6 2015 2.94 0.5 2.742014 4.17 0.6 2014 3.29 0.6 2014 3.02 0.5 2.742013 3.98 0.7 2013 3.11 0.7 2013 2.88 0.5 2.752012 3.66 0.7 2012 2.93 0.7 2012 2.78 0.6 2.742011 4.45 0.7 2011 3.70 0.7 2011 3.31 0.6 2.742010 4.69 0.7 2010 4.10 0.7 2010 3.82 0.6 2.742009 5.04 0.7 2009 4.57 0.7 2009 4.75 0.6 2.742008 6.03 0.6 2008 5.62 0.6 2008 5.74 0.6 2.752007 6.34 0.4 2007 6.03 0.4 2007 6.07 0.5 2.762006 6.41 0.5 2006 6.07 0.5 2006 6.08 0.6 2.772005 5.87 0.6 2005 5.42 0.6 2005 5.32 0.6 2.782004 5.84 0.7 2004 5.21 0.6 2004 N/A N/A N/A2003 5.83 0.6 2003 5.17 0.6 2003 N/A N/A N/A2002 6.54 0.6 2002 5.98 0.6 2002 N/A N/A N/A2001 6.97 0.9 2001 6.50 0.9 2001 N/A N/A N/A2000 8.05 1.0 2000 7.72 1.0 2000 N/A N/A N/A
*Conventional, Conforming 15-Year Fixed-Rate Mortgages*Conventional, Conforming, Treasury-Indexed 5/1 Hybrid Adjustable Rate Mortgages
Source: Freddie Mac
17
Housing is a market-driven industry, as it should be. Yet even in the best economies, market situations occur that give rise to distress in certain housing markets. The goal of the Arizona Department of Housing is to help identify the market conditions that cause distress to its citizens, so that the State and its partners working to address housing issues can make the best investments with limited resources, and so that we are providing the best information in influencing policy directions in order to promote more housing choices for all Arizonans.
SOURCES
Arizona Department of HousingHomeless Management Information SystemMaricopa Association of Governments Point in Time CountNational Low Income Housing CoalitionRounds Consulting GroupTucson Pima Collaboration to End Homelessness Point in Time CountU.S. Census BureauU.S. Department of Housing and Urban DevelopmentU.S. Federal Housing Finance AgencyZillow Research
Appendice sources notated within those online documents
Title II of the Americans with Disabilities Act prohibits discrimination on the basis of disability in the programs of a public agency. Individuals with disabilities who need the information contained in this publication in an alternative format may contact the Arizona Department of Housing at (602) 771-1000 to make their needs known. Requests should be made as soon as possible to allow sufficient time to arrange for the accommodation.
Appendices providing additional charts and graphs depicting more detail on the housing market may be downloaded from the Arizona Department of Housing website:
https://housing.az.gov/documents-links/publications
ARIZONA2018 Housing At-a-glance