arkansas animal science - university of arkansas
TRANSCRIPT
Department Report • 2014Animal Science
ArkansasAnimal Science
Department Report • 2014
David L. Kreider, Editor • Paul Beck, Assistant Editor
A R K A N S A S A G R I C U L T U R A L E X P E R I M E N T S T A T I O NNovember 2014 Research Series 620

This publication is available on the internet at: http://arkansasagnews.uark.edu/1356.htm
Cover photo credit: University of Arkansas System Division of Agriculture.
Technical editing, layout, and cover design by Gail Halleck
Arkansas Agricultural Experiment Station, University of Arkansas System Division of Agriculture, Fayetteville. Mark J. Cochran, Vice President for Agriculture; Clarence E. Watson, AAES Director and Associate Vice-President for Agriculture–Research. WWW/InddCS6.The University of Arkansas System Division of Agriculture follows a nondiscriminatory policy in programs and employment.
ISSN: 1941-1685 CODEN: AKAMA6
ARKANSAS ANIMAL SCIENCE DEPARTMENT REPORT 2014
Edited by
David L. Kreider
Assistant Editor
Paul Beck
Department of Animal ScienceUniversity of Arkansas
Arkansas Agricultural Experiment StationUniversity of Arkansas System
Division of AgricultureFayetteville, Arkansas 72701
DisclaimerNo findings, conclusions, or reports regarding any product or any process that is contained in any article published in this report
should imply endorsement or non-endorsement of any such product or process.


INTRODUCTION
Welcome from the Department of Animal Science! This is the 17th edition of the Arkansas Animal Science pub-lication. As always, thanks to the faculty, staff and graduate students in the Department of Animal Science and to Drs. David Kreider and Paul Beck who served as co-editors. The associated publication Arkansas Animal Sci-ence–Research Highlights allows for those interested to quickly read, in a few brief statements, the impact of our research and extension programs. A weblink to the entire report is included within each highlight.
Readers are invited to view all programs of the Department of Animal Science at the departmental website at animalscience.uark.edu; the Livestock and Forestry Branch Station website at Batesvillestation.uark.edu; the Southwest Research and Extension Center website at swrec.uark.edu; and the Southeast Research and Extension Center website at aaes.uark.edu/serec.
We want to thank the many supporters of our teaching, research and extension programs. Whether providing grants for research and extension, funds for scholarships, supporting educational and extension programs, donat-ing facilities or horses and livestock, these friends are essential to maintaining a quality Animal Science program.
I am sure you will agree research generated from this Department will help in developing best management prac-tices that will increase whole farm/ranch efficiency, and ultimately, increase producer profitability. We appreciate your interest in the work that we do to enhance animal production in this state. We hope you find the research, extension and educational programs reported herein to be timely, useful and making a contribution to the field of Animal Science
Sincerely,
Michael LooperDepartment Head

INTERPRETING STATISTICS
Scientists use statistics as a tool to determine which differ-ences among treatments are real (and therefore biologically meaningful) and which differences are probably due to ran-dom occurrence (chance) or some other factors not related to the treatment.
Most data will be presented as means or averages of a spe-cific group (usually the treatment). Statements of probability that treatment means differ will be found in most papers in this publication, in tables as well as in the text. These will look like (P < 0.05); (P < 0.01); or (P < 0.001) and mean that the probability (P) that any two treatment means differ en-tirely due to chance is less than 5, 1, or 0.1%, respectively. Using the example of P < 0.05, there is less than a 5% chance that the differences between the two treatment averages are really the same. Statistical differences among means are of-ten indicated in tables by use of superscript letters. Treatments with any letter in common are not different, while treatments with no common letters are. Another way to report means is as mean + standard error (e.g., 9.1 + 1.2). The standard error of the mean (desig-nated SE or SEM) is a measure of how much variation is present in the data—the larger the SE, the more variation. If the difference between two means is less than two times the SE, then the treatments are usually not statistically different from one another. Other authors may report an LSD (least significant difference) value. When the difference between any two means is greater than or equal to the LSD value, then they are statistically different from one another. Another estimate of the amount of variation in a data set that may be used is the coefficient of variation (CV), which is the standard error expressed as a percentage of the mean. Orthogonal contrasts may be used when the interest is in reporting differences between specific combinations of treatments or to determine the type of response to the treat-ment (i.e., linear, quadratic, cubic, etc.).
Some experiments may report a correlation coefficient (r), which is a measure of the degree of association between two variables. Values can range from –1 to +1. A strong posi-
tive correlation (close to +1) between two variables indicates that if one variable has a high value then the other variable is likely to have a high value also. Similarly, low values of one variable tend to be associated with low values of the other variable. In contrast, a strong negative correlation coefficient (close to –1) indicates that high values of one variable tend to be associated with low values of the other variable. A cor-relation coefficient close to zero indicates that there is not much association between values of the two variables (i.e., the variables are independent). Correlation is merely a mea-sure of association between two variables and does not imply cause and effect.
Other experiments may use similar procedures known as regression analysis to determine treatment differences. The regression coefficient (usually denoted as b) indicates the amount of change in a variable Y for each one unit increase in a variable X. In its simplest form (i.e. linear regression), the regression coefficient is simply the slope of a straight line. A regression equation can be used to predict the value of the dependent variable Y (e.g., performance) given a value of the independent variable X (e.g., treatment). A more complicat-ed procedure, known as multiple regression, can be used to derive an equation that uses several independent variables to predict a single dependent variable. Associated statistics are r2, the simple coefficient of determination, and R2, the multiple coefficient of determination. These statistics indi-cate the proportion of the variation in the dependent vari-able that can be accounted for by the independent variables. Some authors may report the square root of the Mean Square for Error (RMSE) as an estimate of the standard deviation of the dependent variable.
Genetic studies may report estimates of heritability (h2) or genetic correlation (rg). Heritability estimates refer to that portion of the phenotypic variance in a population that is due to heredity. A genetic correlation is a measure of whether or not the same genes are affecting two traits and may vary from –1 to +1.

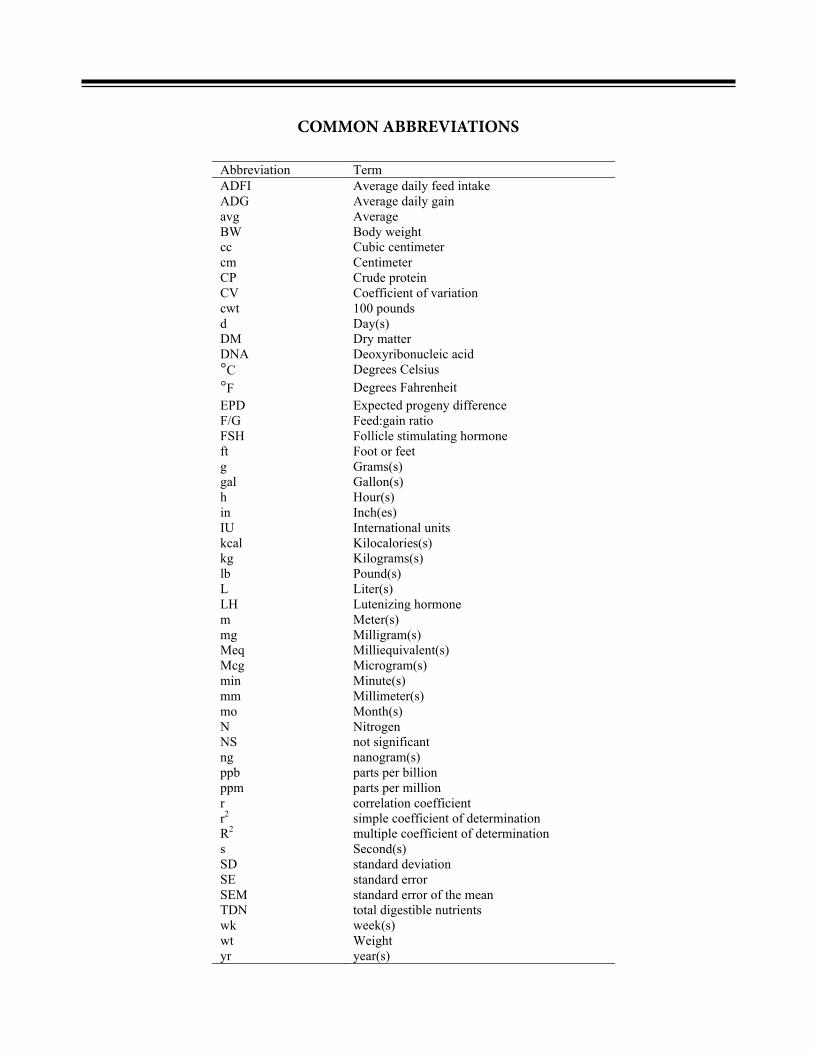
COMMON ABBREVIATIONSCOMMON ABBREVIATIONS
Abbreviation Term
ADFI Average daily feed intake
ADG Average daily gain
avg Average
BW Body weight
cc Cubic centimeter
cm Centimeter
CP Crude protein
CV Coefficient of variation
cwt 100 pounds
d Day(s)
DM Dry matter
DNA Deoxyribonucleic acid
°C Degrees Celsius
°F Degrees Fahrenheit
EPD Expected progeny difference
F/G Feed:gain ratio
FSH Follicle stimulating hormone
ft Foot or feet
g Grams(s)
gal Gallon(s)
h Hour(s)
in Inch(es)
IU International units
kcal Kilocalories(s)
kg Kilograms(s)
lb Pound(s)
L Liter(s)
LH Lutenizing hormone
m Meter(s)
mg Milligram(s)
Meq Milliequivalent(s)
Mcg Microgram(s)
min Minute(s)
mm Millimeter(s)
mo Month(s)
N Nitrogen
NS not significant
ng nanogram(s)
ppb parts per billion
ppm parts per million
r correlation coefficient
r2
simple coefficient of determination
R2
multiple coefficient of determination
s Second(s)
SD standard deviation
SE standard error
SEM standard error of the mean
TDN total digestible nutrients
wk week(s)
wt Weight
yr year(s)
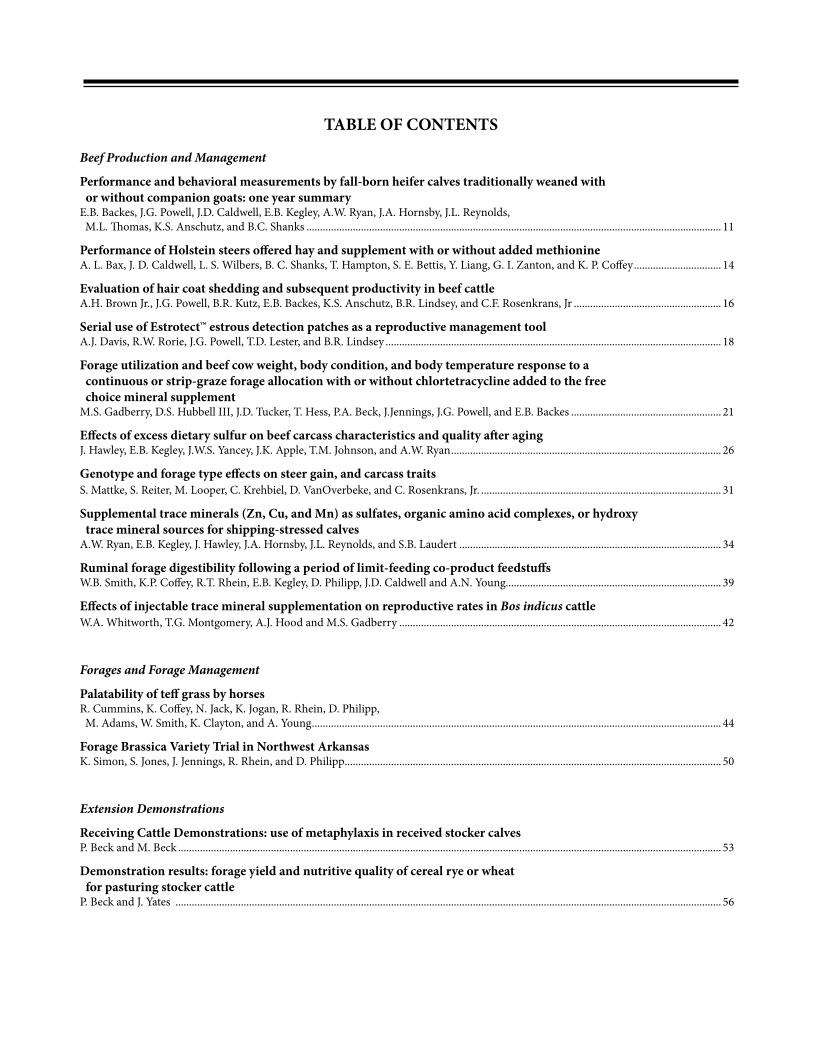
TABLE OF CONTENTS
Beef Production and Management
Performance and behavioral measurements by fall-born heifer calves traditionally weaned with or without companion goats: one year summaryE.B. Backes, J.G. Powell, J.D. Caldwell, E.B. Kegley, A.W. Ryan, J.A. Hornsby, J.L. Reynolds, M.L. Thomas, K.S. Anschutz, and B.C. Shanks ........................................................................................................................................................ 11
Performance of Holstein steers offered hay and supplement with or without added methionineA. L. Bax, J. D. Caldwell, L. S. Wilbers, B. C. Shanks, T. Hampton, S. E. Bettis, Y. Liang, G. I. Zanton, and K. P. Coffey ................................ 14
Evaluation of hair coat shedding and subsequent productivity in beef cattleA.H. Brown Jr., J.G. Powell, B.R. Kutz, E.B. Backes, K.S. Anschutz, B.R. Lindsey, and C.F. Rosenkrans, Jr ...................................................... 16
Serial use of Estrotect™ estrous detection patches as a reproductive management toolA.J. Davis, R.W. Rorie, J.G. Powell, T.D. Lester, and B.R. Lindsey ........................................................................................................................... 18
Forage utilization and beef cow weight, body condition, and body temperature response to a continuous or strip-graze forage allocation with or without chlortetracycline added to the free choice mineral supplementM.S. Gadberry, D.S. Hubbell III, J.D. Tucker, T. Hess, P.A. Beck, J.Jennings, J.G. Powell, and E.B. Backes ....................................................... 21
Effects of excess dietary sulfur on beef carcass characteristics and quality after aging J. Hawley, E.B. Kegley, J.W.S. Yancey, J.K. Apple, T.M. Johnson, and A.W. Ryan ................................................................................................... 26
Genotype and forage type effects on steer gain, and carcass traitsS. Mattke, S. Reiter, M. Looper, C. Krehbiel, D. VanOverbeke, and C. Rosenkrans, Jr. ........................................................................................ 31
Supplemental trace minerals (Zn, Cu, and Mn) as sulfates, organic amino acid complexes, or hydroxy trace mineral sources for shipping-stressed calvesA.W. Ryan, E.B. Kegley, J. Hawley, J.A. Hornsby, J.L. Reynolds, and S.B. Laudert ................................................................................................ 34
Ruminal forage digestibility following a period of limit-feeding co-product feedstuffsW.B. Smith, K.P. Coffey, R.T. Rhein, E.B. Kegley, D. Philipp, J.D. Caldwell and A.N. Young............................................................................... 39
Effects of injectable trace mineral supplementation on reproductive rates in Bos indicus cattleW.A. Whitworth, T.G. Montgomery, A.J. Hood and M.S. Gadberry ...................................................................................................................... 42
Forages and Forage Management
Palatability of teff grass by horsesR. Cummins, K. Coffey, N. Jack, K. Jogan, R. Rhein, D. Philipp, M. Adams, W. Smith, K. Clayton, and A. Young ...................................................................................................................................................... 44
Forage Brassica Variety Trial in Northwest ArkansasK. Simon, S. Jones, J. Jennings, R. Rhein, and D. Philipp .......................................................................................................................................... 50
Extension Demonstrations
Receiving Cattle Demonstrations: use of metaphylaxis in received stocker calves P. Beck and M. Beck ....................................................................................................................................................................................................... 53
Demonstration results: forage yield and nutritive quality of cereal rye or wheat for pasturing stocker cattleP. Beck and J. Yates ........................................................................................................................................................................................................ 56

Meats and Food Safety
Carcass manipulation to improve tenderness in goat meatK.L. Basinger, B.C. Shanks, J.K. Apple, J.D. Caldwell, E.A. Backes, J.J. Hollenbeck, K.R. Ness, J.W.S. Yancey, L.S. Wilbers, and E.L. Farrell .............................................................................................................................................................. 58

11
Introduction
The weaning process is a commonly used practice in the livestock industry. Typically, weaning is an abrupt separation of offspring from dams (Enriques et al., 2011) and weaned calves are placed in a drylot without visual or audible contact with their dams. This separation may expose newly weaned animals to stressors and has been reported to negatively affect animal performance and behavior (Price et al., 2003). Recently, anecdotal claims have reported that placing a companion animal with livestock during the weaning process aids in mitigating negative stressors and ultimately improves animal performance. There- fore, the objective of our study was to evaluate performance and be- havioral measurements by fall-born heifer calves traditionally weaned with or without the presence of companion goats.
Materials and Methods
This project took place at the University of Arkansas’ stocker unit in Savoy, Arkansas. On May 14, 2013, fall-born crossbred heifer calves (n = 69; 416 ± 6.8 lb initial body weight; 233 ± 2.4 days of age) were separated from their dams at approximately 7:30 AM and were weighed, rated for balking (1-5 scale; 1 = none; 5 = intense balk; electric prod 2 or more times required for continued forward motion; modified from Grandin, 1993) and chute scores (1-5 scale; 1 = calm, no movement; 5 = rearing, twisting of the body and struggling violently; Grandin, 1993), and exit velocities (ft/s2; Burrow et al., 1988) were determined. Balking and chute scores and exit velocity were determined as heifer calves proceeded (branded, de-wormed, and vaccinated) through and exited the squeeze chute. Heifers were then placed in holding pens for approximately 1 hour at which time
they were stratified by body weight, age of dam, days of age, and were allocated randomly to 1 of 6 groups representing 1 of 2 weaning treatments: 1) traditionally weaned without companion goats (NG: 3 replications); or 2) traditionally weaned with companion goats (G: 3 replications). Five mature does were placed in each replication of G. Goats and calves used for this study had no previous exposure to the opposite species prior to initiation of the study. Groups of animals were housed in 1-acre grass traps and had ad libitum access to water, salt, and medium quality hay and were offered 2 lb/hd/day of corn gluten supplementation for the 14-day weaning period. Each replication was observed for 10 min at 12, 24, 51, and 72 hours post-weaning to evaluate heifer behavior. Groups were evaluated to determine if individual heifers exhibited any of the following behavior measurements at least once during the observation period: vocalizing, walking rapidly, running quickly throughout the pen, standing, or lying down. Calves could exhibit any or all of the previously mentioned behavior measurements during the 10 min observation; however, they were only recorded once per behavior measurement. Group averages for each behavior measurement were converted to the percentage of heifers that exhibited each behavior measurement by dividing the number of heifers that exhibited that behavior by the total number of heifers in the group and then multiplying by 100. At the end of the 14-day weaning period calves were re-weighed, re-vaccinated, and balking and chute scores, and exit velocities were determined.
Calf performance, balking and chute scores, and exit velocity were analyzed using the PROC MIXED procedure of SAS. Group of animals was considered the experimental unit and sire (pen) was used to remove sire variation. Behavior measurements were analyzed using PROX MIXED for repeated measures of variance. Observation
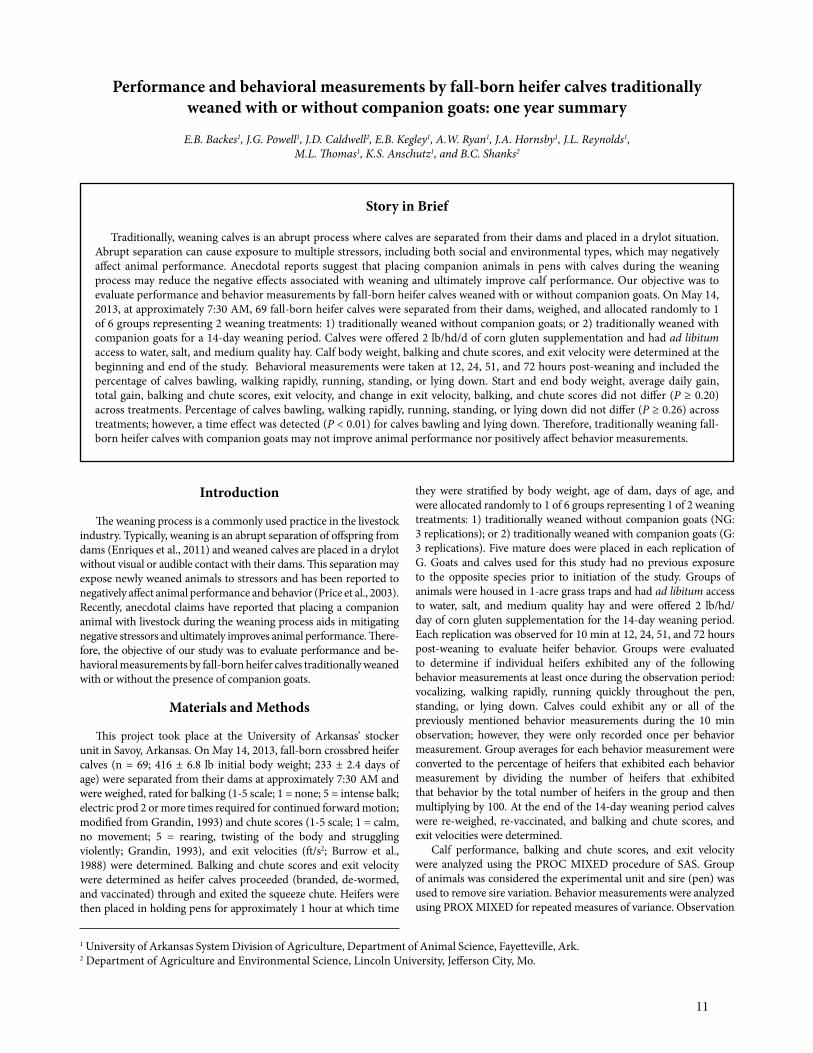
Performance and behavioral measurements by fall-born heifer calves traditionally weaned with or without companion goats: one year summary
E.B. Backes1, J.G. Powell1, J.D. Caldwell2, E.B. Kegley1, A.W. Ryan1, J.A. Hornsby1, J.L. Reynolds1, M.L. Thomas1, K.S. Anschutz1, and B.C. Shanks2
Story in Brief
Traditionally, weaning calves is an abrupt process where calves are separated from their dams and placed in a drylot situation. Abrupt separation can cause exposure to multiple stressors, including both social and environmental types, which may negatively affect animal performance. Anecdotal reports suggest that placing companion animals in pens with calves during the weaning process may reduce the negative effects associated with weaning and ultimately improve calf performance. Our objective was to evaluate performance and behavior measurements by fall-born heifer calves weaned with or without companion goats. On May 14, 2013, at approximately 7:30 AM, 69 fall-born heifer calves were separated from their dams, weighed, and allocated randomly to 1 of 6 groups representing 2 weaning treatments: 1) traditionally weaned without companion goats; or 2) traditionally weaned with companion goats for a 14-day weaning period. Calves were offered 2 lb/hd/d of corn gluten supplementation and had ad libitum access to water, salt, and medium quality hay. Calf body weight, balking and chute scores, and exit velocity were determined at the beginning and end of the study. Behavioral measurements were taken at 12, 24, 51, and 72 hours post-weaning and included the percentage of calves bawling, walking rapidly, running, standing, or lying down. Start and end body weight, average daily gain, total gain, balking and chute scores, exit velocity, and change in exit velocity, balking, and chute scores did not differ (P ≥ 0.20) across treatments. Percentage of calves bawling, walking rapidly, running, standing, or lying down did not differ (P ≥ 0.26) across treatments; however, a time effect was detected (P < 0.01) for calves bawling and lying down. Therefore, traditionally weaning fall-born heifer calves with companion goats may not improve animal performance nor positively affect behavior measurements.
1 University of Arkansas System Division of Agriculture, Department of Animal Science, Fayetteville, Ark.2 Department of Agriculture and Environmental Science, Lincoln University, Jefferson City, Mo.
AAES Research Series 620
12
time was considered the repeated measurement and group of animals was considered the experimental unit. If a treatment × observation time interaction was detected (P ≤ 0.10), mean separations were performed using an F-protected t-test; however if interactions were not detected, they were removed from the model. Treatment means are reported as least squares means. Differences referred to as tendencies are those having a P-value between 0.05 and 0.10.
Results and Discussion
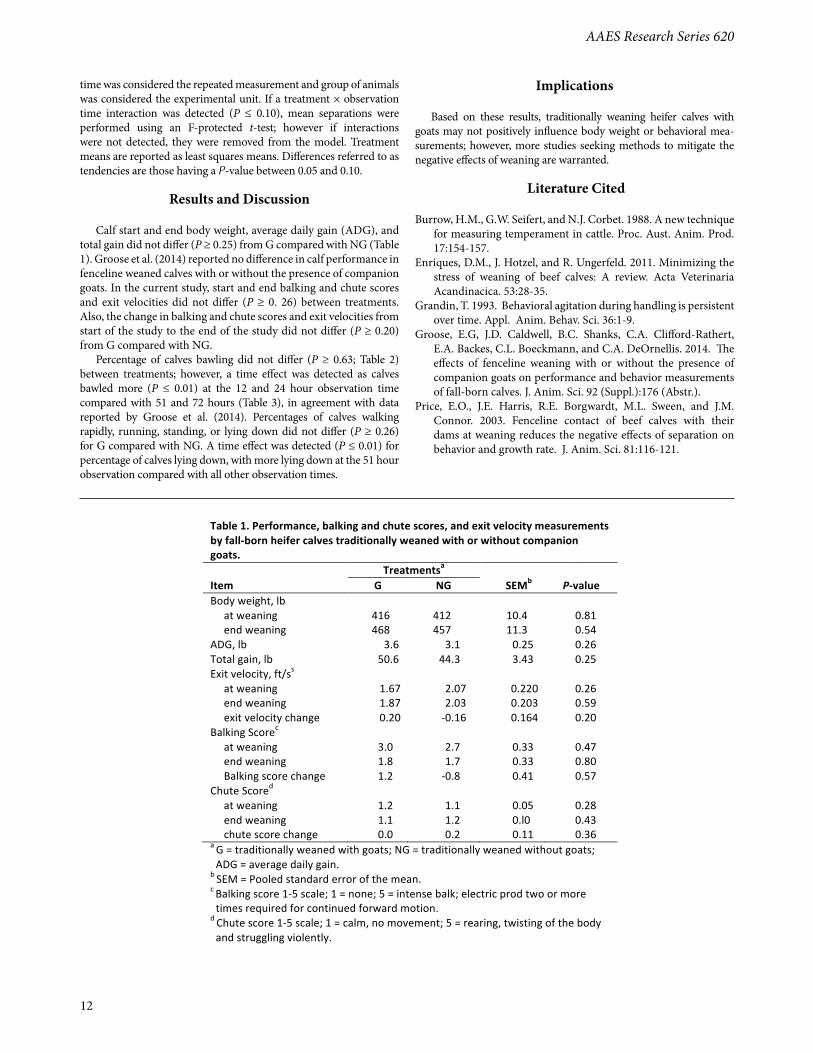
Calf start and end body weight, average daily gain (ADG), and total gain did not differ (P ≥ 0.25) from G compared with NG (Table 1). Groose et al. (2014) reported no difference in calf performance in fenceline weaned calves with or without the presence of companion goats. In the current study, start and end balking and chute scores and exit velocities did not differ (P ≥ 0. 26) between treatments. Also, the change in balking and chute scores and exit velocities from start of the study to the end of the study did not differ (P ≥ 0.20) from G compared with NG.
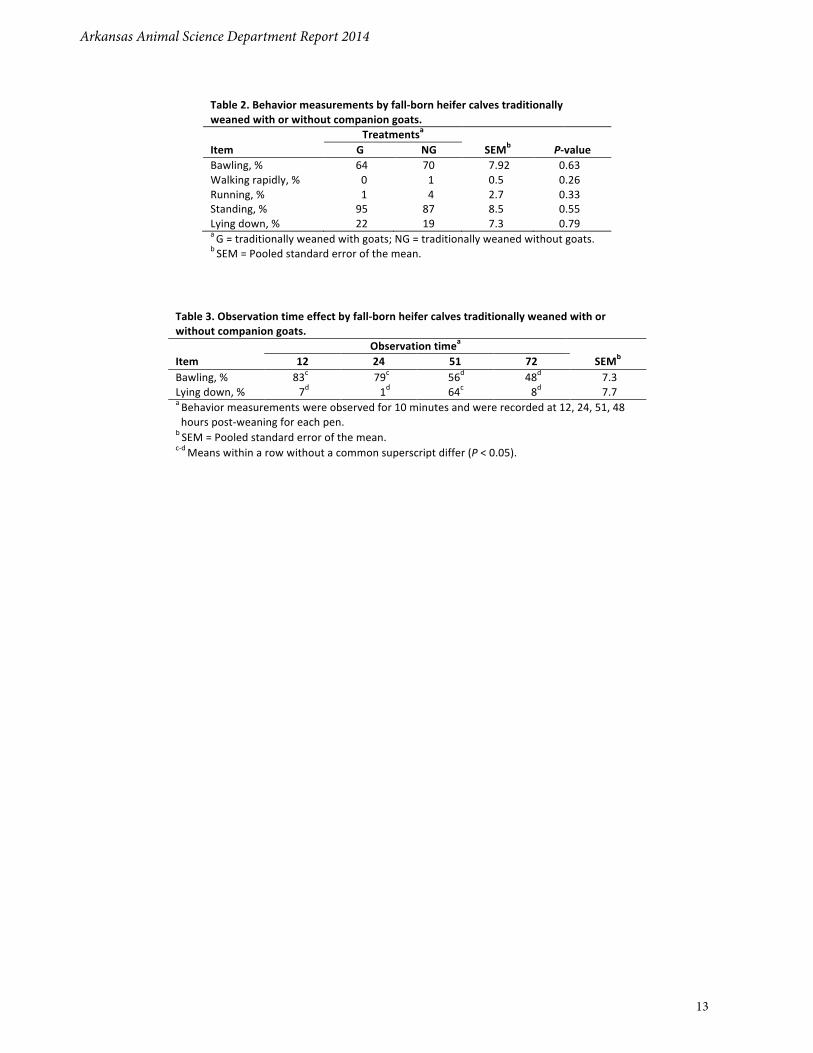
Percentage of calves bawling did not differ (P ≥ 0.63; Table 2) between treatments; however, a time effect was detected as calves bawled more (P ≤ 0.01) at the 12 and 24 hour observation time compared with 51 and 72 hours (Table 3), in agreement with data reported by Groose et al. (2014). Percentages of calves walking rapidly, running, standing, or lying down did not differ (P ≥ 0.26) for G compared with NG. A time effect was detected (P ≤ 0.01) for percentage of calves lying down, with more lying down at the 51 hour observation compared with all other observation times.
Implications
Based on these results, traditionally weaning heifer calves with goats may not positively influence body weight or behavioral mea-surements; however, more studies seeking methods to mitigate the negative effects of weaning are warranted.
Literature Cited
Burrow, H.M., G.W. Seifert, and N.J. Corbet. 1988. A new technique for measuring temperament in cattle. Proc. Aust. Anim. Prod. 17:154-157.
Enriques, D.M., J. Hotzel, and R. Ungerfeld. 2011. Minimizing the stress of weaning of beef calves: A review. Acta Veterinaria Acandinacica. 53:28-35.
Grandin, T. 1993. Behavioral agitation during handling is persistent over time. Appl. Anim. Behav. Sci. 36:1-9.
Groose, E.G, J.D. Caldwell, B.C. Shanks, C.A. Clifford-Rathert, E.A. Backes, C.L. Boeckmann, and C.A. DeOrnellis. 2014. The effects of fenceline weaning with or without the presence of companion goats on performance and behavior measurements of fall-born calves. J. Anim. Sci. 92 (Suppl.):176 (Abstr.).
Price, E.O., J.E. Harris, R.E. Borgwardt, M.L. Sween, and J.M. Connor. 2003. Fenceline contact of beef calves with their dams at weaning reduces the negative effects of separation on behavior and growth rate. J. Anim. Sci. 81:116-121.
Table 1. Performance, balking and chute scores, and exit velocity measurements by fall-‐born heifer calves traditionally weaned with or without companion goats. Treatmentsa Item G NG SEMb P-‐value Body weight, lb at weaning 416 412 10.4 0.81 end weaning 468 457 11.3 0.54 ADG, lb 3.6 3.1 0.25 0.26 Total gain, lb 50.6 44.3 3.43 0.25 Exit velocity, ft/ss at weaning 1.67 2.07 0.220 0.26 end weaning 1.87 2.03 0.203 0.59 exit velocity change 0.20 -‐0.16 0.164 0.20 Balking Scorec at weaning 3.0 2.7 0.33 0.47 end weaning 1.8 1.7 0.33 0.80 Balking score change 1.2 -‐0.8 0.41 0.57 Chute Scored at weaning 1.2 1.1 0.05 0.28 end weaning 1.1 1.2 0.l0 0.43 chute score change 0.0 0.2 0.11 0.36 a G = traditionally weaned with goats; NG = traditionally weaned without goats; ADG = average daily gain. b SEM = Pooled standard error of the mean. c Balking score 1-‐5 scale; 1 = none; 5 = intense balk; electric prod two or more times required for continued forward motion. d Chute score 1-‐5 scale; 1 = calm, no movement; 5 = rearing, twisting of the body and struggling violently.
Arkansas Animal Science Department Report 2014
13
Table 2. Behavior measurements by fall-‐born heifer calves traditionally weaned with or without companion goats. Treatmentsa Item G NG SEMb P-‐value Bawling, % 64 70 7.92 0.63 Walking rapidly, % 0 1 0.5 0.26 Running, % 1 4 2.7 0.33 Standing, % 95 87 8.5 0.55 Lying down, % 22 19 7.3 0.79 a G = traditionally weaned with goats; NG = traditionally weaned without goats. b SEM = Pooled standard error of the mean.
Table 3. Observation time effect by fall-‐born heifer calves traditionally weaned with or without companion goats.
Observation timea
Item 12 24 51 72 SEMb Bawling, % 83c 79c 56d 48d 7.3 Lying down, % 7d 1d 64c 8d 7.7 a Behavior measurements were observed for 10 minutes and were recorded at 12, 24, 51, 48 hours post-‐weaning for each pen. b SEM = Pooled standard error of the mean. c-‐d Means within a row without a common superscript differ (P < 0.05).
14
Introduction
Performance limiting amino acids of growing cattle have not been well defined and methionine supplementation has shown mixed results. The addition of methionine to medium and low quality forage based diets in cattle has been shown to increase urea utilization in the rumen. Because microbial protein is the predominant metabolizable protein source in forage-fed ruminants, methionine would be expected to be the first limiting amino acid in grazing or hay fed cattle (Hersom et al., 2009). As a result of increased microbial activity, diet digestibility is increased which may result in an increase in forage intake and average daily gain (Momont et al., 1993). Therefore, the objective of this study was to evaluate steer performance when offered medium quality hay and a supplement with and without added methionine as MFP™.
Materials and Methods
This study was conducted at the Green Acres Farm in Montgomery City, Mo. On October 24, 2013, a total of 90 (507 ± 1lb body weight) Holstein steers were stratified by body weight within 5 blocks and were allocated randomly to 1 of 2 treatments: 1) control supplement (C; 15 replications) or control supplement plus MFP™ (15 replications). Each replication had access to a 1-acre alfalfa, brome, and orchardgrass pasture. Pastures were evaluated using rising disk meters and were found to have limited available forage for grazing; therefore, each replication was offered ad libitum access to medium quality hay. Hay bales were weighed at the beginning of the trial and number of bales offered per replication was recorded. A pelleted supplement based on soybean hulls and
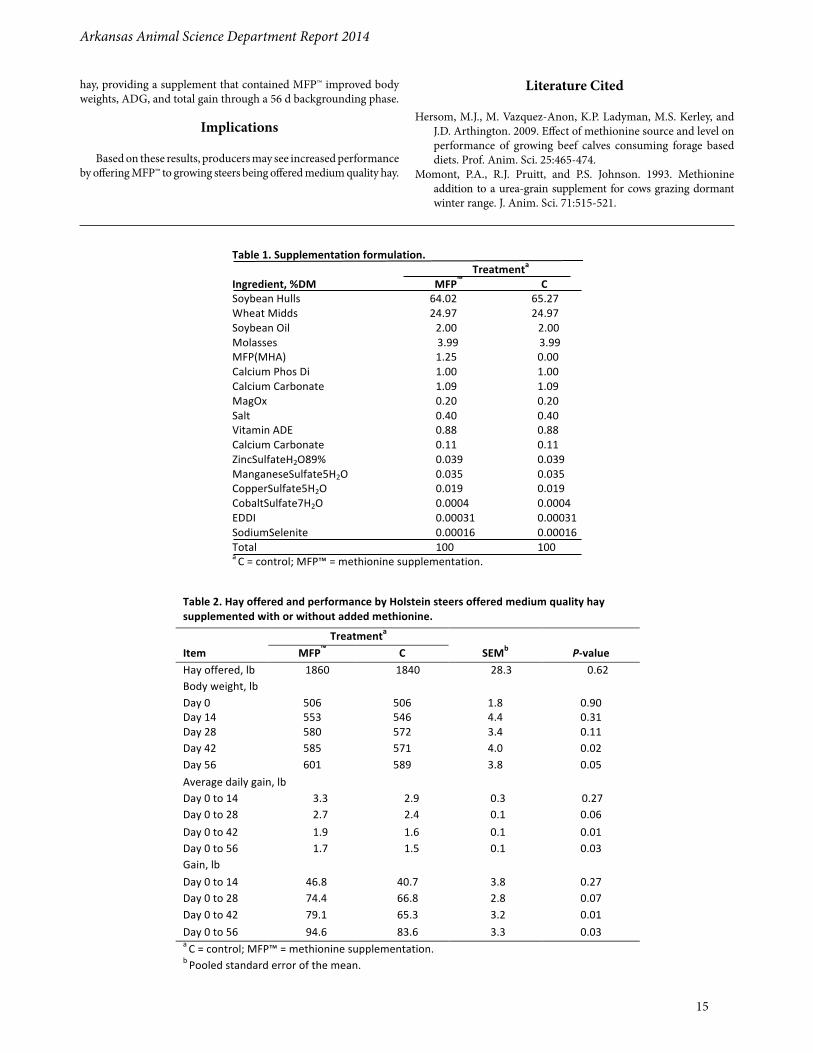
wheat middlings, was offered daily at 8:00 AM at 0.5% of body weight for each replication; in addition, the supplement contained minerals, and vitamins (Table 1). Treatment was provided at 1.17% of supplement dry matter (DM) resulting in an average intake of approximately 13.5 g/d of MFP™.
Steers were weighed every 14 days for the duration of the 56 day study. The amount of supplement offered was adjusted every 14 days to maintain 0.5% of body weight for each replication. Steers were also offered ad libitum access to water and shelter. Performance measurements were analyzed using PROC MIXED of SAS, with pasture or group of animals as the experimental unit. All data are reported as least squares means.
Results and Discussion
Hay offered did not differ (P = 0.62) across treatments (Table 2). Calf body weight at day 14 and day 28 did not differ (P ≥ 0.11) between treatments, but day 42 and day 56 body weights were greater (P ≤ 0.05) for MFP™ compared with C (Table 2). Average daily gain (ADG) and gain at day 14 did not differ (P ≥ 0.27) between treatments. However, day 28 ADG and gain tended (P ≤ 0.07) to be greater from MFP™ compared with C and were greater (P ≤ 0.03) at day 42 and day 56 from MFP™ compared with C. Through 56 days, steers offered MFP™ gained 11 lb more body weight than steers offered C. In contrast to our study, cows grazing dormant winter range pasture from mid-November to mid-February and supplemented with a corn-soybean meal based diet plus unprotected DL-methionine and urea lost approximately 29 lb more compared with cows on the same basal diet plus urea and sodium sulfate (Momont et al., 1993). Therefore, in steers offered medium quality
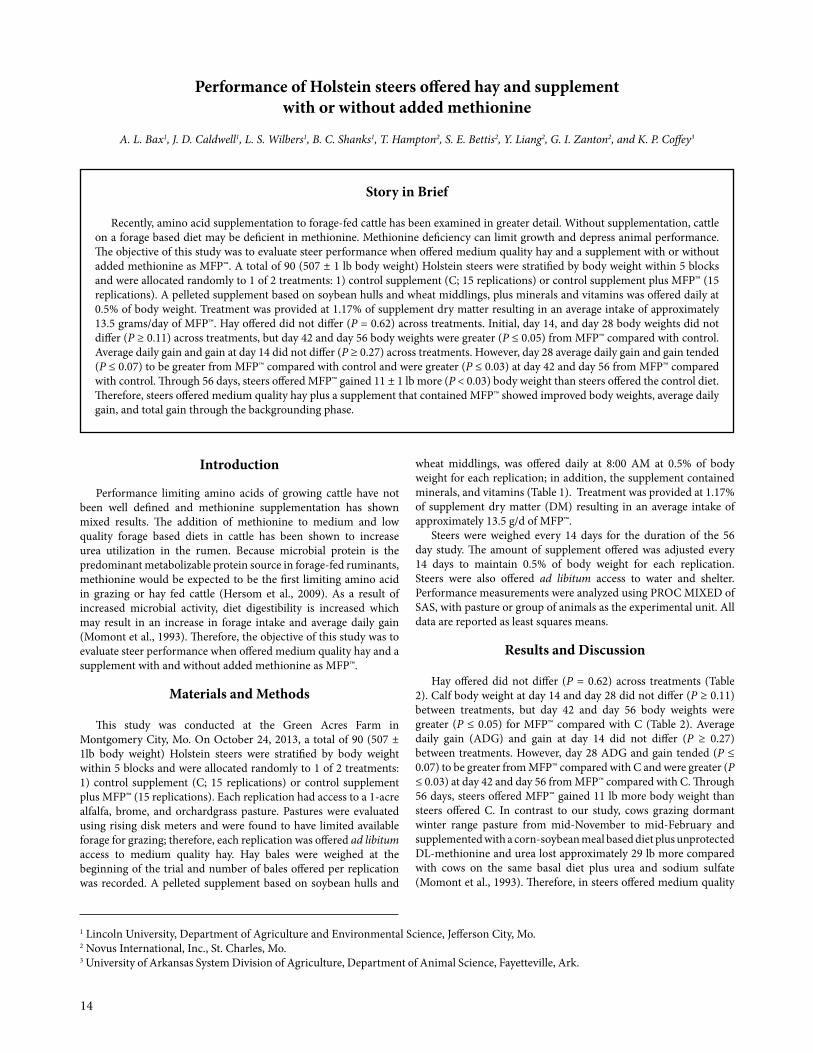
Performance of Holstein steers offered hay and supplement with or without added methionine
A. L. Bax1, J. D. Caldwell1, L. S. Wilbers1, B. C. Shanks1, T. Hampton2, S. E. Bettis2, Y. Liang2, G. I. Zanton2, and K. P. Coffey3
Story in Brief
Recently, amino acid supplementation to forage-fed cattle has been examined in greater detail. Without supplementation, cattle on a forage based diet may be deficient in methionine. Methionine deficiency can limit growth and depress animal performance. The objective of this study was to evaluate steer performance when offered medium quality hay and a supplement with or without added methionine as MFP™. A total of 90 (507 ± 1 lb body weight) Holstein steers were stratified by body weight within 5 blocks and were allocated randomly to 1 of 2 treatments: 1) control supplement (C; 15 replications) or control supplement plus MFP™ (15 replications). A pelleted supplement based on soybean hulls and wheat middlings, plus minerals and vitamins was offered daily at 0.5% of body weight. Treatment was provided at 1.17% of supplement dry matter resulting in an average intake of approximately 13.5 grams/day of MFP™. Hay offered did not differ (P = 0.62) across treatments. Initial, day 14, and day 28 body weights did not differ (P ≥ 0.11) across treatments, but day 42 and day 56 body weights were greater (P ≤ 0.05) from MFP™ compared with control. Average daily gain and gain at day 14 did not differ (P ≥ 0.27) across treatments. However, day 28 average daily gain and gain tended (P ≤ 0.07) to be greater from MFP™ compared with control and were greater (P ≤ 0.03) at day 42 and day 56 from MFP™ compared with control. Through 56 days, steers offered MFP™ gained 11 ± 1 lb more (P < 0.03) body weight than steers offered the control diet. Therefore, steers offered medium quality hay plus a supplement that contained MFP™ showed improved body weights, average daily gain, and total gain through the backgrounding phase.
1 Lincoln University, Department of Agriculture and Environmental Science, Jefferson City, Mo.2 Novus International, Inc., St. Charles, Mo. 3 University of Arkansas System Division of Agriculture, Department of Animal Science, Fayetteville, Ark.
Arkansas Animal Science Department Report 2014
15
hay, providing a supplement that contained MFP™ improved body weights, ADG, and total gain through a 56 d backgrounding phase.
Implications
Based on these results, producers may see increased performance by offering MFP™ to growing steers being offered medium quality hay.
Literature Cited
Hersom, M.J., M. Vazquez-Anon, K.P. Ladyman, M.S. Kerley, and J.D. Arthington. 2009. Effect of methionine source and level on performance of growing beef calves consuming forage based diets. Prof. Anim. Sci. 25:465-474.
Momont, P.A., R.J. Pruitt, and P.S. Johnson. 1993. Methionine addition to a urea-grain supplement for cows grazing dormant winter range. J. Anim. Sci. 71:515-521.
Table 1. Supplementation formulation. Treatmenta Ingredient, %DM MFP™ C Soybean Hulls 64.02 65.27 Wheat Midds 24.97 24.97 Soybean Oil 2.00 2.00 Molasses 3.99 3.99 MFP(MHA) 1.25 0.00 Calcium Phos Di 1.00 1.00 Calcium Carbonate 1.09 1.09 MagOx 0.20 0.20 Salt 0.40 0.40 Vitamin ADE 0.88 0.88 Calcium Carbonate 0.11 0.11 ZincSulfateH2O89% 0.039 0.039 ManganeseSulfate5H2O 0.035 0.035 CopperSulfate5H2O 0.019 0.019 CobaltSulfate7H2O 0.0004 0.0004 EDDI 0.00031 0.00031 SodiumSelenite 0.00016 0.00016 Total 100 100 a C = control; MFP™ = methionine supplementation.
Table 2. Hay offered and performance by Holstein steers offered medium quality hay supplemented with or without added methionine.
Treatmenta Item MFP™ C SEMb P-‐value Hay offered, lb 1860 1840 28.3 0.62 Body weight, lb Day 0 Day 14
506 553
506 546
1.8 4.4
0.90 0.31
Day 28 580 572 3.4 0.11 Day 42 585 571 4.0 0.02 Day 56 601 589 3.8 0.05 Average daily gain, lb Day 0 to 14 3.3 2.9 0.3 0.27 Day 0 to 28 2.7 2.4 0.1 0.06 Day 0 to 42 1.9 1.6 0.1 0.01 Day 0 to 56 1.7 1.5 0.1 0.03 Gain, lb Day 0 to 14 46.8 40.7 3.8 0.27 Day 0 to 28 74.4 66.8 2.8 0.07 Day 0 to 42 79.1 65.3 3.2 0.01 Day 0 to 56 94.6 83.6 3.3 0.03 a C = control; MFP™ = methionine supplementation. b Pooled standard error of the mean.
16
Introduction
Cattle in the southeastern United States must endure heat stress due to the warm environmental temperatures. Heat stress can effect production traits in cattle such as fertility, growth and milk production (Bellows, 2002; Bilby et al., 2008). Long winter hair coats help to maintain a high core body temperature; however, as environmental temperatures increase through summer months, cattle with thick, wooly coats suffer with heat stress. In the southeastern U.S., cattle that do not shed their winter coat efficiently exhibit signs of impaired production traits such as reduced calf weaning weights (Gray et al., 2011).
The objectives of this study were to: (1) evaluate hair coat shedding on the cowherd located at the University of Arkansas beef research unit near Fayetteville; (2) determine if any relationship existed between hair coat shedding and cowherd production parameters.
Material and Methods
Cattle utilized for the study were located at the University of Arkansas’ beef cattle research unit. The herd was comprised of Angus-based commercial cows and heifers that calved from September to November and weaned their calves in May. Observations were made on the study animals from February through September of 2011, 2012 and 2013. Cows ranged in ages from 2 to 16 years of age. Objective measurements collected included cow age, calving date, calf birth weight, calf weaning weight, cow body weight at weaning, body condition score (BCS; Richards et al., 1986) at weaning, cow body weight at pre-breeding, BCS at pre-breeding, artificial insemi-nation (AI) pregnancy rate and overall seasonal pregnancy rate.
Hair shedding scores were collected monthly by two university personnel based on a 1 to 5 coat shedding scale adapted from Gray et al. (2011). The hair coat shedding scale was defined as a 5 = full winter coat, 4 = coat exhibits initial shedding (approximately 25%), 3 = coat halfway shed (approximately 50%), 2 = coat is mostly shed (approximately 75%) and 1 = winter coat completely shed. Month of first shedding (MFS) was defined as the first month a cow’s hair coat was scored a 3 or less (at least 50% shed). For each cow, association between MFS and objective measures (weights, BCS, pregnancy status, etc.) were analyzed utilizing the FREQ and GLM procedures of SAS (SAS Inst. Inc., Cary, N.C.). Calf birth weights and calf weaning weights were adjusted according to Beef Improvement Federation standards for age of cow and gender of calf. Statistical significance was considered for a P-value of less than or equal to 0.05.
Results and Discussion
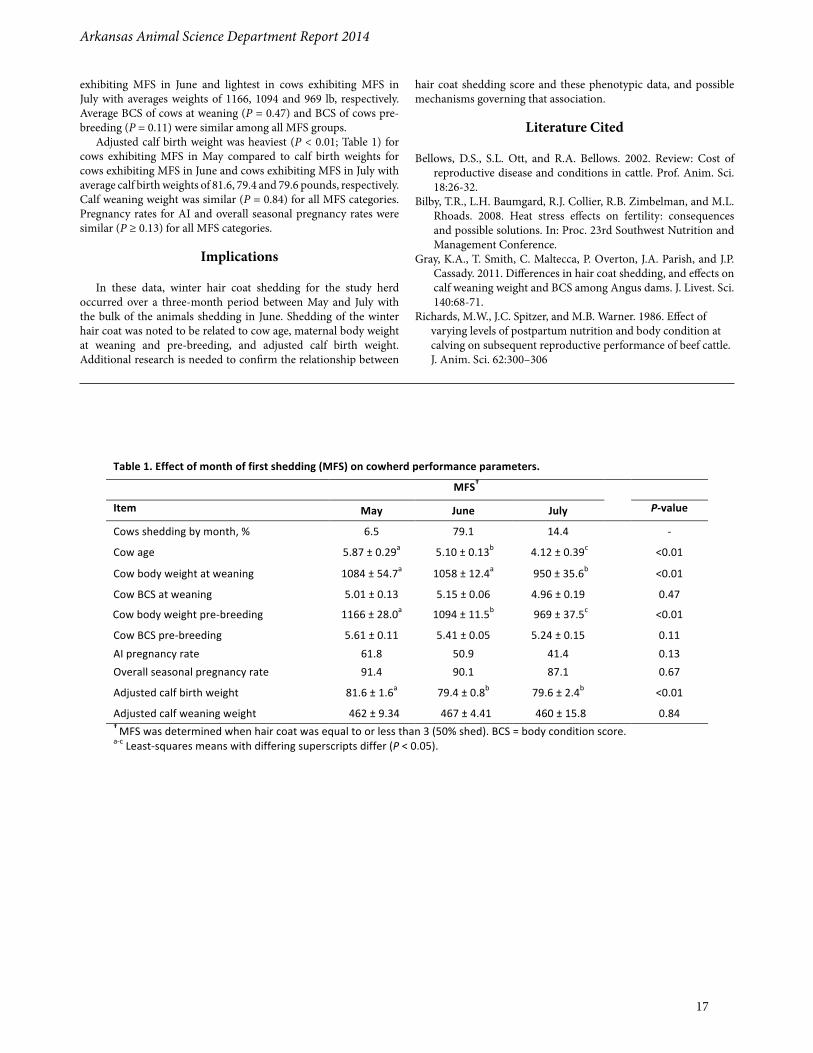
During the spring and early summer months, month of first shedding (MFS) for cattle hair coats were observed. The three months most frequently observed for MFS were May, June and July. Table 1 displays growth and performance data related to these three levels of observed MFS. Frequency of hair coat shedding was highest for June, intermediate for July and lowest for May.
Data indicated a significant relationship (P < 0.01) among cow age and MFS. Average age of cows reaching MFS was 5.87, 5.1, and 4.12 years for May, June, and July, respectively. Cow body weight (BW) at weaning was heaviest (P = 0.01) in cows exhibiting MFS in May and June (1084 and 1058 lb, respectively) and lightest in cows with MFS in June (950 lb). Cow BW pre-breeding was heaviest (P = 0.34) in cows exhibiting MFS in May, intermediate in cows
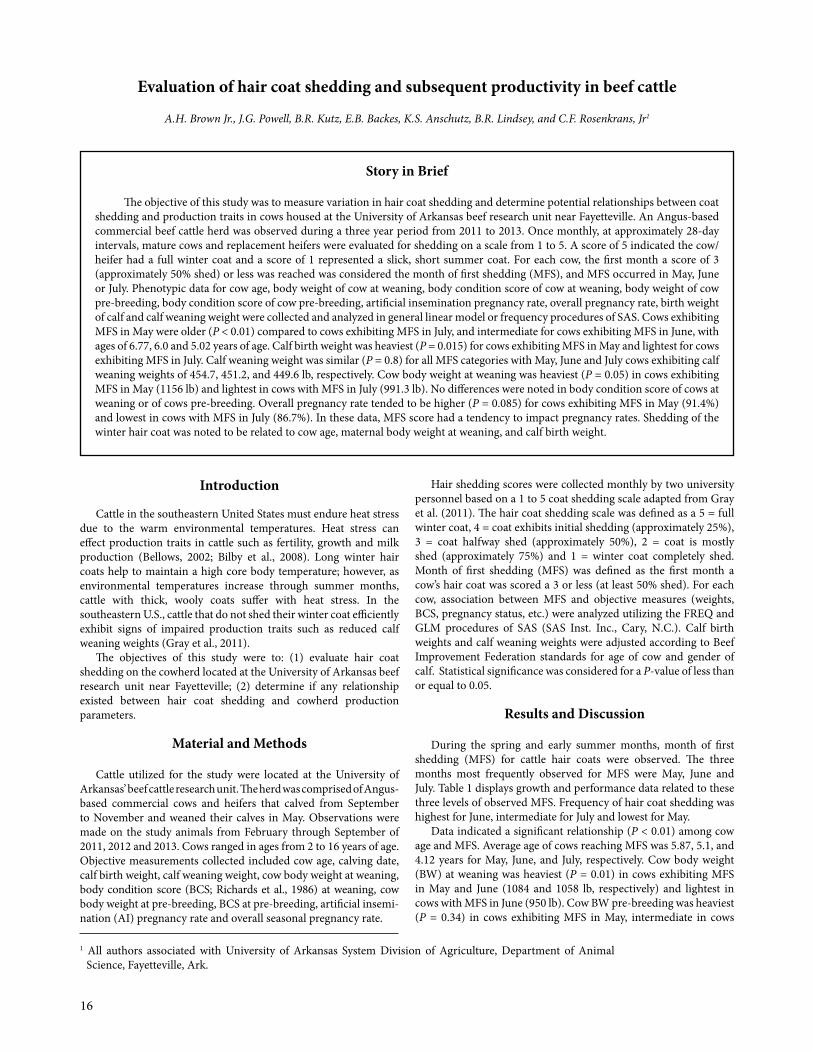
Evaluation of hair coat shedding and subsequent productivity in beef cattle
A.H. Brown Jr., J.G. Powell, B.R. Kutz, E.B. Backes, K.S. Anschutz, B.R. Lindsey, and C.F. Rosenkrans, Jr1
Story in Brief
The objective of this study was to measure variation in hair coat shedding and determine potential relationships between coat shedding and production traits in cows housed at the University of Arkansas beef research unit near Fayetteville. An Angus-based commercial beef cattle herd was observed during a three year period from 2011 to 2013. Once monthly, at approximately 28-day intervals, mature cows and replacement heifers were evaluated for shedding on a scale from 1 to 5. A score of 5 indicated the cow/heifer had a full winter coat and a score of 1 represented a slick, short summer coat. For each cow, the first month a score of 3 (approximately 50% shed) or less was reached was considered the month of first shedding (MFS), and MFS occurred in May, June or July. Phenotypic data for cow age, body weight of cow at weaning, body condition score of cow at weaning, body weight of cow pre-breeding, body condition score of cow pre-breeding, artificial insemination pregnancy rate, overall pregnancy rate, birth weight of calf and calf weaning weight were collected and analyzed in general linear model or frequency procedures of SAS. Cows exhibiting MFS in May were older (P < 0.01) compared to cows exhibiting MFS in July, and intermediate for cows exhibiting MFS in June, with ages of 6.77, 6.0 and 5.02 years of age. Calf birth weight was heaviest (P = 0.015) for cows exhibiting MFS in May and lightest for cows exhibiting MFS in July. Calf weaning weight was similar (P = 0.8) for all MFS categories with May, June and July cows exhibiting calf weaning weights of 454.7, 451.2, and 449.6 lb, respectively. Cow body weight at weaning was heaviest (P = 0.05) in cows exhibiting MFS in May (1156 lb) and lightest in cows with MFS in July (991.3 lb). No differences were noted in body condition score of cows at weaning or of cows pre-breeding. Overall pregnancy rate tended to be higher (P = 0.085) for cows exhibiting MFS in May (91.4%) and lowest in cows with MFS in July (86.7%). In these data, MFS score had a tendency to impact pregnancy rates. Shedding of the winter hair coat was noted to be related to cow age, maternal body weight at weaning, and calf birth weight.
1 All authors associated with University of Arkansas System Division of Agriculture, Department of Animal Science, Fayetteville, Ark.
Arkansas Animal Science Department Report 2014
17
Table 1. Effect of month of first shedding (MFS) on cowherd performance parameters.
MFS†
Item May June July P-‐value
Cows shedding by month, % 6.5 79.1 14.4 -‐
Cow age 5.87 ± 0.29a 5.10 ± 0.13b 4.12 ± 0.39c <0.01
Cow body weight at weaning 1084 ± 54.7a 1058 ± 12.4a 950 ± 35.6b <0.01
Cow BCS at weaning 5.01 ± 0.13 5.15 ± 0.06 4.96 ± 0.19 0.47
Cow body weight pre-‐breeding 1166 ± 28.0a 1094 ± 11.5b 969 ± 37.5c <0.01
Cow BCS pre-‐breeding 5.61 ± 0.11 5.41 ± 0.05 5.24 ± 0.15 0.11 AI pregnancy rate 61.8 50.9 41.4 0.13 Overall seasonal pregnancy rate 91.4 90.1 87.1 0.67
Adjusted calf birth weight 81.6 ± 1.6a 79.4 ± 0.8b 79.6 ± 2.4b <0.01
Adjusted calf weaning weight 462 ± 9.34 467 ± 4.41 460 ± 15.8 0.84 † MFS was determined when hair coat was equal to or less than 3 (50% shed). BCS = body condition score. a-‐c Least-‐squares means with differing superscripts differ (P < 0.05).
exhibiting MFS in June and lightest in cows exhibiting MFS in July with averages weights of 1166, 1094 and 969 lb, respectively. Average BCS of cows at weaning (P = 0.47) and BCS of cows pre-breeding (P = 0.11) were similar among all MFS groups.
Adjusted calf birth weight was heaviest (P < 0.01; Table 1) for cows exhibiting MFS in May compared to calf birth weights for cows exhibiting MFS in June and cows exhibiting MFS in July with average calf birth weights of 81.6, 79.4 and 79.6 pounds, respectively. Calf weaning weight was similar (P = 0.84) for all MFS categories. Pregnancy rates for AI and overall seasonal pregnancy rates were similar (P ≥ 0.13) for all MFS categories.
Implications
In these data, winter hair coat shedding for the study herd occurred over a three-month period between May and July with the bulk of the animals shedding in June. Shedding of the winter hair coat was noted to be related to cow age, maternal body weight at weaning and pre-breeding, and adjusted calf birth weight. Additional research is needed to confirm the relationship between
hair coat shedding score and these phenotypic data, and possible mechanisms governing that association.
Literature Cited
Bellows, D.S., S.L. Ott, and R.A. Bellows. 2002. Review: Cost of reproductive disease and conditions in cattle. Prof. Anim. Sci. 18:26-32.
Bilby, T.R., L.H. Baumgard, R.J. Collier, R.B. Zimbelman, and M.L. Rhoads. 2008. Heat stress effects on fertility: consequences and possible solutions. In: Proc. 23rd Southwest Nutrition and Management Conference.
Gray, K.A., T. Smith, C. Maltecca, P. Overton, J.A. Parish, and J.P. Cassady. 2011. Differences in hair coat shedding, and effects on calf weaning weight and BCS among Angus dams. J. Livest. Sci. 140:68-71.
Richards, M.W., J.C. Spitzer, and M.B. Warner. 1986. Effect ofvarying levels of postpartum nutrition and body condition atcalving on subsequent reproductive performance of beef cattle.J. Anim. Sci. 62:300–306
18
Introduction
Reproductive management is the most important factor con- tributing to the economic success of beef producers (Trenkle and Willham, 1977). Unfortunately, many small family-owned operations underutilize practices such as reproductive tract scoring of heifers, pre-breeding evaluation of cows, estrous synchronization, artificial insemination (AI) and pregnancy detection (USDA NAHMS, 1994). Beef producers would be more likely to utilize such reproductive management practices if their application were more practical, in- expensive and easy to use. Basic reproductive management could be achieved by the serial use of estrous detection patches for: 1) identification of cyclic animals before the breeding season, 2) de-tection of estrus before insemination, 3) distinguishing between cows or heifers conceiving to AI versus the herd bull and, 4) de-termining the seasonal pregnancy rate after bull removal. Therefore, the objective of this study was to evaluate effectiveness of a simple, cost effective reproductive management tool, based on estrous detection patches.
Material and Methods
Angus based heifers (n = 81) and cows (n = 149) from the University of Arkansas Savoy Beef Research Station were used in this study. Thirty days before the start of the breeding season, transrectal ultrasonography was used to reproductive tract score (Pence et al., 1999) each heifer, as an indicator of reproductive cyclicity status. At the time of ultrasonography, each heifer received an Estrotect™ estrous detection patch (Estrotect™; Rockway Inc., Spring Valley, Wis.) to be worn for a 4-week period. Hair was clipped in the area where the patch was to be placed on the rump, sprayed with a multipurpose spray adhesive (3M Super 77 Spray Adhesive), and allowed 30 to 45 seconds for the adhesive to get “tacky”. Patches were then placed on the rump with the front edge of the patch in line with the hipbones.
For consistency, the same person individually evaluated patches
weekly for 4 weeks. An estrous detection patch was considered activated when a minimum of 50% of the center portion of the patch was completely clean. Patches with minor wear due to scratching or environmental conditions were considered non-activated. Any estrous detection patches missing or torn loose were noted. After the 4-week evaluation period, accuracy of estrous detection patch data was compared to known cyclic status, as determined by ultrasound.
Estrus of cows and heifers was synchronized using a modified 14-day progesterone protocol (Powell, et al., 2011). Briefly, all heifers and cows received an intravaginal progesterone controlled internal drug release (CIDR) insert on day 0. The CIDR was removed on day 14, followed by administration of gonadotropin releasing hormone within 24 h of CIDR removal, and prostaglandin F2α (PGF) a week later. All heifers and cows received an Estrotect™ estrous detection patch at the time of PGF treatment and were monitored for onset of estrus every 2 h from 8:00 a.m. until 8:00 p.m., then at 12:00 and 4:00 a.m., over a 72-h period. Cows and heifers observed in estrus were inseminated with conventional semen approximately 12 h after detected estrus. Ten days after the last insemination, cows and heifers received another estrous detection patch and were turned out with bulls for a 45-day breeding season. Estrous detection patches were evaluated weekly for 4-weeks. Approximately 45 days after the last insemination, ultrasonography was used to determine AI pregnancy status.
Upon bull removal at the end of the breeding season, all cows and heifers received another estrous detection patch that was scored weekly for 4-weeks. Approximately 30 days after bull removal ultra-sonography was used to determine seasonal pregnancy rate and con- firm conception date, based on fetal crown to rump length. Estrous detection patch data were compared with actual pregnancy data, as determined by ultrasonography. Statistical analysis was performed using Chi-square analysis, comparing ultrasound data with estrous detection patch scores collected the 4th week of each evaluation period to determine the accuracy of predicting pre-breeding cycling status in heifers, and AI and seasonal pregnancy rates in heifers and cows.
Serial use of Estrotect™ estrous detection patches as a reproductive management tool
A.J. Davis, R.W. Rorie, J.G. Powell, T.D. Lester, and B.R. Lindsey1
Story in Brief
Estrous detection patches are routinely used as an aid for detection of estrus before artificial insemination (AI). This study was conducted to determine if Estrotect™ estrous detection patches also could be used as a basic reproductive management tool to identify cyclic animals before breeding, to distinguish between cows or heifers conceiving to AI versus the herd bull, and to determine seasonal pregnancy rate after bull removal. When worn for a four-week period, patches were 79% and 86% accurate in identifying cyclic and non-cyclic heifers respectively, prior to breeding, and over 95% accurate in identifying pregnant cows and heifers after insemination. Estrotect™ estrous detection patches were 76% and 87% accurate in identifying pregnant heifers and cows respectively, after the breeding season. The predictive accuracy of the patches is dependent on normal cyclicity of the monitored animals. Although estrous detection patches can give producers peace of mind regarding the reproductive status of their herd, palpation or ultrasound approximately 45 to 60 days after the end of the breeding season remains the preferred method for pregnancy determination.
1 All authors affiliated with the University of Arkansas System Division of Agriculture, Department of Animal Science, Fayetteville, Ark.
Arkansas Animal Science Department Report 2014
19
Results and Discussion
Reproductive management is the single most important factor contributing to the economic success of beef production, but is underutilized by many producers. The purpose of this study was to determine if estrous detection patches could be used to implement reproductive management practices in a manner that is practical, inexpensive and easy to use. Estrotect™ estrous detection patches were used to monitor heifers for cyclicity before the start of the breeding season, for detection of estrus before insemination, to differentiate between animals bred by AI versus clean-up bulls, and to determine seasonal pregnancy rates at a cost of about 6 dollars per head.
Heifers. Of the 81 heifers used in this study, reproductive tract scoring (ultrasonography) identified 53 heifers as cyclic and 28 heifers as non-cyclic prior to start of the breeding season. In comparison, 42 of 53 (79.3%) of the cyclic heifers were correctly identified based on activated estrous detection patches. Of the 28 non-cyclic heifers, 24 (85.7%) were correctly identified, based on non-activated patches. In an effort to keep the estrous detection patches on the heifers for at least 28 days, and to reduce the chance of incidental patch activation, the patches were placed further up on the rump of heifers as compared to the typical placement about mid way between the hips and tail head. Patch placement further up the back may have reduced the activation rate, especially on larger, cyclic heifers.
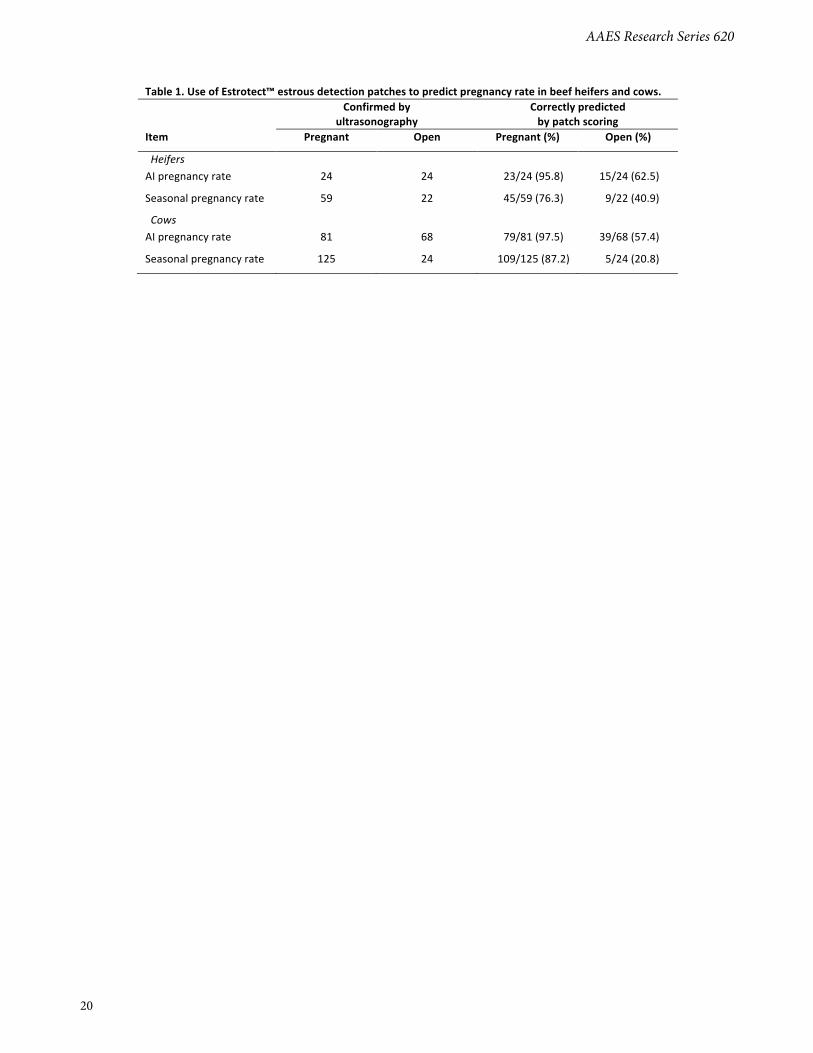
Estrotect™ estrous detection patches were used as an aid in estrous detection before AI. All heifers with fully activated patches were also observed in estrus. Forty-eight heifers were detected in estrus and artificially inseminated. Ultrasonography confirmed that 24 heifers were pregnant after insemination (Table 1). The estrous detection patches correctly identified 23 of 24 (95.8%) pregnant heifers. However, only 15 of 24 (62.5%) of the heifers identified as open after insemination were correctly identified by the estrous detection patches. Failure to detect more open heifers could have been due to detection patch placement as described above. Upon removal of bulls at the end of the breeding season, all heifers received another estrous detection patch to determine seasonal pregnancy rates based on those animals returning to estrus. Ultrasonography confirmed that 59 of 81 heifers were pregnant at the end of the breeding season. Three heifers were noted to have lost their estrous detection patch, 2 of which were pregnant while the other heifer was open. The estrous detection patches correctly identified 45 of 59 (76.3%) pregnant heifers, but only 9 of 22 (41%) open heifers.
Cows. Similar to heifers, all cows displaying fully activated patches were observed in estrus during the estrous synchronization period. Ultrasonography about 45 days after AI confirmed 81 of 149 cows were pregnant (Table 1). Estrous detection patch scores recorded 4 weeks after AI correctly identified 79 of 81 (97.5%) cows as pregnant after AI. Of the 68 cows found by ultrasonography to be open after AI, only 39 (57.4%) were correctly identified as open by estrous detection patch scoring. At the end of the breeding season, 125 of 149 cows were confirmed to be pregnant by ultrasonography. Estrous detection patch scoring performed 4 weeks after bull removal correctly identified 109 of 125 (87.2%) as pregnant. However, only 5 of 24 cows were correctly identified as open by patch scoring.
Failure to correctly identify cows as pregnant or open by patch scores could in part be due to the loss of patches from 19 cows. At the time of patch application (at bull removal), the weather turned very cold, and the spray adhesive did not get "tacky" after application. Of the 19 cows that lost estrous detection patches, 14 were confirmed pregnant and the other 5 were confirmed open. Therefore, it cannot be assumed that cows that lose patches have been in estrus or had the patch torn lose by mounting activity. Cows or heifers that lose estrous detection patches are as likely to be pregnant as open. When patches are lost, they should be replaced. Following the recommended label instructions for patch application is sufficient when patches only need to stay on for a few days, such as after estrous synchronization and before insemination. However, patches are much more likely to remain on cows for long periods of time (up to a month) when the hair is clipped, sprayed with adhesive and the front edge of the patch placed in line with the hipbones.
In conclusion, estrous detection patches are useful for determining the cyclic status of the herd before the breeding season, for identifying cows or heifers returning to estrus after AI, and for identifying pregnant cows after bull removal at the end of the breeding season. Accuracy is dependent on having the cows or heifers cycling normally. An inactivated patch after AI or after bull removal indicates the animal is pregnant. However, non-cyclic animals will also have inactivated patches, so the patches cannot differentiate between non-cyclic and pregnant animals. While estrous detection patches can give producers “peace of mind” that their cows are cycling, as well as provide a good estimation of calving date, either palpation or ultrasound approximately 45 to 60 days after the end of the breeding season is still the most reliable method for pregnancy determination in cattle.
Implications
Estrotect™ estrous detection patches can be used to monitor the cyclic status of the herd before breeding, to identify animals conceiving after artificial insemination, and to determine seasonal pregnancy rate. Predictive accuracy of estrous detection patches is dependent upon patch retention on cows or heifers over a four-week period and having the herd cycle normally.
Literature Cited
Pence, M., R. BreDahl and J.U. Thompson. 1999. Clinical use of re-productive tract scoring to predict pregnancy outcome. Beef Res. Rpt., Iowa State. Univ., A.S. Leaflet R1656.
Powell, J.G., T.D. Lester, M.P. Rowe, C.L. Williams and R.W. Rorie. 2011. Evaluation of a modified progestin-select synch estrous synchronization protocol in beef cows and heifers. Prof. Anim. Sci. 27:535-539.
Trenkle, A. and R.L. Willham. 1977. Beef production efficiency: The efficiency of beef production can be improved by applying knowledge of nutrition and breeding. Science 198:1009-1015.
USDA NAHMS: Sparse Use of Reproductive Management Tech-nology for Beef Heifers and Cows. 1994. www.aphis.usda.gov/animal_health/.../chapa/CHAPA_is_SparseRMT.pdf.
AAES Research Series 620
20
Table 1. Use of Estrotect™ estrous detection patches to predict pregnancy rate in beef heifers and cows. Confirmed by
ultrasonography Correctly predicted by patch scoring
Item Pregnant Open Pregnant (%) Open (%)
Heifers AI pregnancy rate 24 24 23/24 (95.8) 15/24 (62.5)
Seasonal pregnancy rate 59 22 45/59 (76.3) 9/22 (40.9)
Cows AI pregnancy rate 81 68 79/81 (97.5) 39/68 (57.4)
Seasonal pregnancy rate 125 24 109/125 (87.2) 5/24 (20.8)
21
Introduction
Feed mixes, free choice mineral supplements, and concentrated forms of chlortetracycline may currently be purchased over-the-counter at feed stores. While the use of chlortetracycline (CTC) is approved for mature beef cows to control anaplasmosis, most pur-poses sought after are not approved, labeled uses, such as pinkeye control and foot rot control. Providing a free choice mineral sup-plement fortified with CTC is a practice adopted by cattle producers whose base forage supply is Kentucky 31 tall fescue; however, the actual percentage of toxic fescue grazers offering CTC is unknown.
In recent years, the use of medically important antimicrobials, such as CTC, to improve weight gain and feed efficiency of livestock has received great scrutiny. The FDA recently moved forward with proposed feed law changes pertaining to the use of medically important antimicrobials in animal feed.
There is little published data available that demonstrates the health benefits of feeding CTC to mature beef cows grazing fescue. As such, this project evaluated the short term response for offering a free choice mineral fortified with CTC to beef cows either con-tinuously grazing or strip-grazing stockpiled, Kentucky 31 tall fescue.
Materials and Methods
On December 4, 2013, 96 spring calving beef cows pregnant with at least their second calf were allocated to 1 of 12 pastures
balancing for body weight and body condition score. The cows were weighed and body condition scored prior to turnout. Each of the 12 pastures was assigned to either continuous grazing (CONT) or strip-grazing (STRIP) management. In addition, each of the 12 pastures was assigned to cows having access to a free choice mineral supplementation program that either was not fortified (CTC-) or was fortified (CTC+) with CTC. Overall, there were 3 pasture replications for each grazing by mineral fortification combination and 6 pasture replicates for the simple effect of grazing treatment or mineral treatment. The mineral supplement was the Ragland 6% Phos Complete Mineral Supplement (Ragland Mills, Inc., Neosho, Mo.). The CTC+ mineral was the same Ragland mineral with CTC mixed into the mineral at the experiment station. The CTC+ mineral was mixed to contain 1.4 g CTC/lb mineral which would provide 350 mg at a 4 ounce intake. Although this rate is less than that approved for beef cattle for anaplasmosis control, it does represent a rate that is most commonly available. In addition, anaplasmosis should not be of concern during the months stock-piled fescue would be grazed. Mineral was added weekly, a salt block was provided to help moderate mineral intake, and mineral feeder contents were weighed weekly just prior to replenishing the mineral.
Each of the 12, 8 acre pastures used in this study was stockpiled as follows. Pastures had been previously grazed until August 15, 2013. In late August, pastures were mowed to a 4 to 6 inch residual height. Urea was applied September 11 to provide 60 lb. nitrogen per acre. In mid-November, an initial forage mass was
Forage utilization and beef cow weight, body condition, and body temperature response to a continuous or strip-graze forage allocation with or without
chlortetracycline added to the free choice mineral supplement
M.S. Gadberry1, D.S. Hubbell III2, J.D. Tucker2, T. Hess2, P.A. Beck3, J.Jennings1, J.G. Powell4, and E.B. Backes4
Story in Brief
Ninety-six cows were allocated to 1 of 12 stockpiled fescue pastures to study the interrelationship of continuous or strip-grazed forage management with or without chlortetracycline offered via a free choice mineral supplement. The chlortetracycline mineral had a 1.4 g/lb active ingredient concentration. Grazing was initiated December 4 and continued for 56 days. Cows on the continuous grazed treatment were allocated 6 acres and cow grazing the strip-grazed pastures had utilized 5.6 acres by the end of the study. There was a grazing management by mineral supplement interaction for mineral disappearance. Pastures that were strip grazed by cows offered a mineral that did not contain chlortetracycline had a mineral disappearance rate of 4.2 ± 0.24 ounces/cow (mean ± standard error) daily, which tended to differ from continuous grazed pastures without chlortetracycline (P = 0.09) and strip-grazed pastures with chlortetracycline (P = 0.10). All other treatments had similar mineral disappearance rates (4.7 ± 0.24 ounces/cow, daily). Body weight and body condition score were not affected by grazing treatment. Cows in chlortetracycline supplemented pastures were 48 pounds (P ≤ 0.05) heavier at the interim weigh date. However, weight change from the interim weigh date to the final weigh date was not affected by chlortetracycline supplementation. Strip-grazed pastures resulted in cows expressing greater skin temperature and thermocirculatory index at the rump and ear (P ≤ 0.05). Most body temperatures were not responsive to chlortetracycline supplementation. Overall forage utilization did not differ between continuous and strip-grazed pastures. In conclusion, there was no sustained benefit to feeding chlortetracycline when grazing stockpiled fescue. Overall forage utilization, cow weight, and cow body condition scores were not affected by grazing management, yet strip-grazing in comparison to continuous grazing showed some evidence for better vascular response as estimated by skin temperature and thermocirulatory index.
1 University of Arkansas System Division of Agriculture, Department of Animal Science, Little Rock, Ark.2 Livestock and Forestry Branch Station, Batesville, Ark.3 University of Arkansas System Division of Agriculture, Department of Animal Science, Hope, Ark.4 University of Arkansas System Division of Agriculture, Department of Animal Science, Fayetteville, Ark.
AAES Research Series 620
22
determined to estimate expected acreage utilization by the STRIP grazing management through the end of January. This permitted the CONT 8 acre pasture size to be modified prior to the December 4 turnout, restricting the herd to the same total acreage expected to be used with STRIP. A 60% utilization rate was used for STRIP planning. From turnout on December 4 through the end of grazing on January 29, cows within the STRIP treatment were allocated 0.1 acre/day at 3 and 4 day allocations each week. Based on expected STRIP utilization, each 8 acre CONT pasture was reduced to 6 acres using single strand electrified fencing prior to the initial turnout.
Cows were weighed and body condition scored (scale of 1 to 9 with 1 = emaciated, 6 = good, and 9 = obese) on January 8 (referred to as interim) and 29 (referred to as final), 2014. On the weigh dates, rectal temperature (TR) was recorded. Skin temperature (TS) at the back of the ear, at the rump, and between the dew claws of the front left leg were collected with an infrared thermometer. At each time point rectal and skin temperature was recorded, ambient temperature (TA) was also recorded. A thermocirculatory index (TCI) was calculated for each TS location using the following formula: (TS-TA)/( TR-TS). Ideally, this measure would be taken in a controlled environment whereby environmental temperature is maintained at a constant and individual cow activity is minimal. However, in field conditions, these variables were not controllable. Therefore, ambient temperature was recorded when each cow’s body temperature measurements were logged, and the database program used to record entries was setup to automatically record the time the entries were added so time of processing could be included in the model as a continuous covariate. Within 1 day of weighing, the available forage mass within both the grazed and non-grazed acreage of each STRIP and CONT pasture was estimated by a rising plate disk meter with disk meter calibration samples collected as well.
The response of cow body weight, body weight change, body condition score, body condition score change, and body temperature measurements to grazing treatment, mineral treatment, and the potential interaction of grazing treatment with mineral treatment was evaluated using pasture as the experimental unit. Statistical analysis for cattle measurements was performed separately for the initial, interim, and final weigh period. For all responses collected on cattle, there was no interaction between the mineral and grazing management treatments; therefore, this was removed from the model and only the main effects of grazing management and mineral treatment are discussed. Estimates of forage utilization were based on initial, interim, and final predictions of available forage for grazing and included a correction factor for the estimated change in forage mass in the non-grazed area. Calving records were also analyzed for distribution of gender and calving date among treatments, and treatment effects on live births and weight at birth was evaluated.
Results and Discussion
Beginning December 4, 2013, cows grazed stockpiled fescue for 56 days. The STRIP pastures concluded with 5.6 acres grazed compared to 6.0 acres allocated to CONT. During the study, there was no incidence of fescue foot among any treatment. One of the 96 cows aborted January 22, and this cow was in a CONT with CTC- pasture.
The salt block intake averaged 0.26 ± 0.06 ounces/cow, daily and did not differ among treatments. There tended to be a grazing management and mineral treatment interaction for the loose mineral consumption. The STRIP × CTC- pastures had the lowest
mineral consumption (4.2 ± 0.24 ounces/cow, daily) which tended to differ from CONT × CTC- (P = 0.09) and STRIP × CTC+ (P = 0.10). All other intakes were similar and averaged 4.7 ± 0.24 ounces/cow, daily. At 1.4 g CTC/lb mineral, CTC intake averaged 415 mg/cow, daily in CTC+ pastures which was 19% greater than the 350 mg target and 67% of the approved rate for anaplasmosis control.
Grazing management did not affect body weight or body condition score change (Table 1). Cows exposed to CTC+ mineral gained 48 lb more than CTC- from the beginning of the study to the interim weigh date. From the interim weigh date until the end of the study, weight change was numerically greater for CTC- compared to CTC+. Overall, cattle exposed to CTC+ were 31 lb. heavier at the end of stockpiled fescue grazing. Interestingly, this amount of weight difference should correspond to approximately 0.5 score difference in body condition; however, body condition score did not differ between CTC+ and CTC- at any point in the study.
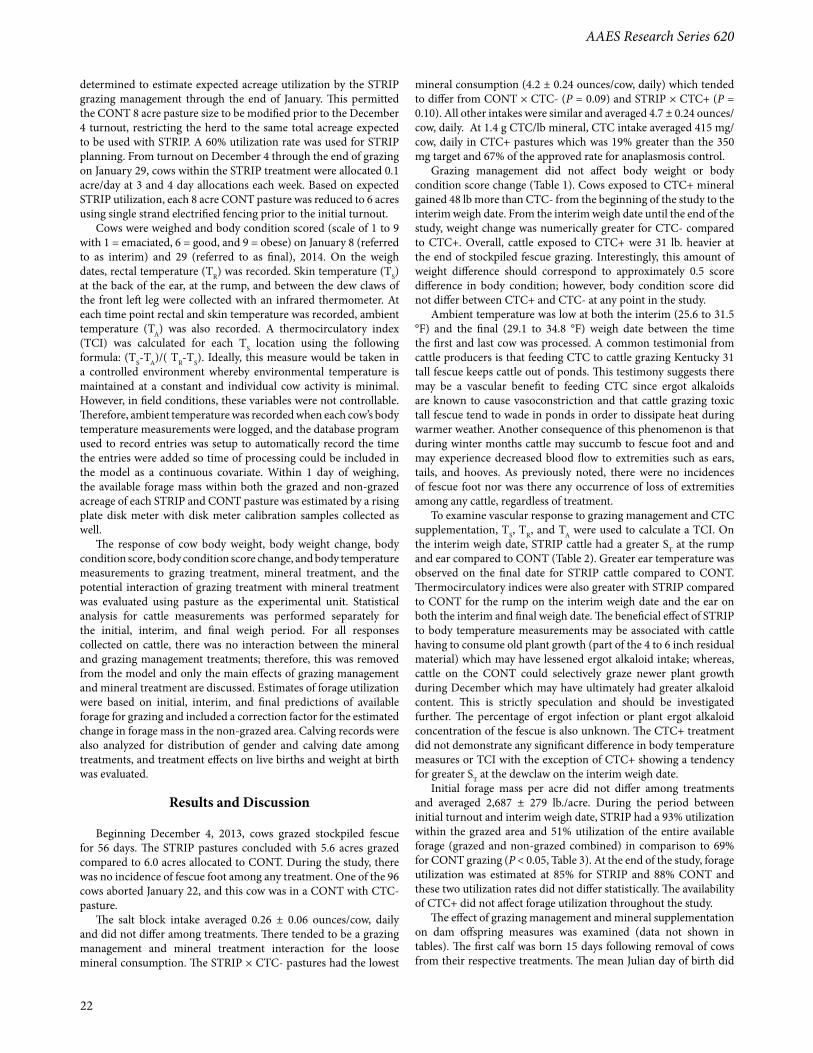
Ambient temperature was low at both the interim (25.6 to 31.5 °F) and the final (29.1 to 34.8 °F) weigh date between the time the first and last cow was processed. A common testimonial from cattle producers is that feeding CTC to cattle grazing Kentucky 31 tall fescue keeps cattle out of ponds. This testimony suggests there may be a vascular benefit to feeding CTC since ergot alkaloids are known to cause vasoconstriction and that cattle grazing toxic tall fescue tend to wade in ponds in order to dissipate heat during warmer weather. Another consequence of this phenomenon is that during winter months cattle may succumb to fescue foot and and may experience decreased blood flow to extremities such as ears, tails, and hooves. As previously noted, there were no incidences of fescue foot nor was there any occurrence of loss of extremities among any cattle, regardless of treatment.
To examine vascular response to grazing management and CTC supplementation, TS, TR, and TA were used to calculate a TCI. On the interim weigh date, STRIP cattle had a greater ST at the rump and ear compared to CONT (Table 2). Greater ear temperature was observed on the final date for STRIP cattle compared to CONT. Thermocirculatory indices were also greater with STRIP compared to CONT for the rump on the interim weigh date and the ear on both the interim and final weigh date. The beneficial effect of STRIP to body temperature measurements may be associated with cattle having to consume old plant growth (part of the 4 to 6 inch residual material) which may have lessened ergot alkaloid intake; whereas, cattle on the CONT could selectively graze newer plant growth during December which may have ultimately had greater alkaloid content. This is strictly speculation and should be investigated further. The percentage of ergot infection or plant ergot alkaloid concentration of the fescue is also unknown. The CTC+ treatment did not demonstrate any significant difference in body temperature measures or TCI with the exception of CTC+ showing a tendency for greater ST at the dewclaw on the interim weigh date.
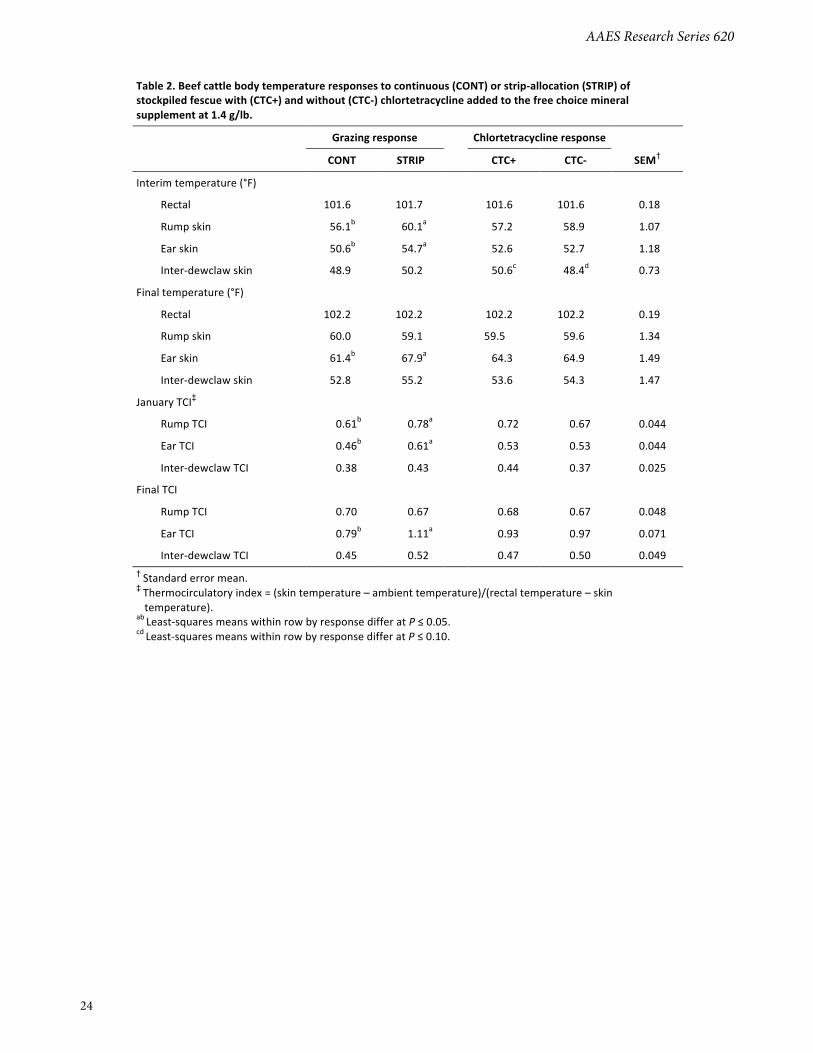
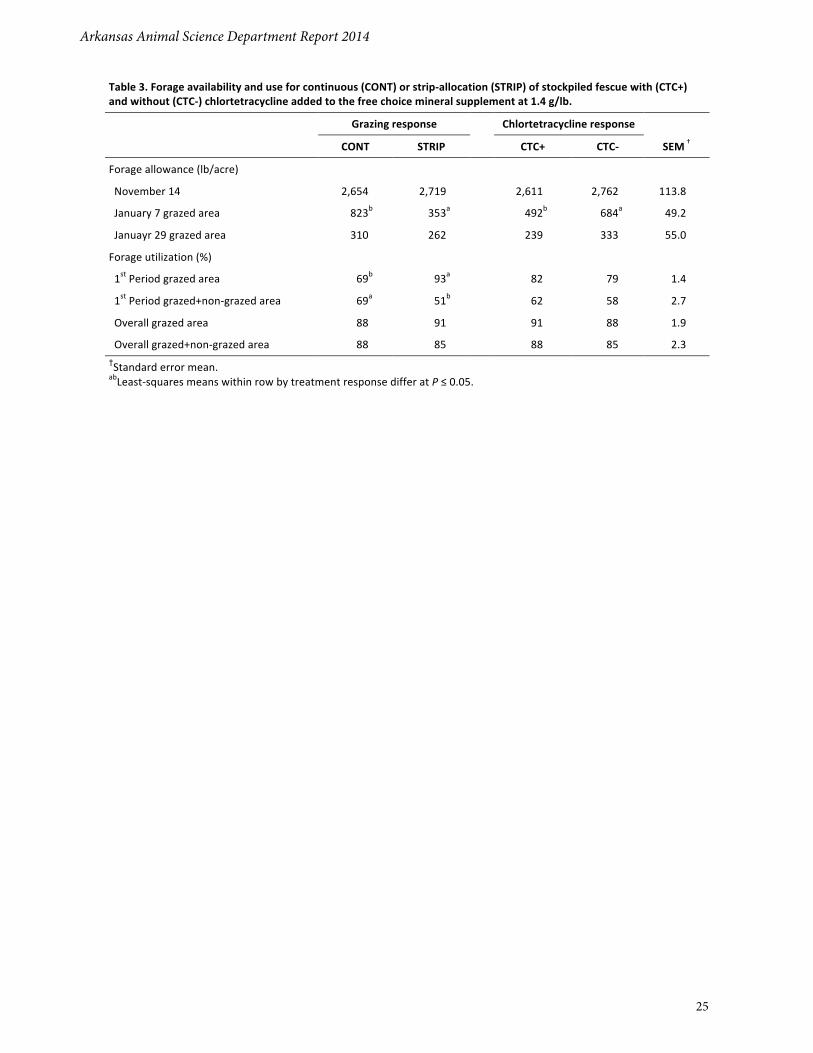
Initial forage mass per acre did not differ among treatments and averaged 2,687 ± 279 lb./acre. During the period between initial turnout and interim weigh date, STRIP had a 93% utilization within the grazed area and 51% utilization of the entire available forage (grazed and non-grazed combined) in comparison to 69% for CONT grazing (P < 0.05, Table 3). At the end of the study, forage utilization was estimated at 85% for STRIP and 88% CONT and these two utilization rates did not differ statistically. The availability of CTC+ did not affect forage utilization throughout the study.
The effect of grazing management and mineral supplementation on dam offspring measures was examined (data not shown in tables). The first calf was born 15 days following removal of cows from their respective treatments. The mean Julian day of birth did

Arkansas Animal Science Department Report 2014
23
Table 1. Beef cattle weight and body condition response to continuous (CONT) or strip-‐allocation (STRIP) of stockpiled fescue with (CTC+) and without (CTC-‐) chlortetracycline added to the free choice mineral supplement at 1.4 g/lb. Grazing response Chlortetracycline response
CONT STRIP CTC+ CTC-‐ SEM† Weight (lb)
Initial 1,231 1,220 1,231 1,221 25.4
Interim 1,223 1,209 1,245 1,186 25.4
Final 1,250 1,233 1,263 1,220 23.9
Weight change (lb)
Dec-‐Jan -‐8 -‐11 14a -‐34b 13.2
Jan-‐Feb 27 24 17 33 11.3
Dec-‐Feb 18 12 32a -‐1b 9.0
Body condition score‡
Initial 6.1 6.1 6.1 6.1 0.1
Interim 6.0 6.0 6.0 6.0 0.07
Final 6.2 6.2 6.2 6.2 0.09 †Standard error mean. ‡Scale of 1 to 9 with 1 = emaciated, 6 = good, and 9 = obese. abLeast-‐squares means within row by treatment response differ at P ≤ 0.05.
not differ among treatments and averaged 71 ± 13 days (mean ± standard deviation). At the end of calving season, there was an average 7.5 out of 8 possible live calves among CTC+ pasture groups and 6.8 out of 8 possible live calves among CTC- pasture groups. During calving, several calves were found dead at birth. The calves found dead at birth were 6 pounds heavier but statistically their weight did not differ from calves born alive (P = 0.25). In addition the mean date of birth did not differ between calves that were found dead or alive following birth. At the end of calving, several cows had never calved. All cows used in the study had a positive BioPRYN (BioTracking LLC, Moscow, Idaho) pregnancy test result prior to the start of the study. While the odds of having a live calf by the end of calving season was greater with CTC+, more cattle are needed to draw reliable statistical inference to this very interesting observation. There was a tendency (P = 0.08) for an interaction among treatments for the proportion of males to females at birth with CONT:CTC-, STRIP:CTC-, CONT:CTC+, STRIP:CTC+ having 43%, 45%, 69%, and 35 ± 10.1% male calves. However, calf
gender was not a significant covariate responsible for differences in dam weight change during the study. Birth weight of calves was not affected by treatments and averaged 89.7 ± 12.7 pounds (mean ± standard deviation).
Implications
This short-term, single year study conveyed circumstantial evidence toward improved health (calf survival through birth) when supplementing chlortetracycline to beef cows grazing stockpiled fescue. Further study is needed to validate the response. Strip grazing stockpiled fescue exhibited improved body temperature indicators which should be further studied. Strip grazing did not, however, improve body weight or body condition change, and while initial forage utilization was greater with strip grazing, overall forage utilization and herd productivity did not differ from continuous grazing.
AAES Research Series 620
24
Table 2. Beef cattle body temperature responses to continuous (CONT) or strip-‐allocation (STRIP) of stockpiled fescue with (CTC+) and without (CTC-‐) chlortetracycline added to the free choice mineral supplement at 1.4 g/lb. Grazing response Chlortetracycline response
CONT STRIP CTC+ CTC-‐ SEM† Interim temperature (°F)
Rectal 101.6 101.7 101.6 101.6 0.18 Rump skin 56.1b 60.1a 57.2 58.9 1.07 Ear skin 50.6b 54.7a 52.6 52.7 1.18 Inter-‐dewclaw skin 48.9 50.2 50.6c 48.4d 0.73 Final temperature (°F)
Rectal 102.2 102.2 102.2 102.2 0.19 Rump skin 60.0 59.1 59.5 59.6 1.34 Ear skin 61.4b 67.9a 64.3 64.9 1.49 Inter-‐dewclaw skin 52.8 55.2 53.6 54.3 1.47 January TCI‡
Rump TCI 0.61b 0.78a 0.72 0.67 0.044 Ear TCI 0.46b 0.61a 0.53 0.53 0.044 Inter-‐dewclaw TCI 0.38 0.43 0.44 0.37 0.025 Final TCI
Rump TCI 0.70 0.67 0.68 0.67 0.048 Ear TCI 0.79b 1.11a 0.93 0.97 0.071 Inter-‐dewclaw TCI 0.45 0.52 0.47 0.50 0.049 † Standard error mean. ‡ Thermocirculatory index = (skin temperature – ambient temperature)/(rectal temperature – skin temperature). ab Least-‐squares means within row by response differ at P ≤ 0.05. cd Least-‐squares means within row by response differ at P ≤ 0.10.
Arkansas Animal Science Department Report 2014
25
Table 3. Forage availability and use for continuous (CONT) or strip-‐allocation (STRIP) of stockpiled fescue with (CTC+) and without (CTC-‐) chlortetracycline added to the free choice mineral supplement at 1.4 g/lb. Grazing response Chlortetracycline response
CONT STRIP CTC+ CTC-‐ SEM †
Forage allowance (lb/acre)
November 14 2,654 2,719 2,611 2,762 113.8
January 7 grazed area 823b 353a 492b 684a 49.2
Januayr 29 grazed area 310 262 239 333 55.0
Forage utilization (%)
1st Period grazed area 69b 93a 82 79 1.4
1st Period grazed+non-‐grazed area 69a 51b 62 58 2.7
Overall grazed area 88 91 91 88 1.9
Overall grazed+non-‐grazed area 88 85 88 85 2.3 †Standard error mean. abLeast-‐squares means within row by treatment response differ at P ≤ 0.05.
26
Introduction
The prevalence of distillers’ grains is increasing due to growing interest in processing corn for ethanol production. As a result, the increased production of distillers’ grains is leading the beef industry to use distillers' grains as a feed source. Sulfuric acid is used during ethanol production for pH adjustment to optimize fermentation and distillation conditions; however, this has had the unintended consequence of contributing to elevated sulfur (S) concentrations in distillers’ grains. Distillers’ grains can have concentrations of 0.8% S or greater (Buckner et al., 2008). Accordingly, the metabolism of S in ruminants has gained interest, because dietary concentrations of S have increased as the consumption of distillers grains have increased. The maximum tolerable concentration, the level above which negative performance occurs, is 0.5% S for roughage diets and 0.3% S for high concentrate diets (NRC, 2005). No studies have been conducted to measure the effect of dietary S and extended aging on beef quality characteristics like flavor, color, and shelf-life. The objective of this study was to test the effects of excess dietary S on beef carcass characteristics and quality (color shelf-life, oxidative stability, and sensory attributes) after aging.
Materials and Methods
The study was conducted between October 2012 and June 2013 at the University of Arkansas Stocker Cattle Receiving and Back-grounding Unit in Savoy. Animal handling procedures for this study were approved by the University of Arkansas Animal Care and Use Committee. Additional funding for this study was provided by the Arkansas Beef Council.
Animals and Experimental DesignTwenty steers (initial body weight [BW] = 624 ± 15.9 lb) of
predominantly Angus breeding were obtained from the University
of Arkansas Cow-Calf Unit in Savoy. Steers were stratified by initial BW and assigned randomly to 1 of 6 pens (3 to 4 steers/pen) for a 114-d growing phase. Pens were assigned randomly to 1 of 2 dietary treatments: 1) low (0.15%) S or 2) high (0.40%) S (Table 1). Steers grazed mixed grass pasture and were supplemented to meet nutrient requirements with a ground corn and soybean meal ration (low-S treatment). High-S steers were offered an identical supplement to which sodium sulfate had been added to reach 0.40% S in the total diet dry matter. Moreover, steers were provided access to bermudagrass hay in quantities sufficient to ensure ad libitum access to forage. When the average BW of the steers reached 823 ± 0.4 lb, steers were stratified by BW and assigned randomly to 16 dry-lot pens (1 to 2 steers/pen; 8 pens/dietary treatment). Steers remained on the same dietary treatment for a 123-d finishing phase. Low-S steers were offered a traditional corn and soybean meal finishing ration that did not contain any byproduct feeds, and met the NRC requirement of 0.15% S. High-S steers were offered an identical ration except sodium sulfate was added so the ration contained 0.40% S. The feed management approach during the finishing phase was designed to provide cattle with maximum daily intake using the slick-bunk feed management strategy. Feed bunks were visually evaluated each morning to determine the quantity of feed to offer each pen. Daily treatment amounts were weighed and provided at 0800 h. Steers were monitored daily for morbidity.
Sample Collection and Analytical ProceduresSlaughter, Steak Fabrication, and pH. Steers were harvested in
a commercial abattoir (Creekstone Farms, Arkansas City, Kan.). Individual identification was maintained with each carcass after har-vest. Abattoir personnel recorded carcass characteristics. Following a 48-h chilling period, boneless rib sections were collected during carcass fabrication, vacuum-packaged, boxed, loaded onto ice, and transported to the University of Arkansas Red Meat Abattoir. Rib sections were aged 14 d (36 °F) and fabricated into 1-in. steaks.
Effects of excess dietary sulfur on beef carcass characteristics and quality after aging
J. Hawley, E.B. Kegley, J.W.S. Yancey, J.K. Apple, T.M. Johnson, and A.W. Ryan1
Story in Brief
To test the effects of excess dietary sulfur on beef carcass characteristics and quality, 20 steers (initial body weight = 624 ± 15.9 lb) were allocated to 1) low (0.15%) or 2) high (0.40%) dietary sulfur. Steers grazed fall pastures and were offered corn and soybean meal supplements for 114 d. Steers were moved to feedlot, remained on prior dietary treatments, and received corn and soybean meal rations for 123 d. Steers were slaughtered (body weight = 1,246 ± 84.7 lb) and boneless rib sections aged for 14 d (39 °F). Sections were fabricated into steaks, overwrapped with oxygen permeable film, and stored in display cases for 7 d of simulated retail display. Trained panelists (n = 11) evaluated longissimus muscle color on d 0, 1, and 7. Instrumental color was evaluated on d 0, 1, 4, and 7. Thiobarbituric acid reactive substances were measured on d 0 and 7 from longissimus muscle cross-sections. A consumer sensory panel (n = 151) assessed cooked longissimus muscle sensory attributes. Steer growth did not differ (P ≥ 0.44) between dietary sulfur levels. Dietary sulfur did not affect beef carcass characteristics (P ≥ 0.36) or quality (P ≥ 0.13). Thiobarbituric acid reactive substances values did not (P = 0.19) differ between dietary S levels. No differences were observed in total color (P = 0.41) or percent discoloration (P = 0.39); however, longissimus muscle from steers fed 0.40% sulfur were perceived to display greater worst-point color (P < 0.05; treatment × day) on d 1 of simulated retail display. Dietary sulfur did not affect (P ≥ 0.38) instrumental color. Results suggest supplementing beef cattle diets with 0.40% sulfur had no appreciable effects on steer performance or beef carcass characteristics, objective color, oxidative stability, and sensory attributes.
1 All authors affiliated with the University of Arkansas System Division of Agriculture, Department of Animal Science, Fayetteville, Ark.
Arkansas Animal Science Department Report 2014
27
Prior to fabrication, section pH was measured in duplicate by inserting a calibrated pH probe (Testo 205, Lenzkirch, Germany) directly into the meat.
Surface Color Measurement and Drip Loss. One steak from each steer was overwrapped with oxygen permeable film and stored in open-topped, coffin-chest display cases (LMG12; Tyler Refrigeration Corp., Niles, Mich.) under continuous warm-white, fluorescent lighting (1600 lx) at 37 °F for 7 d of simulated retail display for visual and instrumental color evaluation. Steak case position was randomly shuffled daily. Visual panelists (n = 11) evaluated raw longissimus muscle (LM) color on d 0, 1, and 7. Visual panelists were trained and evaluation was conducted according to AMSA (1991) guidelines. Panelists scored each LM for total color and worst-point color (1 = very bright cherry red; 2 = bright cherry red; 3 = dull red; 4 = slightly dark red; 5 = moderately dark red to tan; 6 = dark red to brown; 7 = very dark red to brown) and percent discoloration (1 = 0% to 5% discoloration; 2 = 6% to 20% discoloration; 3 = 21% to 35% discoloration; 4 = 36% to50% discoloration; 5 = 51% to 65% discoloration; 6 = 66% to 80% discoloration; 7 = 81% to 95% discoloration; 8 = 96% to 100% discoloration). Panelists were instructed to consider worst-point color as the worst point of discoloration on the LM, about the size of a dime. Instrumental color was evaluated on d 0, 1, 4, and 7 using a Hunter Miniscan EZ (Model 4500L, Hunter Associates Laboratory, Inc., Reston, Va.) calibrated against black and white tiles. Lightness (L*), redness (a*), and yellowness (b*) values were determined from the mean of 3 readings collected from the cut surface of each steak using Illuminant A, 10º standard, observer, and 1.0-in. aperture. Drip loss was calculated by taking the initial weight of each steak before packaging for simulated retail display. After 7 d of display, steaks were removed from packages, blotted dry on paper towels, and reweighed. The difference between the weight and initial weight was divided by the initial weight to calculate drip loss percentage.
Thiobarbituric Acid Reactive Substances (TBARS). Thiobarbituric acid reactive substances assays (Apple et al., 2001) were performed on d 0 and 7 of simulated retail display from LM cross sections. Briefly, 2 g minced beef sample was added to 8 mL 50 mM phosphate buffer (pH 7.0, containing 1.0% ethylenediamine tetraacetic acid and 0.1% propyl gallate), 2 mL 30% trichloracetic acid was added, and samples homogenized for 20 to 30 s. Homogenate was filtered through Whatman (No. 4) filter paper. A 2-mL aliquot of filtrate was transferred to duplicate borosilicate tubes, 2 mL 2-thiobarbituric acid added, and tubes placed in a hot water bath (212 °F) for 20 min. Tubes were transferred to an ice bath for 15 min. Absorbance was read using a spectrophotometer (Shimadzu Scientific Instruments, Inc., model UV-12015, Japan) at 533 nm. Absorbance values were multiplied by a factor of 12.21 to attain TBARS values (mg malonaldehyde/kg of sample).
Cooking Loss and Warner-Bratzler Shear Force (WBSF). Steaks were thawed for 24 h at 34 °F. Steaks were cooked on electric griddles (National Presto Industries, Inc., Eau Claire, Wis.) and turned every 4 min until an internal temperature of 160 °F was reached. Cooked steaks were allowed to cool at room temperature for 1 hr. Cooking loss was calculated by taking the initial weight of the steak prior to cooking. Cooked steaks were blotted dry on paper towels and reweighed. The difference between the cooked weight and initial weight was divided by the initial weight to calculate cook- ing loss percentage. Thereafter, a minimum of 7, 0.5-in-diameter parallelepipeds were removed parallel with the muscle fiber orienta-tion from each cooked steak. Shear force was measured using an Instron Universal Testing Machine (Instron Corp., Canton, Mass.) with a 110-lb compression load cell, crosshead speed of 200 mm/
min, and Warner-Bratzler shear attachment. Shear force values of the cooked steaks were determined from sample parallelepiped means.
Consumer Sensory Panel. A consumer sensory panel (n = 151) assessed cooked LM sensory attributes. Frozen steaks prepared for consumer sensory panel evaluation were shipped frozen to the host facility and thawed in a 39 °F refrigerator for 24 h before sensory panels. Steaks were cooked to an internal temperature of 160 °F on electric griddles (National Presto Industries, Inc., Eau Claire, Wisc.), removed, then rested uncovered for 5 min. Steaks were cut into 0.5 × 0.5 × 1.0-in. samples, covered, and placed in a warming oven (140 °F) until panelists were served. For each taste panel (n = 16), panelists were provided 6 beef steak samples for evaluation: low sulfur (n = 3) or high sulfur (n = 3). Panelists were seated ran-domly at temperature controlled pass-through sensory analysis booths containing red filtered lighting to reduce visible effects due to cooking method, degree of doneness, or muscle effect. Samples were allocated randomly to panelists using the William’s design serving order (Compusense, Inc.). Panelists rated each steak sample for overall tenderness, juiciness, and beef flavor (9 = like extremely, 1 = dislike extremely), and off-flavor intensity (9 = extremely strong off-flavor, 1 = no off-flavor). Panelists were provided spring drinking water and saltless saltine crackers to cleanse their palates and to minimize sensory fatigue between samples.
Statistical AnalysisData were analyzed using the MIXED procedure of SAS (SAS
Inst., Inc., Cary, N.C.) by means of a variance components (VC) covariance structure. Denominator degrees of freedom were esti-mated using the Kenward-Rogers option. Adherence of the data to the assumptions of the statistical test was established. Weight data were analyzed as repeated measures. Fixed effects included in the model were dietary treatment and day, as well as the 2-way interaction, whereas pen (experimental unit) was included as a ran- dom effect. Day was included as a repeated effect. Carcass char-acteristic (hot carcass weight, dressing percentage, LM area, and 12th rib fat thickness) and quality (pH, drip loss, cooking loss, and WBSF) data were analyzed as randomized designs. Dietary treatment was the fixed effect and steer (experimental unit) was included as the random effect in the models for carcass characteristics; whereas steak (experimental unit) was included as the random effect in the models for carcass quality. Surface color measurements were analyzed as repeated measures. Fixed effects included in the model were dietary treatment and day, as well as the 2-way interaction, whereas steak (experimental unit) was included as a random effect. Panelist, as well as the 2-way interaction with steak, was also included in the model random effect for the trained panel data to account for panelist variation. Day was included as a repeated effect. Consumer sensory data was analyzed as a randomized design. Fixed effects included in the model were dietary treatment and panel, as well as the 2-way interaction. Panelist (experimental unit) was included in the model as a random effect to account for panelist variation. Least squares means were partitioned at the 5% level of significance by means of the probability of differences (PDIFF) option. Effect of treatment on USDA yield grade was analyzed by Chi-square and Fisher’s exact test using the FREQ procedure. Statistical significance was declared at P < 0.05.
Results and Discussion
Steer growth did not differ (P ≥ 0.44) between dietary S levels (Table 2). Dietary S did not affect hot carcass weight (P = 0.86), dressing percentage (P = 0.48), USDA yield grade (P = 0.65), LM
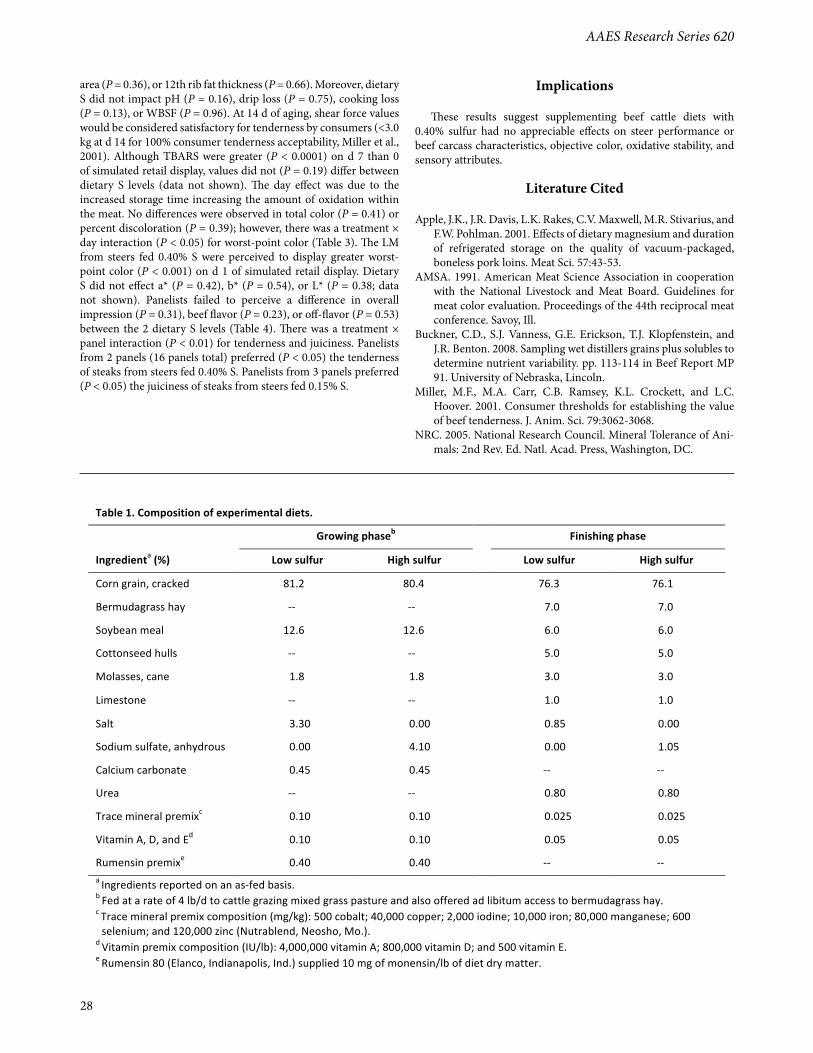
AAES Research Series 620
28
area (P = 0.36), or 12th rib fat thickness (P = 0.66). Moreover, dietary S did not impact pH (P = 0.16), drip loss (P = 0.75), cooking loss (P = 0.13), or WBSF (P = 0.96). At 14 d of aging, shear force values would be considered satisfactory for tenderness by consumers (<3.0 kg at d 14 for 100% consumer tenderness acceptability, Miller et al., 2001). Although TBARS were greater (P < 0.0001) on d 7 than 0 of simulated retail display, values did not (P = 0.19) differ between dietary S levels (data not shown). The day effect was due to the increased storage time increasing the amount of oxidation within the meat. No differences were observed in total color (P = 0.41) or percent discoloration (P = 0.39); however, there was a treatment × day interaction (P < 0.05) for worst-point color (Table 3). The LM from steers fed 0.40% S were perceived to display greater worst-point color (P < 0.001) on d 1 of simulated retail display. Dietary S did not effect a* (P = 0.42), b* (P = 0.54), or L* (P = 0.38; data not shown). Panelists failed to perceive a difference in overall impression (P = 0.31), beef flavor (P = 0.23), or off-flavor (P = 0.53) between the 2 dietary S levels (Table 4). There was a treatment × panel interaction (P < 0.01) for tenderness and juiciness. Panelists from 2 panels (16 panels total) preferred (P < 0.05) the tenderness of steaks from steers fed 0.40% S. Panelists from 3 panels preferred (P < 0.05) the juiciness of steaks from steers fed 0.15% S.
Implications
These results suggest supplementing beef cattle diets with 0.40% sulfur had no appreciable effects on steer performance or beef carcass characteristics, objective color, oxidative stability, and sensory attributes.
Literature Cited
Apple, J.K., J.R. Davis, L.K. Rakes, C.V. Maxwell, M.R. Stivarius, and F.W. Pohlman. 2001. Effects of dietary magnesium and duration of refrigerated storage on the quality of vacuum-packaged, boneless pork loins. Meat Sci. 57:43-53.
AMSA. 1991. American Meat Science Association in cooperation with the National Livestock and Meat Board. Guidelines for meat color evaluation. Proceedings of the 44th reciprocal meat conference. Savoy, Ill.
Buckner, C.D., S.J. Vanness, G.E. Erickson, T.J. Klopfenstein, and J.R. Benton. 2008. Sampling wet distillers grains plus solubles to determine nutrient variability. pp. 113-114 in Beef Report MP 91. University of Nebraska, Lincoln.
Miller, M.F., M.A. Carr, C.B. Ramsey, K.L. Crockett, and L.C. Hoover. 2001. Consumer thresholds for establishing the value of beef tenderness. J. Anim. Sci. 79:3062-3068.
NRC. 2005. National Research Council. Mineral Tolerance of Ani-mals: 2nd Rev. Ed. Natl. Acad. Press, Washington, DC.
Table 1. Composition of experimental diets.
Growing phaseb Finishing phase
Ingredienta (%) Low sulfur High sulfur Low sulfur High sulfur
Corn grain, cracked 81.2 80.4 76.3 76.1
Bermudagrass hay -‐-‐ -‐-‐ 7.0 7.0
Soybean meal 12.6 12.6 6.0 6.0
Cottonseed hulls -‐-‐ -‐-‐ 5.0 5.0
Molasses, cane 1.8 1.8 3.0 3.0
Limestone -‐-‐ -‐-‐ 1.0 1.0
Salt 3.30 0.00 0.85 0.00
Sodium sulfate, anhydrous 0.00 4.10 0.00 1.05
Calcium carbonate 0.45 0.45 -‐-‐ -‐-‐
Urea -‐-‐ -‐-‐ 0.80 0.80
Trace mineral premixc 0.10 0.10 0.025 0.025
Vitamin A, D, and Ed 0.10 0.10 0.05 0.05
Rumensin premixe 0.40 0.40 -‐-‐ -‐-‐ a Ingredients reported on an as-‐fed basis. b Fed at a rate of 4 lb/d to cattle grazing mixed grass pasture and also offered ad libitum access to bermudagrass hay. c Trace mineral premix composition (mg/kg): 500 cobalt; 40,000 copper; 2,000 iodine; 10,000 iron; 80,000 manganese; 600 selenium; and 120,000 zinc (Nutrablend, Neosho, Mo.).
d Vitamin premix composition (IU/lb): 4,000,000 vitamin A; 800,000 vitamin D; and 500 vitamin E. e Rumensin 80 (Elanco, Indianapolis, Ind.) supplied 10 mg of monensin/lb of diet dry matter.
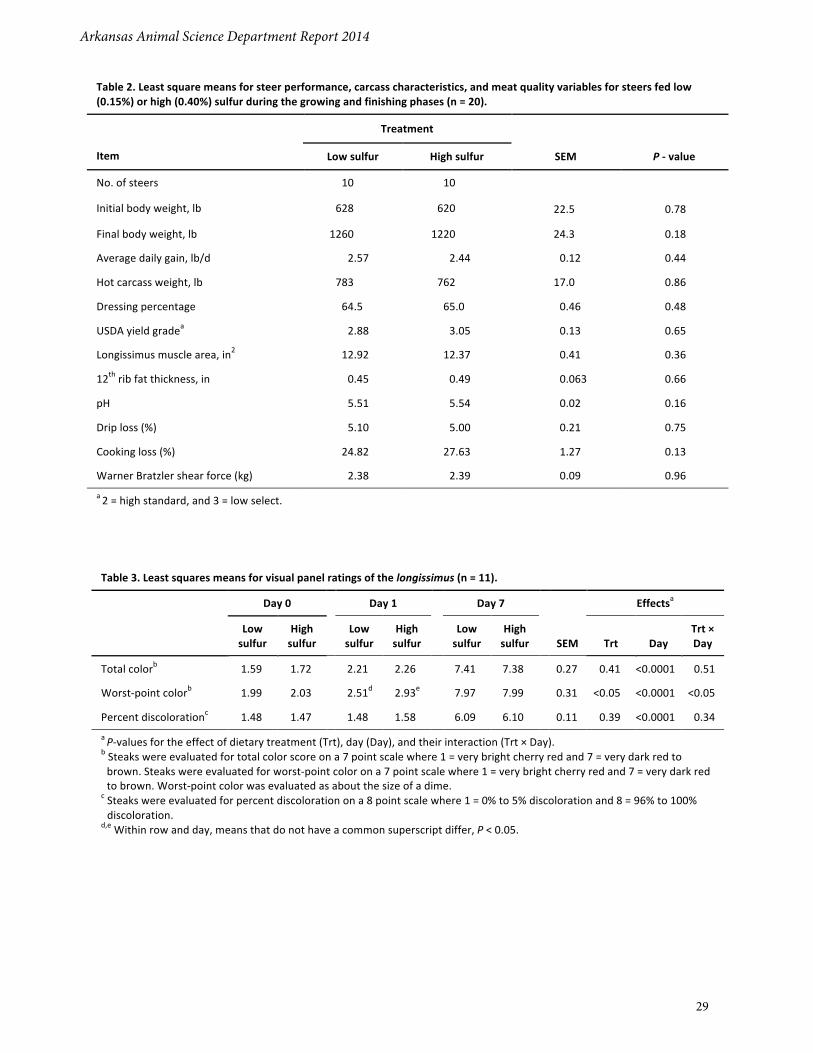
Arkansas Animal Science Department Report 2014
29
Table 2. Least square means for steer performance, carcass characteristics, and meat quality variables for steers fed low (0.15%) or high (0.40%) sulfur during the growing and finishing phases (n = 20).
Treatment
Item Low sulfur High sulfur SEM P -‐ value
No. of steers 10 10
Initial body weight, lb 628 620 22.5 0.78
Final body weight, lb 1260 1220 24.3 0.18
Average daily gain, lb/d 2.57 2.44 0.12 0.44
Hot carcass weight, lb 783 762 17.0 0.86
Dressing percentage 64.5 65.0 0.46 0.48
USDA yield gradea 2.88 3.05 0.13 0.65
Longissimus muscle area, in2 12.92 12.37 0.41 0.36
12th rib fat thickness, in 0.45 0.49 0.063 0.66
pH 5.51 5.54 0.02 0.16
Drip loss (%) 5.10 5.00 0.21 0.75
Cooking loss (%) 24.82 27.63 1.27 0.13
Warner Bratzler shear force (kg) 2.38 2.39 0.09 0.96
a 2 = high standard, and 3 = low select.
Table 3. Least squares means for visual panel ratings of the longissimus (n = 11).
Day 0 Day 1 Day 7 Effectsa
Low sulfur
High sulfur
Low
sulfur High sulfur
Low
sulfur High sulfur
SEM Trt Day
Trt × Day
Total colorb 1.59 1.72 2.21 2.26 7.41 7.38 0.27 0.41 <0.0001 0.51
Worst-‐point colorb 1.99 2.03 2.51d 2.93e 7.97 7.99 0.31 <0.05 <0.0001 <0.05
Percent discolorationc 1.48 1.47 1.48 1.58 6.09 6.10 0.11 0.39 <0.0001 0.34
a P-‐values for the effect of dietary treatment (Trt), day (Day), and their interaction (Trt × Day). b Steaks were evaluated for total color score on a 7 point scale where 1 = very bright cherry red and 7 = very dark red to brown. Steaks were evaluated for worst-‐point color on a 7 point scale where 1 = very bright cherry red and 7 = very dark red to brown. Worst-‐point color was evaluated as about the size of a dime.
c Steaks were evaluated for percent discoloration on a 8 point scale where 1 = 0% to 5% discoloration and 8 = 96% to 100% discoloration.
d,e Within row and day, means that do not have a common superscript differ, P < 0.05.
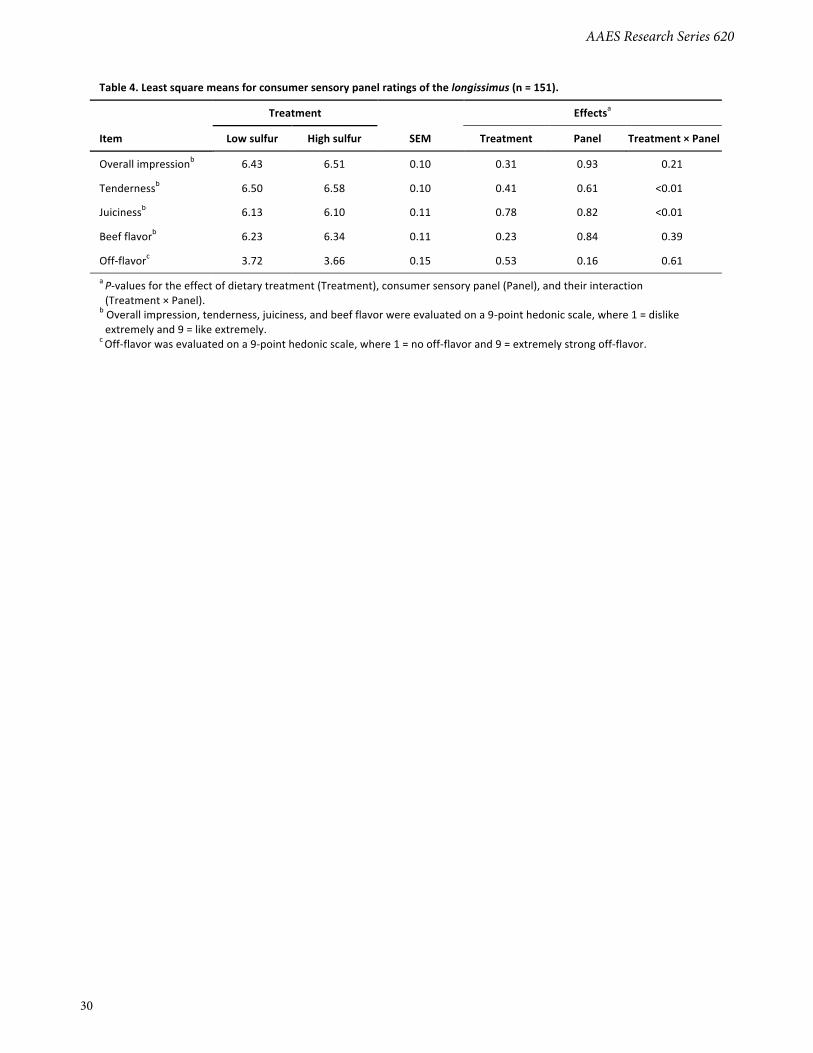
AAES Research Series 620
30
Table 4. Least square means for consumer sensory panel ratings of the longissimus (n = 151).
Treatment Effectsa
Item Low sulfur High sulfur SEM Treatment Panel Treatment × Panel
Overall impressionb 6.43 6.51 0.10 0.31 0.93 0.21
Tendernessb 6.50 6.58 0.10 0.41 0.61 <0.01
Juicinessb 6.13 6.10 0.11 0.78 0.82 <0.01
Beef flavorb 6.23 6.34 0.11 0.23 0.84 0.39
Off-‐flavorc 3.72 3.66 0.15 0.53 0.16 0.61
a P-‐values for the effect of dietary treatment (Treatment), consumer sensory panel (Panel), and their interaction (Treatment × Panel).
b Overall impression, tenderness, juiciness, and beef flavor were evaluated on a 9-‐point hedonic scale, where 1 = dislike extremely and 9 = like extremely.
c Off-‐flavor was evaluated on a 9-‐point hedonic scale, where 1 = no off-‐flavor and 9 = extremely strong off-‐flavor.
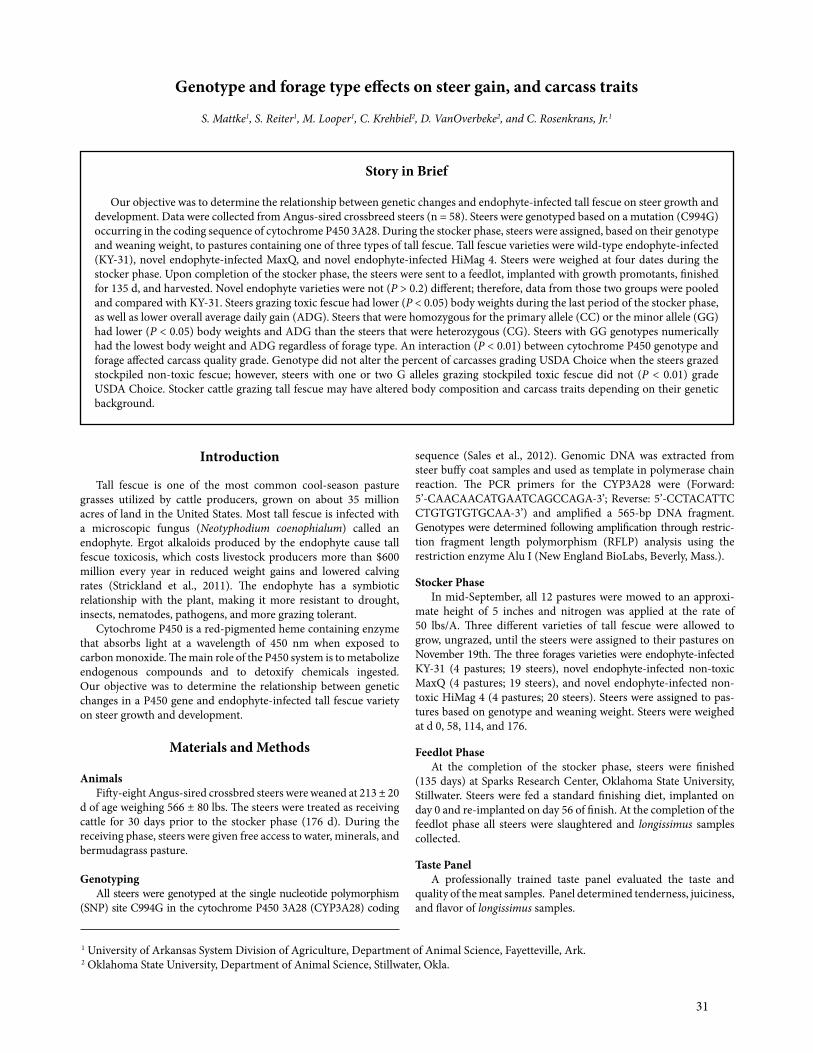
31
Introduction
Tall fescue is one of the most common cool-season pasture grasses utilized by cattle producers, grown on about 35 million acres of land in the United States. Most tall fescue is infected with a microscopic fungus (Neotyphodium coenophialum) called an endophyte. Ergot alkaloids produced by the endophyte cause tall fescue toxicosis, which costs livestock producers more than $600 million every year in reduced weight gains and lowered calving rates (Strickland et al., 2011). The endophyte has a symbiotic relationship with the plant, making it more resistant to drought, insects, nematodes, pathogens, and more grazing tolerant.
Cytochrome P450 is a red-pigmented heme containing enzyme that absorbs light at a wavelength of 450 nm when exposed to carbon monoxide. The main role of the P450 system is to metabolize endogenous compounds and to detoxify chemicals ingested. Our objective was to determine the relationship between genetic changes in a P450 gene and endophyte-infected tall fescue variety on steer growth and development.
Materials and Methods
AnimalsFifty-eight Angus-sired crossbred steers were weaned at 213 ± 20
d of age weighing 566 ± 80 lbs. The steers were treated as receiving cattle for 30 days prior to the stocker phase (176 d). During the receiving phase, steers were given free access to water, minerals, and bermudagrass pasture.
GenotypingAll steers were genotyped at the single nucleotide polymorphism
(SNP) site C994G in the cytochrome P450 3A28 (CYP3A28) coding
sequence (Sales et al., 2012). Genomic DNA was extracted from steer buffy coat samples and used as template in polymerase chain reaction. The PCR primers for the CYP3A28 were (Forward: 5’-CAACAACATGAATCAGCCAGA-3’; Reverse: 5’-CCTACATTC CTGTGTGTGCAA-3’) and amplified a 565-bp DNA fragment. Genotypes were determined following amplification through restric- tion fragment length polymorphism (RFLP) analysis using the restriction enzyme Alu I (New England BioLabs, Beverly, Mass.).
Stocker PhaseIn mid-September, all 12 pastures were mowed to an approxi-
mate height of 5 inches and nitrogen was applied at the rate of 50 lbs/A. Three different varieties of tall fescue were allowed to grow, ungrazed, until the steers were assigned to their pastures on November 19th. The three forages varieties were endophyte-infected KY-31 (4 pastures; 19 steers), novel endophyte-infected non-toxic MaxQ (4 pastures; 19 steers), and novel endophyte-infected non- toxic HiMag 4 (4 pastures; 20 steers). Steers were assigned to pas-tures based on genotype and weaning weight. Steers were weighed at d 0, 58, 114, and 176.
Feedlot PhaseAt the completion of the stocker phase, steers were finished
(135 days) at Sparks Research Center, Oklahoma State University, Stillwater. Steers were fed a standard finishing diet, implanted on day 0 and re-implanted on day 56 of finish. At the completion of the feedlot phase all steers were slaughtered and longissimus samples collected.
Taste PanelA professionally trained taste panel evaluated the taste and
quality of the meat samples. Panel determined tenderness, juiciness, and flavor of longissimus samples.
Genotype and forage type effects on steer gain, and carcass traits
S. Mattke1, S. Reiter1, M. Looper1, C. Krehbiel2, D. VanOverbeke2, and C. Rosenkrans, Jr.1
Story in Brief
Our objective was to determine the relationship between genetic changes and endophyte-infected tall fescue on steer growth and development. Data were collected from Angus-sired crossbreed steers (n = 58). Steers were genotyped based on a mutation (C994G) occurring in the coding sequence of cytochrome P450 3A28. During the stocker phase, steers were assigned, based on their genotype and weaning weight, to pastures containing one of three types of tall fescue. Tall fescue varieties were wild-type endophyte-infected (KY-31), novel endophyte-infected MaxQ, and novel endophyte-infected HiMag 4. Steers were weighed at four dates during the stocker phase. Upon completion of the stocker phase, the steers were sent to a feedlot, implanted with growth promotants, finished for 135 d, and harvested. Novel endophyte varieties were not (P > 0.2) different; therefore, data from those two groups were pooled and compared with KY-31. Steers grazing toxic fescue had lower (P < 0.05) body weights during the last period of the stocker phase, as well as lower overall average daily gain (ADG). Steers that were homozygous for the primary allele (CC) or the minor allele (GG) had lower (P < 0.05) body weights and ADG than the steers that were heterozygous (CG). Steers with GG genotypes numerically had the lowest body weight and ADG regardless of forage type. An interaction (P < 0.01) between cytochrome P450 genotype and forage affected carcass quality grade. Genotype did not alter the percent of carcasses grading USDA Choice when the steers grazed stockpiled non-toxic fescue; however, steers with one or two G alleles grazing stockpiled toxic fescue did not (P < 0.01) grade USDA Choice. Stocker cattle grazing tall fescue may have altered body composition and carcass traits depending on their genetic background.
1 University of Arkansas System Division of Agriculture, Department of Animal Science, Fayetteville, Ark.2 Oklahoma State University, Department of Animal Science, Stillwater, Okla.
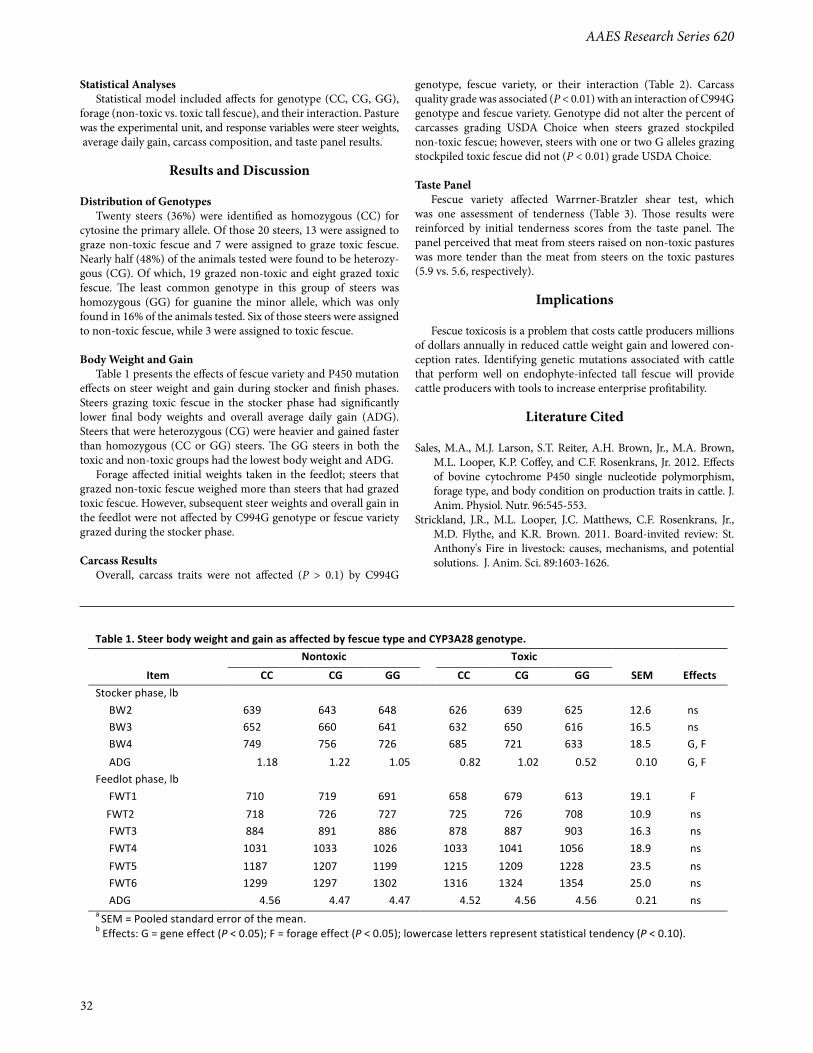
AAES Research Series 620
32
Table 1. Steer body weight and gain as affected by fescue type and CYP3A28 genotype. Nontoxic Toxic
Item CC CG GG CC CG GG SEM Effects Stocker phase, lb BW2 639 643 648 626 639 625 12.6 ns BW3 652 660 641 632 650 616 16.5 ns BW4 749 756 726 685 721 633 18.5 G, F ADG 1.18 1.22 1.05 0.82 1.02 0.52 0.10 G, F Feedlot phase, lb FWT1 710 719 691 658 679 613 19.1 F FWT2 718 726 727 725 726 708 10.9 ns FWT3 884 891 886 878 887 903 16.3 ns FWT4 1031 1033 1026 1033 1041 1056 18.9 ns FWT5 1187 1207 1199 1215 1209 1228 23.5 ns FWT6 1299 1297 1302 1316 1324 1354 25.0 ns ADG 4.56 4.47 4.47 4.52 4.56 4.56 0.21 ns a SEM = Pooled standard error of the mean. b Effects: G = gene effect (P < 0.05); F = forage effect (P < 0.05); lowercase letters represent statistical tendency (P < 0.10).
Statistical AnalysesStatistical model included affects for genotype (CC, CG, GG),
forage (non-toxic vs. toxic tall fescue), and their interaction. Pasture was the experimental unit, and response variables were steer weights, average daily gain, carcass composition, and taste panel results.
Results and Discussion
Distribution of GenotypesTwenty steers (36%) were identified as homozygous (CC) for
cytosine the primary allele. Of those 20 steers, 13 were assigned to graze non-toxic fescue and 7 were assigned to graze toxic fescue. Nearly half (48%) of the animals tested were found to be heterozy-gous (CG). Of which, 19 grazed non-toxic and eight grazed toxic fescue. The least common genotype in this group of steers was homozygous (GG) for guanine the minor allele, which was only found in 16% of the animals tested. Six of those steers were assigned to non-toxic fescue, while 3 were assigned to toxic fescue.
Body Weight and GainTable 1 presents the effects of fescue variety and P450 mutation
effects on steer weight and gain during stocker and finish phases. Steers grazing toxic fescue in the stocker phase had significantly lower final body weights and overall average daily gain (ADG). Steers that were heterozygous (CG) were heavier and gained faster than homozygous (CC or GG) steers. The GG steers in both the toxic and non-toxic groups had the lowest body weight and ADG.
Forage affected initial weights taken in the feedlot; steers that grazed non-toxic fescue weighed more than steers that had grazed toxic fescue. However, subsequent steer weights and overall gain in the feedlot were not affected by C994G genotype or fescue variety grazed during the stocker phase.
Carcass ResultsOverall, carcass traits were not affected (P > 0.1) by C994G
genotype, fescue variety, or their interaction (Table 2). Carcass quality grade was associated (P < 0.01) with an interaction of C994G genotype and fescue variety. Genotype did not alter the percent of carcasses grading USDA Choice when steers grazed stockpiled non-toxic fescue; however, steers with one or two G alleles grazing stockpiled toxic fescue did not (P < 0.01) grade USDA Choice.
Taste PanelFescue variety affected Warrner-Bratzler shear test, which
was one assessment of tenderness (Table 3). Those results were reinforced by initial tenderness scores from the taste panel. The panel perceived that meat from steers raised on non-toxic pastures was more tender than the meat from steers on the toxic pastures (5.9 vs. 5.6, respectively).
Implications
Fescue toxicosis is a problem that costs cattle producers millions of dollars annually in reduced cattle weight gain and lowered con-ception rates. Identifying genetic mutations associated with cattle that perform well on endophyte-infected tall fescue will provide cattle producers with tools to increase enterprise profitability.
Literature Cited
Sales, M.A., M.J. Larson, S.T. Reiter, A.H. Brown, Jr., M.A. Brown, M.L. Looper, K.P. Coffey, and C.F. Rosenkrans, Jr. 2012. Effects of bovine cytochrome P450 single nucleotide polymorphism, forage type, and body condition on production traits in cattle. J. Anim. Physiol. Nutr. 96:545-553.
Strickland, J.R., M.L. Looper, J.C. Matthews, C.F. Rosenkrans, Jr., M.D. Flythe, and K.R. Brown. 2011. Board-invited review: St. Anthony's Fire in livestock: causes, mechanisms, and potential solutions. J. Anim. Sci. 89:1603-1626.
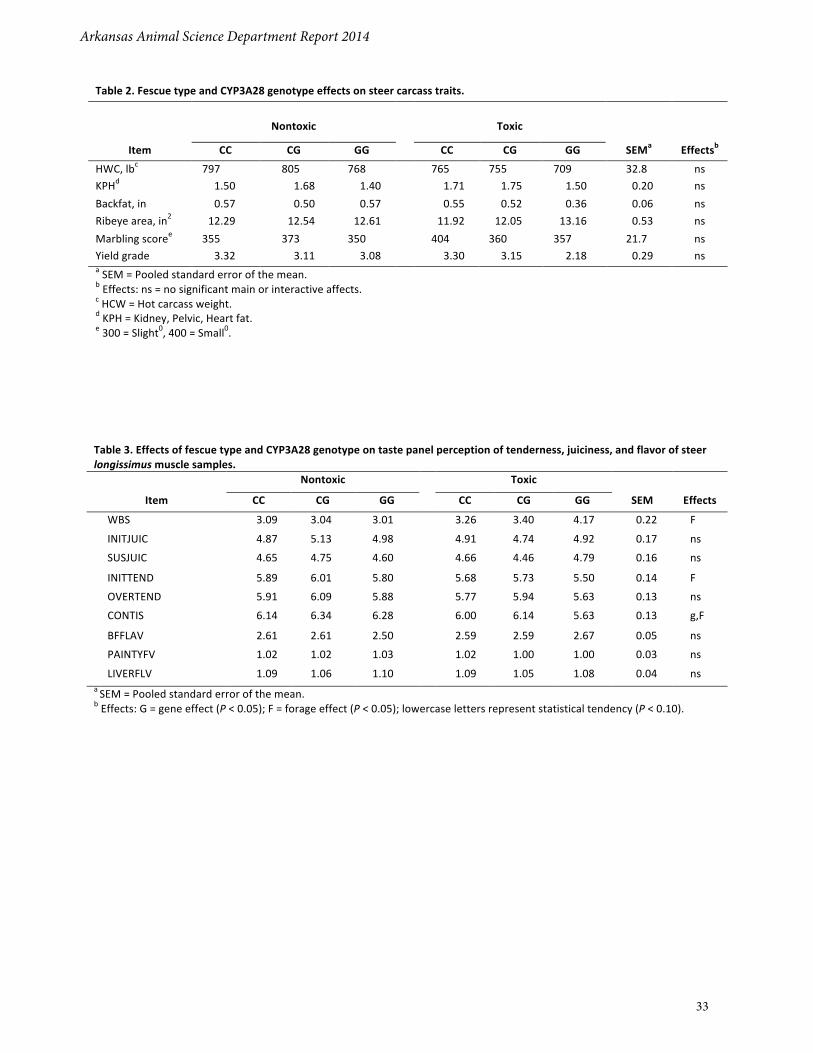
Arkansas Animal Science Department Report 2014
33
Table 2. Fescue type and CYP3A28 genotype effects on steer carcass traits.
Nontoxic
Toxic
Item CC CG GG CC CG GG SEMa Effectsb
HWC, lbc 797 805 768 765 755 709 32.8 ns KPHd 1.50 1.68 1.40 1.71 1.75 1.50 0.20 ns Backfat, in 0.57 0.50 0.57 0.55 0.52 0.36 0.06 ns Ribeye area, in2 12.29 12.54 12.61 11.92 12.05 13.16 0.53 ns Marbling scoree 355 373 350 404 360 357 21.7 ns Yield grade 3.32 3.11 3.08 3.30 3.15 2.18 0.29 ns a SEM = Pooled standard error of the mean. b Effects: ns = no significant main or interactive affects. c HCW = Hot carcass weight. d KPH = Kidney, Pelvic, Heart fat. e 300 = Slight0, 400 = Small0.
Table 3. Effects of fescue type and CYP3A28 genotype on taste panel perception of tenderness, juiciness, and flavor of steer longissimus muscle samples. Nontoxic Toxic
Item CC CG GG CC CG GG SEM Effects
WBS 3.09 3.04 3.01 3.26 3.40 4.17 0.22 F
INITJUIC 4.87 5.13 4.98 4.91 4.74 4.92 0.17 ns
SUSJUIC 4.65 4.75 4.60 4.66 4.46 4.79 0.16 ns
INITTEND 5.89 6.01 5.80 5.68 5.73 5.50 0.14 F
OVERTEND 5.91 6.09 5.88 5.77 5.94 5.63 0.13 ns
CONTIS 6.14 6.34 6.28 6.00 6.14 5.63 0.13 g,F
BFFLAV 2.61 2.61 2.50 2.59 2.59 2.67 0.05 ns
PAINTYFV 1.02 1.02 1.03 1.02 1.00 1.00 0.03 ns
LIVERFLV 1.09 1.06 1.10 1.09 1.05 1.08 0.04 ns a SEM = Pooled standard error of the mean. b Effects: G = gene effect (P < 0.05); F = forage effect (P < 0.05); lowercase letters represent statistical tendency (P < 0.10).
34
Introduction
In the beef cattle industry, calves are often weaned between 6 and 8 months of age. At or soon after weaning, calves are often sold through local auction barns during which time they are exposed to a variety of stressors, increasing susceptibility to infections (Breazile, 1988). Trace mineral status is a nutritional factor that can affect immune response (Wan et al., 1989). Previous research has shown trace minerals from different sources can vary in bioavailability (Wedekind et al., 1992; Kegley and Spears, 1994). In addition, trace minerals supplemented in amino acid complex form have been shown to increase growth performance in shipping-stressed cattle compared to sulfate sources (Kegley et al., 2012). However, trace minerals from hydroxy sources have not been evaluated as a trace mineral supplement in shipping-stressed cattle. Therefore, our objective was to evaluate the effect of trace mineral supplementation from sulfate, organic amino acid complexes, or hydroxy sources on growth performance, morbidity, and immune response to bovine viral diarrhea vaccination in newly received stocker cattle.
Materials and Methods
Three hundred-fifty crossbreed beef calves (89 heifers, 129 steers, and 132 bulls; 528 ± 2.3 lb) were obtained from regional livestock auctions. Calves arrived in 4 shipment sets (block) with arrival dates of February 8 (n = 87), March 1 (n = 88), May 10 (n = 89), and September 26, 2013 (n = 86). Upon arrival, calves were tagged in the left ear with a unique identification number, weighed, ear notched to test for persistent infection with bovine viral diarrhea virus (PI-BVDV), and housed overnight in a holding pen with access to hay and water. The following morning (day 0), calves were vaccinated
with clostridial (Covexin 8, Intervet, Inc., Omaha, Neb.) and viral (Pyramid 5, Boehringer Ingelheim, Ridgefield, Conn.) vaccines, and dewormed (Ivomec Plus, Merial Limited, Duluth, Ga.). Bulls were castrated by banding (California Bander, Inosol Co. LLC, El Centro, Calif.) and all animals were branded. Cattle were weighed to obtain a 2-day average weight.
Within each block of calves, calves were stratified by body weight (BW) and arrival gender into 1 of 8 1.1-acre pens (10 to 12 calves/pen). Pens were assigned randomly to treatment. Treatments consisted of supplemental zinc (360 mg/day), copper (125 mg/day) and manganese (200 mg/day) from sulfate (n = 2 pens/block), organic complexes (Availa 4, Zinpro Corp., Eden Prairie, Minn.; n = 3 pens/block), or hydroxy (IntelliBond, Micronutrients, Indianapolis, Ind.; n = 3 pens/block) trace mineral sources fed over a 42- (block 4) or 45-day (block 1, 2, and 3) backgrounding period. Treatments were administered via grain supplement carrier (Tables 1 and 2) formulated for feeding at 2 lb/day on day 0. When the majority of calves were consuming supplement, the pen was switched to supplements with the appropriate mineral treatment formulated for feeding at 3 lb/day, and then to 4 lb/day of supplement with calves receiving the 4 lb/day diet for the remainder of the trial. During block 1, intake of 2 lb/day and 3 lb/day supplements was not adequate and thus the supplement composition was changed before block 2. Changes in the supplement were formulated so the new supplement (Table 1) was approximately equal in nutrients to original supplement (Table 2). Calves had ad libitum access to bermudagrass hay and water. Samples of supplements and hay were analyzed for dry matter (DM), crude protein by total combustion, and trace minerals by inductively coupled plasma spectroscopy (ICP) after wet ashing (Table 3). Booster vaccinations were administered on day 14.
Supplemental trace minerals (Zn, Cu, and Mn) as sulfates, organic amino acid complexes, or hydroxy trace mineral sources for shipping-stressed calves
A.W. Ryan1, E.B. Kegley1, J. Hawley1, J.A. Hornsby1, J.L. Reynolds1, and S.B. Laudert2
Story in Brief
Our objective was to evaluate the effect of trace mineral supplementation from sulfate, organic amino acid complexes or hydroxy sources on growth performance, morbidity, and immune response to bovine viral diarrhea vaccination in newly received stocker cattle. Three hundred-fifty crossbred calves (528 ± 2.3 lb initial body weight) arrived in 4 sets (block) from regional livestock auctions. Upon arrival, calves were stratified by body weight and gender, and allocated into 1 of 8 pens (10 to 12 calves/pen). Pens were assigned randomly to 1 of 3 treatments consisting of supplemental zinc (360 mg/day), copper (125 mg/day), and manganese (200 mg/day) from sulfate (n = 2 pens/block), organic complexes (Availa 4, Zinpro Corp., Eden Prairie, Minn.; n = 3 pens/block), or hydroxy (IntelliBond, Micronutrients, Indianapolis, Ind.; n = 3 pens/block) trace mineral sources fed over a 42 (block 4) to 45-day (blocks 1, 2, 3) backgrounding period. Cattle were observed daily for signs of morbidity from bovine respiratory disease and treated according to a preplanned protocol if rectal temperature exceeded 104 °F. Serum samples for bovine viral diarrhea antibody titer analysis were obtained on d -1, 14, 28, and final day from the calves in 2 blocks (n = 175). Final body weight and average daily gain did not differ among treatments (P ≥ 0.49). Dietary treatments had no effect on total morbidity, number of antibiotic treatments, average medical cost, or antibody titer response to bovine viral diarrhea vaccination (P ≥ 0.55). Based on results from this experiment, source of trace mineral supplementation did not affect total weight gain, average daily gain, morbidity, medical costs, or antibody titer response to bovine viral diarrhea vaccination during the receiving phase in shipping stressed calves.
1 University of Arkansas System Division of Agriculture, Department of Animal Science, Fayetteville, Ark.2 Micronutrients, Indianapolis, Ind.
Arkansas Animal Science Department Report 2014
35
Cattle were observed daily by trained observers for signs of morbidity from bovine respiratory disease (BRD). Calves were scored and given a clinical illness score of 1 to 5 (Table 4). Calves with a score >1 were brought to a working facility and a rectal temperature was taken. If the rectal temperature was ≥104 ºF, the calf was treated according to predetermined antibiotic protocol (Table 5). Records of antibiotics given, rectal temperature, and day of treatment were kept. Sick animals were returned to their home pen after treatment.
Weights were taken initially and prior to supplement feeding on day 14, 28, 41, and 42 (block 4) or day 16, 30, 44 and 45 (block 1, 2, 3). Average daily gain was calculated based on averages of initial and final weights that were taken on consecutive days. Any feed refusals were collected, weighed, and a subsample frozen for DM analysis. Cattle were bled on day -1 and 42 (block 4) or day 45 (block 1, 2, 3). Plasma was analyzed for zinc and copper via ICP analysis. Cattle in the final 2 blocks were bled for bovine viral diarrhea (BVD) type 1 titers on day -1, 16, 30, and 45 (block 3) or day -1, 14, 28 and 42 (block 4). Serum was sent to Iowa State Veterinary Diagnostic Laboratory for analysis (Iowa State University, Ames, Iowa).
Data were analyzed using the MIXED procedure of SAS (SAS Institute Inc., Cary, N.C.) with treatment used as a fixed effect, block as a random effect, and pen as the experimental unit. Weight, antibody titer response, and plasma trace minerals were analyzed using a repeated statement and the covariance structure variance components (VC); the subject of the repeated statement was pen within block. The LIFETEST procedure was used to compare when calves received their first, second, third, or last antibiotic treatment with calf as the experimental unit.
Results and Discussion
Sixty-two percent of these sale barn calves were deemed morbid and treated for BRD with the initial antibiotic (Table 6). However, dietary treatment had no effect on the number of calves treated once (P = 0.95), twice (P = 0.71), or three times (P = 0.55) for BRD, or on the number of calves classified as chronic (P = 0.81). Chronics were classified as calves having received all three antibiotic treatments and gaining <0.50 lb/d. Dietary treatments also had no effect (P = 0.81) on average antibiotic cost per calf (Table 6). There was no difference among dietary treatments on time when calves received their first, second, third, or last antibiotic treatment (P > 0.89).
For growth performance data, after removal of chronics (n = 6) and animals that died (n = 1), trace mineral source had no effect on d 14, 28, or final weight (P = 0.87) or average daily gain (P ≥ 0.24) in
this trial (Table 7). The decision to remove chronics from the data set was made after observing that the majority of chronics were first treated for BRD on day 1, thus minimizing any dietary effect.
One hundred seventy-five calves were analyzed for BVD type 1 antibody titers. Antibody titer response was compared in all calves and was also compared in the subpopulation that did not have detectable antibodies (naïve) on d -1 (n = 117). Antibody titer response to BVD vaccination (Fig. 1) was not affected by trace mineral source in all cattle (P = 1; treatment × day) or in naïve cattle (P = 0.95; treatment × day).
Trace mineral sources had no effect on plasma copper (P > 0.92) or zinc (P > 0.83) concentration in this study (Table 8). Due to relatively short trial duration and the fact all dietary treatments exceeded the current NRC recommendations (NRC, 2000) for zinc and copper, differences in plasma concentrations of these trace minerals were not anticipated in this trial.
Implications
According to the results from this experiment, trace mineral source had no effect on growth performance, morbidity, average medical cost, or antibody titer response to bovine viral diarrhea vaccination in shipping-stressed cattle over a 42 to 45 day back-grounding phase.
Literature Cited
Breazile, J.E. 1988. The physiology of stress and its relationship to mechanisms of disease and therapeutics. Vet. Clin. North Am. Food Anim. Pract. 4:441-480.
Kegley, E.B. and J.W. Spears. 1994. Bioavailability of feed-grade copper sources (oxide, sulfate, or lysine) in growing cattle. J. Anim. Sci. 72:2728-2734.
Kegley, E.B., M.R. Pass, J.C. Moore and C.K. Larson. 2012. Supplemental trace minerals (zinc, copper, manganese and cobalt) as Availa-4 or inorganic sources for shipping-stressed beef cattle. Prof. Anim. Sci. 28:313-318.
NRC, 2000. National Research Council. Nutrient Requirements of Beef Cattle. 7th rev.ed. Natl. Acad. Press, Washington, D.C.
Wan, J.M. –F., M.P. Haw and G.L. Blackburn. 1989. Nutrition, immune function, and inflammation: An overview. Proc. Nutr. Soc. 48:315-335.
Wedekind, K.J., A.E. Hortin and D.H. Baker. 1992. Methodology for assessing zinc bioavailability: Efficacy estimates for assessing zinc methionine, zinc sulfate, and zinc oxide. J. Anim. Sci. 70:178-187.
AAES Research Series 620
36
Table 1. Ingredient composition of final grain supplements, as fed basis. Fed at 2 lb/day Fed at 3 lb/day Fed at 4 lb/day Ingredient Sulfate Organic Hydroxy Sulfate Organic Hydroxy Sulfate Organic Hydroxy Dried distillers grains with solubles, % 46.2 46.2 46.2 49.6 49.6 49.6 47.2 47.2 47.2 Corn-‐cracked, % 37.8 37.2 37.8 43.2 42.9 43.3 46.5 46.2 46.5 Soybean meal, % 7.7 7.7 7.7 -‐ -‐ -‐ -‐ -‐ -‐ Limetone, % 3.3 3.3 3.3 3.2 3.2 3.2 2.9 2.9 2.9 Molasses, % 2 2 2 2 2 2 2 2 2 Salt, white % 1.7 1.7 1.7 1.1 1.1 1.1 0.9 0.9 0.9 Availa-‐4, g/ton -‐ 6,984 -‐ -‐ 4,668 -‐ -‐ 3,500 -‐ Zinc sulfate (35.5% Zn), g/ton 1012 -‐ -‐ 676 -‐ -‐ 508 -‐ -‐ Manganese sulfate (32% Mn), g/ton 628 -‐ -‐ 418 -‐ -‐ 313 -‐ -‐ Copper sulfate (25.2% Cu), g/ton 492 -‐ -‐ 328 -‐ -‐ 245 -‐ -‐ Intellibond Z, g/ton -‐ -‐ 652 -‐ -‐ 436 -‐ -‐ 349 Intellibond M, g/ton -‐ -‐ 456 -‐ -‐ 304 -‐ -‐ 227 Intellibond C, g/ton -‐ -‐ 212 -‐ -‐ 146 -‐ -‐ 109 Cobalt glucoheptonate (2.5% Co), g/ton
504 -‐ 504 336 -‐ 336 251 -‐ 251
Sodium selenite (0.99% Se), g/ton 100 100 100 68 68 68 50.5 50.5 50.5 Vitamin ADE premixa, % 0.2 0.2 0.2 0.14 0.14 0.14 0.1 0.1 0.1 Vitamin E premixb, % 0.1 0.1 0.1 0.07 0.07 0.07 0.05 0.05 0.05 Rumensin mixc, % 0.8 0.8 0.8 0.54 0.54 0.54 0.4 0.4 0.4 aVitamin ADE premix contains 4,000,000 IU vitamin A, 800,000 IU vitamin D, and 500 IU vitamin E/lb. bVitamin E premix contains 20,000 IU/lb. cTo provide 160 mg monensin/day when supplement fed at listed rate.
Table 2. Ingredient composition of original (Block 1) 2 and 3 lb/day supplements, as fed basis. Fed at 2 lb/day Fed at 3 lb/day Ingredient Sulfate Organic Hydroxy Sulfate Organic Hydroxy Dried distillers grains with solubles, % 84.6 84.6 84.6 59.1 59.1 59.1 Corn-‐cracked, % 6.5 6 6.6 33.6 33.3 33.7 Limetone, % 3.9 3.9 3.9 3.3 3.3 3.3 Molasses, % 2 2 2 2 2 2 Salt, white % 1.7 1.7 1.7 1.1 1.1 1.1 Availa-‐4, g/ton -‐ 6,984 -‐ -‐ 4,668 -‐ Zinc sulfate (35.5% Zn), g/ton 1012 -‐ -‐ 676 -‐ -‐ Manganese sulfate (32% Mn), g/ton 628 -‐ -‐ 418 -‐ -‐ Copper sulfate (25.2% Cu), g/ton 492 -‐ -‐ 328 -‐ -‐ Intellibond Z, g/ton -‐ -‐ 652 -‐ -‐ 436 Intellibond M, g/ton -‐ -‐ 456 -‐ -‐ 304 Intellibond C, g/ton -‐ -‐ 212 -‐ -‐ 146 Cobalt glucoheptonate (2.5% Co), g/ton 504 -‐ 504 336 -‐ 336 Sodium Selenite (0.99% Se), g/ton 100 100 100 68 68 68 Vitamin ADEa premix, % 0.2 0.2 0.2 0.14 0.14 0.14 Vitamin E premixb, % 0.1 0.1 0.1 0.07 0.07 0.07 Rumensin mixc, % 0.8 0.8 0.8 0.54 0.54 0.54 aVitamin ADE premix contains 4,000,000 IU vitamin A, 800,000 IU vitamin D, and 500 IU vitamin E/lb. bVitamin E premix contains 20,000 IU/lb. cTo provide 160 mg monensin/day when supplement fed at listed rate.
Arkansas Animal Science Department Report 2014
37
Table 3. Analyzed nutrient composition of supplements, dry matter (DM) basis.
Fed at 2 lb/day Fed at 3 lb/day Fed at 4 lb/day Nutrient Unit Sulfate Organic Hydroxy Sulfate Organic Hydroxy Sulfate Organic Hydroxy DM % 90 90.2 90.1 90.2 90.2 89.7 90.1 89.8 90 CP % 22 21.1 22.3 19.8 20.5 19.9 20.3 20.6 19.9 NEm
a Mcal/100 lb 94 94 94 95 95 95 96 96 96 NEg
a Mcal/100 lb 65 65 65 65 65 65 66 66 66 Zn mg/kg 415 408 429 248 324 319.8 301 316 316 Mn mg/kg 225 234 249 114 221 183 203 183 174 Cu mg/kg 139 152 140 71 126 98.9 103 122 89.6 Co mg/kg 16.7 15.8 16.5 7.7 13 12.3 10 12.5 10.6 a Values calculated with University of Arkansas Cattle Grower Ration Balancer software. CP = crude protein; NEm = net energy for maintenance; NEg = net energy for gain.
Table 4. Clinical illness scores for calvesa. Score Description Appearance 1 Normal No abnormal signs noted 2 Slightly ill Mild depression, gaunt, +/-‐ ocular/nasal discharge 3 Moderately ill Ocular/nasal discharge, gaunt, lags behind other animals in the group, coughing, labored
breathing, moderate depression, +/-‐ rough hair coat, weight loss 4 Severely ill Severe depression, labored breathing, purulent ocular/nasal discharge, not responsive to
human approach 5 Moribund Near death aModified from clinical assessment score criteria provided by Dr. Dianne Hellwig, DVM. Table 5. Treatment schedule for calves treated for bovine respiratory disease. Therapy 1: Micotil (Elanco Animal Health, Indianapolis, Ind.), 3 mL/100 lb BW subcutaneous in neck
• Check in 72 hours. If clinical illness score > time 0 or ≥2 and rectal temperature in ≥104 °F, then consider treatment a failure and go to Therapy 2, otherwise treatment a success.
Therapy 2: Nuflor (Intervet, Inc., Omaha, Neb.), 6 mL/100 lb BW subcutaneous in neck • Check in 72 hours. If clinical illness score > time 0 or ≥2 and rectal temperature ≥104 °F, then go to Therapy 3
(treatment failure) otherwise consider treatment a success. • Also for animals that recovered from Therapy 1 and relapsed at a later date (<21 days since Therapy 2).
Therapy 3: Excenel (Zoetis, Florham Park, N.J.), 2 mL/100 lb BW subcutaneous in neck • Repeat for 3 consecutive days, if clinical illness score > time 0 score or ≥2 and rectal temperature is ≥104 °F, then
consider treatment a failure, otherwise treatment success. • Also for animals that recovered from Therapy 2 and relapsed at a later date (<21 days since Therapy 2)
If bovine respiratory disease symptoms occur >21 days after administering the previous therapy, then considered a new episode and begin again with Therapy 1.
Table 6. Morbidity from bovine respiratory disease data for cattle supplemented with sulfate, organic complexes or hydroxy trace minerals. Sulfate Organic Hydroxy P-‐value Morbidity, % 60.8 ± 6.6 0.7 ± 5.4 63.0 ± 5.4 0.95 Treated 2X, % 29.6 ± 7.2 21.9 ± 5.8 25.2 ± 5.8 0.71 Treated 3X, % 8.0 ± 2.9 3.9 ± 2.3 5.3 ± 2.3 0.55 Relapsea, % 44.3 ± 0.1 32.9 ± 0.1 39.6 ± 0.1 0.64 Chronic, % 1.1 ± 1.6 1.5 ± 1.3 2.4 ± 1.3 0.81 Medical cost, $/calf 18.66 ± 2.75 16.49 ± 2.24 17.95 ± 2.24 0.81 aRelapse defined as when animal is treated more than once for bovine respiratory disease.
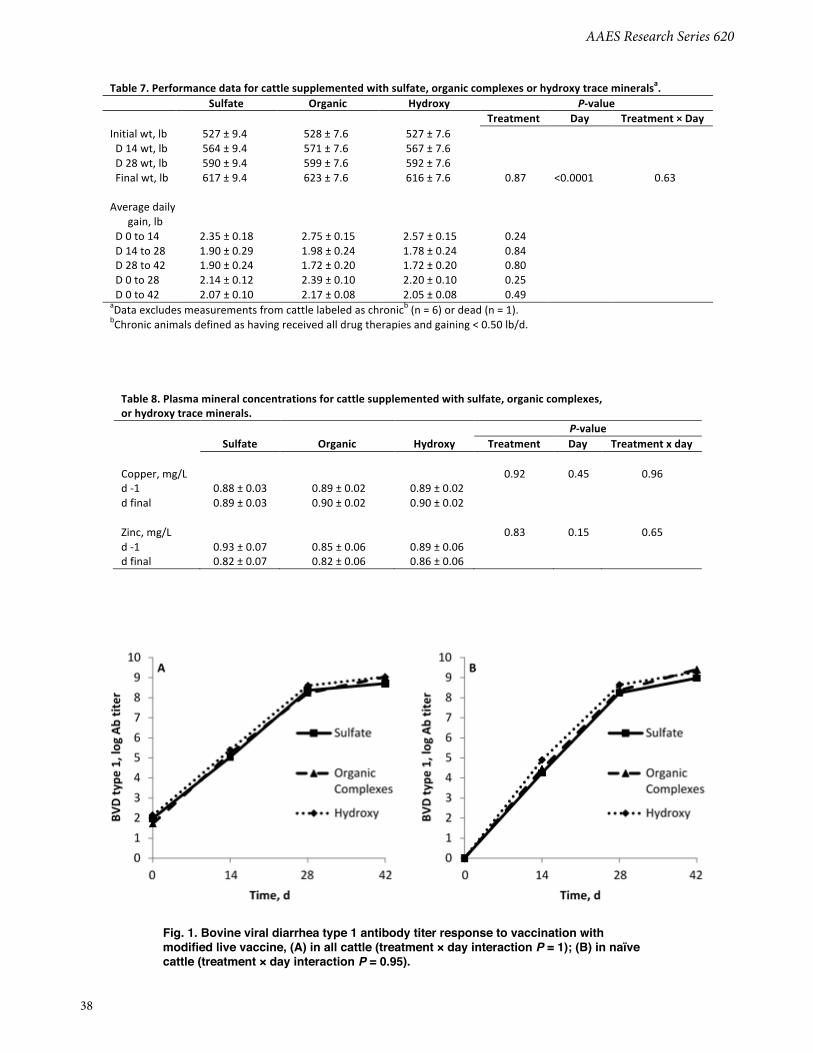
AAES Research Series 620
38
Fig. 1. Bovine viral diarrhea type 1 antibody titer response to vaccination with modified live vaccine, (A) in all cattle (treatment × day interaction P = 1); (B) in naïve cattle (treatment × day interaction P = 0.95).
Table 7. Performance data for cattle supplemented with sulfate, organic complexes or hydroxy trace mineralsa. Sulfate Organic Hydroxy P-‐value Treatment Day Treatment × Day Initial wt, lb 527 ± 9.4 528 ± 7.6 527 ± 7.6 D 14 wt, lb 564 ± 9.4 571 ± 7.6 567 ± 7.6 D 28 wt, lb 590 ± 9.4 599 ± 7.6 592 ± 7.6 Final wt, lb 617 ± 9.4 623 ± 7.6 616 ± 7.6 0.87 <0.0001 0.63 Average daily
gain, lb
D 0 to 14 2.35 ± 0.18 2.75 ± 0.15 2.57 ± 0.15 0.24 D 14 to 28 1.90 ± 0.29 1.98 ± 0.24 1.78 ± 0.24 0.84 D 28 to 42 1.90 ± 0.24 1.72 ± 0.20 1.72 ± 0.20 0.80 D 0 to 28 2.14 ± 0.12 2.39 ± 0.10 2.20 ± 0.10 0.25 D 0 to 42 2.07 ± 0.10 2.17 ± 0.08 2.05 ± 0.08 0.49 aData excludes measurements from cattle labeled as chronicb (n = 6) or dead (n = 1). bChronic animals defined as having received all drug therapies and gaining < 0.50 lb/d. Table 8. Plasma mineral concentrations for cattle supplemented with sulfate, organic complexes, or hydroxy trace minerals. P-‐value Sulfate Organic Hydroxy Treatment Day Treatment x day Copper, mg/L 0.92 0.45 0.96 d -‐1 0.88 ± 0.03 0.89 ± 0.02 0.89 ± 0.02 d final 0.89 ± 0.03 0.90 ± 0.02 0.90 ± 0.02 Zinc, mg/L 0.83 0.15 0.65 d -‐1 0.93 ± 0.07 0.85 ± 0.06 0.89 ± 0.06 d final 0.82 ± 0.07 0.82 ± 0.06 0.86 ± 0.06

39
Introduction
Limit-feeding is a strategy for maintaining cows when hay sup- plies are limited and involves feeding the majority of the diet as concentrate at a level to meet but not exceed the cow’s energy requirements. In limit-feeding scenarios, hay or roughage is pro-vided at minimum amounts in order to maintain rumen function. Frequently, limit-fed cattle are more efficient at maintaining or gain- ing body condition because of the increased digestibility of con-centrates vs. forages, and because of reduced energy losses when concentrates are digested compared with losses when forages are digested. Previous studies evaluating limit-feeding reported no long-term impacts on performance following programs where high- concentrate diets were limit fed to cows but the time required for the rumen to adapt back to an all, or mostly roughage diet has not been reported. Therefore, our objectives were to determine the degree to which limit-fed co-product feedstuffs decreased ruminal forage digestibility and to determine the time necessary for full rumen recovery to steady-state digestive function.
Materials and Methods
Eight ruminally-fistulated cows (1479 ± 70.5 lb body weight; approximately 9 years of age) were used in a 2-period study to evaluate 4 different diets. In each period, cows were stratified by body weight and allocated randomly to 1 of 4 diets (2 cows/diet): 1) limit-fed soybean hulls (LSH), 2) limit-fed distillers’ dried grains with solubles (LDG), 3) limit-fed an isoenergetic mixture of soybean hulls and distillers’ dried grains with solubles (MIX), or 4) provided ad libitum access to hay (HAY). Diets were formulated to meet the metabolizable energy requirements of an 11-month post-partum mature beef cow based on the published nutritional composition of each feedstuff and ground limestone was added to the LDG and MIX diets to equalize dietary Ca concentrations. Cows
receiving limit-fed diets were offered 2 lb hay daily for roughage consumption. Cows on HAY were offered 2 lb of the MIX diet to ensure that ruminal microbial growth was not restricted.
Eight different forages were used to evaluate ruminal recovery time following limit feeding of the co-product diets. Six forages were harvested from the Watershed Research and Education Center at the University of Arkansas, Fayetteville, in October 2012. Forages collected included bermudagrass (BER), crabgrass (CRB), tall fescue (FES), oat (OAT), orchardgrass (ORC), and rescuegrass (RES). Additionally, tall fescue hay (TFH) was collected for use from Lincoln University (Jefferson City, Mo.), and samples of HAY actually offered to the cows as part of their diet was used as a control. Upon collection, forages were immediately frozen at -4 °F until further processing. Forages were dried to a constant weight at 122 °F in a forced-air oven, and ground for further analyses.
Cows were initially housed in 10 × 14 ft pens and offered their respective diets for 19 days for a 2-period digestion study. Following each period, cows were housed on a dormant orchardgrass pasture with ad libitum access to HAY plus 2 lb of MIX daily. On day 5 prior to, and days 0, 7, 14, 21 and 28 following removal from diets in each period, 24 Dacron bags, each containing 0.1 oz of 1 of the 8 test forages were inserted in triplicate into the rumen of each cow for a 48-hour incubation to determine dry matter disappearance (ISD).
Time-series data (ISD across time) were analyzed within forage, using the mixed models procedure of SAS® (SAS Institute, Cary, N.C.). The model included the fixed effects of diet, interval removed from diet and their interaction, and interval was then used as a repeated measurement with cow as the subject. The random statement included cow and period. If a depression in ISD was determined for a diet relative to HAY while the cows were still consuming their particular diets (day -5), time to recovery was determined by regressing ISD against interval from diet removal using JMP® Statistical Discovery Software (SAS Institute, Cary, N.C.). Non-linear regression was used to assess diets reaching a
Ruminal forage digestibility following a period of limit-feeding co-product feedstuffs
W.B. Smith1, K.P. Coffey1, R.T. Rhein1, E.B. Kegley1, D. Philipp1, J.D. Caldwell2 and A.N. Young1
Story in Brief
Concentrate feedstuffs are known to affect forage utilization negatively when offered at higher levels. Our objective was to deter-mine the time necessary for full rumen recovery of forage digestibility following a period of limit-feeding of co-product feedstuffs as the major component of the diet. Eight ruminally-fistulated cows (1479 ± 70.5 lb body weight) were stratified by body weight and allocated randomly to 1 of 4 diets in a 2-period study: 1) limit-fed soybean hulls (LSH), 2) limit-fed distillers’ dried grains with solubles (LDG), 3) limit-fed an equal mixture of the two (MIX), or 4) ad libitum mixed-grass hay (HAY). On day 5 prior to, and days 0, 7, 14, 21 and 28 following removal from diets, each of 8 test forages (bermudagrass, crabgrass, tall fescue, oat, orchardgrass, rescuegrass, HAY and tall fescue hay) were inserted in triplicate Dacron bags into the rumen of each cow for a 48-hour incubation period. In situ dry matter disappearance was plotted against days from diet removal to predict days required for the rumen to recover to baseline ruminal forage digestibility. Recovery time tended to be less (P = 0.08) from LSH than LDG for bermudagrass, and recovery rate tended to be greater (P = 0.06) from LDG than LSH for orchardgrass, but did not differ (P ≥ 0.14) between diets for other forages. Therefore, cows may be limit-fed co-product feedstuffs as a majority feed source without significant short or long-term negative impacts on subsequent forage digestibility.
1 University of Arkansas System Division of Agriculture, Department of Animal Science, Fayetteville, Ark.2 Lincoln University, Department of Agriculture and Environmental Sciences, Jefferson City, Mo.
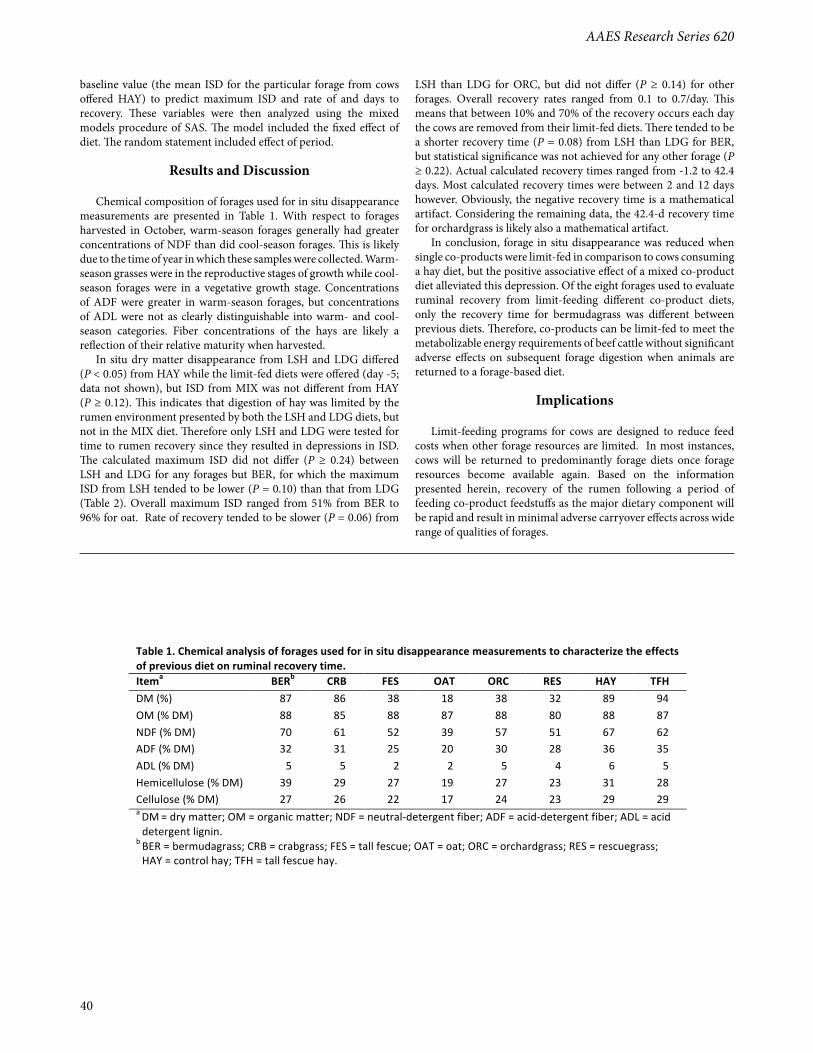
AAES Research Series 620
40
[1]
Table 1. Chemical analysis of forages used for in situ disappearance measurements to characterize the effects of previous diet on ruminal recovery time. Itema BERb CRB FES OAT ORC RES HAY TFH DM (%) 87 86 38 18 38 32 89 94 OM (% DM) 88 85 88 87 88 80 88 87 NDF (% DM) 70 61 52 39 57 51 67 62 ADF (% DM) 32 31 25 20 30 28 36 35 ADL (% DM) 5 5 2 2 5 4 6 5 Hemicellulose (% DM) 39 29 27 19 27 23 31 28 Cellulose (% DM) 27 26 22 17 24 23 29 29 a DM = dry matter; OM = organic matter; NDF = neutral-‐detergent fiber; ADF = acid-‐detergent fiber; ADL = acid detergent lignin.
b BER = bermudagrass; CRB = crabgrass; FES = tall fescue; OAT = oat; ORC = orchardgrass; RES = rescuegrass; HAY = control hay; TFH = tall fescue hay.
baseline value (the mean ISD for the particular forage from cows offered HAY) to predict maximum ISD and rate of and days to recovery. These variables were then analyzed using the mixed models procedure of SAS. The model included the fixed effect of diet. The random statement included effect of period.
Results and Discussion
Chemical composition of forages used for in situ disappearance measurements are presented in Table 1. With respect to forages harvested in October, warm-season forages generally had greater concentrations of NDF than did cool-season forages. This is likely due to the time of year in which these samples were collected. Warm-season grasses were in the reproductive stages of growth while cool-season forages were in a vegetative growth stage. Concentrations of ADF were greater in warm-season forages, but concentrations of ADL were not as clearly distinguishable into warm- and cool-season categories. Fiber concentrations of the hays are likely a reflection of their relative maturity when harvested.
In situ dry matter disappearance from LSH and LDG differed (P < 0.05) from HAY while the limit-fed diets were offered (day -5; data not shown), but ISD from MIX was not different from HAY (P ≥ 0.12). This indicates that digestion of hay was limited by the rumen environment presented by both the LSH and LDG diets, but not in the MIX diet. Therefore only LSH and LDG were tested for time to rumen recovery since they resulted in depressions in ISD. The calculated maximum ISD did not differ (P ≥ 0.24) between LSH and LDG for any forages but BER, for which the maximum ISD from LSH tended to be lower (P = 0.10) than that from LDG (Table 2). Overall maximum ISD ranged from 51% from BER to 96% for oat. Rate of recovery tended to be slower (P = 0.06) from
LSH than LDG for ORC, but did not differ (P ≥ 0.14) for other forages. Overall recovery rates ranged from 0.1 to 0.7/day. This means that between 10% and 70% of the recovery occurs each day the cows are removed from their limit-fed diets. There tended to be a shorter recovery time (P = 0.08) from LSH than LDG for BER, but statistical significance was not achieved for any other forage (P ≥ 0.22). Actual calculated recovery times ranged from -1.2 to 42.4 days. Most calculated recovery times were between 2 and 12 days however. Obviously, the negative recovery time is a mathematical artifact. Considering the remaining data, the 42.4-d recovery time for orchardgrass is likely also a mathematical artifact.
In conclusion, forage in situ disappearance was reduced when single co-products were limit-fed in comparison to cows consuming a hay diet, but the positive associative effect of a mixed co-product diet alleviated this depression. Of the eight forages used to evaluate ruminal recovery from limit-feeding different co-product diets, only the recovery time for bermudagrass was different between previous diets. Therefore, co-products can be limit-fed to meet the metabolizable energy requirements of beef cattle without significant adverse effects on subsequent forage digestion when animals are returned to a forage-based diet.
Implications
Limit-feeding programs for cows are designed to reduce feed costs when other forage resources are limited. In most instances, cows will be returned to predominantly forage diets once forage resources become available again. Based on the information presented herein, recovery of the rumen following a period of feeding co-product feedstuffs as the major dietary component will be rapid and result in minimal adverse carryover effects across wide range of qualities of forages.
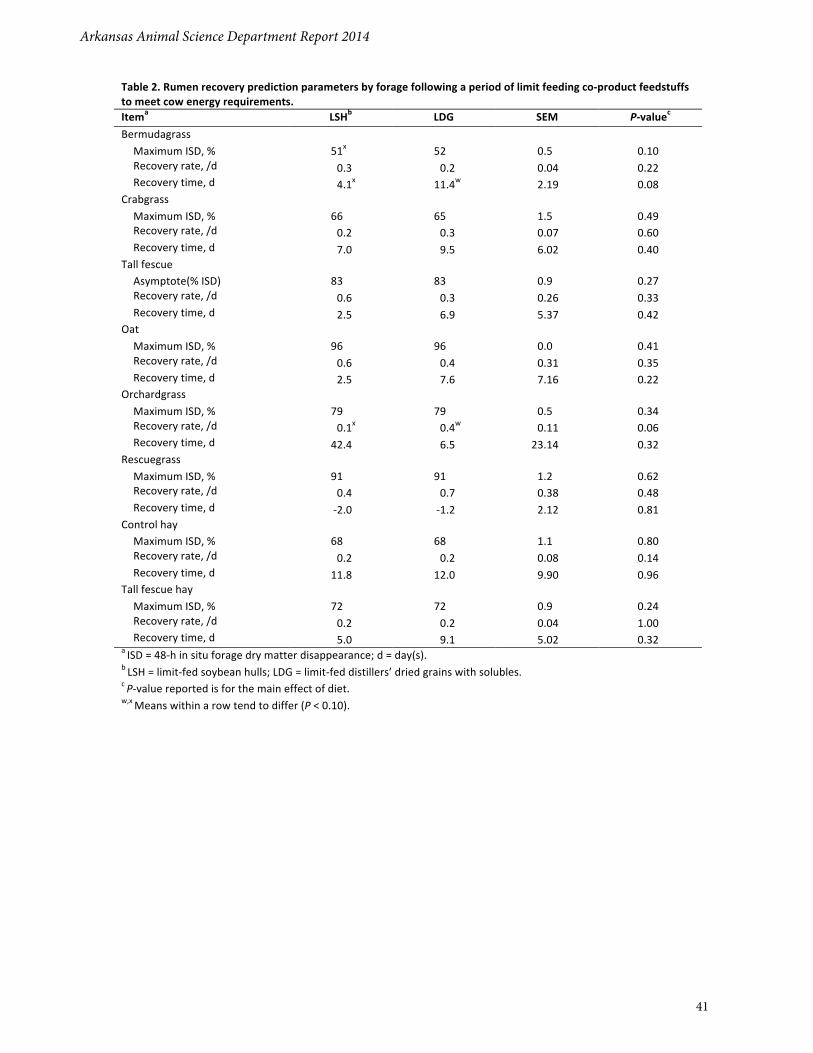
Arkansas Animal Science Department Report 2014
41
[2]
Table 2. Rumen recovery prediction parameters by forage following a period of limit feeding co-‐product feedstuffs to meet cow energy requirements. Itema LSHb LDG SEM P-‐valuec
Bermudagrass
Maximum ISD, % 51x 52 0.5 0.10 Recovery rate, /d 0.3 0.2 0.04 0.22 Recovery time, d 4.1x 11.4w 2.19 0.08
Crabgrass
Maximum ISD, % 66 65 1.5 0.49 Recovery rate, /d 0.2 0.3 0.07 0.60 Recovery time, d 7.0 9.5 6.02 0.40
Tall fescue
Asymptote(% ISD) 83 83 0.9 0.27 Recovery rate, /d 0.6 0.3 0.26 0.33 Recovery time, d 2.5 6.9 5.37 0.42
Oat
Maximum ISD, % 96 96 0.0 0.41 Recovery rate, /d 0.6 0.4 0.31 0.35 Recovery time, d 2.5 7.6 7.16 0.22
Orchardgrass
Maximum ISD, % 79 79 0.5 0.34 Recovery rate, /d 0.1x 0.4w 0.11 0.06 Recovery time, d 42.4 6.5 23.14 0.32
Rescuegrass
Maximum ISD, % 91 91 1.2 0.62 Recovery rate, /d 0.4 0.7 0.38 0.48 Recovery time, d -‐2.0 -‐1.2 2.12 0.81
Control hay Maximum ISD, % 68 68 1.1 0.80 Recovery rate, /d 0.2 0.2 0.08 0.14 Recovery time, d 11.8 12.0 9.90 0.96
Tall fescue hay Maximum ISD, % 72 72 0.9 0.24 Recovery rate, /d 0.2 0.2 0.04 1.00 Recovery time, d 5.0 9.1 5.02 0.32
a ISD = 48-‐h in situ forage dry matter disappearance; d = day(s). b LSH = limit-‐fed soybean hulls; LDG = limit-‐fed distillers’ dried grains with solubles. c P-‐value reported is for the main effect of diet. w,x Means within a row tend to differ (P < 0.10).
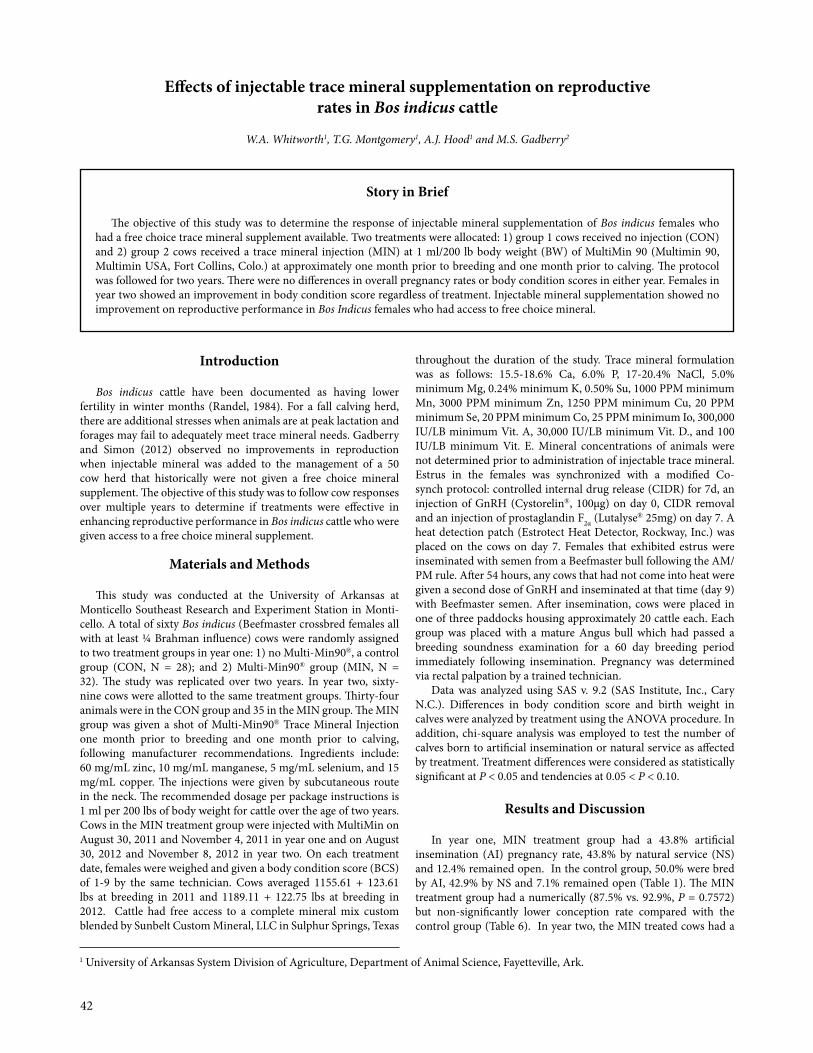
42
Introduction
Bos indicus cattle have been documented as having lower fertility in winter months (Randel, 1984). For a fall calving herd, there are additional stresses when animals are at peak lactation and forages may fail to adequately meet trace mineral needs. Gadberry and Simon (2012) observed no improvements in reproduction when injectable mineral was added to the management of a 50 cow herd that historically were not given a free choice mineral supplement. The objective of this study was to follow cow responses over multiple years to determine if treatments were effective in enhancing reproductive performance in Bos indicus cattle who were given access to a free choice mineral supplement.
Materials and Methods
This study was conducted at the University of Arkansas at Monticello Southeast Research and Experiment Station in Monti-cello. A total of sixty Bos indicus (Beefmaster crossbred females all with at least ¼ Brahman influence) cows were randomly assigned to two treatment groups in year one: 1) no Multi-Min90®, a control group (CON, N = 28); and 2) Multi-Min90® group (MIN, N = 32). The study was replicated over two years. In year two, sixty-nine cows were allotted to the same treatment groups. Thirty-four animals were in the CON group and 35 in the MIN group. The MIN group was given a shot of Multi-Min90® Trace Mineral Injection one month prior to breeding and one month prior to calving, following manufacturer recommendations. Ingredients include: 60 mg/mL zinc, 10 mg/mL manganese, 5 mg/mL selenium, and 15 mg/mL copper. The injections were given by subcutaneous route in the neck. The recommended dosage per package instructions is 1 ml per 200 lbs of body weight for cattle over the age of two years. Cows in the MIN treatment group were injected with MultiMin on August 30, 2011 and November 4, 2011 in year one and on August 30, 2012 and November 8, 2012 in year two. On each treatment date, females were weighed and given a body condition score (BCS) of 1-9 by the same technician. Cows averaged 1155.61 + 123.61 lbs at breeding in 2011 and 1189.11 + 122.75 lbs at breeding in 2012. Cattle had free access to a complete mineral mix custom blended by Sunbelt Custom Mineral, LLC in Sulphur Springs, Texas
throughout the duration of the study. Trace mineral formulation was as follows: 15.5-18.6% Ca, 6.0% P, 17-20.4% NaCl, 5.0% minimum Mg, 0.24% minimum K, 0.50% Su, 1000 PPM minimum Mn, 3000 PPM minimum Zn, 1250 PPM minimum Cu, 20 PPM minimum Se, 20 PPM minimum Co, 25 PPM minimum Io, 300,000 IU/LB minimum Vit. A, 30,000 IU/LB minimum Vit. D., and 100 IU/LB minimum Vit. E. Mineral concentrations of animals were not determined prior to administration of injectable trace mineral. Estrus in the females was synchronized with a modified Co-synch protocol: controlled internal drug release (CIDR) for 7d, an injection of GnRH (Cystorelin®, 100µg) on day 0, CIDR removal and an injection of prostaglandin F2α (Lutalyse® 25mg) on day 7. A heat detection patch (Estrotect Heat Detector, Rockway, Inc.) was placed on the cows on day 7. Females that exhibited estrus were inseminated with semen from a Beefmaster bull following the AM/PM rule. After 54 hours, any cows that had not come into heat were given a second dose of GnRH and inseminated at that time (day 9) with Beefmaster semen. After insemination, cows were placed in one of three paddocks housing approximately 20 cattle each. Each group was placed with a mature Angus bull which had passed a breeding soundness examination for a 60 day breeding period immediately following insemination. Pregnancy was determined via rectal palpation by a trained technician.
Data was analyzed using SAS v. 9.2 (SAS Institute, Inc., Cary N.C.). Differences in body condition score and birth weight in calves were analyzed by treatment using the ANOVA procedure. In addition, chi-square analysis was employed to test the number of calves born to artificial insemination or natural service as affected by treatment. Treatment differences were considered as statistically significant at P < 0.05 and tendencies at 0.05 < P < 0.10.
Results and Discussion
In year one, MIN treatment group had a 43.8% artificial insemination (AI) pregnancy rate, 43.8% by natural service (NS) and 12.4% remained open. In the control group, 50.0% were bred by AI, 42.9% by NS and 7.1% remained open (Table 1). The MIN treatment group had a numerically (87.5% vs. 92.9%, P = 0.7572) but non-significantly lower conception rate compared with the control group (Table 6). In year two, the MIN treated cows had a
Effects of injectable trace mineral supplementation on reproductive rates in Bos indicus cattle
W.A. Whitworth1, T.G. Montgomery1, A.J. Hood1 and M.S. Gadberry2
Story in Brief
The objective of this study was to determine the response of injectable mineral supplementation of Bos indicus females who had a free choice trace mineral supplement available. Two treatments were allocated: 1) group 1 cows received no injection (CON) and 2) group 2 cows received a trace mineral injection (MIN) at 1 ml/200 lb body weight (BW) of MultiMin 90 (Multimin 90, Multimin USA, Fort Collins, Colo.) at approximately one month prior to breeding and one month prior to calving. The protocol was followed for two years. There were no differences in overall pregnancy rates or body condition scores in either year. Females in year two showed an improvement in body condition score regardless of treatment. Injectable mineral supplementation showed no improvement on reproductive performance in Bos Indicus females who had access to free choice mineral.
1 University of Arkansas System Division of Agriculture, Department of Animal Science, Fayetteville, Ark.
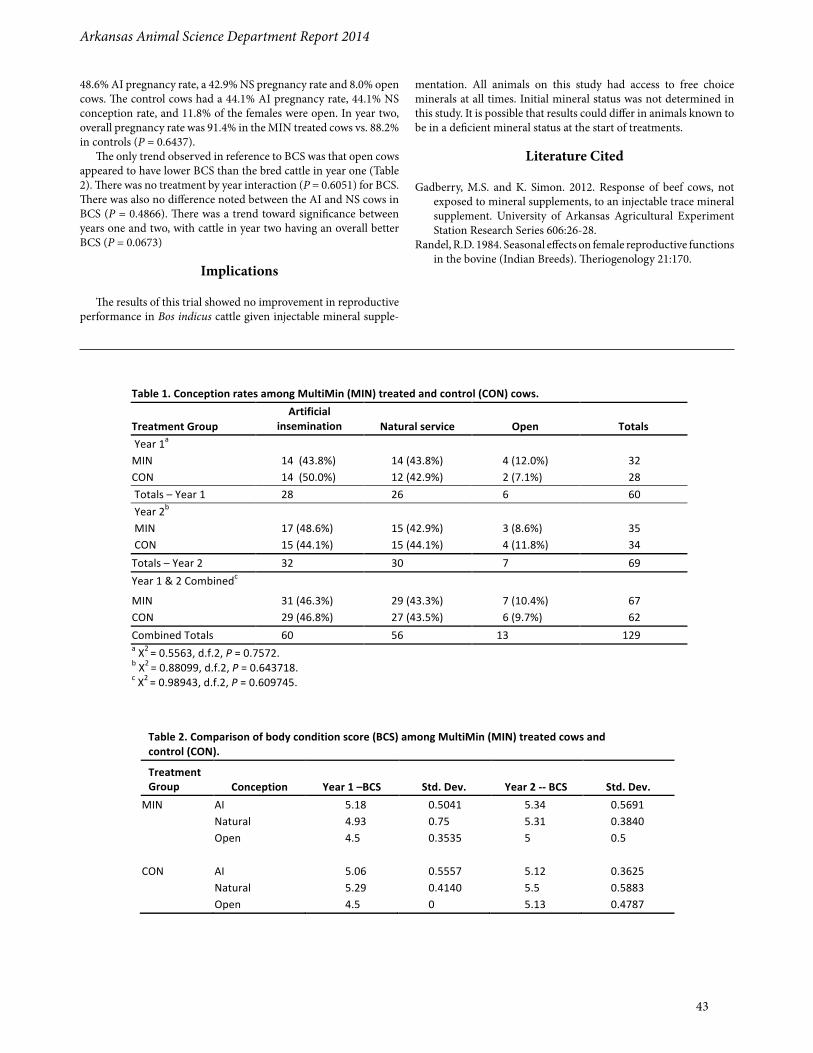
Arkansas Animal Science Department Report 2014
43
48.6% AI pregnancy rate, a 42.9% NS pregnancy rate and 8.0% open cows. The control cows had a 44.1% AI pregnancy rate, 44.1% NS conception rate, and 11.8% of the females were open. In year two, overall pregnancy rate was 91.4% in the MIN treated cows vs. 88.2% in controls (P = 0.6437).
The only trend observed in reference to BCS was that open cows appeared to have lower BCS than the bred cattle in year one (Table 2). There was no treatment by year interaction (P = 0.6051) for BCS. There was also no difference noted between the AI and NS cows in BCS (P = 0.4866). There was a trend toward significance between years one and two, with cattle in year two having an overall better BCS (P = 0.0673)
Implications
The results of this trial showed no improvement in reproductive performance in Bos indicus cattle given injectable mineral supple-
mentation. All animals on this study had access to free choice minerals at all times. Initial mineral status was not determined in this study. It is possible that results could differ in animals known to be in a deficient mineral status at the start of treatments.
Literature Cited
Gadberry, M.S. and K. Simon. 2012. Response of beef cows, not exposed to mineral supplements, to an injectable trace mineral supplement. University of Arkansas Agricultural Experiment Station Research Series 606:26-28.
Randel, R.D. 1984. Seasonal effects on female reproductive functions in the bovine (Indian Breeds). Theriogenology 21:170.
Table 1. Conception rates among MultiMin (MIN) treated and control (CON) cows.
Treatment Group Artificial
insemination Natural service Open Totals Year 1a MIN 14 (43.8%) 14 (43.8%) 4 (12.0%) 32 CON 14 (50.0%) 12 (42.9%) 2 (7.1%) 28 Totals – Year 1 28 26 6 60 Year 2b MIN 17 (48.6%) 15 (42.9%) 3 (8.6%) 35 CON 15 (44.1%) 15 (44.1%) 4 (11.8%) 34 Totals – Year 2 32 30 7 69 Year 1 & 2 Combinedc MIN 31 (46.3%) 29 (43.3%) 7 (10.4%) 67 CON 29 (46.8%) 27 (43.5%) 6 (9.7%) 62 Combined Totals 60 56 13 129 a X2 = 0.5563, d.f.2, P = 0.7572. b X2 = 0.88099, d.f.2, P = 0.643718. c X2 = 0.98943, d.f.2, P = 0.609745.
Table 2. Comparison of body condition score (BCS) among MultiMin (MIN) treated cows and control (CON). Treatment Group Conception Year 1 –BCS Std. Dev. Year 2 -‐-‐ BCS Std. Dev.
MIN AI 5.18 0.5041 5.34 0.5691 Natural 4.93 0.75 5.31 0.3840 Open 4.5 0.3535 5 0.5 CON AI 5.06 0.5557 5.12 0.3625 Natural 5.29 0.4140 5.5 0.5883 Open 4.5 0 5.13 0.4787
44
Introduction
Teff grass is warm-season annual forage recently introduced in the United States from Ethiopia and Eriterea. Teff grass has al-ready gained popularity in the western United States as a horse forage, especially as a forage for horses with metabolic disorders and obesity. Teff grass does not mature as rapidly as bermudagrass and does not have any observed insect problems. However, to be a contender as a replacement of bermudagrass or alfalfa hay, teff grass must first be established as a forage that horses will willingly con-sume. The purpose of this study is to determine the palatability of teff grass relative to that of bermudagrass harvested at different maturities.
Materials and Methods
Teff grass (T) was planted at the University of Arkansas Water- shed Research and Education Center (WREC) according to recom- mended practices on May 29, 2013. A comparable field of ber-mudagrass (B), a perennial warm-season grass, was also chosen to provide B hays for comparison with T. The field of B was harvested June 15 and baled for hay to initiate the regrowth process in an attempt to have both forages reaching comparable maturities under similar growing conditions. Both B and T were harvested beginning in late June. The forages included in the study were: T harvested at the late vegetative stage (TLV), T harvested at late bloom but that incurred 1.3 inches of rainfall between mowing and baling (TLBR), T harvested at the early seed stage when seeds were visible but not starting to fill yet (TES), T harvested when the seeds were at soft dough (TSD), B harvested at the late vegetative stage (BLV) and B harvested at the mid-bloom (BMB) growth stage. All forages were allowed to dry in the field to a maximum of 20% moisture and packaged in small-rectangular bales. All bales were stored inside a metal enclosed shed until subsequent feeding.
Five mature horses (1127 ± 38.4 lb body weight (BW)), 2 to 10 yr of age, were housed individually in stalls (12 × 12 ft) at the Dorothy E. King Equine facility for a 12-d adaptation period followed by a 6-d forage preference evaluation. During the adaption period, the horses were offered midbloom bermudagrass and teff grass harvested the previous year. Initially horses were offered 1% of their body weight of each forage divided equally into 2 hay bags. This resulted in a total of 2% of body weight from each forage offered in 4 different hay bags. The bags were placed at random in each corner of their stall, and the amount offered increased daily based on consumption. Triangular tarps were suspended beneath each hay bag to catch forage that was pulled from the bags but not consumed. The average daily dry matter (DM) consumption for each horse was determined during the last 5 d of the adaptation period.
The preference portion of the experiment immediately followed the adaptation period and continued for 6 days. During this period, each horse offered a total of 4 of the 6 forages each day such that each forage was offered to each horse a total of 4 times during the 6-d period and each forage was offered in combination with each other forage at least twice. Each horse had a different combination of 4 forages from each other horse, and the combinations were changed daily based on the experimental design (Fig. 1). In order to account for any idiosyncrasies, a number of factors were considered and randomized. First, horses were allocated to a different stall each day such that each horse was housed in each stall at least one day during the study and in only 1 stall a second time. Secondly, the specific corner in which a particular forage was offered was randomized such that the particular forage was offered in all 4 corners of a stall for each individual horse. Each forage was offered at a rate of one-half of the total average daily consumption during the last 5 d of the adaptation period. This is done to ensure that the horses selected from and established a preference ranking for at least two of the forages each day. For example, if the total consumption of both B and T by horse “X” was 20 lb during the
Palatability of teff grass by horses
R. Cummins1, K. Coffey1, N. Jack1, K. Jogan1, R. Rhein1, D. Philipp1, M. Adams2, W. Smith1, K. Clayton1, and A. Young1
Story in Brief
Most forages commonly used to feed horses have potential detriments including blister beetles or excessive fiber concentrations. Teff grass (T), a warm-season annual forage, has the potential to be a good alternative for horses because of its lack of observed disorders. Our objective was to compare preference by horses for T harvested under different conditions with that of bermudagrass (B) harvested at two maturities. Six different forages were evaluated: T harvested at the late vegetative stage (TLV), T at late bloom but that incurred 1.3 inches of rainfall between mowing and baling (TLBR), T at early seed formation (TES), or T at soft dough (TSD), and B harvested at late vegetative (BLV) and mid-bloom (BMB) growth stages. Five mature horses were used in a study where each horse received a different combination of 4 forages each day for 6 d. The 4 different forages were suspended in hay nets in each corner of each stall, and each hay was offered at 50% of the average daily hay consumption measured during a 10-d adaptation period. Forage preference as measured by individual forage dry matter (DM) consumption (lb and % of total DM consumed across the 4 forages) was greatest (P < 0.05) from TLV followed by BLV. Preference (lb and % of total DM consumed) of BMB was greater (P < 0.05) than that of TMBR, TES, and TSD, which did not differ from each other (P ≥ 0.63). Therefore, within a specific growth stage, horses apparently preferred teff grass, but effects of maturity and rainfall had a more dramatic effect on preference by horses than forage species.
1 University of Arkansas System Division of Agriculture, Department of Animal Science, Fayetteville, Ark.2 May 2014 graduate, Scotland's Rural College (SRUC)--Riverside Campus, Ayre, Scotland.
Arkansas Animal Science Department Report 2014
45
last 5 d of the adaptation period, then horse “X” was offered 10 lb of each of the 4 experimental forages.
Horses were given 2-h exercise periods twice daily in the morning at 6:30 AM and in the evening at 7:30 PM. During the morning exercise period, rejected hay was removed and weighed and new forages were placed in the stalls. Each stall door also had a fan to ensure horses were not overheated. Stalls were bedded in sand and cleaned twice daily. No grain was offered during the adaptation period or trial period. Horses had unlimited access to water, even during the exercise periods.
Samples of each hay were taken daily at the time the hay bags were filled and were dried to a constant weight at 122 °F. Unconsumed hay was collected daily, weighed, and a representative sample was dried to a constant weight at 122 °F. Hay samples from each forage were maintained separately for each day, ground and analyzed for neutral-detergent fiber (NDF), acid-detergent fiber (ADF), and acid-detergent lignin (ADL).
Consumption data were analyzed using PROC GLM of SAS (SAS Institute, Cary, N.C.). The model included the effects of horse, forage, day, stall, and corner. The effect of stall was included to ensure that location in the barn was not having an effect. The effect of corner was included to determine if horses preferred to consume forages out of a favorite corner. Stall affected (P < 0.05) each of the consumption measurements, but corner and day of study did not (P ≥ 0.56) affect any of the consumption measurements. Therefore the final consumption model included effects of forage, stall, and horse. Means are reported as least-squares means. Pearson correla-tion coefficients were also determined among consumption measure- ments and forage quality analyses using PROC CORR of SAS. The forage quality measurements from each forage on each individual day were matched with consumption of that particular forage on a given day for correlation analyses.
Results and Discussion
Weather data affecting the forages in the present study are presented in Table 1. When compared with the 30-yr averages, May of 2013 was relatively wet. This delayed the planting of the teff grass. June of 2013 was unusually dry, which allowed the late vegetative forages to be baled under ideal conditions. However, the dry June also led to issues with growing the later maturities of the forages. Our original intention was to have 3 different maturities each of B and T. However, due to the slow growth rate and field size limitations, we were only able to harvest 2 maturities of B. August of 2013 had a greater rainfall compared with the 30-yr average, which delayed the baling of TLBR, TES and TSD. The TLBR also incurred 1.3 in of rain damage between mowing and baling.
Forage quality measurements are presented in Table 2. The NDF concentration of TES, TSD and TLBR were not different (P ≥ 0.40) from each other, but were greater (P < 0.05) than the NDF
concentrations of the other forages. The NDF concentrations of BMB and BLV were greater (P < 0.05) than those of TLV. The greater NDF concentration of TLBR suggests that the rain damage removed soluble components, resulting in NDF concentrations similar to that of the more mature forages. The TES and TSD forages also had the greatest (P < 0.05) ADF concentrations. These were followed by TLBR (P < 0.05). The two maturities of bermudagrass and TLV were not different from each other (P ≥ 0.14), and had the lowest (P < 0.05) ADF concentrations. Lignin concentrations of TES, TSD and TLBR were greater (P < 0.05) than those from BLV and TLV. Lignin concentrations of TSD and TLBR are also not different (P ≥ 0.18) from the lignin concentrations of TES or BMB.
Preference of the different hays by horses was expressed in three ways: lb of dry matter consumed per day (lb/d; Fig. 2), the amount of each forage consumed as a percentage of the amount of that particular forage offered (% of DM offered; Fig. 3), and the amount of each forage consumed as a percentage of the total DM intake by each horse (% of DM intake; Fig. 4). Preference (lb/d) was greatest (P < 0.05) for TLV followed by BLV (P < 0.05). The least preferred (P < 0.05) forages were TLBR, TES and TSD. The low preference for TLBR, and the fact that the preference for TLBR was not different (P ≥ 0.63) from that of TES and TSD suggests that the rainfall was just as damaging to preference as the increased maturity of TES and TSD. Preference expressed as a percentage of the total amount of the particular forage offered daily was greatest (P < 0.05) for BLV and TLV. The later maturities of T including TLBR were the least preferred forages (P < 0.05). This again suggests that the rainfall on TLBR was just as damaging to preference as increasing maturity. Preference expressed as a percentage of the total DM intake was greatest (P < 0.05) for TLV. Consumption of TLV was slightly above 50% of the DM intake for horses, which suggests that horses consumed all of the TLV offered, since each forage was offered at half of the estimated average daily consumption. Preference was least (P < 0.05) for TLBR, TES and TSD, once again suggesting that rain damage and advanced maturity are equally detrimental to preference by horses.
Forage concentrations of NDF and ADF were both highly and negatively correlated with preference (r ≤ -0.72; P < 0.05; Table 3). Lignin content was also highly and negatively correlated with preference (P < 0.05), but not as highly correlated as NDF and ADF (r ≤ -0.55). Hemicellulose content was not correlated with preference (P ≥ 0.11).
Implications
Teff grass appears to be palatable to horses if harvested at a vegetative growth stage, but forage maturity and rain damage are more important factors affecting palatability than forage species. Neutral and acid-detergent fiber concentrations appear to be good, but negative predictors of hay palatability by horses.
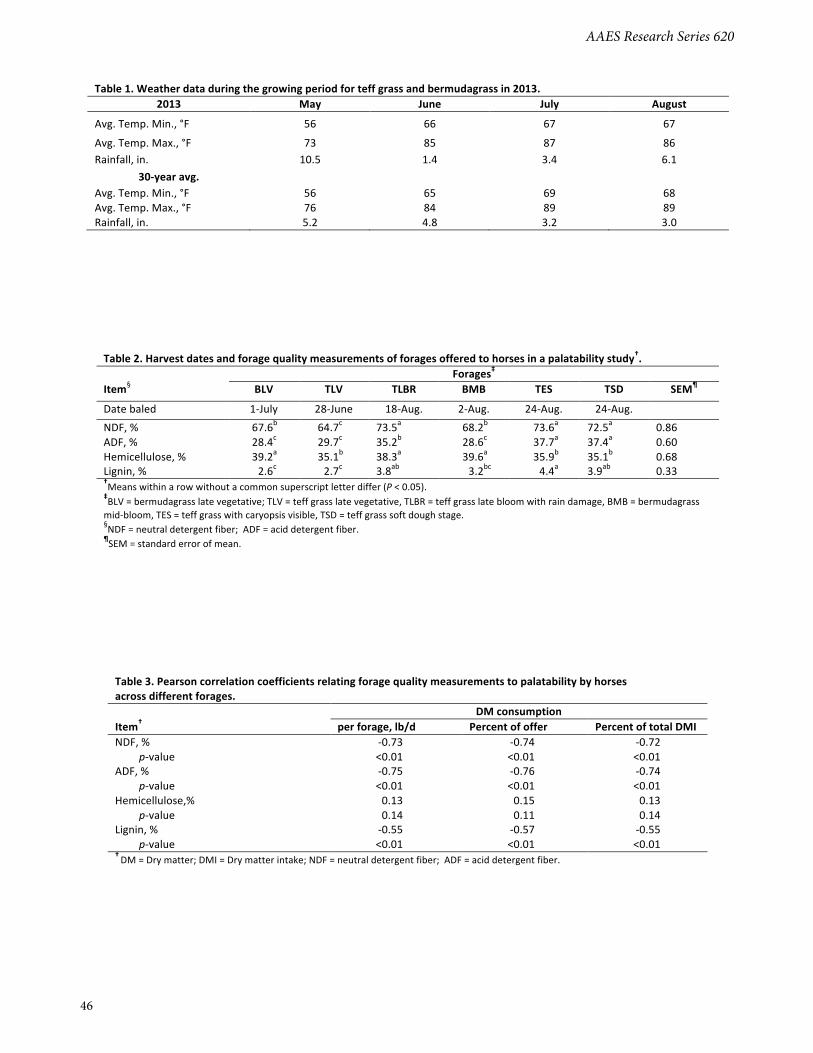
AAES Research Series 620
46
1
Table 1. Weather data during the growing period for teff grass and bermudagrass in 2013. 2013 May June July August
Avg. Temp. Min., °F 56 66 67 67
Avg. Temp. Max., °F 73 85 87 86 Rainfall, in. 10.5 1.4 3.4 6.1
30-‐year avg. Avg. Temp. Min., °F 56 65 69 68
Avg. Temp. Max., °F 76 84 89 89 Rainfall, in. 5.2 4.8 3.2 3.0
2
Table 2. Harvest dates and forage quality measurements of forages offered to horses in a palatability study†. Forages‡ Item§ BLV TLV TLBR BMB TES TSD SEM¶
Date baled 1-‐July 28-‐June 18-‐Aug. 2-‐Aug. 24-‐Aug. 24-‐Aug. NDF, % 67.6b 64.7c 73.5a 68.2b 73.6a 72.5a 0.86 ADF, % 28.4c 29.7c 35.2b 28.6c 37.7a 37.4a 0.60 Hemicellulose, % 39.2a 35.1b
38.3a 39.6a 35.9b 35.1b 0.68 Lignin, % 2.6c 2.7c 3.8ab 3.2bc 4.4a 3.9ab 0.33 †Means within a row without a common superscript letter differ (P < 0.05). ‡BLV = bermudagrass late vegetative; TLV = teff grass late vegetative, TLBR = teff grass late bloom with rain damage, BMB = bermudagrass mid-‐bloom, TES = teff grass with caryopsis visible, TSD = teff grass soft dough stage. §NDF = neutral detergent fiber; ADF = acid detergent fiber. ¶SEM = standard error of mean.
3
Table 3. Pearson correlation coefficients relating forage quality measurements to palatability by horses across different forages. DM consumption Item† per forage, lb/d Percent of offer Percent of total DMI NDF, % -‐0.73 -‐0.74 -‐0.72
p-‐value <0.01 <0.01 <0.01 ADF, % -‐0.75 -‐0.76 -‐0.74
p-‐value <0.01 <0.01 <0.01 Hemicellulose,% 0.13 0.15 0.13
p-‐value 0.14 0.11 0.14 Lignin, % -‐0.55 -‐0.57 -‐0.55
p-‐value <0.01 <0.01 <0.01 † DM = Dry matter; DMI = Dry matter intake; NDF = neutral detergent fiber; ADF = acid detergent fiber.
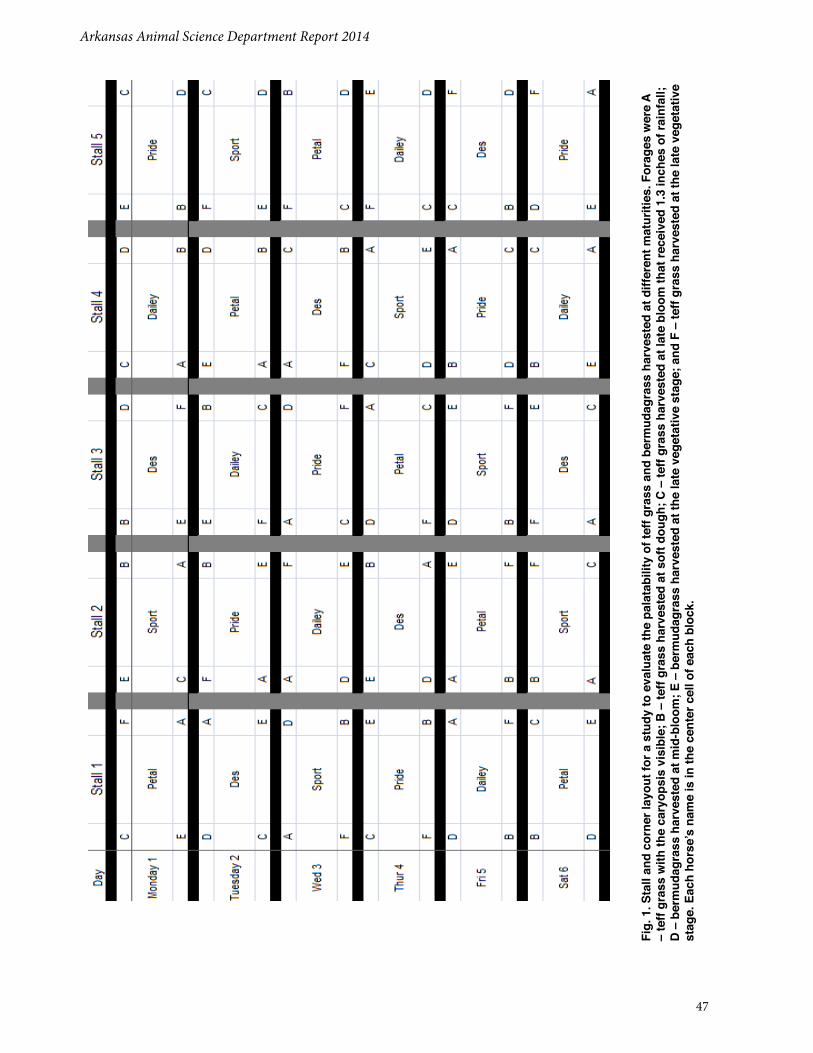
Arkansas Animal Science Department Report 2014
47
Fig.
1. S
tall
and
corn
er la
yout
for a
stu
dy to
eva
luat
e th
e pa
lata
bilit
y of
teff
gras
s an
d be
rmud
agra
ss h
arve
sted
at d
iffer
ent m
atur
ities
. For
ages
wer
e A
– te
ff gr
ass
with
the
cary
opsi
s vi
sibl
e; B
– te
ff gr
ass
harv
este
d at
sof
t dou
gh; C
– te
ff gr
ass
harv
este
d at
late
blo
om th
at re
ceiv
ed 1
.3 in
ches
of r
ainf
all;
D –
ber
mud
agra
ss h
arve
sted
at m
id-b
loom
; E –
ber
mud
agra
ss h
arve
sted
at t
he la
te v
eget
ativ
e st
age;
and
F –
teff
gras
s ha
rves
ted
at th
e la
te v
eget
ativ
e st
age.
Eac
h ho
rse’
s na
me
is in
the
cent
er c
ell o
f eac
h bl
ock.
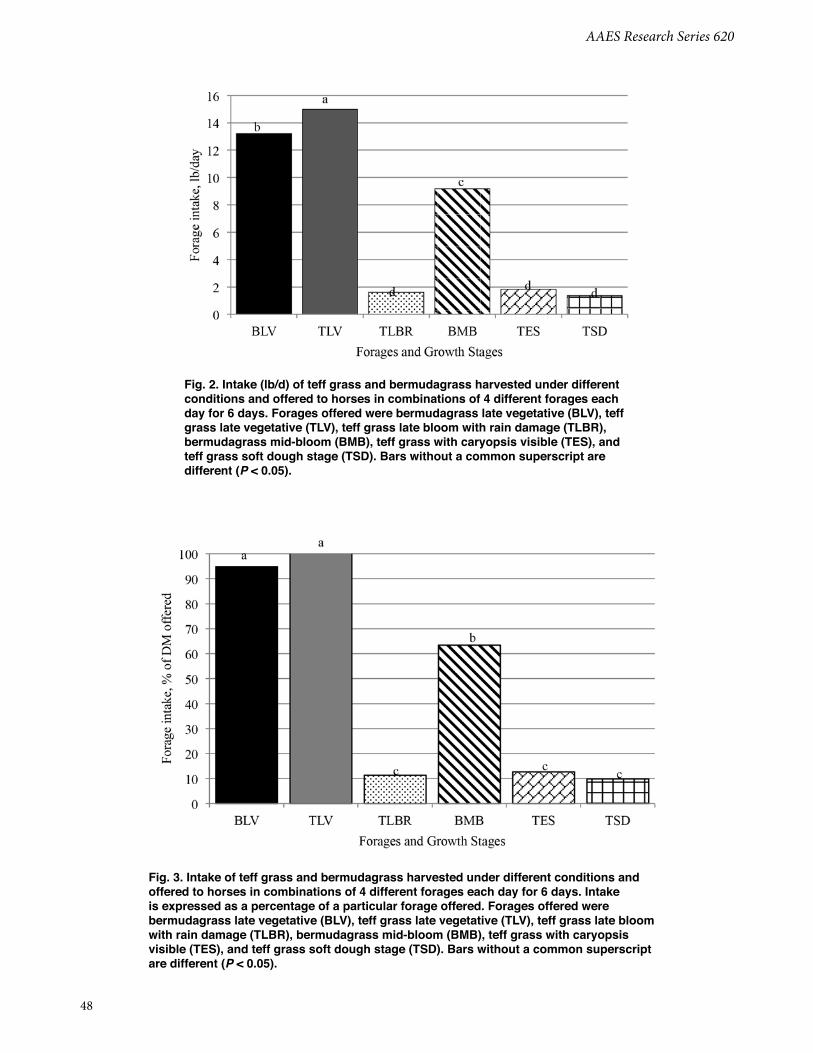
AAES Research Series 620
48
Fig. 2. Intake (lb/d) of teff grass and bermudagrass harvested under different conditions and offered to horses in combinations of 4 different forages each day for 6 days. Forages offered were bermudagrass late vegetative (BLV), teff grass late vegetative (TLV), teff grass late bloom with rain damage (TLBR), bermudagrass mid-bloom (BMB), teff grass with caryopsis visible (TES), and teff grass soft dough stage (TSD). Bars without a common superscript are different (P < 0.05).
Fig. 3. Intake of teff grass and bermudagrass harvested under different conditions and offered to horses in combinations of 4 different forages each day for 6 days. Intake is expressed as a percentage of a particular forage offered. Forages offered were bermudagrass late vegetative (BLV), teff grass late vegetative (TLV), teff grass late bloom with rain damage (TLBR), bermudagrass mid-bloom (BMB), teff grass with caryopsis visible (TES), and teff grass soft dough stage (TSD). Bars without a common superscript are different (P < 0.05).
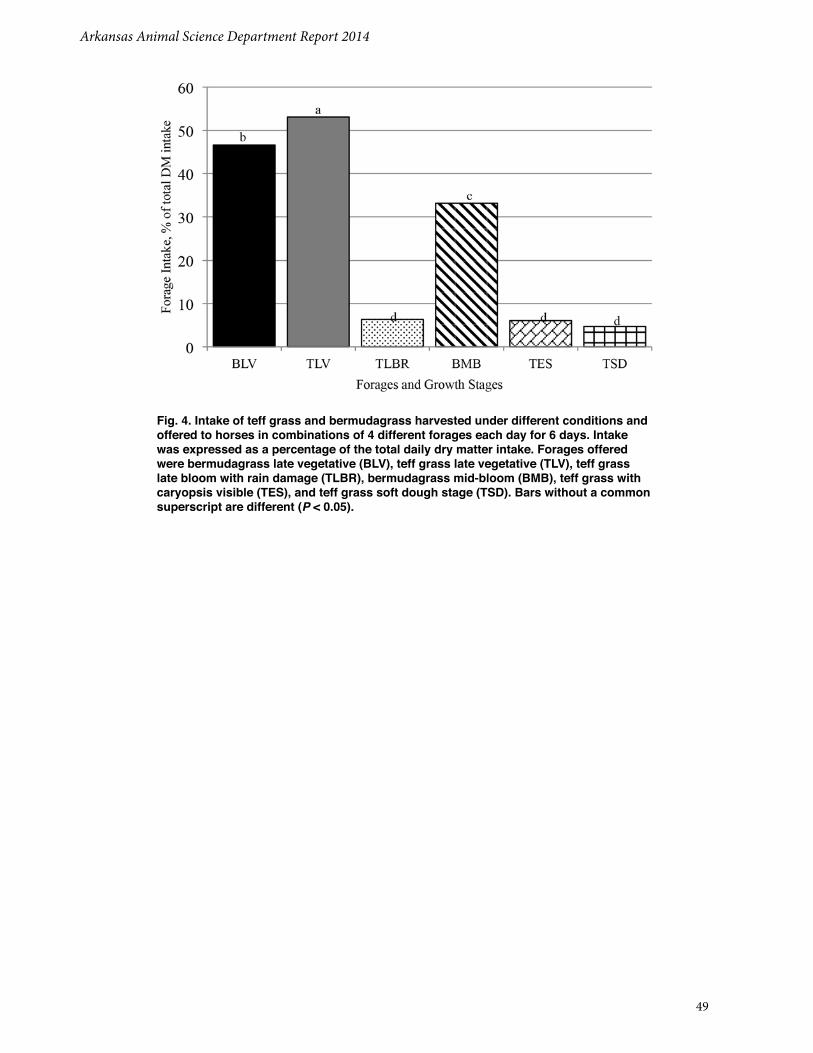
Arkansas Animal Science Department Report 2014
49
Fig. 4. Intake of teff grass and bermudagrass harvested under different conditions and offered to horses in combinations of 4 different forages each day for 6 days. Intake was expressed as a percentage of the total daily dry matter intake. Forages offered were bermudagrass late vegetative (BLV), teff grass late vegetative (TLV), teff grass late bloom with rain damage (TLBR), bermudagrass mid-bloom (BMB), teff grass with caryopsis visible (TES), and teff grass soft dough stage (TSD). Bars without a common superscript are different (P < 0.05).
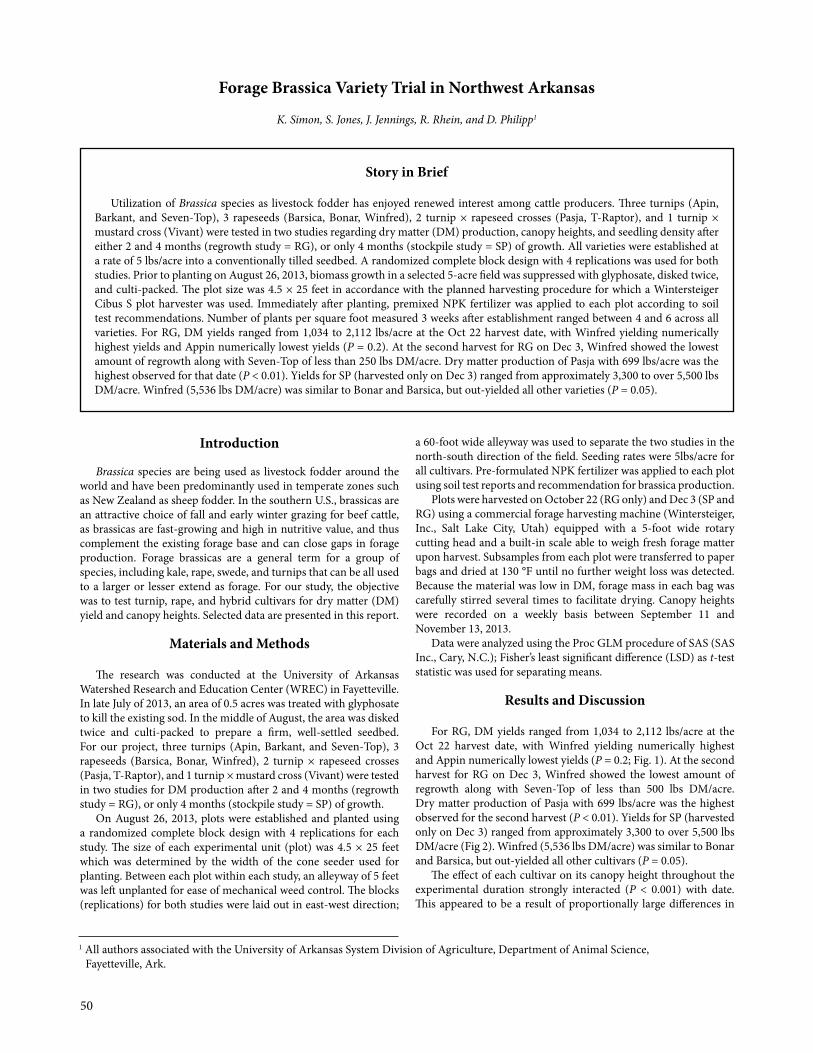
50
Introduction
Brassica species are being used as livestock fodder around the world and have been predominantly used in temperate zones such as New Zealand as sheep fodder. In the southern U.S., brassicas are an attractive choice of fall and early winter grazing for beef cattle, as brassicas are fast-growing and high in nutritive value, and thus complement the existing forage base and can close gaps in forage production. Forage brassicas are a general term for a group of species, including kale, rape, swede, and turnips that can be all used to a larger or lesser extend as forage. For our study, the objective was to test turnip, rape, and hybrid cultivars for dry matter (DM) yield and canopy heights. Selected data are presented in this report.
Materials and Methods
The research was conducted at the University of Arkansas Watershed Research and Education Center (WREC) in Fayetteville. In late July of 2013, an area of 0.5 acres was treated with glyphosate to kill the existing sod. In the middle of August, the area was disked twice and culti-packed to prepare a firm, well-settled seedbed. For our project, three turnips (Apin, Barkant, and Seven-Top), 3 rapeseeds (Barsica, Bonar, Winfred), 2 turnip × rapeseed crosses (Pasja, T-Raptor), and 1 turnip × mustard cross (Vivant) were tested in two studies for DM production after 2 and 4 months (regrowth study = RG), or only 4 months (stockpile study = SP) of growth.
On August 26, 2013, plots were established and planted using a randomized complete block design with 4 replications for each study. The size of each experimental unit (plot) was 4.5 × 25 feet which was determined by the width of the cone seeder used for planting. Between each plot within each study, an alleyway of 5 feet was left unplanted for ease of mechanical weed control. The blocks (replications) for both studies were laid out in east-west direction;
a 60-foot wide alleyway was used to separate the two studies in the north-south direction of the field. Seeding rates were 5lbs/acre for all cultivars. Pre-formulated NPK fertilizer was applied to each plot using soil test reports and recommendation for brassica production.
Plots were harvested on October 22 (RG only) and Dec 3 (SP and RG) using a commercial forage harvesting machine (Wintersteiger, Inc., Salt Lake City, Utah) equipped with a 5-foot wide rotary cutting head and a built-in scale able to weigh fresh forage matter upon harvest. Subsamples from each plot were transferred to paper bags and dried at 130 °F until no further weight loss was detected. Because the material was low in DM, forage mass in each bag was carefully stirred several times to facilitate drying. Canopy heights were recorded on a weekly basis between September 11 and November 13, 2013.
Data were analyzed using the Proc GLM procedure of SAS (SAS Inc., Cary, N.C.); Fisher’s least significant difference (LSD) as t-test statistic was used for separating means.
Results and Discussion
For RG, DM yields ranged from 1,034 to 2,112 lbs/acre at the Oct 22 harvest date, with Winfred yielding numerically highest and Appin numerically lowest yields (P = 0.2; Fig. 1). At the second harvest for RG on Dec 3, Winfred showed the lowest amount of regrowth along with Seven-Top of less than 500 lbs DM/acre. Dry matter production of Pasja with 699 lbs/acre was the highest observed for the second harvest (P < 0.01). Yields for SP (harvested only on Dec 3) ranged from approximately 3,300 to over 5,500 lbs DM/acre (Fig 2). Winfred (5,536 lbs DM/acre) was similar to Bonar and Barsica, but out-yielded all other cultivars (P = 0.05).
The effect of each cultivar on its canopy height throughout the experimental duration strongly interacted (P < 0.001) with date. This appeared to be a result of proportionally large differences in
Forage Brassica Variety Trial in Northwest Arkansas
K. Simon, S. Jones, J. Jennings, R. Rhein, and D. Philipp1
Story in Brief
Utilization of Brassica species as livestock fodder has enjoyed renewed interest among cattle producers. Three turnips (Apin, Barkant, and Seven-Top), 3 rapeseeds (Barsica, Bonar, Winfred), 2 turnip × rapeseed crosses (Pasja, T-Raptor), and 1 turnip × mustard cross (Vivant) were tested in two studies regarding dry matter (DM) production, canopy heights, and seedling density after either 2 and 4 months (regrowth study = RG), or only 4 months (stockpile study = SP) of growth. All varieties were established at a rate of 5 lbs/acre into a conventionally tilled seedbed. A randomized complete block design with 4 replications was used for both studies. Prior to planting on August 26, 2013, biomass growth in a selected 5-acre field was suppressed with glyphosate, disked twice, and culti-packed. The plot size was 4.5 × 25 feet in accordance with the planned harvesting procedure for which a Wintersteiger Cibus S plot harvester was used. Immediately after planting, premixed NPK fertilizer was applied to each plot according to soil test recommendations. Number of plants per square foot measured 3 weeks after establishment ranged between 4 and 6 across all varieties. For RG, DM yields ranged from 1,034 to 2,112 lbs/acre at the Oct 22 harvest date, with Winfred yielding numerically highest yields and Appin numerically lowest yields (P = 0.2). At the second harvest for RG on Dec 3, Winfred showed the lowest amount of regrowth along with Seven-Top of less than 250 lbs DM/acre. Dry matter production of Pasja with 699 lbs/acre was the highest observed for that date (P < 0.01). Yields for SP (harvested only on Dec 3) ranged from approximately 3,300 to over 5,500 lbs DM/acre. Winfred (5,536 lbs DM/acre) was similar to Bonar and Barsica, but out-yielded all other varieties (P = 0.05).
1 All authors associated with the University of Arkansas System Division of Agriculture, Department of Animal Science, Fayetteville, Ark.
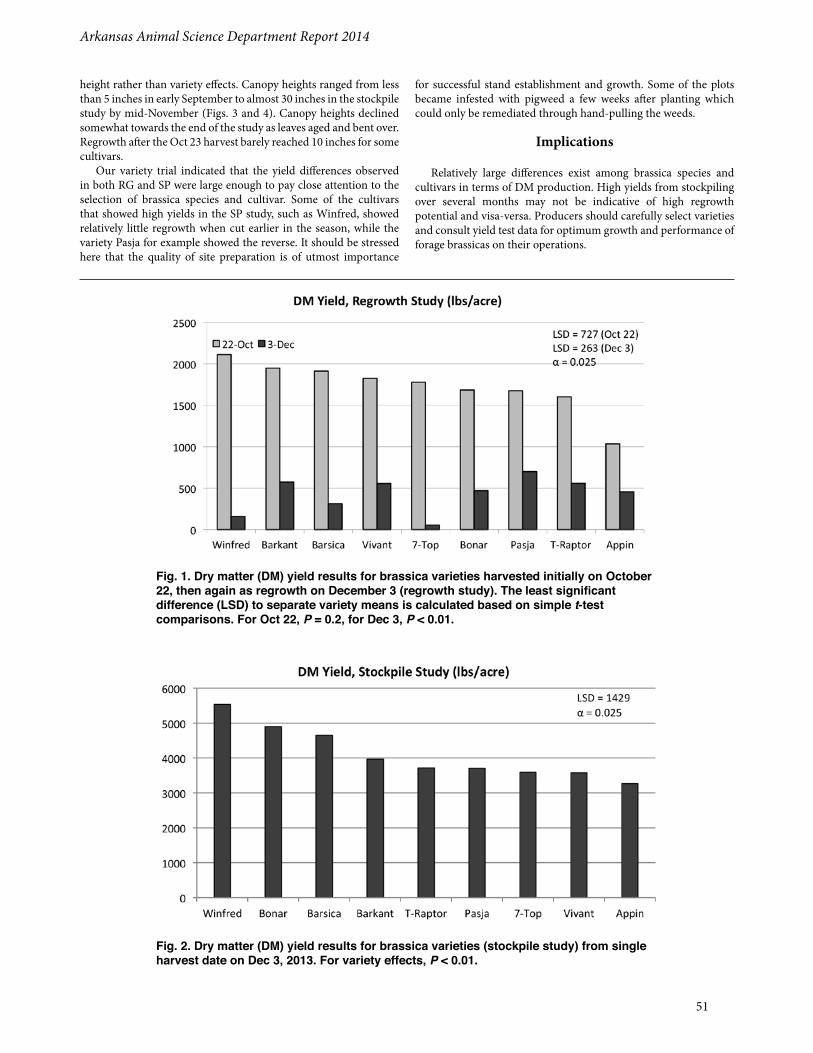
Arkansas Animal Science Department Report 2014
51
height rather than variety effects. Canopy heights ranged from less than 5 inches in early September to almost 30 inches in the stockpile study by mid-November (Figs. 3 and 4). Canopy heights declined somewhat towards the end of the study as leaves aged and bent over. Regrowth after the Oct 23 harvest barely reached 10 inches for some cultivars.
Our variety trial indicated that the yield differences observed in both RG and SP were large enough to pay close attention to the selection of brassica species and cultivar. Some of the cultivars that showed high yields in the SP study, such as Winfred, showed relatively little regrowth when cut earlier in the season, while the variety Pasja for example showed the reverse. It should be stressed here that the quality of site preparation is of utmost importance
for successful stand establishment and growth. Some of the plots became infested with pigweed a few weeks after planting which could only be remediated through hand-pulling the weeds.
Implications
Relatively large differences exist among brassica species and cultivars in terms of DM production. High yields from stockpiling over several months may not be indicative of high regrowth potential and visa-versa. Producers should carefully select varieties and consult yield test data for optimum growth and performance of forage brassicas on their operations.
Fig. 1. Dry matter (DM) yield results for brassica varieties harvested initially on October 22, then again as regrowth on December 3 (regrowth study). The least significant difference (LSD) to separate variety means is calculated based on simple t-test comparisons. For Oct 22, P = 0.2, for Dec 3, P < 0.01.
Fig. 2. Dry matter (DM) yield results for brassica varieties (stockpile study) from single harvest date on Dec 3, 2013. For variety effects, P < 0.01.
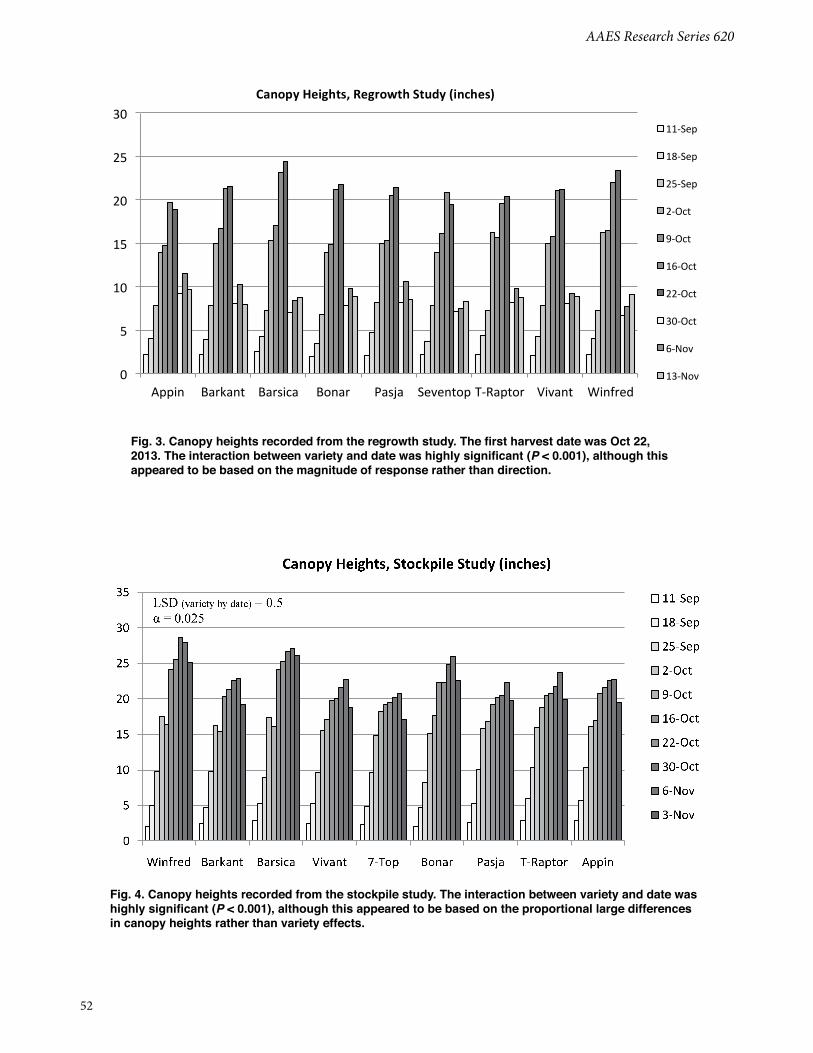
AAES Research Series 620
52
Fig. 3. Canopy heights recorded from the regrowth study. The first harvest date was Oct 22, 2013. The interaction between variety and date was highly significant (P < 0.001), although this appeared to be based on the magnitude of response rather than direction.
Corrected figure Figure 3
0
5
10
15
20
25
30
Appin Barkant Barsica Bonar Pasja Seventop T-‐Raptor Vivant Winfred
11-‐Sep
18-‐Sep
25-‐Sep
2-‐Oct
9-‐Oct
16-‐Oct
22-‐Oct
30-‐Oct
6-‐Nov
13-‐Nov
Canopy Heights, Regrowth Study (inches)
Fig. 4. Canopy heights recorded from the stockpile study. The interaction between variety and date was highly significant (P < 0.001), although this appeared to be based on the proportional large differences in canopy heights rather than variety effects.
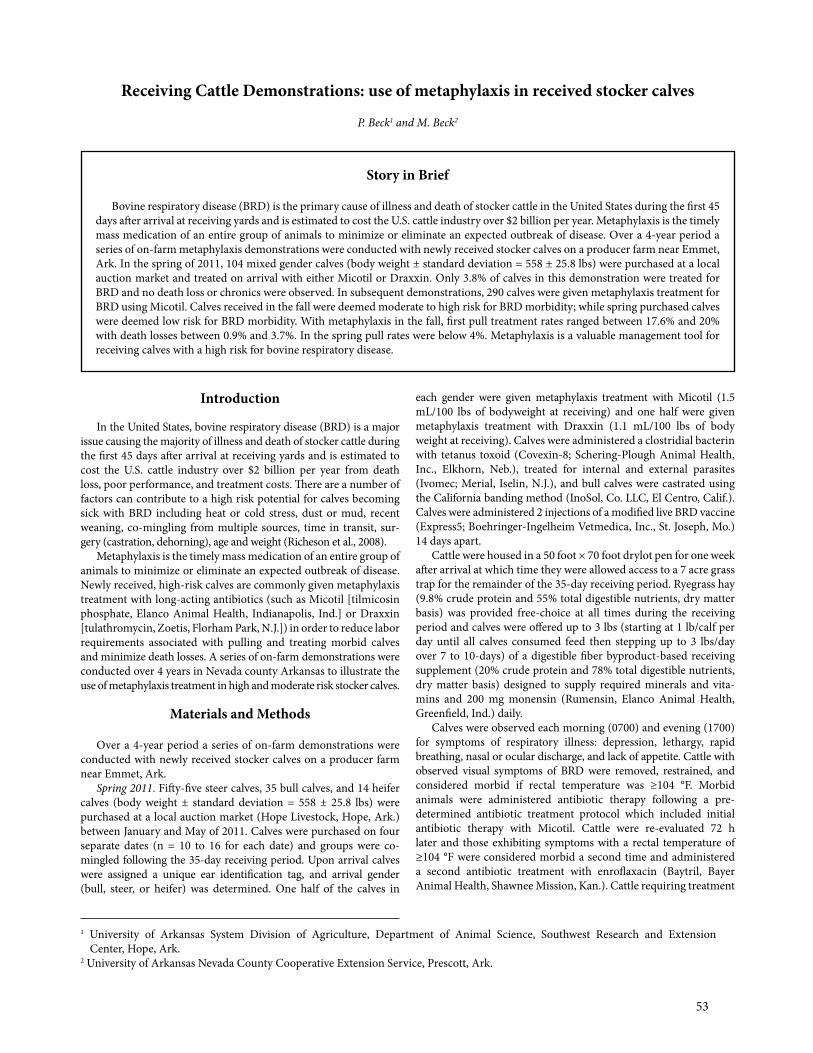
53
Introduction
In the United States, bovine respiratory disease (BRD) is a major issue causing the majority of illness and death of stocker cattle during the first 45 days after arrival at receiving yards and is estimated to cost the U.S. cattle industry over $2 billion per year from death loss, poor performance, and treatment costs. There are a number of factors can contribute to a high risk potential for calves becoming sick with BRD including heat or cold stress, dust or mud, recent weaning, co-mingling from multiple sources, time in transit, sur-gery (castration, dehorning), age and weight (Richeson et al., 2008).
Metaphylaxis is the timely mass medication of an entire group of animals to minimize or eliminate an expected outbreak of disease. Newly received, high-risk calves are commonly given metaphylaxis treatment with long-acting antibiotics (such as Micotil [tilmicosin phosphate, Elanco Animal Health, Indianapolis, Ind.] or Draxxin [tulathromycin, Zoetis, Florham Park, N.J.]) in order to reduce labor requirements associated with pulling and treating morbid calves and minimize death losses. A series of on-farm demonstrations were conducted over 4 years in Nevada county Arkansas to illustrate the use of metaphylaxis treatment in high and moderate risk stocker calves.
Materials and Methods
Over a 4-year period a series of on-farm demonstrations were conducted with newly received stocker calves on a producer farm near Emmet, Ark.
Spring 2011. Fifty-five steer calves, 35 bull calves, and 14 heifer calves (body weight ± standard deviation = 558 ± 25.8 lbs) were purchased at a local auction market (Hope Livestock, Hope, Ark.) between January and May of 2011. Calves were purchased on four separate dates (n = 10 to 16 for each date) and groups were co-mingled following the 35-day receiving period. Upon arrival calves were assigned a unique ear identification tag, and arrival gender (bull, steer, or heifer) was determined. One half of the calves in
each gender were given metaphylaxis treatment with Micotil (1.5 mL/100 lbs of bodyweight at receiving) and one half were given metaphylaxis treatment with Draxxin (1.1 mL/100 lbs of body weight at receiving). Calves were administered a clostridial bacterin with tetanus toxoid (Covexin-8; Schering-Plough Animal Health, Inc., Elkhorn, Neb.), treated for internal and external parasites (Ivomec; Merial, Iselin, N.J.), and bull calves were castrated using the California banding method (InoSol, Co. LLC, El Centro, Calif.). Calves were administered 2 injections of a modified live BRD vaccine (Express5; Boehringer-Ingelheim Vetmedica, Inc., St. Joseph, Mo.) 14 days apart.
Cattle were housed in a 50 foot × 70 foot drylot pen for one week after arrival at which time they were allowed access to a 7 acre grass trap for the remainder of the 35-day receiving period. Ryegrass hay (9.8% crude protein and 55% total digestible nutrients, dry matter basis) was provided free-choice at all times during the receiving period and calves were offered up to 3 lbs (starting at 1 lb/calf per day until all calves consumed feed then stepping up to 3 lbs/day over 7 to 10-days) of a digestible fiber byproduct-based receiving supplement (20% crude protein and 78% total digestible nutrients, dry matter basis) designed to supply required minerals and vita-mins and 200 mg monensin (Rumensin, Elanco Animal Health, Greenfield, Ind.) daily.
Calves were observed each morning (0700) and evening (1700) for symptoms of respiratory illness: depression, lethargy, rapid breathing, nasal or ocular discharge, and lack of appetite. Cattle with observed visual symptoms of BRD were removed, restrained, and considered morbid if rectal temperature was ≥104 °F. Morbid animals were administered antibiotic therapy following a pre-determined antibiotic treatment protocol which included initial antibiotic therapy with Micotil. Cattle were re-evaluated 72 h later and those exhibiting symptoms with a rectal temperature of ≥104 °F were considered morbid a second time and administered a second antibiotic treatment with enroflaxacin (Baytril, Bayer Animal Health, Shawnee Mission, Kan.). Cattle requiring treatment
Receiving Cattle Demonstrations: use of metaphylaxis in received stocker calves
P. Beck1 and M. Beck2
Story in Brief
Bovine respiratory disease (BRD) is the primary cause of illness and death of stocker cattle in the United States during the first 45 days after arrival at receiving yards and is estimated to cost the U.S. cattle industry over $2 billion per year. Metaphylaxis is the timely mass medication of an entire group of animals to minimize or eliminate an expected outbreak of disease. Over a 4-year period a series of on-farm metaphylaxis demonstrations were conducted with newly received stocker calves on a producer farm near Emmet, Ark. In the spring of 2011, 104 mixed gender calves (body weight ± standard deviation = 558 ± 25.8 lbs) were purchased at a local auction market and treated on arrival with either Micotil or Draxxin. Only 3.8% of calves in this demonstration were treated for BRD and no death loss or chronics were observed. In subsequent demonstrations, 290 calves were given metaphylaxis treatment for BRD using Micotil. Calves received in the fall were deemed moderate to high risk for BRD morbidity; while spring purchased calves were deemed low risk for BRD morbidity. With metaphylaxis in the fall, first pull treatment rates ranged between 17.6% and 20% with death losses between 0.9% and 3.7%. In the spring pull rates were below 4%. Metaphylaxis is a valuable management tool for receiving calves with a high risk for bovine respiratory disease.
1 University of Arkansas System Division of Agriculture, Department of Animal Science, Southwest Research and Extension Center, Hope, Ark.
2 University of Arkansas Nevada County Cooperative Extension Service, Prescott, Ark.
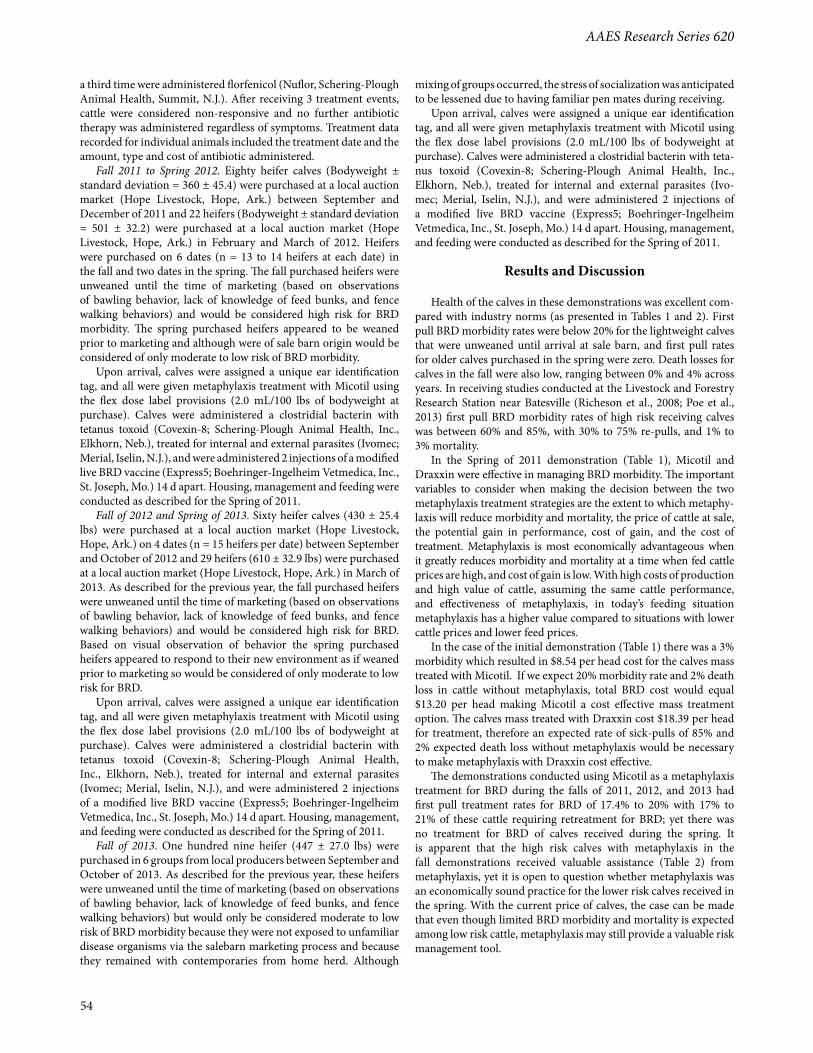
AAES Research Series 620
54
a third time were administered florfenicol (Nuflor, Schering-Plough Animal Health, Summit, N.J.). After receiving 3 treatment events, cattle were considered non-responsive and no further antibiotic therapy was administered regardless of symptoms. Treatment data recorded for individual animals included the treatment date and the amount, type and cost of antibiotic administered.
Fall 2011 to Spring 2012. Eighty heifer calves (Bodyweight ± standard deviation = 360 ± 45.4) were purchased at a local auction market (Hope Livestock, Hope, Ark.) between September and December of 2011 and 22 heifers (Bodyweight ± standard deviation = 501 ± 32.2) were purchased at a local auction market (Hope Livestock, Hope, Ark.) in February and March of 2012. Heifers were purchased on 6 dates (n = 13 to 14 heifers at each date) in the fall and two dates in the spring. The fall purchased heifers were unweaned until the time of marketing (based on observations of bawling behavior, lack of knowledge of feed bunks, and fence walking behaviors) and would be considered high risk for BRD morbidity. The spring purchased heifers appeared to be weaned prior to marketing and although were of sale barn origin would be considered of only moderate to low risk of BRD morbidity.
Upon arrival, calves were assigned a unique ear identification tag, and all were given metaphylaxis treatment with Micotil using the flex dose label provisions (2.0 mL/100 lbs of bodyweight at purchase). Calves were administered a clostridial bacterin with tetanus toxoid (Covexin-8; Schering-Plough Animal Health, Inc., Elkhorn, Neb.), treated for internal and external parasites (Ivomec; Merial, Iselin, N.J.), and were administered 2 injections of a modified live BRD vaccine (Express5; Boehringer-Ingelheim Vetmedica, Inc., St. Joseph, Mo.) 14 d apart. Housing, management and feeding were conducted as described for the Spring of 2011.
Fall of 2012 and Spring of 2013. Sixty heifer calves (430 ± 25.4 lbs) were purchased at a local auction market (Hope Livestock, Hope, Ark.) on 4 dates (n = 15 heifers per date) between September and October of 2012 and 29 heifers (610 ± 32.9 lbs) were purchased at a local auction market (Hope Livestock, Hope, Ark.) in March of 2013. As described for the previous year, the fall purchased heifers were unweaned until the time of marketing (based on observations of bawling behavior, lack of knowledge of feed bunks, and fence walking behaviors) and would be considered high risk for BRD. Based on visual observation of behavior the spring purchased heifers appeared to respond to their new environment as if weaned prior to marketing so would be considered of only moderate to low risk for BRD.
Upon arrival, calves were assigned a unique ear identification tag, and all were given metaphylaxis treatment with Micotil using the flex dose label provisions (2.0 mL/100 lbs of bodyweight at purchase). Calves were administered a clostridial bacterin with tetanus toxoid (Covexin-8; Schering-Plough Animal Health, Inc., Elkhorn, Neb.), treated for internal and external parasites (Ivomec; Merial, Iselin, N.J.), and were administered 2 injections of a modified live BRD vaccine (Express5; Boehringer-Ingelheim Vetmedica, Inc., St. Joseph, Mo.) 14 d apart. Housing, management, and feeding were conducted as described for the Spring of 2011.
Fall of 2013. One hundred nine heifer (447 ± 27.0 lbs) were purchased in 6 groups from local producers between September and October of 2013. As described for the previous year, these heifers were unweaned until the time of marketing (based on observations of bawling behavior, lack of knowledge of feed bunks, and fence walking behaviors) but would only be considered moderate to low risk of BRD morbidity because they were not exposed to unfamiliar disease organisms via the salebarn marketing process and because they remained with contemporaries from home herd. Although
mixing of groups occurred, the stress of socialization was anticipated to be lessened due to having familiar pen mates during receiving.
Upon arrival, calves were assigned a unique ear identification tag, and all were given metaphylaxis treatment with Micotil using the flex dose label provisions (2.0 mL/100 lbs of bodyweight at purchase). Calves were administered a clostridial bacterin with teta- nus toxoid (Covexin-8; Schering-Plough Animal Health, Inc., Elkhorn, Neb.), treated for internal and external parasites (Ivo-mec; Merial, Iselin, N.J.), and were administered 2 injections of a modified live BRD vaccine (Express5; Boehringer-Ingelheim Vetmedica, Inc., St. Joseph, Mo.) 14 d apart. Housing, management, and feeding were conducted as described for the Spring of 2011.
Results and Discussion
Health of the calves in these demonstrations was excellent com-pared with industry norms (as presented in Tables 1 and 2). First pull BRD morbidity rates were below 20% for the lightweight calves that were unweaned until arrival at sale barn, and first pull rates for older calves purchased in the spring were zero. Death losses for calves in the fall were also low, ranging between 0% and 4% across years. In receiving studies conducted at the Livestock and Forestry Research Station near Batesville (Richeson et al., 2008; Poe et al., 2013) first pull BRD morbidity rates of high risk receiving calves was between 60% and 85%, with 30% to 75% re-pulls, and 1% to 3% mortality.
In the Spring of 2011 demonstration (Table 1), Micotil and Draxxin were effective in managing BRD morbidity. The important variables to consider when making the decision between the two metaphylaxis treatment strategies are the extent to which metaphy-laxis will reduce morbidity and mortality, the price of cattle at sale, the potential gain in performance, cost of gain, and the cost of treatment. Metaphylaxis is most economically advantageous when it greatly reduces morbidity and mortality at a time when fed cattle prices are high, and cost of gain is low. With high costs of production and high value of cattle, assuming the same cattle performance, and effectiveness of metaphylaxis, in today’s feeding situation metaphylaxis has a higher value compared to situations with lower cattle prices and lower feed prices.
In the case of the initial demonstration (Table 1) there was a 3% morbidity which resulted in $8.54 per head cost for the calves mass treated with Micotil. If we expect 20% morbidity rate and 2% death loss in cattle without metaphylaxis, total BRD cost would equal $13.20 per head making Micotil a cost effective mass treatment option. The calves mass treated with Draxxin cost $18.39 per head for treatment, therefore an expected rate of sick-pulls of 85% and 2% expected death loss without metaphylaxis would be necessary to make metaphylaxis with Draxxin cost effective.
The demonstrations conducted using Micotil as a metaphylaxis treatment for BRD during the falls of 2011, 2012, and 2013 had first pull treatment rates for BRD of 17.4% to 20% with 17% to 21% of these cattle requiring retreatment for BRD; yet there was no treatment for BRD of calves received during the spring. It is apparent that the high risk calves with metaphylaxis in the fall demonstrations received valuable assistance (Table 2) from metaphylaxis, yet it is open to question whether metaphylaxis was an economically sound practice for the lower risk calves received in the spring. With the current price of calves, the case can be made that even though limited BRD morbidity and mortality is expected among low risk cattle, metaphylaxis may still provide a valuable risk management tool.
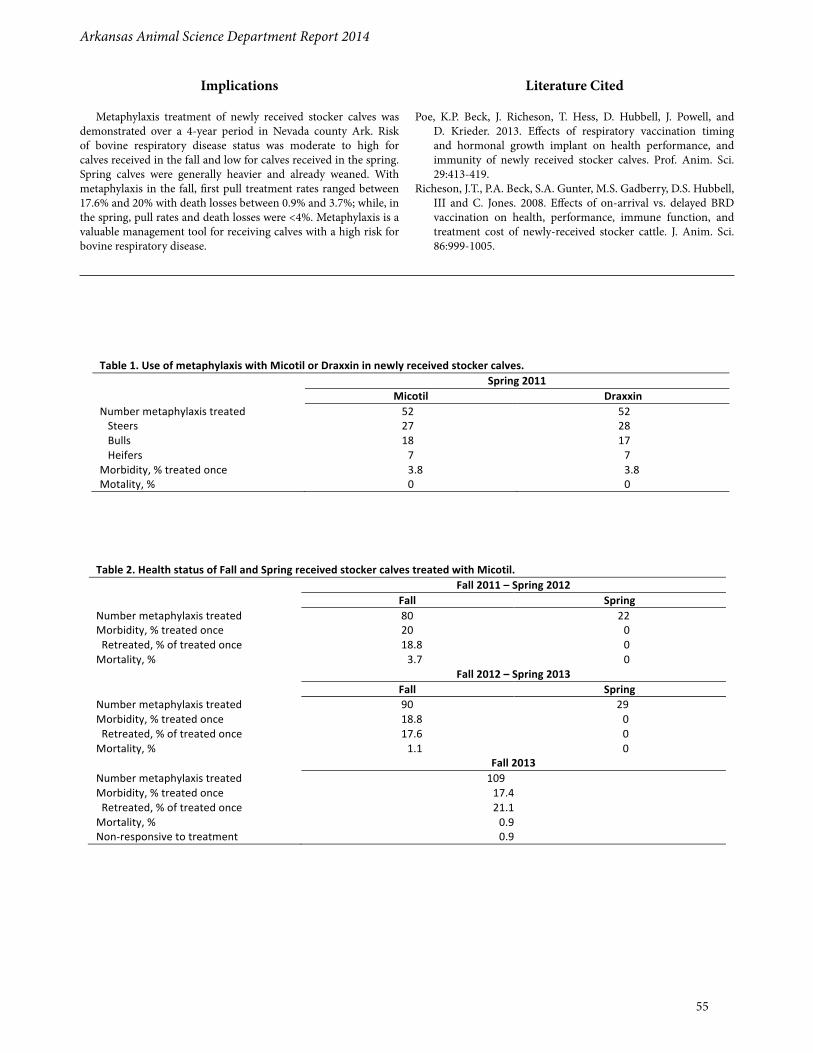
Arkansas Animal Science Department Report 2014
55
Implications
Metaphylaxis treatment of newly received stocker calves was demonstrated over a 4-year period in Nevada county Ark. Risk of bovine respiratory disease status was moderate to high for calves received in the fall and low for calves received in the spring. Spring calves were generally heavier and already weaned. With metaphylaxis in the fall, first pull treatment rates ranged between 17.6% and 20% with death losses between 0.9% and 3.7%; while, in the spring, pull rates and death losses were <4%. Metaphylaxis is a valuable management tool for receiving calves with a high risk for bovine respiratory disease.
Literature Cited
Poe, K.P. Beck, J. Richeson, T. Hess, D. Hubbell, J. Powell, and D. Krieder. 2013. Effects of respiratory vaccination timing and hormonal growth implant on health performance, and immunity of newly received stocker calves. Prof. Anim. Sci. 29:413-419.
Richeson, J.T., P.A. Beck, S.A. Gunter, M.S. Gadberry, D.S. Hubbell, III and C. Jones. 2008. Effects of on-arrival vs. delayed BRD vaccination on health, performance, immune function, and treatment cost of newly-received stocker cattle. J. Anim. Sci. 86:999-1005.
Table 1. Use of metaphylaxis with Micotil or Draxxin in newly received stocker calves. Spring 2011 Micotil Draxxin Number metaphylaxis treated Steers Bulls Heifers
52 27 18 7
52 28 17 7
Morbidity, % treated once 3.8 3.8 Motality, % 0 0
Table 2. Health status of Fall and Spring received stocker calves treated with Micotil. Fall 2011 – Spring 2012 Fall Spring Number metaphylaxis treated 80 22 Morbidity, % treated once 20 0 Retreated, % of treated once 18.8 0 Mortality, % 3.7 0 Fall 2012 – Spring 2013 Fall Spring Number metaphylaxis treated 90 29 Morbidity, % treated once 18.8 0 Retreated, % of treated once 17.6 0 Mortality, % 1.1 0 Fall 2013 Number metaphylaxis treated 109 Morbidity, % treated once 17.4 Retreated, % of treated once 21.1 Mortality, % 0.9 Non-‐responsive to treatment 0.9
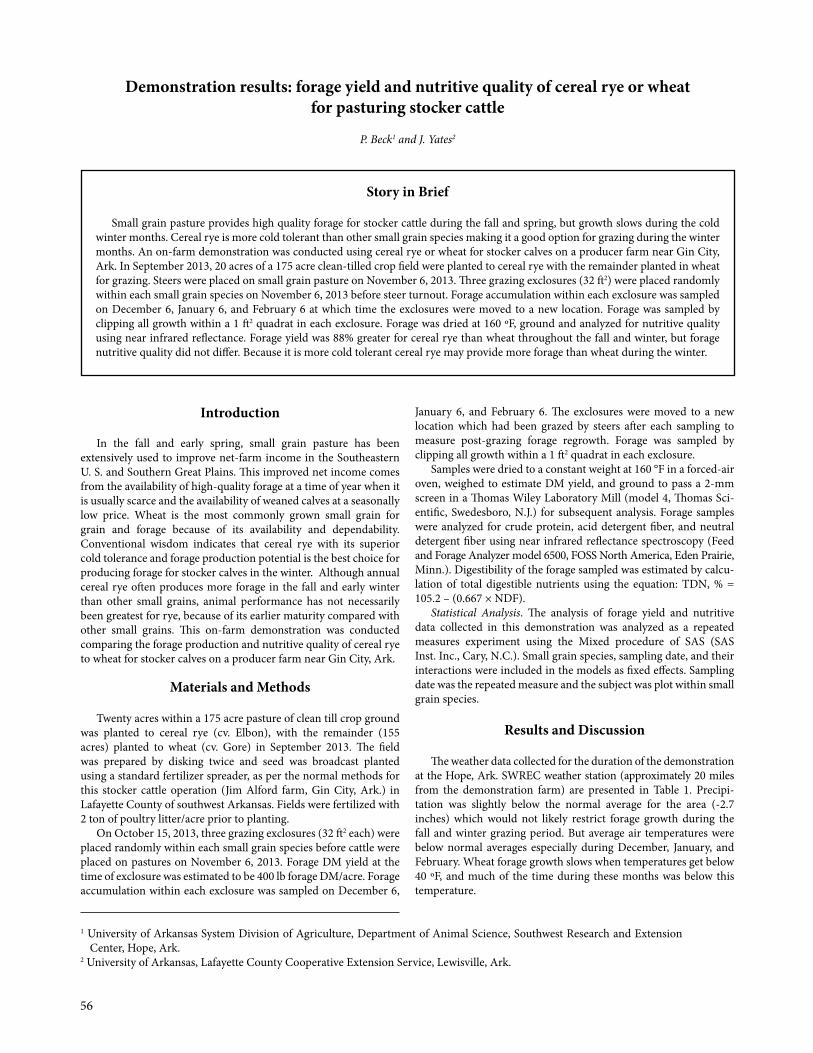
56
Introduction
In the fall and early spring, small grain pasture has been extensively used to improve net-farm income in the Southeastern U. S. and Southern Great Plains. This improved net income comes from the availability of high-quality forage at a time of year when it is usually scarce and the availability of weaned calves at a seasonally low price. Wheat is the most commonly grown small grain for grain and forage because of its availability and dependability. Conventional wisdom indicates that cereal rye with its superior cold tolerance and forage production potential is the best choice for producing forage for stocker calves in the winter. Although annual cereal rye often produces more forage in the fall and early winter than other small grains, animal performance has not necessarily been greatest for rye, because of its earlier maturity compared with other small grains. This on-farm demonstration was conducted comparing the forage production and nutritive quality of cereal rye to wheat for stocker calves on a producer farm near Gin City, Ark.
Materials and Methods
Twenty acres within a 175 acre pasture of clean till crop ground was planted to cereal rye (cv. Elbon), with the remainder (155 acres) planted to wheat (cv. Gore) in September 2013. The field was prepared by disking twice and seed was broadcast planted using a standard fertilizer spreader, as per the normal methods for this stocker cattle operation (Jim Alford farm, Gin City, Ark.) in Lafayette County of southwest Arkansas. Fields were fertilized with 2 ton of poultry litter/acre prior to planting.
On October 15, 2013, three grazing exclosures (32 ft2 each) were placed randomly within each small grain species before cattle were placed on pastures on November 6, 2013. Forage DM yield at the time of exclosure was estimated to be 400 lb forage DM/acre. Forage accumulation within each exclosure was sampled on December 6,
January 6, and February 6. The exclosures were moved to a new location which had been grazed by steers after each sampling to measure post-grazing forage regrowth. Forage was sampled by clipping all growth within a 1 ft2 quadrat in each exclosure.
Samples were dried to a constant weight at 160 °F in a forced-air oven, weighed to estimate DM yield, and ground to pass a 2-mm screen in a Thomas Wiley Laboratory Mill (model 4, Thomas Sci-entific, Swedesboro, N.J.) for subsequent analysis. Forage samples were analyzed for crude protein, acid detergent fiber, and neutral detergent fiber using near infrared reflectance spectroscopy (Feed and Forage Analyzer model 6500, FOSS North America, Eden Prairie, Minn.). Digestibility of the forage sampled was estimated by calcu-lation of total digestible nutrients using the equation: TDN, % = 105.2 – (0.667 × NDF).
Statistical Analysis. The analysis of forage yield and nutritive data collected in this demonstration was analyzed as a repeated measures experiment using the Mixed procedure of SAS (SAS Inst. Inc., Cary, N.C.). Small grain species, sampling date, and their interactions were included in the models as fixed effects. Sampling date was the repeated measure and the subject was plot within small grain species.
Results and Discussion
The weather data collected for the duration of the demonstration at the Hope, Ark. SWREC weather station (approximately 20 miles from the demonstration farm) are presented in Table 1. Precipi-tation was slightly below the normal average for the area (-2.7 inches) which would not likely restrict forage growth during the fall and winter grazing period. But average air temperatures were below normal averages especially during December, January, and February. Wheat forage growth slows when temperatures get below 40 ºF, and much of the time during these months was below this temperature.
Demonstration results: forage yield and nutritive quality of cereal rye or wheat for pasturing stocker cattle
P. Beck1 and J. Yates2
Story in Brief
Small grain pasture provides high quality forage for stocker cattle during the fall and spring, but growth slows during the cold winter months. Cereal rye is more cold tolerant than other small grain species making it a good option for grazing during the winter months. An on-farm demonstration was conducted using cereal rye or wheat for stocker calves on a producer farm near Gin City, Ark. In September 2013, 20 acres of a 175 acre clean-tilled crop field were planted to cereal rye with the remainder planted in wheat for grazing. Steers were placed on small grain pasture on November 6, 2013. Three grazing exclosures (32 ft2) were placed randomly within each small grain species on November 6, 2013 before steer turnout. Forage accumulation within each exclosure was sampled on December 6, January 6, and February 6 at which time the exclosures were moved to a new location. Forage was sampled by clipping all growth within a 1 ft2 quadrat in each exclosure. Forage was dried at 160 ºF, ground and analyzed for nutritive quality using near infrared reflectance. Forage yield was 88% greater for cereal rye than wheat throughout the fall and winter, but forage nutritive quality did not differ. Because it is more cold tolerant cereal rye may provide more forage than wheat during the winter.
1 University of Arkansas System Division of Agriculture, Department of Animal Science, Southwest Research and Extension Center, Hope, Ark.
2 University of Arkansas, Lafayette County Cooperative Extension Service, Lewisville, Ark.
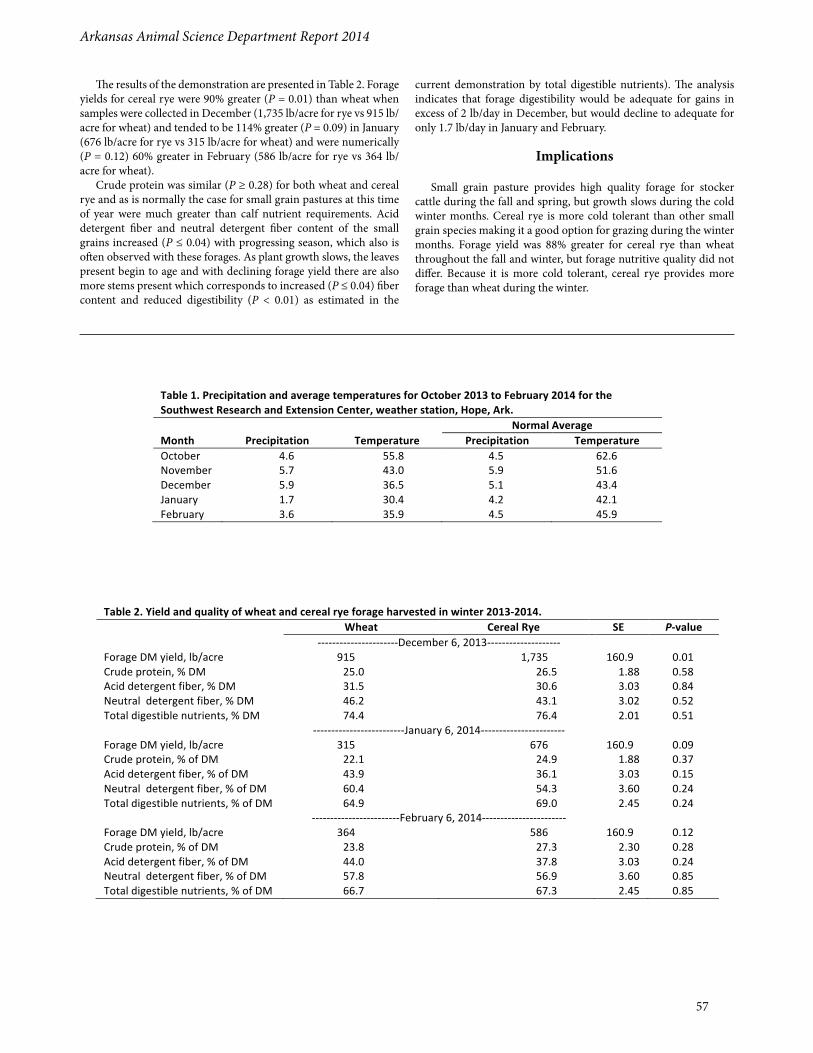
Arkansas Animal Science Department Report 2014
57
The results of the demonstration are presented in Table 2. Forage yields for cereal rye were 90% greater (P = 0.01) than wheat when samples were collected in December (1,735 lb/acre for rye vs 915 lb/acre for wheat) and tended to be 114% greater (P = 0.09) in January (676 lb/acre for rye vs 315 lb/acre for wheat) and were numerically (P = 0.12) 60% greater in February (586 lb/acre for rye vs 364 lb/acre for wheat).
Crude protein was similar (P ≥ 0.28) for both wheat and cereal rye and as is normally the case for small grain pastures at this time of year were much greater than calf nutrient requirements. Acid detergent fiber and neutral detergent fiber content of the small grains increased (P ≤ 0.04) with progressing season, which also is often observed with these forages. As plant growth slows, the leaves present begin to age and with declining forage yield there are also more stems present which corresponds to increased (P ≤ 0.04) fiber content and reduced digestibility (P < 0.01) as estimated in the
current demonstration by total digestible nutrients). The analysis indicates that forage digestibility would be adequate for gains in excess of 2 lb/day in December, but would decline to adequate for only 1.7 lb/day in January and February.
Implications
Small grain pasture provides high quality forage for stocker cattle during the fall and spring, but growth slows during the cold winter months. Cereal rye is more cold tolerant than other small grain species making it a good option for grazing during the winter months. Forage yield was 88% greater for cereal rye than wheat throughout the fall and winter, but forage nutritive quality did not differ. Because it is more cold tolerant, cereal rye provides more forage than wheat during the winter.
Table 1. Precipitation and average temperatures for October 2013 to February 2014 for the Southwest Research and Extension Center, weather station, Hope, Ark. Normal Average Month Precipitation Temperature Precipitation Temperature October 4.6 55.8 4.5 62.6 November 5.7 43.0 5.9 51.6 December 5.9 36.5 5.1 43.4 January 1.7 30.4 4.2 42.1 February 3.6 35.9 4.5 45.9
Table 2. Yield and quality of wheat and cereal rye forage harvested in winter 2013-‐2014. Wheat Cereal Rye SE P-‐value -‐-‐-‐-‐-‐-‐-‐-‐-‐-‐-‐-‐-‐-‐-‐-‐-‐-‐-‐-‐-‐-‐December 6, 2013-‐-‐-‐-‐-‐-‐-‐-‐-‐-‐-‐-‐-‐-‐-‐-‐-‐-‐-‐-‐ Forage DM yield, lb/acre 915 1,735 160.9 0.01 Crude protein, % DM 25.0 26.5 1.88 0.58 Acid detergent fiber, % DM 31.5 30.6 3.03 0.84 Neutral detergent fiber, % DM 46.2 43.1 3.02 0.52 Total digestible nutrients, % DM 74.4 76.4 2.01 0.51 -‐-‐-‐-‐-‐-‐-‐-‐-‐-‐-‐-‐-‐-‐-‐-‐-‐-‐-‐-‐-‐-‐-‐-‐-‐January 6, 2014-‐-‐-‐-‐-‐-‐-‐-‐-‐-‐-‐-‐-‐-‐-‐-‐-‐-‐-‐-‐-‐-‐-‐ Forage DM yield, lb/acre 315 676 160.9 0.09 Crude protein, % of DM 22.1 24.9 1.88 0.37 Acid detergent fiber, % of DM 43.9 36.1 3.03 0.15 Neutral detergent fiber, % of DM 60.4 54.3 3.60 0.24 Total digestible nutrients, % of DM 64.9 69.0 2.45 0.24 -‐-‐-‐-‐-‐-‐-‐-‐-‐-‐-‐-‐-‐-‐-‐-‐-‐-‐-‐-‐-‐-‐-‐-‐February 6, 2014-‐-‐-‐-‐-‐-‐-‐-‐-‐-‐-‐-‐-‐-‐-‐-‐-‐-‐-‐-‐-‐-‐-‐ Forage DM yield, lb/acre 364 586 160.9 0.12 Crude protein, % of DM 23.8 27.3 2.30 0.28 Acid detergent fiber, % of DM 44.0 37.8 3.03 0.24 Neutral detergent fiber, % of DM 57.8 56.9 3.60 0.85 Total digestible nutrients, % of DM 66.7 67.3 2.45 0.85
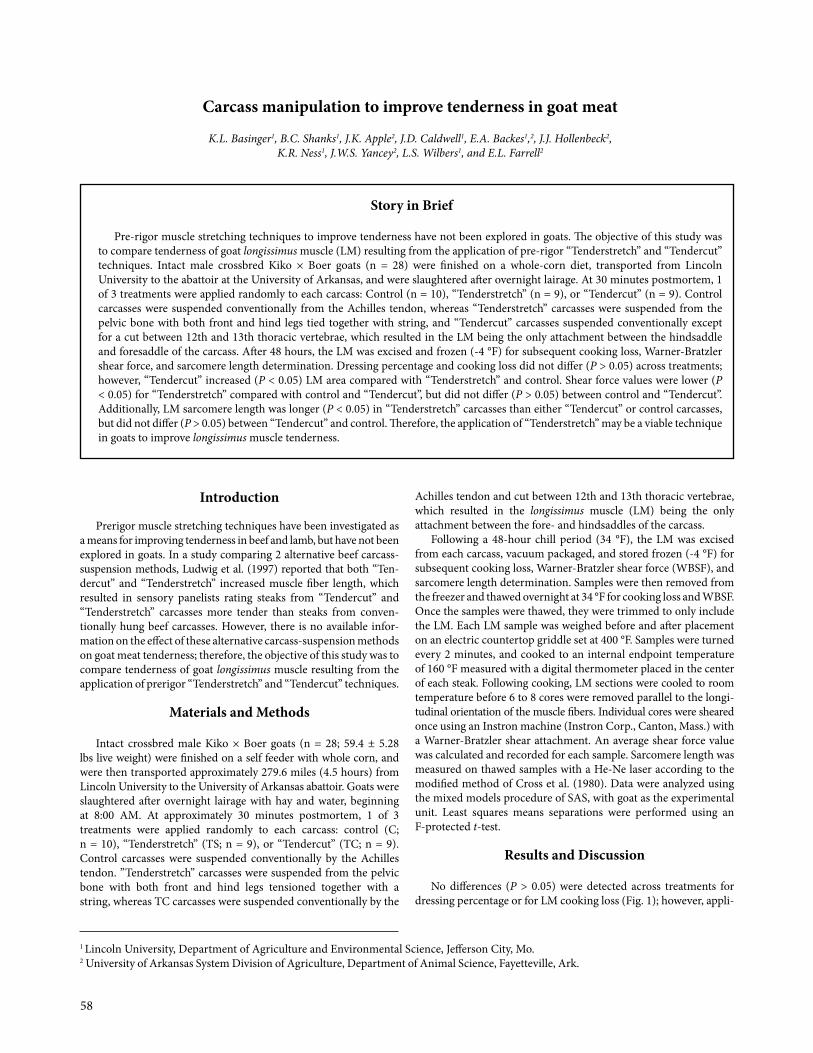
58
Introduction
Prerigor muscle stretching techniques have been investigated as a means for improving tenderness in beef and lamb, but have not been explored in goats. In a study comparing 2 alternative beef carcass-suspension methods, Ludwig et al. (1997) reported that both “Ten- dercut” and “Tenderstretch” increased muscle fiber length, which resulted in sensory panelists rating steaks from “Tendercut” and “Tenderstretch” carcasses more tender than steaks from conven-tionally hung beef carcasses. However, there is no available infor-mation on the effect of these alternative carcass-suspension methods on goat meat tenderness; therefore, the objective of this study was to compare tenderness of goat longissimus muscle resulting from the application of prerigor “Tenderstretch” and “Tendercut” techniques.
Materials and Methods
Intact crossbred male Kiko × Boer goats (n = 28; 59.4 ± 5.28 lbs live weight) were finished on a self feeder with whole corn, and were then transported approximately 279.6 miles (4.5 hours) from Lincoln University to the University of Arkansas abattoir. Goats were slaughtered after overnight lairage with hay and water, beginning at 8:00 AM. At approximately 30 minutes postmortem, 1 of 3 treatments were applied randomly to each carcass: control (C; n = 10), “Tenderstretch” (TS; n = 9), or “Tendercut” (TC; n = 9). Control carcasses were suspended conventionally by the Achilles tendon. ”Tenderstretch” carcasses were suspended from the pelvic bone with both front and hind legs tensioned together with a string, whereas TC carcasses were suspended conventionally by the
Achilles tendon and cut between 12th and 13th thoracic vertebrae, which resulted in the longissimus muscle (LM) being the only attachment between the fore- and hindsaddles of the carcass.
Following a 48-hour chill period (34 °F), the LM was excised from each carcass, vacuum packaged, and stored frozen (-4 °F) for subsequent cooking loss, Warner-Bratzler shear force (WBSF), and sarcomere length determination. Samples were then removed from the freezer and thawed overnight at 34 °F for cooking loss and WBSF. Once the samples were thawed, they were trimmed to only include the LM. Each LM sample was weighed before and after placement on an electric countertop griddle set at 400 °F. Samples were turned every 2 minutes, and cooked to an internal endpoint temperature of 160 °F measured with a digital thermometer placed in the center of each steak. Following cooking, LM sections were cooled to room temperature before 6 to 8 cores were removed parallel to the longi-tudinal orientation of the muscle fibers. Individual cores were sheared once using an Instron machine (Instron Corp., Canton, Mass.) with a Warner-Bratzler shear attachment. An average shear force value was calculated and recorded for each sample. Sarcomere length was measured on thawed samples with a He-Ne laser according to the modified method of Cross et al. (1980). Data were analyzed using the mixed models procedure of SAS, with goat as the experimental unit. Least squares means separations were performed using an F-protected t-test.
Results and Discussion
No differences (P > 0.05) were detected across treatments for dressing percentage or for LM cooking loss (Fig. 1); however, appli-
Carcass manipulation to improve tenderness in goat meat
K.L. Basinger1, B.C. Shanks1, J.K. Apple2, J.D. Caldwell1, E.A. Backes1,2, J.J. Hollenbeck2, K.R. Ness1, J.W.S. Yancey2, L.S. Wilbers1, and E.L. Farrell2
Story in Brief
Pre-rigor muscle stretching techniques to improve tenderness have not been explored in goats. The objective of this study was to compare tenderness of goat longissimus muscle (LM) resulting from the application of pre-rigor “Tenderstretch” and “Tendercut” techniques. Intact male crossbred Kiko × Boer goats (n = 28) were finished on a whole-corn diet, transported from Lincoln University to the abattoir at the University of Arkansas, and were slaughtered after overnight lairage. At 30 minutes postmortem, 1 of 3 treatments were applied randomly to each carcass: Control (n = 10), “Tenderstretch” (n = 9), or “Tendercut” (n = 9). Control carcasses were suspended conventionally from the Achilles tendon, whereas “Tenderstretch” carcasses were suspended from the pelvic bone with both front and hind legs tied together with string, and “Tendercut” carcasses suspended conventionally except for a cut between 12th and 13th thoracic vertebrae, which resulted in the LM being the only attachment between the hindsaddle and foresaddle of the carcass. After 48 hours, the LM was excised and frozen (-4 °F) for subsequent cooking loss, Warner-Bratzler shear force, and sarcomere length determination. Dressing percentage and cooking loss did not differ (P > 0.05) across treatments; however, “Tendercut” increased (P < 0.05) LM area compared with “Tenderstretch” and control. Shear force values were lower (P < 0.05) for “Tenderstretch” compared with control and “Tendercut”, but did not differ (P > 0.05) between control and “Tendercut”. Additionally, LM sarcomere length was longer (P < 0.05) in “Tenderstretch” carcasses than either “Tendercut” or control carcasses, but did not differ (P > 0.05) between “Tendercut” and control. Therefore, the application of “Tenderstretch” may be a viable technique in goats to improve longissimus muscle tenderness.
1 Lincoln University, Department of Agriculture and Environmental Science, Jefferson City, Mo. 2 University of Arkansas System Division of Agriculture, Department of Animal Science, Fayetteville, Ark.
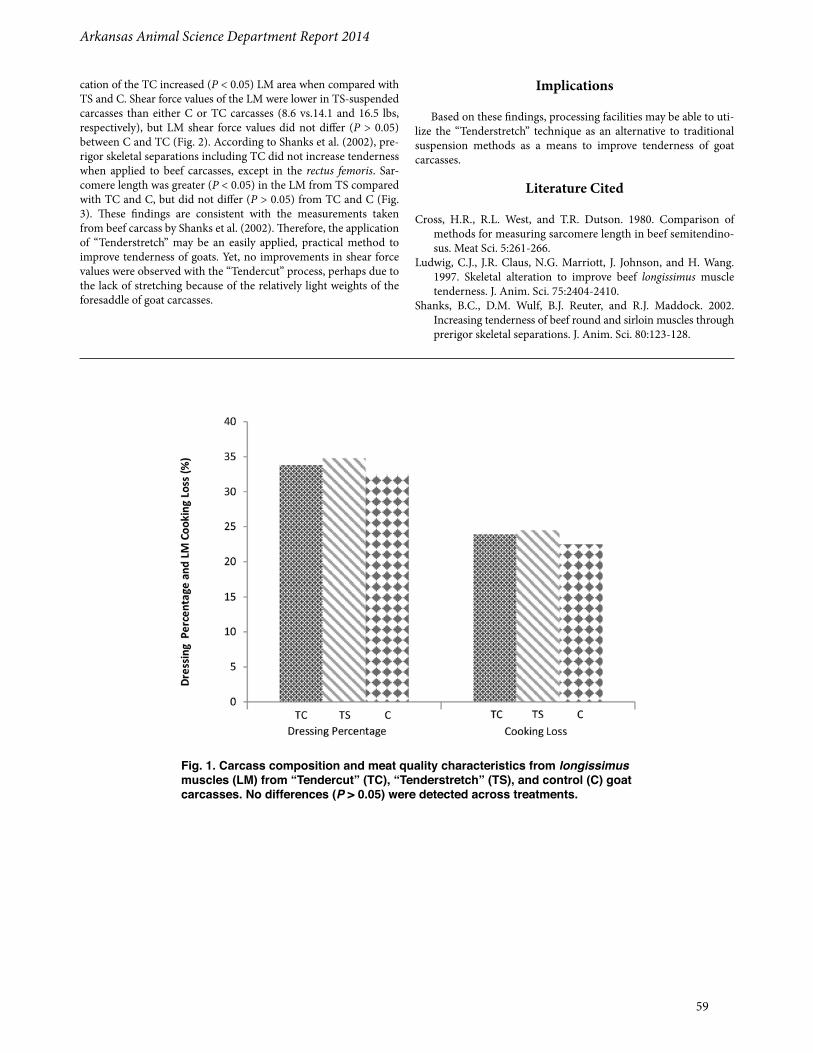
Arkansas Animal Science Department Report 2014
59
cation of the TC increased (P < 0.05) LM area when compared with TS and C. Shear force values of the LM were lower in TS-suspended carcasses than either C or TC carcasses (8.6 vs.14.1 and 16.5 lbs, respectively), but LM shear force values did not differ (P > 0.05) between C and TC (Fig. 2). According to Shanks et al. (2002), pre- rigor skeletal separations including TC did not increase tenderness when applied to beef carcasses, except in the rectus femoris. Sar-comere length was greater (P < 0.05) in the LM from TS compared with TC and C, but did not differ (P > 0.05) from TC and C (Fig. 3). These findings are consistent with the measurements taken from beef carcass by Shanks et al. (2002). Therefore, the application of “Tenderstretch” may be an easily applied, practical method to improve tenderness of goats. Yet, no improvements in shear force values were observed with the “Tendercut” process, perhaps due to the lack of stretching because of the relatively light weights of the foresaddle of goat carcasses.
Implications
Based on these findings, processing facilities may be able to uti-lize the “Tenderstretch” technique as an alternative to traditional suspension methods as a means to improve tenderness of goat carcasses.
Literature Cited
Cross, H.R., R.L. West, and T.R. Dutson. 1980. Comparison of methods for measuring sarcomere length in beef semitendino-sus. Meat Sci. 5:261-266.
Ludwig, C.J., J.R. Claus, N.G. Marriott, J. Johnson, and H. Wang. 1997. Skeletal alteration to improve beef longissimus muscle tenderness. J. Anim. Sci. 75:2404-2410.
Shanks, B.C., D.M. Wulf, B.J. Reuter, and R.J. Maddock. 2002. Increasing tenderness of beef round and sirloin muscles through prerigor skeletal separations. J. Anim. Sci. 80:123-128.
Fig. 1. Carcass composition and meat quality characteristics from longissimus muscles (LM) from “Tendercut” (TC), “Tenderstretch” (TS), and control (C) goat carcasses. No differences (P > 0.05) were detected across treatments.
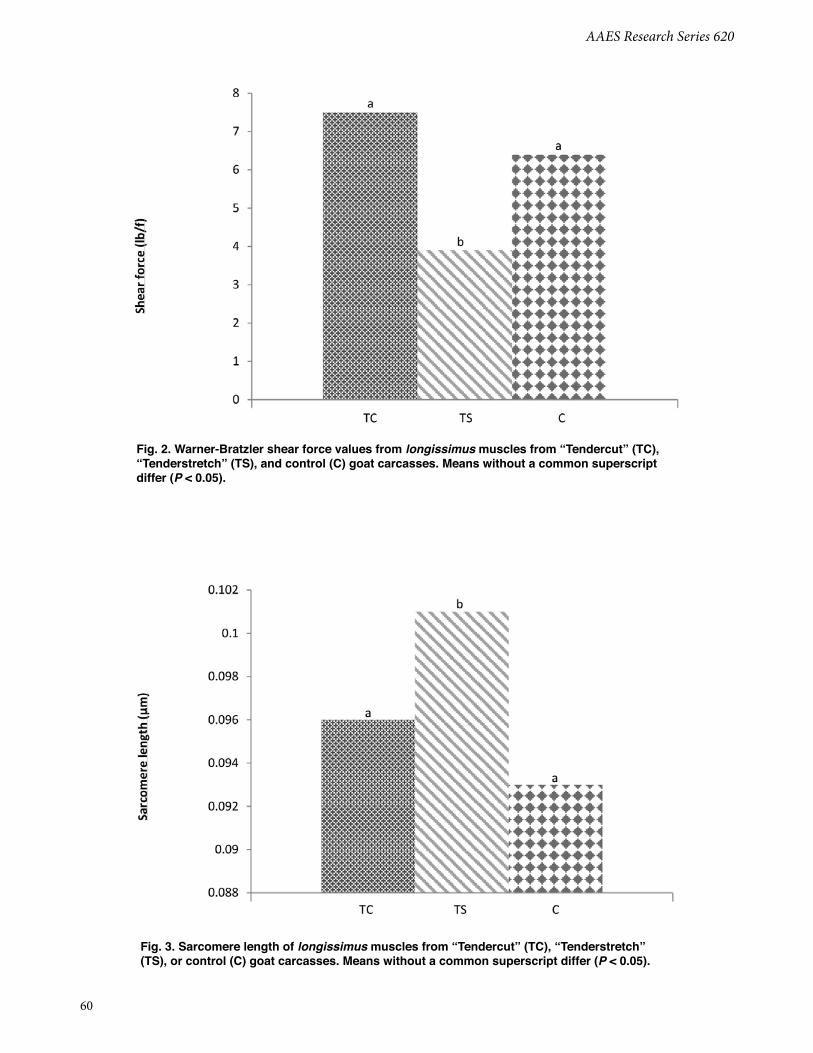
AAES Research Series 620
60
Fig. 2. Warner-Bratzler shear force values from longissimus muscles from “Tendercut” (TC), “Tenderstretch” (TS), and control (C) goat carcasses. Means without a common superscript differ (P < 0.05).
Fig. 3. Sarcomere length of longissimus muscles from “Tendercut” (TC), “Tenderstretch” (TS), or control (C) goat carcasses. Means without a common superscript differ (P < 0.05).