arloesiadur: an analytics experiment in innovation policy
TRANSCRIPT
ArloesiadurAn analytics experiment in
innovation policyJuan Mateos-Garcia
James GardinerJen Rae
Cambridge, Friday 16 2016
Structure
1. New data for innovation policy?2. Arloesiadur: principles and experiments3. Next steps
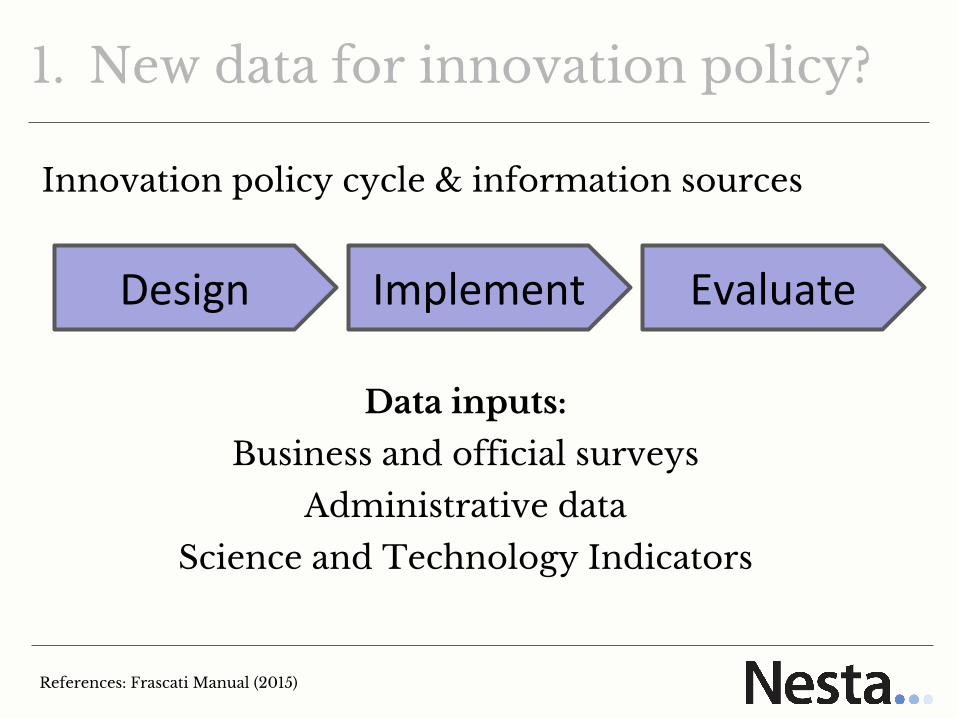
1. New data for innovation policy?
Innovation policy cycle & information sources
Design Implement Evaluate
References: Frascati Manual (2015)
Data inputs:
Business and official surveys
Administrative data
Science and Technology Indicators

Old data limitations and new opportunities
Emergence Complexity Ubiquity Variety
Inn
ova
tio
n f
eatu
res
& d
ata
lim
itat
ion
s
Rearview of the economy
Silos, reductionism
Hidden innovation
Unanswered questions
Web data to build new
taxonomies & capture
emergenceNew
dat
a o
pp
ort
un
itie
s Social data & ML to analyse
innovation dynamics
New sources to measure
innovation in non S&T
industries
Open up data and analysis to
bigger audiences
References: Nesta (2016), Bakhshi and Mateos-Garcia (2016).

New data isn’t a silver bullet
Risks of new data sources:
-Biases, temporal inconsistency
-Hard to communicate / interpret
-Privacy, ethics, IP
-Lack of capabilities
We need experiments to assess benefits & risks
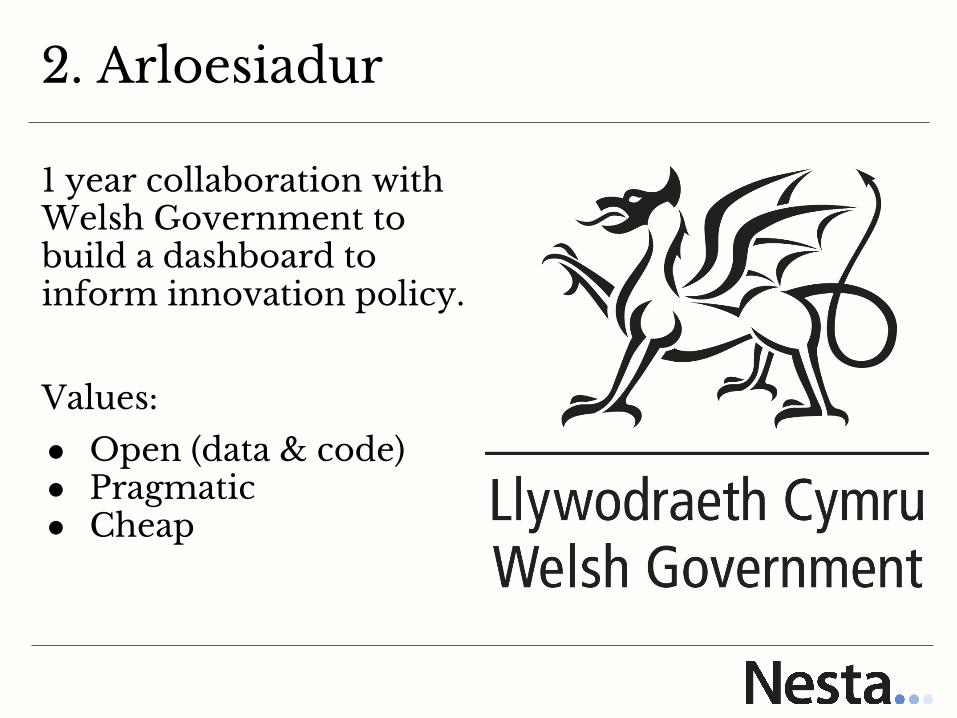
2. Arloesiadur
1 year collaboration with Welsh Government to build a dashboard to inform innovation policy.
Values:
● Open (data & code)● Pragmatic● Cheap
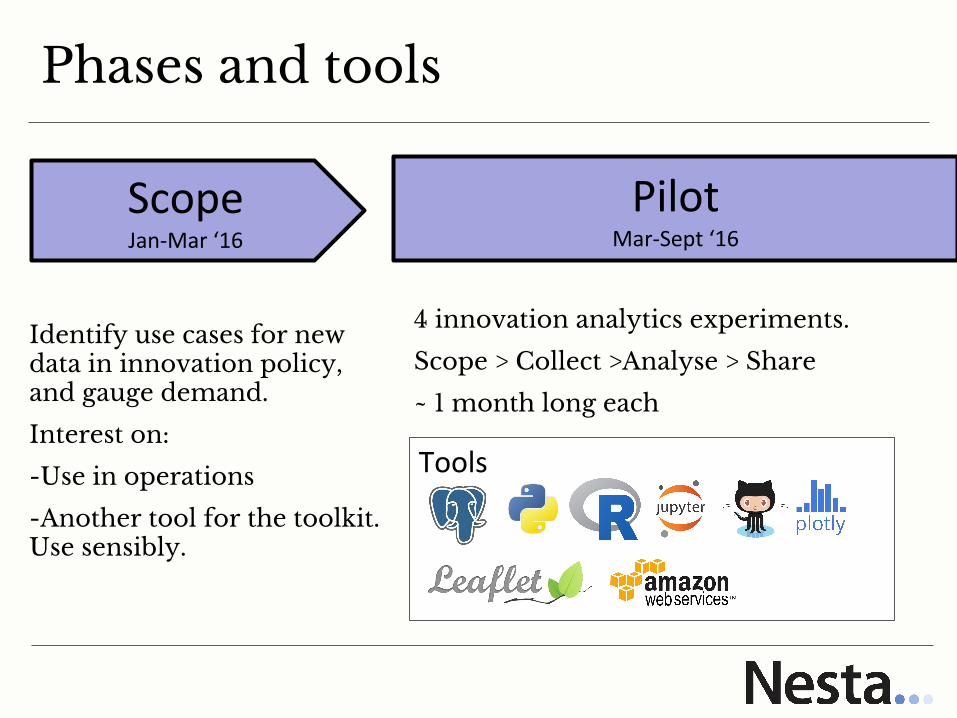
Phases and tools
ScopeJan-Mar ‘16
Identify use cases for new data in innovation policy, and gauge demand.
Interest on:
-Use in operations
-Another tool for the toolkit. Use sensibly.
4 innovation analytics experiments.
Scope > Collect >Analyse > Share
~ 1 month long each
Tools
PilotMar-Sept ‘16

Pilot 1: emergence
Question: Can we use semi and unstructured data from ‘innovation platforms’ to analyse the development of new tech topics?
Application: Monitor trends, identify & engage innovation communities.
Lessons:
● Topic extraction challenging w/ unstructured data
● Meetup = site of diffusion, not development
References: Rotolo et al (2015), Mateos-Garcia and Gardiner (2016b)

Pilot 2: Complexity
Question: Can we use open (Gateway to Research) data to map scientific collaboration networks, and map university-industry links?
Application: Identify areas of strength, visualise and assess networks, target interventions, micro and meso monitoring.
Lesson:
● Very complex dataset● Geocoding & matching harder
than expected
References: Mateos-Garcia and Gardiner (2016a)
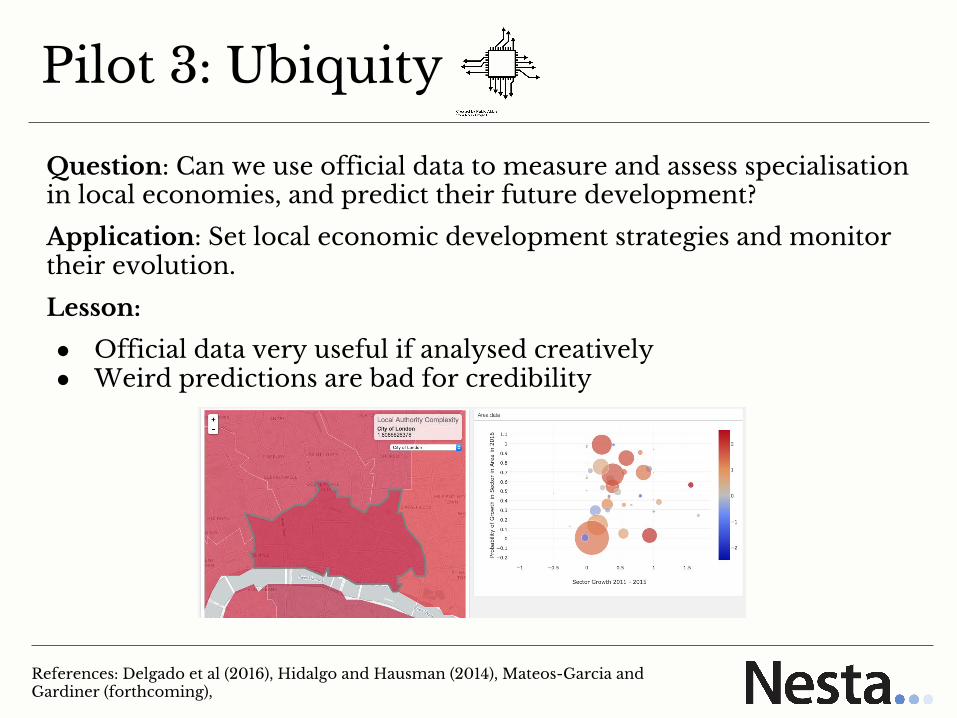
Pilot 3: Ubiquity
Question: Can we use official data to measure and assess specialisation in local economies, and predict their future development?
Application: Set local economic development strategies and monitor their evolution.
Lesson:
● Official data very useful if analysed creatively● Weird predictions are bad for credibility
References: Delgado et al (2016), Hidalgo and Hausman (2014), Mateos-Garcia and Gardiner (forthcoming),

3. Next steps
BuildOct ‘16 - Mar ‘17
4th Pilot (Variety)
Identify and map innovative firms with government, open, official data.
Commission development of Arloesiadur platform, using open source stack and building on existing work at MIT Media Lab.
Analyse usage and get feedback, measure impacts, share findings.
Conclusions (for now)
● Unexpected: More policy use cases than initially envisaged - especially around operations.
● Sort-of-expected: Open and official data very useful in combination with new methods and data.
● Expected (but still painful): Unstructured data is difficult to work with.
Unlikely that innovation policymakers will be automated for now
Phew!!
