army global basing posture - rand.org · conducted may 2009–march 2010. ... united national...
TRANSCRIPT

Research Report
Army Global Basing Posture
An Analytic Framework for Maximizing Responsiveness and Effectiveness
Thomas S. Szayna, Paul Dreyer, Derek Eaton, Lisa Saum-Manning
Prepared for the United States Army Approved for public release; distribution unlimited
ARROYO CENTER

Limited Print and Electronic Distribution Rights
This document and trademark(s) contained herein are protected by law. This representation of RAND intellectual property is provided for noncommercial use only. Unauthorized posting of this publication online is prohibited. Permission is given to duplicate this document for personal use only, as long as it is unaltered and complete. Permission is required from RAND to reproduce, or reuse in another form, any of its research documents for commercial use. For information on reprint and linking permissions, please visit www.rand.org/pubs/permissions.html.
The RAND Corporation is a research organization that develops solutions to public policy challenges to help make communities throughout the world safer and more secure, healthier and more prosperous. RAND is nonprofit, nonpartisan, and committed to the public interest.
RAND’s publications do not necessarily reflect the opinions of its research clients and sponsors.
Support RANDMake a tax-deductible charitable contribution at
www.rand.org/giving/contribute
www.rand.org
For more information on this publication, visit www.rand.org/t/rr158
Published by the RAND Corporation, Santa Monica, Calif.
© Copyright 2015 RAND Corporation
R® is a registered trademark.

iii
Preface
This report documents the results of a project entitled “Army Global Posture.” The project aimed to examine the global positioning of Army forces and assets in the light of ongoing and potential changes in the national security environment and to evaluate U.S. Army stationing, prepositioning, security cooperation activities, and deployments. The analysis was conducted to support recommendations to Army leadership on improving future Army responsiveness and effectiveness.
The report should be of interest to those concerned with U.S. global posture and national security strategy, especially as it pertains to U.S. land power. Research for this project was conducted May 2009–March 2010. The conclusions were updated based on information as of October 2010. The report was reviewed and revised in 2011–2012.
This study was conducted before the 2012 defense strategy guidance addressed the rebalance to the Asia-Pacific region and prior to the full development of the Army’s regionally aligned forces. U.S. basing and forward posture continue to evolve in response to the international security environment, and the U.S. posture has already changed since the completion of research for this study. The value of this study is in the methodology it outlines, as it provides a framework and a model for integrating the variety of criteria for basing of U.S. forces abroad.
This research was sponsored by the Army Quadrennial Defense Review (QDR) Office in the Office of the Deputy Chief of Staff, G-8, Headquarters, Department of the Army, and was conducted within RAND Arroyo Center’s Strategy, Doctrine, and Resources Program. RAND Arroyo Center, part of the RAND Corporation, is a federally funded research and development center sponsored by the United States Army.
The Project Unique Identification Code (PUIC) for the project that produced this document is ASPMO09521.
For comments or further information, please contact the project leader, Thomas Szayna (telephone 310-393-0411, extension 7758, email [email protected]).
For more information on RAND Arroyo Center, contact the Director of Operations (telephone 310-393-0411, extension 6419; fax 310-451-6952; email [email protected]) or visit Arroyo’s website at http://www.rand.org/ard/.


v
Contents
Preface ............................................................................................................................................ iii Figures........................................................................................................................................... vii Tables ............................................................................................................................................. ix Summary ........................................................................................................................................ xi Acknowledgements ..................................................................................................................... xvii Abbreviations ............................................................................................................................... xix 1. Introduction ................................................................................................................................. 1
The Context .............................................................................................................................................. 1 Determinants of Current Posture .......................................................................................................... 1
Data and Approach ................................................................................................................................... 3 Objectives and Organization .................................................................................................................... 6
2. Global Posture: Key Elements .................................................................................................... 9 Main Elements of Effective Global Posture ............................................................................................. 9
Missions ................................................................................................................................................ 9 Base Types ......................................................................................................................................... 11 Base Locations ................................................................................................................................... 13
Modeling Inputs: Missions ..................................................................................................................... 13 Mission Lift Requirements ................................................................................................................. 14 Target States for Short-Warning Missions ......................................................................................... 19
Modeling Inputs: Base Locations ........................................................................................................... 20 Political Reliability ............................................................................................................................. 21 Accessibility ....................................................................................................................................... 25 Results: Base Locations ...................................................................................................................... 25
3. Assessing Utility of Basing Options for Short-Warning Missions ........................................... 29 Methodology ........................................................................................................................................... 29 Results: Global Analysis ........................................................................................................................ 32 Results: Regional Analysis ..................................................................................................................... 41 Findings: Responsiveness ....................................................................................................................... 45
4. Assessing Utility of Basing Options for Steady State Requirements ....................................... 47 Benefits and Drawbacks of Forward Presence for Security Cooperation .............................................. 47 Approaches to BPC Presence ................................................................................................................. 49
Small Training Teams ........................................................................................................................ 49 Intermittent Rotation of Battalion- to Brigade-Size Units ................................................................. 51 Brigade-Sized Deployment ................................................................................................................ 52
Basing Implications ................................................................................................................................ 53 Conclusions ............................................................................................................................................ 54

vi
5. Findings and Recommendations ............................................................................................... 55 Findings .................................................................................................................................................. 55 Recommendations .................................................................................................................................. 57
Appendixes A. Political Reliability and Accessibility Methodology and Findings ......................................... 61 B. Force Packages and Potential Base Locations ......................................................................... 85 C. Global Posturing Model ........................................................................................................... 99 References ................................................................................................................................... 105

vii
Figures
3.1. Basing Options and Contingencies in the Americas ........................................................... 32 3.2. Map of Basing Options and Contingencies in Africa, Australia, and Eurasia .................... 33 3.3. Results: Contingencies Must be Addressed by at Least One Current Army Base ............. 34 3.4. Results: Contingencies Must be Addressed by at Least One Current Large Army
Base ..................................................................................................................................... 36 3.5. Results: Deterrence and Failed State Missions Only, Current Bases ................................. 37 3.6. Results: At Least Two Bases per Contingency, Current Large Army Bases Only ............. 38 3.7. Results: At Least Two Bases per Contingency, Current Army Bases Only ....................... 39 3.8. Results: At Least Two Bases per Contingency, Current Bases Preferred .......................... 40 A.1. United Nations Support Index for Plenary Votes, by State ................................................ 64 A.2. United Nations Index for Important Votes, by State .......................................................... 64 A.3. United Nations Support Index Plenary Versus Important Votes:
1990–2008........................................................................................................................... 65 A.4. United National Important Vote Score Averages in Europe, 1990–2008 .......................... 68 A.5. United Nations Important Vote Score Averages in East Asia and the Western
Pacific, 1990–2008 ............................................................................................................. 68 A.6. United Nations Important Vote Score Averages in the Americas, 1990–2008 .................. 69 A.7. United Nations Important Vote Score Averages in the Middle East and Southwest
Asia, 1990–2008 ................................................................................................................. 69 A.8. United Nations Important Vote Score Averages in Africa 1990–2008 .............................. 70 B.1. The Relationship Between MOG and Closure Time .......................................................... 93


ix
Tables
2.1. Deterrence Task Force ........................................................................................................ 15 2.2. State Failure Response Task Force ..................................................................................... 16 2.3. Counterterrorism Direct Action Task Force ....................................................................... 17 2.4. Humanitarian Relief Operations Task Force ...................................................................... 17 2.5. Deployment Target States and Missions ............................................................................. 21 2.6. States Used in Modeling to Determine Utility for Short-Warning Missions ...................... 27 3.1. Air Bridge Times as a Function of MOG and C-17s Required .......................................... 30 3.2. Maximum-on-Ground Parameters for Each Contingency ................................................. 31 3.3. Regional Results for Western Hemisphere Contingencies ................................................. 41 3.4. Regional Results for East Asia Contingencies .................................................................... 41 3.5. Regional Results for Europe, Middle East, and Africa Contingencies .............................. 42 3.6. Airlift and Sealift Comparisons: Americas, Africa, and Europe ........................................ 43 3.7. Airlift and Sealift Comparisons: East Asia, Middle East, and South Asia ......................... 44 A.1. Rankings Combining United Nations Important Votes and Democracy Trends—
Northern Europe .................................................................................................................. 71 A.2. Rankings Combining United Nations Important Votes and Democracy Trends—
Southern Europe .................................................................................................................. 72 A.3. Rankings Combining United Nations Important Votes and Democracy Trends—
East Asia ............................................................................................................................. 73 A.4. Rankings Combining United Nations Important Votes and Democracy Trends—
Western Pacific ................................................................................................................... 74 A.5. Rankings Combining United Nations Important Votes and Democracy Trends—
Southeast Asia ..................................................................................................................... 75 A.6. Rankings Combining United Nations Important Votes and Democracy Trends—
South Asia ........................................................................................................................... 75 A.7. Rankings Combining United Nations Important Votes and Democracy Trends—
Asia Minor and Caucasus ................................................................................................... 76 A.8. Rankings Combining United Nations Important Votes and Democracy Trends—
Middle East and Persian Gulf ............................................................................................. 77 A.9. Rankings Combining United Nations Important Votes and Democracy Trends—
Southwest and Central Asia ................................................................................................ 77 A.10. Rankings Combining United Nations Important Votes and Democracy Trends—
South America .................................................................................................................... 78 A.11. Rankings Combining United Nations Important Votes and Democracy Trends—
Caribbean ............................................................................................................................ 79

x
A.12. Rankings Combining United Nations Important Votes and Democracy Trends— Central America .................................................................................................................. 80
A.13. Rankings Combining United Nations Important Votes and Democracy Trends— Northern Africa ................................................................................................................... 80
A.14. Rankings Combining United Nations Important Votes and Democracy Trends— Southern Asia ...................................................................................................................... 81
A.15. Rankings Combining United Nations Important Votes and Democracy Trends— Eastern Africa ..................................................................................................................... 82
A.16. Rankings Combining United Nations Important Votes and Democracy Trends— Northern Africa ................................................................................................................... 82
A.17. Rankings Combining United Nations Important Votes and Democracy Trends— Central Africa ...................................................................................................................... 83
B.1. Force Package Lift Characteristics ..................................................................................... 87 B.2. Existing U.S. Bases or Access Arrangements .................................................................... 89 B.3. APOEs and SPOEs for Existing Bases or Access Arrangements ....................................... 90 B.4. APOEs and SPOEs in the Candidate Countries .................................................................. 91 B.5. Contingency APODs ........................................................................................................... 92 B.6. Contingency SPODs ........................................................................................................... 95

xi
Summary
The U.S. global defense posture is an integral and critical component of the U.S. security strategy. The term global defense posture of the United States refers to the size, location, types, and capabilities of the U.S. forward military forces. Current posture includes elements of the Cold War basing system developed to support the containment strategy, modified in line with the deployment and engagement of U.S. forces in southwest Asia since 1990 and as a consequence of the Department of Defense’s 2004 Global Posture Review. The 2010 Quadrennial Defense Review (QDR) revisited the issue and made global defense posture one of the main topics for consideration.
Note that this study was conducted before the 2012 defense strategy guidance addressed the rebalance to the Asia-Pacific region and prior to the full development of the Army’s regionally aligned forces. U.S. basing and forward posture continue to evolve in response to the international security environment, and the U.S. posture has already changed since the completion of research for this study. The value of this study is in the methodology it outlines, as it provides a framework and a model for integrating the variety of criteria for basing of U.S. forces abroad.
Decisions on modifying the U.S. overseas basing structure are a matter of high-level national policy, but they have consequences for the Title 10 responsibilities of the armed services because the services will implement these decisions and the policies that flow from them. Given such a role, the armed services have an interest in and a contribution to make to the decisionmaking process. This study attempts to advance the Army’s understanding of the implications of potential changes in global posture for the land power capabilities it organizes, trains, and equips.
Despite massive drawdowns in the last two decades in the number of Army forces forward deployed (especially in Europe), the outlines of the military infrastructure developed during the Cold War remain in place and play a critical role in the ability of Army forces to project power. The posture these bases provide has been supplemented by the low-footprint way of projecting U.S. forces by way of rotational deployments, by establishing contingency access arrangements, and by building relationships with partner militaries in more subtle ways. The current security environment is conducive to further basing arrangements of the low-footprint type.
Key Elements of U.S. Global Posture
Three main elements determine a robust and effective Army global posture. In a nutshell, the issue is one of the interplay of missions assigned to Army forces, the types of basing choices, and base locations.

xii
In terms of types of bases, and in line with the current security environment, we focus primarily on the rotational bases and contingency access arrangements. While the main operating bases that remain from the Cold War era investments are critical to power projection, new arrangements are likely to take the form of rotational forward operating sites in austere locations, shared facilities, or cooperative security locations that U.S. forces use as needed. Prepositioning of equipment retains its role of allowing rapid response to time-sensitive contingencies.
In terms of missions, we distinguish between short-warning contingency response missions and predictable and planned-in-advance missions. The former category includes crisis-time deployments to an ally or partner to deter another state, stability operations in response to state failure, counterterrorist operations, and humanitarian relief operation. The latter primarily includes security cooperation, including meeting alliance commitments and Building Partner Capacity (BPC). The short-warning missions make forward basing important for responsiveness and, for the deterrence mission, bring in the issue of robustness. Considerations of the best way to support security cooperation efforts, including basing arrangements to the extent they are necessary, come into play for the steady-state planned missions.
In terms of base locations, utility of the site in contributing to mission effectiveness is only one of the criteria for assessment. But utility alone is an insufficient criterion for making basing decisions. The utility of the best geographically located base is zero if the host state refuses to allow the United States the use of the base in a contingency. Ease of accessibility to and reliability of use of the base for a contingency when U.S. authorities decide to do so are critical factors for basing choices. Other—secondary—factors include the existing level of infrastructure in the state to support U.S. base operations and, for extended tours, quality-of-life considerations for deployed personnel.
We assessed the reliability of potential basing locations from a perspective of unconstrained operations of U.S. forces from the base. We chose two proxy indicators for what we call political reliability, with the primary indicator providing an assessment of similarity of views of the host state with those of the United States regarding the international security environment during the past 20 years. The secondary indicator examined the level of democratic development in each state. The purpose was to determine, for planning purposes and in a clearly delineated data-driven fashion, the likelihood that the state’s foreign policy regarding U.S. interests remained consistent and relatively predictable. We assessed every state in the world in this manner and chose the two most politically reliable states in each subregion of the world for further examination for responsiveness as potential hosts for U.S. Army forces for short-warning missions. We also added to the list for closer examination several states with an existing major U.S. presence (and which were not on the initial list), for a total of 41 states for inclusion in our modeling effort. Each potential host state selected had to have a site suitable for a forward operating site where an Army unit could be based; we used the coordinates for the specific site in our modeling effort. We added two U.S. territories (Guam and Puerto Rico) and four U.S. locations to the list (including Hawaii and Alaska).

xiii
Assessing Utility of Basing Options for Short-Warning Missions We used a version of the Global Posturing Model developed by RAND Arroyo Center to
determine the potential basing locations to handle all contingencies in a timely fashion. For the purposes of our analysis, we created force packages and calculated associated weights (expressed in terms of C-17 sorties required) for each short-warning mission. We then created a set of illustrative scenarios, designed to provide geographical diversity while remaining plausible for planning purposes, as inputs to our modeling of responsiveness.
The analysis involved 49 basing locations (including current and potential bases) and 34 short-warning missions. We structured the analysis in a variety of ways, including seeking out robust solutions (two or more bases for each contingency), favoring current bases, and efficiency-based criteria favoring the fewest bases. We included all time-sensitive missions and prioritized only some of the mission types. We performed the analysis globally and regionally. We purposely took into account the whole globe and considered every region, so that we would not miss any counterintuitive solutions, even though we understand that, in certain regions, such as the Western Hemisphere, there is no apparent need for additional U.S. bases outside U.S. territory.
Our analysis shows that there are many good choices for basing Army forces for short-warning missions in all regions of the world. Changes in Army posture and forward basing could bring about a more robust set of bases and improve the response time for short-warning missions in all contingencies. It is also clear that the responsiveness benefits from such changes are marginal and usually measured in hours rather than days. Forward basing arrangements already in place provide substantial reach and contingency response capabilities. This leads us to conclude that, unless there is a clear need for greater responsiveness or robustness in a specific region or subregion, responsiveness gains alone are too small to justify major new investments.
Our analysis also makes clear that airlift is most responsive for small- and medium-sized short-warning contingencies and for the leading edge of a large deployment. Ensuring that aerial ports of debarkation have adequate maximum-on-ground capacity to receive rapidly deploying Army forces is an essential capability that would increase the speed of deployment. Surface movement (land or water) is competitive for bases and contingencies within the same region and for some contingencies in nearby regions. For the larger force packages, such as those associated with a deterrence mission, surface movement may be preferred. The unique value of sea-based prepositioned equipment is that it makes surface lift even more competitive if we allow for preemptive movement with some strategic warning.1
1 We use strategic warning here to refer to the possibility that, prior to a final political decision on intervention, sea-based prepositioned equipment is placed on alert and sails from its home port toward a potential destination. For purposes of our analysis, the early sailing in response to such a warning means a reduction in the distance and time to close to the sea port of debarkation.

xiv
As for the specific locations suitable for consideration for greater Army presence, based on responsiveness criteria alone, the following states emerge as most attractive:
• Europe: Romania, Bulgaria • Southwest Asia and Middle East: Cyprus, Oman • Africa: Djibouti, Kenya • East Asia and Western Pacific: Singapore, Thailand, Australia, Guam (U.S. territory) • Americas: Honduras, Peru.
Since U.S. military facilities exist in many of these states, the issue is one of increased presence. The sites that we list offer some advantages over existing sites, although we see them more as complements rather than substitutes for existing major Army bases abroad.
Assessing Utility of Basing Options for Steady-State Requirements
The ideal basing posture for the potentially critical but non–time sensitive mission of steady-state security cooperation and BPC through train and assist operations is more difficult to determine than responsiveness to short-warning missions, since decisions on choice of partners and the size and scope of security cooperation are essentially political. If the past model is a good harbinger of the type of future demand for security cooperation, it is arguable whether such missions even require a substantial overseas basing footprint.
There are a number of approaches to BPC that might require an overseas presence:
1. the deployment of small training teams 2. the short-term intermittent rotation of battalion- to brigade-sized elements to conduct
joint maneuver training with partners 3. the in-theater deployment of a brigade-sized element that could conduct periodic unit
maneuver training with partners or provide training detachments for partner unit-level and individual training.
The three approaches are not mutually exclusive and can be employed either autonomously or in coordination with each other.
Assuming that brigades augmented for security force cooperation are assigned to the geographic combatant commands (COCOMs) as force providers, we see a number of implications for forward basing, although the specifics depend on the choice of U.S. footprint, the type of institutional assistance needed, and the infrastructure in place in the region. Africa Command is probably the COCOM that is most pertinent in terms of potential basing needs.
Recommendations The results of our analysis provide an initial first cut at the states where either increased or
new Army presence may be useful for improving responsiveness and/or increasing effectiveness for security cooperation. But further action depends on determination of a need for greater

xv
robustness, faster responsiveness, or deepening a critical security and defense relationship in a given region.
In a nutshell, the Army should consider the following:
• conducting a detailed cost estimate of the infrastructure improvements needed in the states deemed most appropriate for increased Army presence
• monitoring demand for security force assistance and BPC and considering basing choices as part of the solution set, as necessary
• experimenting with different ways of providing BPC, in terms of basing arrangements, within a geographical COCOM to gain a better understanding of the costs and benefits of the different ways.
Finally, for future analytical purposes, the framework we developed in our study is amenable for use by COCOMs (and Army service component commands for planning purposes. It brings a critical strategic assessment (reliability) as a preliminary step prior to the calculations of responsiveness. Moreover, the strategic assessment is based on a unique cross-comparable data set that is empirically based, warrants continuous updating, and is not amenable to being “gamed” easily (the data set establishes a starting point for comparison of a country’s stance vis-à-vis the United States that is based not on assumed foreign and security policy goals but on a record of “revealed preference”). The original tool we developed is able to include costs in the calculations.


xvii
Acknowledgements
The authors are grateful to BG Francis G. Mahon, Headquarters Department of the Army (HQDA) G-8, for sponsoring the study. We thank Timothy Muchmore, HQDA G-8, for monitoring the study and providing constructive feedback during its course.
At the Surface Deployment and Distribution Command, Transportation Engineering Agency, we would like to thank Steven A. Hondel for his generous support.
We also thank Alan Vick, Forrest Morgan, and Frances Lussier for their comprehensive reviews of an earlier version of this report. Their comments improved the document.
At RAND, we are indebted to Kevin Kawasaki, Peter Chalk, Phil Williams, Charlotte Lynch, Mark Wang, Lisa Colabella, David Kassing, and Eric Peltz. Julie Ann Tajiri put the report into RAND style and format. Phyllis Gilmore edited the report.

xviii

xix
Abbreviations
AAF Army airfield AB air base ACL allowable cabin load ADA air defense artillery AFCESA/CESC Air Force Civil Engineer Support Agency AFMAN Air Force manual AFPAM Air Mobility Planning Factors AFRICOM Africa Command AMC Air Mobility Command AOR area of responsibility APOD aerial port of debarkation APOE aerial port of embarkation ASRR Airfield Suitability and Restrictions Report BCT brigade combat team BIOT British Indian Ocean Territory BOT British Overseas Territories BPC building partner capacity BSR Base Structure Report COCOM combatant command CONUS continental United States CSL cooperative security locations DoD Department of Defense DoDI Department of Defense instruction EEH early entry hospital FOS forward operating site FY fiscal year GAO Government Accountability Office GPM Global Posturing Model HBCT heavy brigade combat team HIMARS high-mobility artillery rocket system HMMWV high-mobility multipurpose wheeled vehicle HQ headquarters HQDA Headquarters, Department of the Army IAP international airport IBCT infantry brigade combat team

xx
ICAO International Civil Aviation Organization IGPBS Integrated Global Presence and Basing Strategy JFAST Joint Flow and Analysis System for Transportation JTF joint task force LMSR Large Medium-Speed Roll-on/Roll-off ship MEB maneuver enhancement brigade MIP mixed-integer program MOB main operating base MOG maximum-on-ground MTMCTEA Military Traffic Management Command Transportation Engineering
Agency NAF Naval Air Facility NATO North Atlantic Treaty Organization nm nautical mile NCO noncommissioned officer NORTHCOM Northern Command NS Naval Station NSF Naval Support Facility NTC National Training Center OEF Operation Enduring Freedom OSUT One Station Unit Training PAX passengers PRV plant replacement value PS preposition site PUIC Project Unique Identification Code QDR Quadrennial Defense Review RAF Royal Air Force SBCT Stryker brigade combat team SDDC/TEA Surface Deployment and Distribution Command/Transportation
Engineering Agency SF Special Forces SFA security force assistance SOUTHCOM Southern Command SPOD sea port of debarkation SPOE sea port of embarkation SRC Standard Requirement Code STON short ton SW southwest TACC Tanker Airlift Control Center

xxi
TARGET Transportability Analysis Report Generator THAAD Terminal High Altitude Area Defense UAE United Arab Emirates UK United Kingdom UN United Nations USAF U.S. Air Force


1
1. Introduction
The Context
The Army is the primary provider of U.S. land power. Army forces can and do project land power from CONUS. But forward deployment of an Army combat unit has a meaning all its own and can demonstrate U.S. resolve to deter aggression and promote U.S. interests abroad. To understand potential changes to the current posture, we briefly summarize in this chapter the development of the U.S. forward presence during the Cold War, the changes to the Cold War posture in the first decade of the 21st century, and the existing U.S. military infrastructure overseas using a variety of metrics.
Determinants of Current Posture
As used by the Department of Defense (DoD), the term global defense posture of the United States
comprises the size, location, types, and capabilities of its forward military forces. It constitutes a fundamental element of our ability to project power and undertake military actions beyond our borders. Together with our overall military force structure, our global defense posture enables the United States to assure allies, dissuade potential challengers, deter our enemies, and defeat aggression if necessary.2
Current posture includes elements of the Cold War–era basing system developed as part of the United States’ strategy of containment and deterrence.3 Most of the U.S. Army forces in Europe were based in Germany and designed to deter Soviet forces. Other European North Atlantic Treaty Organization (NATO) countries provided bases to support and sustain that effort. In Asia, U.S. and South Korean forces were postured to deter North Korea. U.S. bases in Japan provided support to them. In both areas of direct confrontation, Army forces were based where they were expected to fight, and installations nearby were developed to provide support and sustainment. The posture developed in response to clear threats; access to bases was certain; and the reliability of host states to allow unconstrained U.S. operations was high.
Beyond the two areas of direct Cold War confrontation, the United States maintained an array of military bases elsewhere for regional presence and special purposes. Air and naval bases
2 DoD, Strengthening U.S. Global Defense Posture, Report to Congress, September 2004, p. 4. 3 For a review of the evolution of the U.S. overseas basing system and the politics behind it, see Kent E. Calder, Embattled Garrisons: Comparative Base Politics and American Globalism, Princeton, N.J.: Princeton University Press, 2007. See also Alexander Cooley, Base Politics: Democratic Change and the U.S. Military Overseas, Ithaca, N.Y.: Cornell University Press, 2008.

2
maintained in the Philippines after World War II played an important role in the Vietnam War and more generally in supporting deployments in the region. During the Vietnam War, the United States also established bases in Thailand. Bases in Panama provided access and supported counterdrug and contingency operations throughout Central and South America. Diego Garcia kept military options open for operations that the lack of basing in the Persian Gulf area otherwise might have forestalled.
The Cold War basing posture remained in place throughout the 1990s, although the extent of forward presence declined gradually, especially in Europe, while U.S. force deployments increased in southwest Asia. DoD unveiled a plan to revise the global defense posture in August 2004.4 The changes, in what later became known as the Integrated Global Presence and Basing Strategy (IGPBS), aimed to provide a long-term comprehensive basing strategy integrated with the base consolidation process in the United States (Base Realignment and Closure). The objective of the IGPBS was to increase U.S. strategic responsiveness and decrease the overseas footprint and exposure.5 The IGPBS changed the U.S. approach to forward basing by favoring the establishment of more austere and temporary basing arrangements in some of the states that were post–Cold War U.S. partners and allies at the expense of the large and permanent installations that the United States had built up over many years as part of the containment strategy against the Soviet Union. In retrospect, perhaps the most important element of the IGPBS was its emphasis on low footprint, limited presence, and contingency access arrangements as the preferred way to establish new U.S. forward presence, while reducing overall the extent of U.S. presence overseas in favor of stationing in the United States.
The 2010 Quadrennial Defense Review (QDR) made global defense posture one of the main topics for consideration. The QDR outlined five main principles for making defense posture decisions:6
• the continued necessity of forward-stationed forces to meet alliance commitments, build relationships with partner militaries, and increase U.S. regional understanding and expertise
• balancing the need to take into account current commitments with the ability to respond to potential contingencies elsewhere
• the importance of strategic depth in assuring access to support ongoing operations • the stabilizing influence of U.S. military presence within the region and a welcoming
attitude by the host country • a continuously adaptive stance to allow rapid response to emerging threats.
4 DoD, 2004. 5 For an explanation of the strategy and goals behind the realignment by one of the main officials in charge of the strategy, see Ryan Henry, “Transforming the U.S. Global Defense Posture,” Naval War College Review, Vol. 59, No. 2, Winter/Spring 2006, pp. 12–28. 6 DoD, Quadrennial Defense Review Report, Washington, D.C., 2010, pp. 63–4.

3
These broad principles and their regional implications remain important. One, the U.S. military presence in Europe remains important to deter any intimidation of allies and gives the U.S. influence in southeast Europe, the Black Sea region, and the Caucasus. Two, the maritime environment and the large distances of the Asia-Pacific place a premium on an effective basing posture that takes into account alliance commitments, credible deterrence of potential adversaries, and responsiveness to humanitarian crises and natural disasters. While U.S. forces remain in Japan and Korea, other partners may emerge, and Guam is on track to become a pivotal point for U.S. power projection in the western Pacific.7 Three, supporting operations in the greater Middle East remains a critical aspect of U.S. basing infrastructure in the Middle East and in South and Central Asia, although the QDR also emphasizes reassuring regional allies and partners of long-term U.S. commitment. Sensitivity to the stationing of large U.S. forces is an important consideration for U.S. basing decisions in the greater Middle East.8 Four, capacity-building efforts form the core of U.S. defense posture in Africa, meaning a light footprint, working with existing infrastructure, and ensuring contingency access.9 Five, given the geographical proximity to the United States, there is little need for a robust forward presence in Central and South America.10
The above guidelines outlined the major directions for thinking about realignment of the U.S. global defense posture. In addition, based on DoD’s guidance in 2008, each geographic combatant command (COCOM), except U.S. Northern Command (NORTHCOM), has developed an annual theater posture plan as part of its theater campaign plan. However, realigning U.S. global defense posture in line with the changing security environment is a continuous work in progress.
Data and Approach Decisions on modifying the U.S. overseas basing structure are a matter of high-level national
policy, with a variety of military and political criteria entering the calculations. The criteria include the strategic location that makes forward presence effective for deterrence and response to all types of adversaries, ranging from terrorist groups to nuclear-armed regional powers, suitability for enhancing partner capacity, reliability of the host state for unhindered U.S. force deployments and security, availability of appropriate training sites, and alliance considerations and regional impact. But decisions on basing type and location have consequences for the Title 10 responsibilities of the armed services because the services will implement these decisions and
7 DoD, 2010, pp. 65–67. 8 DoD, 2010, p. 67. 9 DoD, 2010, p. 68. 10 DoD, 2010, pp. 68–69.

4
the policies that flow from them. Given such a role, the armed services have an interest in and a contribution to make to the decisionmaking process.
The U.S. Army and other military services have tools for assessing the costs and benefits of new infrastructure. However, the tools are more in the realm of infrastructure analysis and implementation and are especially pertinent to domestic U.S. basing decisions. Several RAND studies focus on Army deployment and stationing, though these studies have tended to focus more on the mechanics of deployment rather than on the strategy underlying the global posture. We see them as complementary to our analysis. RAND has also conducted a series of studies concerning the basing decisions of other services, especially the U.S. Air Force (USAF). These studies are relevant to our work, but we see calculations regarding the stationing of Army combat units as qualitatively different from calculations pertaining to effective placement of combat support bases for Air Force and Navy operations.
Thus, our research developed a land power–centric, strategic-level approach to assist the Army as it contributes to Global Force Management.11 The study team compiled a list of DoD sites abroad, by country, and distinguished the facilities by three metrics: size, replacement cost of the facility,12 and the number of personnel authorized at the site.13 This allowed us to make
11 DoD defines Global Force Management this way:
GFM aligns force assignment, apportionment, and allocation methodologies in support of the NDS, joint force availability requirements, and joint force assessments. It informs the DOD assessment process by identifying sporadic or persistent shortfalls or hard to source forces or capabilities, and assists in developing the GEF. GFM key functions are to:
• Assign forces to COCOMs through the Global Force Management Implementation Guidance (GFMIG)
• Allocate forces to COCOMs through the Global Force Management Allocation Plan (GFMAP) • Apportion forces to COCOMs for planning
GFM provides comprehensive insights into the global availability of U.S. Military forces/capabilities and provides senior decision makers a process to quickly and accurately assess the impact and risk of proposed changes in forces/capability assignment, apportionment, and allocation.
Chairman of the Joint Chiefs of Staff Guide 3401D, “CJCS Guide to the Chairman’s Readiness System,” November 15, 2010, p. 22. 12 We used DoD, Base Structure Report, Fiscal Year 2009 Baseline (A Summary of DoD’s Real Property Inventory), Washington, D.C.: Office of the Deputy Under Secretary of Defense (Installations and Environment), 2009, to classify the sites as large, medium, or small. The classification is based on plant replacement value (PRV), expressed in millions of dollars, which represents the “calculated cost to replace the current physical plant (facilities and supporting infrastructure) using today’s construction costs (labor and materials) and standards (methodologies and codes).” Large sites have PRVs of $1.69 billion or more. Medium sites have PRVs of less than $1.69 billion but equal to or greater than $901 million. Small sites have PRVs of less than $901 million. We combined the DoD category of “other” sites (those having PRVs of less than $10 million) with “small” sites to portray fully the extent of U.S. infrastructure abroad. 13 Personnel authorizations are a useful metric, but the data do not reflect rotational and temporary deployments. To overcome that problem, we used the military personnel deployment database from the Defense Manpower Data

5
some broad generalizations about the overall U.S. posture. The findings indicate that Germany, Japan, South Korea, Italy, and the United Kingdom are the top five countries in which U.S. military bases are concentrated. However, the patterns of forward basing differ among the armed services. Army bases abroad are concentrated in Germany and South Korea, with some presence also in Italy and Japan, as well as an U.S. Army presence in Belgium related primarily to NATO headquarters. More than one-half of all U.S. Navy facilities abroad are located in Japan and Italy, with additional forces in Bahrain to support U.S. naval forces afloat. Guantanamo (Cuba) and Djibouti also have large numbers of Navy personnel. Diego Garcia hosts a large naval supply facility; Naval Station Rota in Spain is also noteworthy. The U.S. Air Force abroad is predominantly concentrated in Japan, Germany, the UK, and South Korea but also has a system of support bases throughout the world (i.e., Thule Air Base in Greenland, Aviano Air Base in Italy, Incirlik Air Base in Turkey, and Lajes Field in Portugal). U.S. Marines abroad are concentrated in Japan, specifically on Okinawa.
Deployment data provide additional information on the U.S. military presence in the world, taking into account temporary and rotational deployments. Excluding the large operational deployments in and around Iraq and Afghanistan, there was substantially greater military presence in Bahrain, Djibouti, and Qatar than the authorized personnel data indicated.
Finally, we took into account the U.S. military bases in territories and possessions of the United States (outside the 50 U.S. states). The territories span the Pacific and the Caribbean, adding to the U.S. global reach, and provide potential locations for bases that are not subject to other sovereign authorities. Guam is a major U.S. base in the western Pacific. Puerto Rico also has substantial DoD facilities.
In terms of permanent bases abroad, current posture still shows its Cold War origins. Given the cost of building and maintaining large overseas bases, this is not surprising. However, assessing the current posture simply by focusing on permanent bases is misleading because the IGPBS emphasized a low-footprint way of projecting U.S. forces by way of rotational deployments, as well as establishing contingency access arrangements and building relationships with partner militaries in more subtle ways. While there is a large U.S. military infrastructure in Germany, the presence of U.S. forces in other states, such as Djibouti, Honduras, Singapore, UAE, and Bulgaria, has a role in responding to contingencies and establishing ties with militaries in a given region.
Although DoD policy has revisited the issue of basing, the current security environment is not conducive to the circumstances that drove the United States to build a large military infrastructure abroad—namely a bipolar and long-term rivalry, accompanied by stable alliances. The stability and the depth of the rivalry meant a decades-long time frame that accommodated
Center. Defense Manpower Data Center, “Department of Defense: Active Duty Military Personnel Strengths by Regional Area and by Country (309A),” June 30, 2009.

6
major investments abroad.14 While the United States has periodically lost access to some bases it had built, such incidents have historically been notable but relatively infrequent.15 In an emerging multipolar world, amidst uncertainty regarding the threats to U.S. interests, and in view of the more-constrained fiscal environment, large investments abroad in new basing facilities (associated especially with MOBs) outside areas of ongoing operations are difficult to justify. There is also a greater potential for losing access to bases that might be built because of the inherent uncertainty in the security environment. What all this means is that construction of new large permanent overseas bases would face big hurdles in terms of approval, and the low-footprint and contingency access-based means of exerting influence is the preferred means of establishing forward presence.
Objectives and Organization
As the main provider of U.S. land power, the Army needs to improve its understanding of the implications of potential changes in global posture for the land power capabilities it organizes, trains, and equips. Such an understanding is critical for effective resource allocations for future force structure, presence, and stationing. Consequently, the Army asked the Arroyo Center for analytical assistance. Specifically, the project had the following objectives:
• to examine the global positioning of Army forces and assets in the light of ongoing andpotential changes in the national security environment
• to evaluate U.S. Army stationing, prepositioning, security cooperation activities, anddeployments
• to make recommendations to improve future Army responsiveness and effectiveness.This report presents the results of our analysis.
After reviewing existing work evaluating basing locations, we developed a research approach that systematically examined the fundamental issues inherent in thinking about a global defense posture, especially as it pertains to land power. The approach employs a sequence of interdependent analyses to arrive at a set of basing options that aims to maximize the robustness,
14 DoD, 2010, pp. 57–62.15 While there is usually some controversy concerning the long-term presence of U.S. troops in any given country, itis also true that these concerns are usually solved through diplomatic means and sometimes with the help of financial incentives, rather than expulsion of U.S. forces. That said, U.S. forces have been expelled from a variety of places. In fact, U.S. forces were expelled in mid-2009 from the Air Force facility at Mantas airfield in Ecuador. Calder, 2007, provides a list of bases from which the United States has been expelled. There are numerous studies of the controversies regarding specific countries and dealing with virtually every U.S. base abroad, including Alexander Cooley and Jonathan Hopkin, “Base Closings: The Rise and Decline of the U.S. Military Bases Issue in Spain, 1975–2005,” International Political Science Review, Vol. 31, No. 4, 2010; Alexander Cooley and Kimberly Marten, “Base Motives: The Political Economy of Okinawa’s Antimilitarism,” Armed Forces and Society, Vol. 32, No. 4, July 2006; Peter H. Sand, United States and Great Britain in Diego Garcia: The Future of a Controversial Base, New York: Palgrave McMillan, 2009; Andrew Yeo, “Not in Anyone’s Backyard: The Emergence and Identity of a Transnational Anti-Base Network,” International Studies Quarterly, Vol. 53, No. 3, 2009.

7
responsiveness, and effectiveness of the Army’s global posture for meeting the security challenges of the next decade.
Chapter 2 describes the three key elements of our approach to discerning an effective global basing posture:
1. missions, differentiated by type and availability of warning 2. base types, differentiated by size and permanence 3. base locations, differentiated by state and by quality of infrastructure. These key elements provide the conceptual underpinning for any basing decisionmaking. The
chapter also describes how we operationalized the missions for our analysis. In addition, the chapter describes the methodology of how we narrowed the world’s countries to the small set of states that we used in our modeling effort.
While Chapter 2 provides a description of our methodology and an initial screening process of basing locations, we present our findings for purposes of an effective Army global posture in Chapters 3 and 4. Chapter 3 examines the most efficient global basing postures from the perspective of responsiveness to the full range of expected short-warning missions. The analysis uses a RAND Arroyo–developed optimization tool, the Global Posturing Model (GPM), to compare the potential bases.
Chapter 4 assesses the basing structure from the perspective of utility for steady-state demands for forces, including BPC and security cooperation. Our analysis suggests a number of potential basing options, although we understand that the process of choosing partners and selecting intensity of effort for BPC is essentially politically determined.
In Chapter 5, relying on the information presented in previous chapters, we summarize our findings and provide recommendations for next steps toward a more effective Army global posture.
Appendix A provides additional information pertaining to the evaluation of the world’s states from the perspective of attractiveness as hosts for Army bases. Appendix B outlines additional information regarding the specific sites for a base location within a state that has passed our reliability and accessibility criteria. Appendix C gives additional information on RAND Arroyo Center’s GPM.
The project was approved in April 2009. The bulk of research and analysis for this project took place in the second half of 2009 and early 2010. Project team members presented the findings contained in this report to Army staff in February 2010. The conclusions were updated based on information as of October 2010. The report was reviewed and revised in 2011–2012.
This study was conducted before the 2012 defense strategy guidance addressed the rebalance to the Asia-Pacific region and prior to the full development of the Army’s regionally aligned forces. U.S. basing and forward posture continues to evolve in response to the international security environment, and the U.S. posture has already changed since the completion of research for this study. The value of this study is in the methodology it outlines, as it provides a framework and a model for integrating the variety of criteria for basing of U.S. forces abroad.


9
2. Global Posture: Key Elements
This chapter explains how we arrived at all the inputs that we used in the modeling effort we discuss in Chapter 3. We consider the essential components that go into any decision on basing of Army forces outside U.S. territory. In a nutshell, the issue of determining a robust and effective Army global posture entails the interplay of three main elements: missions assigned to Army forces, types of basing choices, and base locations. Each of these elements can vary, with a corresponding effect on the quality of the posture. We define and explain each of these three elements.
We then discuss the specific inputs to our modeling effort that relate to these three main elements. Regarding the missions assigned to Army forces, we explain our assumptions for the lift requirements associated with each mission and then outline the scenarios we developed and the target states on which those missions are centered. As to base locations, we outline our methodology of how we chose the set of states for potential basing of Army forces.
Main Elements of Effective Global Posture
In the following subsections, we examine each of the three main elements of effective global posture. In terms of missions, we focus on military criteria and outline six main missions for which forward basing is relevant. Regarding base types, we define the four types, using DoD definitions. For base locations, we outline the basic criteria that make a base useful for purposes of power projection. By forward basing, we mean the permanent assignment of a unit to a non-U.S. location or that a unit is deployed on a full-time basis to a non-U.S. location (even if the soldiers rotate for a tour at the location).
Missions
The purpose of basing Army forces abroad is to project U.S. land power, either to assist in the security of the state or region where the base is located or to provide a launch pad for deployment of the forces based in the region. For the purposes of informing decisions on posture, we draw a basic distinction between the types of missions assigned to Army forces that are forward based, with the main distinction being the extent of warning. Some missions entail limited warning and place a premium on rapid response. Given the distances and time required to deploy forces from CONUS to Europe, Asia, or Africa and depending on the assessment of threats and U.S. interests in a given region, some forward basing is useful to ensure early response in such missions. Another set of missions consists of those that are predictable and can be planned in advance. While accomplishing these missions may not necessitate forward basing,

10
they may be carried out more effectively by forward-based forces. We explain our distinctions in more detail below.
We identified six broad missions that Army forces may be called upon to execute and for which forward basing is relevant. Four of these are short-warning missions:
1. deterrence of another state 2. stability operations in response to state failure 3. counterterrorist operations 4. humanitarian relief operations.
The common theme to all these missions is that their actual time of incidence cannot be known with certainty ahead of the actual contingency. For example, we know the duration of the hurricane season in the Caribbean, and there is a good chance that some Army forces may be engaged in humanitarian relief operations after a hurricane damages the infrastructure in say, Honduras, but we cannot plan for such a contingency in anything but general terms. In contrast, two missions are predictable and generally planned well in advance:
1. security cooperation, including alliance commitments and BPC 2. support of ongoing operations.
For purposes of our analysis, the missions have different implications for selection of locations for forward basing. The four short-warning missions make forward basing important for responsiveness, but they differ greatly in terms of the lift requirements they entail and the likely closure times. Considerations of responsiveness are not a factor for preplanned missions. Instead, alternative criteria that focus on strategic partners emerge as most important for selection of locations. We describe the missions in more detail below. Later on in this chapter, we develop a set of scenarios using the mission set outlined below.
Short-Warning Missions
In a deterrence mission, the forward deployment of a combat Army unit provides the substantive combat capability to deter aggression, serves as a trip wire that will lead to full engagement of U.S. forces, and reassures the host state of the commitment of the United States to its defense. The greater the likelihood of outbreak of armed conflict, the greater the need for immediate response and forward presence to accomplish the deterrence mission.
State weakness and state failure may lead to a stability operation to shore up and/or rebuild the state. The potential for a humanitarian disaster and, to the extent applicable, the ensconcing of armed groups with interests inimical to the United States places a premium on early insertion of U.S. Army forces. In cases of failure of a state with nuclear weapons, there is a high premium on rapid response.
For counterterrorist operations, rapid response is especially pertinent because such operations can take place subject to intelligence information suddenly becoming available. While such missions tend to be associated with Special Forces (SF) and stealth, the specifics of the mission will vary and may require support from regular Army forces.

11
Humanitarian relief operations in response to natural disasters have little warning and place great emphasis on a rapid provision of assistance. Such operations also bring to the fore the need for readily available stocks of supplies for distribution. While there may be greater lead time and warning of a man-made (rather than natural) disaster, much depends on the specifics of the case. For example, particularly egregious incidents of atrocities may lead to a rapid response to prevent further massacres.
Preplanned Missions
One of the main steady-state missions for U.S. forces is to engage in security cooperation. The broad term includes a variety of activities, ranging from participation in exercises with allied or partner militaries, to training of partner forces, to assisting the military establishments of partner countries in building institutional capacity in the security realm. The common thread among all these activities is that they are scheduled events, and COCOMs plan them and assign forces to them in advance as they build their theater security cooperation plans. Forward-based forces are not necessary for many security cooperation activities, but it also makes sense intuitively that forward-based forces will be more effective in security cooperation because being stationed in a partner country allows greater cultural understanding and the development over time of extensive bonds with personnel from partner militaries.
Support of ongoing operations necessitates a supply and logistics network. Developing such a network is an inherent and essential aspect of planning the operations. Supporting operations in a landlocked country, such as Afghanistan, requires diplomatic negotiations and a host of arrangements with other countries. Depending on the specifics, forward-based units may be needed to ensure security of the network.
Base Types
We considered four main base types in our analysis, with the main distinctions being along the lines of the size of the base and the extent to which its facilities are temporary or permanent. Both issues raise a host of political and economic considerations, such as the size of the U.S. footprint and the resources required to develop the infrastructure the forward deployed U.S. forces need. The following are the DoD definitions of the main types of bases outside the United States:
A main operating base (MOB) is a
facility outside the United States and U.S. territories with permanently stationed operating forces and robust infrastructure. Main operating bases are characterized by command and control structures, enduring family support facilities, and strengthened force protection measures.16
16 Joint Publication (JP) 1-02, Dictionary of Military and Associated Terms, Washington, D.C.: U.S. Department of Defense, April 12, 2001 (as amended through April 2010).

12
Facilities at MOBs have permanent construction and provide a level of support similar to permanent bases in the United States.
A forward operating site (FOS) is a
scalable location outside the United States and U.S. territories intended for rotational use by operating forces. Such expandable ‘warm facilities’ may be maintained with a limited U.S. military support presence and possibly prepositioned equipment. Forward operating sites support rotational rather than permanently stationed forces and are a focus for bilateral and regional training.17
Facilities at FOSs may have temporary construction and provide an austere level of support. A cooperative security location (CSL) is a
facility located outside the United States and U.S. territories with little or no permanent U.S. presence, maintained with periodic Service, contractor, or host-state support. Cooperative security locations provide contingency access, logistic support, and rotational use by operating forces and are a focal point for security cooperation activities.”18
CSLs can vary greatly in size and scope, anywhere from a leased warehouse to training grounds and associated facilities.
A preposition site is a
secure site containing prepositioned war reserve materiel, tailored and strategically positioned to enable rotational and expeditionary forces. They may be collocated with a MOB or FOS. PSs are usually maintained by contractor support and may be sea based.19
The permanent type of construction and the size associated with MOBs was a fixture of the Cold War security environment, with planning focused on decades-long time frame and the magnitude of support sufficient for several Army divisions. As we noted in Chapter 2, it is our assumption that the current security environment does not call for this type of new basing infrastructure and associated costs. During the 2000s decade, new FOSs were a central aspect of the basing realignment decisions, stemming from the need to plan for a more uncertain security environment and to reduce dependence on infrastructure in other countries. We assume that the same principles remain in place. Each of the base types specified above requires access to capable air- and seaports for contingency operations (we deal with this issue in our reliability and accessibility assessment below).
17 JP 1-02, 2010. 18 JP 1-02, 2010. 19 U.S. Congress, Commission on Review of Overseas Military Facility Structure of the United States, Final Report, August 15, 2005.

13
Base Locations
There are a variety of criteria for assessing why some states are more suitable than others for consideration as location of bases for U.S. armed forces. One criterion is the utility of the geographic location of the state for addressing U.S. security goals that drive the need for forward basing. But utility alone is an insufficient criterion on which to make basing decisions. The utility of the best geographically located base is zero if the host state refuses to allow the United States the use of the base in a contingency. That brings up the fundamental facts that the world is divided politically into sovereign states and that these states have a say over the use of bases on their territories. Ease of accessibility to and reliability of use of the base for a contingency when U.S. authorities decide to do so are the critical factors for basing choices. Other—secondary—factors include the existing level of infrastructure in the state to support U.S. base operations and, for extended tours, quality-of-life considerations for deployed personnel. These are secondary considerations because, in the case of infrastructure, if the state is important on strategic grounds, we assume that the United States will develop the infrastructure to desired standards. Quality-of-life considerations would come into play in cases of large deployments and lengthy tours in austere locations. The thrust of the IGPBS is against such deployments, although if the security situation changed and warranted such deployments, the choice might be to develop the necessary infrastructure to ensure higher quality of life for deployed troops.
There are close to 200 states in the world.20 From a strategically integrated perspective, carefully choosing the states for locating U.S. bases is probably the most important aspect of the basing decisionmaking process. Since the stationing of U.S. armed forces has major foreign policy implications for the United States, the selected site needs to be in accordance with and support the overall U.S. policies in a given region of the world. Later on in this chapter, we describe our methodology for assessing accessibility, reliability, and utility of a specific base location.
Modeling Inputs: Missions To model the utility of specific base locations for short-warning missions, we need additional
information. First, since the missions differ greatly in terms of their force requirements, we outlined the forces and the lift requirements associated with each mission to provide inputs for calculations of closure times for deployment. Second, since we need locations of both bases and the areas to which the forces deploy, we developed scenarios for each mission to provide the target destinations for calculations. We provide more details in the following subsections on both of these steps.
20 The United Nations has 192 member states.

14
Mission Lift Requirements
The four rapid-response missions have greatly divergent force requirements, befitting the nature of the missions. To reflect these differences, we outline the force packages that might be associated with each mission. The force requirements presented below are meant to serve as benchmarks and initial input for modeling. They are meant to be plausible but illustrative of the types of capabilities required for each mission type.21
Deterrence
For a deterrence mission, we assumed a situation of a rising threat of military aggression against a U.S. partner or ally and the consequent need to deploy a combat unit quickly to the territory of the ally or partner to put in place a credible deterrent. Our assumption is that the central core of the mission is the provision of combat capabilities in a potential conflict against another state’s armed forces.
For purposes of our analysis, we assume the need for a rapid deployment of an Army task force organized around a Stryker BCT (SBCT). The SBCT is designed to be easily deployable and to be able to engage adversary conventional forces. The SBCT would be augmented by fires, air defense, aviation, engineer, mobility, and support units (for full details of the task force composition, see Table 2.1).
The SBCT would be the front edge of a deterrent-motivated deployment.22 We assume that the SBCT-centered task force would be a sufficient deterrent to buy time to deploy additional Army units. We also assume, although we do not model, that Air Force and Navy assets would be brought to bear, supporting the SBCT and adding to the deterrent.
We assume that access arrangements to the state under threat are in place; that there is a basic understanding in terms of concept of operations with the host state; and that the host state has opened its ports, allowed use of its transportation network, and made available tactical assembly areas for the reconstituting and operational deployment of the U.S. forces.
21 For our modeling purposes, we selected existing Army unit types that have the capabilities required for that mission to allow us to estimate lift characteristics. In an actual deployment, these capabilities could be provided by task-organized units rather than existing unit types. 22 On August 8–14, 1990, in response to the Iraqi invasion of Kuwait, the United States deployed a light infantry brigade (IBCT)—2nd Brigade, 82nd Airborne Division—to Saudi Arabia to deter the Iraqis from invading Saudi Arabia. That deployment was very much a trip wire type: “Such lightly armed troops would be at risk should Iraq decide to invade Saudi Arabia before the United States completed its force buildup. Nevertheless, the decision made possible a rapid show of force and commitment” (Frank N. Schubert and Theresa L. Kraus, eds., The Whirlwind War: The United States Army in Operations Desert Shield and Desert Storm,Washington, D.C:. U.S. Army Center of Military History, 2000, p. 51). We assume that, in the future, unlike in 1990, the United States would deploy a more appropriate combat formation for deterrence purposes; such a formation, the SBCT, is now available.

15
Table 2.1 Deterrence Task Force
Task Force Number of Personnel SRC
SBCT 4,169 Firing battery (High Mobility Artillery Rocket System) 74 06467G100 Helicopter battalion (attack/reconnaissance) (AH-64) 408 1385G100 ADA battalion (Patriot/Avenger) 724 44645G000 ADA battery (Terminal High Altitude Area Defense) 117 44697A000 Engineer battalion Headquarters, engineer battalion Engineer support company Sapper company Mobility augmentation company Forward support company (engineer)
173 122
97 118
90
05435G000 05419G000 05439G000 05438G000 63357G000
Brigade support battalion (maneuver enhancement brigade, MEB)
339 63355G000
NOTE: RAND assessment based on data provided by the Army’s, Transportation Engineering Agency (TEA).
Response to State Failure
For a mission designed to respond to a state failure, we assumed that there had been a major breakdown in governance in a state important enough to U.S. strategic interests to lead to a decision to intervene to prevent further deterioration of the situation. Our assumption is that the central core of the mission is the need to reestablish order in the capital city and then the shoring up of host-state security forces, accompanied by carrying out of critical reconstruction tasks to prevent a humanitarian disaster.
For purposes of our analysis, we assume the need for a rapid deployment of an Army task force organized around an IBCT. An IBCT is the unit best suited for a law enforcement–type stability operation in an urban environment. The IBCT would be augmented with mobility assets and a port opening package because we assume damage (or disrepair) to the transportation infrastructure and a need to open up the ports for a larger force (for full details of the task force composition, see Table 2.2). We assume no organized resistance, although U.S. units would need to be prepared for riots and potential low-level violence.
We assume, although we do not model, that the IBCT would be followed by an MEB, as well as force components from coalition partners. We assume some warning of the deteriorating situation in the failing state. We also assume that there would be a need for a forward support location in another state in the subregion to provide initial support to the operation.
Counterterrorism
For a counterterrorism mission, we assumed a situation in which U.S. intelligence agencies have uncovered a high-threat situation that must be dealt with immediately. We assume that the

16
Table 2.2 State Failure Response Task Force
Task Force Number of Personnel SRC
IBCT Mobility augmentation package
3,387 7740G000
Engineer battalion Headquarters, engineer battalion Engineer support company Sapper company Mobility augmentation company Forward support company (engineer)
173 122
97 118
90
05435G000 05419G000 05439G000 05438G000 63357G000
Civil affairs company 32 41750G000 Two military policy companies (combat support)a 171 19477G000 Port opening package
Headquarter and headquarters detachment, terminal battalion Transportation detachment (rapid port opening) Seaport operations company Modular movement control team Terminal supervision team Engineer diving team Horizontal construction company Vertical construction company
66 55
205 21 21 25
161 162
55816F000 55507Ga00
55838F00 5506Ga00
55560FC00 5530LA00
05417G000 05418G000
Total force 5,077 NOTE: RAND assessment based on data provided by the Army’s Surface Deployment and Distribution Command, Transportation Engineering Agency (SDDC/TEA) a Number of personnel is for each company.
disposition of the terrorist group in question is such that Air Force assets alone are inappropriate and that there is a need for on-the-ground presence and intelligence gathering. Our assumption is that the central core of the mission is the rapid insertion of light infantry into complex terrain in an area with limited government control, with the mission of eliminating the terrorist cell. We assume that host-state forces are friendly but not capable of acting on their own against the terrorist group. For purposes of our analysis, we assume the need for a heavily augmented Ranger company (for full details of the task force composition, see Table 2.3).
Humanitarian relief
For a humanitarian relief operation, we assumed that a natural disaster had caused a need for immediate delivery of humanitarian supplies. This humanitarian relief task force is based on the package of capabilities deployed to Central Africa in 1994 during Operation Support Hope and is geared toward meeting the immediate needs of a displaced population and setting the stage for more-substantive efforts. These capabilities included the ability to distribute food, provide clean water, meet emergency medical requirements, and assist in the repair of damaged infrastructure or the construction of temporary shelters. Our assumption is that an international relief effort is under way but that the scale of the disaster has led to the need to send a force to protect the

17
supplies and humanitarian workers and to assist in the distribution of the supplies. We assume that host-state forces are friendly but not capable on their own of ensuring the protection and orderly distribution of supplies. For purposes of our analysis, we assume the need for a task force with elements of ,an MEB to provide command and control, a light infantry battalion to provide security, and a range of specialized combat support and combat service support elements for mission execution (for full details of the task force composition, see Table 2.4).
Table 2.3 Counterterrorism Direct Action Task Force
Task Force Number of Personnel SRC
Ranger company 116 07817G000 Assault company (UH-60) (+) Three assault platoons
43 01207G200
Forward support company (assault battalion) (–) 94 63217G300 NOTE: RAND assessment based on data provided by the Army’s Surface Deployment and Distribution Command, Transportation Engineering Agency (SDDC/TEA).
Table 2.4 Humanitarian Relief Operations Task Force
Task Force Number of Personnel SRC
MEB Headquarters and headquarters company, MEB Signal support network company Brigade support battalion (MEB)
579 37300G00
Rifle battalion (IBCT) 692 07215G000 Civil affairs company 32 41750G000 Headquarters and headquarters company, combat sustainment support battalion Water purification platoon Water storage and distribution platoon Subsistence support platoon Area support platoon Light-medium truck company
82 20 34 64 26
171
63426G000 10567FC00 10567FD00 42529FC00 42529FD00 55719F000
Engineer support company 122 05419G000 Well drilling team 10 05520LE00 Early entry hospital (EEH), 44 beds Headquarters, EEH element EEH element Hospital company (84 Bed)
10
147
08546AA00 08457A000
Medical company (area support) 83 08457A000 Medical detachment (preventative medicine) 13 08457A000 NOTE: RAND assessment based on data provided by the Army’s Surface Deployment and Distribution Command, Transportation Engineering Agency (SDDC/TEA).

18
Humanitarian relief operations are not the central concern of the Army, but the Army plays a role in assisting such operations and these types of operations are commonly assigned to U.S. forces. In some COCOMs, such as in U.S. Africa Command (AFRICOM) and U.S. Southern Command (SOUTHCOM), humanitarian relief is an important mission.
Recent U.S. military humanitarian operations have involved forces larger than those postulated here, although this has to some extent resulted from the use of shipborne assets, particularly helicopters, to move supplies to populations affected by large natural disasters.23 These efforts, however, have focused on the same set of tasks for which the postulated humanitarian relief task force has been designed. Joint Task Force–Haiti had a peak strength of some 22,000 personnel, but only about 7,000 of them were on the ground in Haiti. This ground component was drawn largely from the 2nd Brigade of the 82nd Airborne Division and two U.S. Marine Corps marine expeditionary units. Its mission was to maintain security in Port au Prince and other urban areas; to distribute bottled water, meals ready to eat, and medical supplies; and to provide limited medical assistance.24 The U.S. response to the 2004 tsunami in Southeast Asia, Operation Unified Assistance, involved some 14,500 personnel in the delivery of relief aid and medical support to stricken populations. Nearly all these personnel were based aboard U.S. Navy ships, and there was only a very limited presence on the ground in Indonesia and elsewhere. During this operation, the main military focus was the delivery of relief supplies via helicopter and amphibious landing craft to isolated communities.25
Security Cooperation
Lift requirements are not a critical consideration for activities designed to meet alliance commitments and build partner capacity. We assume that, to the extent it is necessary, lift requirements will be a part of the planning process for such activities. The important considerations in thinking about the trade-offs between CONUS-based and forward-deployed units for security cooperation include the frequency and intensity of interactions with partner militaries, the need to build cultural understanding, quality-of-life issues, and the impact on retention. We discuss these and additional issues in more detail in Chapter 6. We use the level of U.S. engagement in each subregion to provide an estimate of the force size that might be needed for security cooperation and BPC.
23 Both operations, for instance, included an aircraft carrier, which normally has a crew of some 5,600 personnel. 24 Lisa Daniels, “SOUTHCOM Completes Haiti Disaster Response,” American Forces Press Service, June 1, 2010; John J. Kruzel, “U.S. Forces in Haiti to Grow to 20,000,” American Forces Press Service, January 21, 2010; Douglas Fraser, “DOD News Briefing with Gen. Fraser from Miami, Florida,” news transcript, January 21, 2010; Ken Keen, “DOD News Briefing with Lt. Gen. Keen from Haiti,” news transcript, January 26, 2010. 25 DoD, “Wall of Water: U.S. Troops Aid Tsunami Victims,” 2005 Year in Review, 2006; Heike Hasenauer, “Responding to the Tsunami Disaster,” Soldiers Magazine, March 2005, pp. 25–29; Victor Guillory and Tom Fry, “DoD Briefing on Operation Unified Assistance, the Post-Tsunami Relief Effort,” news transcript, January 14, 2005.

19
Support of Ongoing Operations
Operations in Afghanistan pose massive logistical requirements and challenges. The United States has established several routes for supplying forces in Afghanistan, including airlift directly to Afghanistan and ground transport through Pakistan and through a mixture of arrangements with states in Central Asia. Contractors are heavily engaged in the supply chain. We do not explore the potential for new bases to support ongoing operations in Iraq and Afghanistan in our analysis, as we take the support system that has been built up since the early 2000s to be sufficient.
Target States for Short-Warning Missions
To test the utility of specific locations for potential basing, we developed a set of target states for each of the short-warning missions. In developing the set, we listed the potential missions (using the mission set outlined above) that might be assigned to U.S. forces in the near- to middle-term time frame (5–7 years) in each subregion of the world. Our goal was to provide a range of plausible missions in each subregion, focusing on the geographic diversity; the set is meant to be illustrative.
For deterrence missions, we used the following five states in our modeling:
1. deployment to Georgia to deter Russia 2. deployment to Estonia to deter Russia 3. deployment to Azerbaijan to deter Iran 4. deployment to Kuwait to deter Iran 5. deployment to Taiwan to deter China. For a stability mission in response to state failure, we used the following states in our
modeling:
1. Liberia (West Africa) 2. Nigeria (central-west Africa) 3. Sudan (East Africa) 4. Chad (central Africa) 5. Zimbabwe (southern Africa) 6. Yemen (the Middle East and the Persian Gulf) 7. Pakistan (Southwest and Central Asia) 8. Bangladesh (South Asia) 9. Indonesia (Southeast Asia) 10. Cuba (the Caribbean) 11. Panama (Central America) 12. Bolivia (South America).26
26 We did not develop a state failure scenario for the following subregions: northern Africa, northern Europe, southern Europe, Asia Minor and the Caucasus, East Asia, and the western Pacific. Of the preceding, Asia Minor

20
For a counterterrorism operation, we used the following states in our modeling:
1. Algeria (North Africa) 2. Niger (West Africa) 3. Somalia (East Africa) 4. Saudi Arabia (the Middle East and the Persian Gulf) 5. Tajikistan (Southwest and Central Asia) 6. Philippines (Southeast Asia).
For a humanitarian relief operation, we used the following states in our modeling:
1. Mali: drought and famine (West Africa) 2. Ethiopia: drought and famine (East Africa) 3. Burundi: flood (central Africa) 4. Mozambique: typhoon (southern Africa) 5. Armenia: earthquake (Asia Minor and Caucasus) 6. Uzbekistan: earthquake (Southwest and Central Asia) 7. Sri Lanka: tsunami (South Asia) 8. Thailand: tsunami (Southeast Asia) 9. Dominican Republic: hurricane (the Caribbean) 10. Guatemala: hurricane (Central America) 11. Peru: earthquake (South America). Based on our selection of target states, the following regional patterns emerged from our set
of missions. In Africa, the primary missions are response to state failure and humanitarian relief operations, with some counterterrorism missions in eastern and northern Africa. In the greater Middle East, there is a full range of missions. The same applies to Asia and the western Pacific. In Europe, there is a deterrence mission. In the Americas, there are state failure and humanitarian relief missions. See Table 2.5 for a summary listing of all the missions by subregion.
Modeling Inputs: Base Locations As we noted earlier, the three critical criteria for effective base locations are the utility of the
base for a given mission, the political reliability of the host state to ensure unconstrained use of the base, and accessibility of the base to ensure a flow of soldiers and material to and from the base. Our modeling effort assesses the utility of a set of bases. We consider only a small set of potential base locations in that effort. We chose that set of potential base locations as a result of a filtering process, taking into account political reliability and accessibility of a base. Below, we outline our criteria for assessing political reliability and accessibility.
A basic caveat is in order at this point. To assess the political reliability of potential host states, we relied on two metrics: voting congruence in the United Nations (UN) (especially on votes important to the United States) and democracy scores (using the Polity IV database). As we and the Caucasus and the East Asia subregions are covered with two deterrence missions each (Georgia, Azerbaijan, and Taiwan and North Korea, respectively).

21
Table 2.5 Deployment Target States and Missions
Region Subregion Deterrence State Failure Counterterrorism Humanitarian
Relief Africa Northern Africa Algeria West Africa Liberia, Nigeria Niger Mali East Africa Sudan Somalia Ethiopia Central Africa Chad Burundi Southern Africa Zimbabwe Mozambique Middle East and Southwest Asia
Asia Minor and the Caucasus
Georgia, Azerbaijan
Armenia
Middle East and the Persian Gulf
Kuwait Yemen Saudi Arabia
Southwest and Central Asia
Pakistan Tajikistan Uzbekistan
Europe Northern Europe Estonia Southern Europe East Asia and the Western Pacific
East Asia Taiwan
Western Pacific South Asia
Bangladesh Sri Lanka
Southeast Asia Indonesia Philippines Thailand Americas Caribbean Cuba Dominican
Republic Central America Panama Guatemala Southern America Bolivia Peru
explain in greater detail later, these measures provide insights into the likelihood that a potential host state will be a reliable partner. That said, even objective measures, such as these, have limitations and do not capture all salient considerations for policymakers. We use these measures to provide explicitly justifiable inputs for our modeling effort. But even when our modeling effort points out the utility of a base for purposes of U.S. responsiveness, establishing a U.S. base in that country still may not be wise. While the model shows the “best” country in a subregion, decisionmakers may determine that the cost and risk of establishing a base there, and anywhere in that subregion, may be too high for the benefits that could be gained from it. In these cases, the final decision might be not to build a base in that subregion at all. We discuss these considerations in the final chapter.
Political Reliability
A key factor in assessing the utility of a base is the political risk to the use of the base under contingency conditions. The one critical difference between basing arrangements in or outside U.S. territory comes down to another state having a say over the operations of the base and thus the operations of U.S. forces at the base. When the host state does not wish to participate in a contingency, it may either allow full operations at the U.S. base or it may act to curtail the ability

22
of the U.S. forces to deploy from the state to a contingency. There may be any number of reasons for attempting to curtail operations, including political affinities for the state that is the target of the U.S. action, concern over being treated as in collusion with the United States and thus subject to retaliatory measures, or shifting internal political dynamics. Ultimately, the state’s support, or lack thereof, will be based on its determination of what best meets its interests. U.S. officials may have general expectations about the behavior of the state where the U.S. base is located but cannot be sure of unconstrained access from the base until the contingency actually happens. Moreover, the greater the danger of an armed conflict arising as part of the proposed U.S. deployment and use of the base, the more controversial—and subject to host-state restrictions—is U.S. use of the base. For example, a deterrence mission, since it involves the potential to result in an armed conflict with another state, may cause the host state greater concern than would a humanitarian relief operation in response to a natural disaster, which is generally noncontroversial.
We define a politically reliable host state as one that is willing to pay the potential costs (political and military) for U.S. military use of the base under crisis conditions, thus minimizing the risk to operational use of the base. In terms of base types, the more important to U.S. planning and the more permanent the base, the more important becomes the political reliability of the host state. Assessing future reliability involves making assumptions about the future behavior and interests of other states. To help us in this assessment, we sought out evidence that might indicate a state’s willingness to support U.S. international goals and interests. We chose two proxy indicators to measure expected future reliability: a record of similar views toward international politics and a state’s level of democratic development.
We use similar views about international politics as an indicator of future politically reliable behavior because, all other things being equal, we assume the more congruent the regime’s views on international politics with those of the United States,27 the more likely that regime is going to be willing to cooperate with the United States in times of crisis. A caveat is in order here. A country’s reliability for basing purposes (as defined above) is most useful when compared to the countries in its region because development levels and regional security concerns play a large role in a state’s behavior vis-à-vis the United States. To use a real-world example, it makes sense to compare Bolivia to Peru rather than to Canada for purposes of assessing potential reliability for U.S. basing purposes.
Democratic development, meaning that the regime has the institutions and norms of democratic policymaking, is important for assessing reliability for two reasons. First, the greater the development of a state’s democratic institutions, the less likely the regime is to be
27 By regime, we mean the larger governing structure of the state. This includes the major branches of the government and those societal institutions and elites that are necessary to govern a country. We have not used the term government because, particularly when referring to democracies, the term is often construed to imply the rulers of the moment.

23
overthrown or undergo radical changes in policy direction. Second, a democratic regime’s decision to allow a U.S. base on its territory will have been subject to internal debate and would likely be the result of an important degree of domestic political consensus. Such a consensus means that the regime already has paid the internal political costs of hosting U.S. forces, making it easier to go along with U.S. actions under crisis conditions.
Based on these assumptions, for the purposes of informing our modeling effort, we developed a list of potential base locations on the basis of identifying states that have a similar view of the international security environment. Of these states, the ones that are democratic are generally a better bet. We note that our political reliability indicator is in line with one of the four key principles outlined in the QDR for decisionmaking regarding forward-based forces, that the host state welcomes U.S. presence.
We selected two databases to operationalize our concept of political reliability. For similarity in views on international politics, we chose the voting record of each country in the United Nations (UN) since 1990 and compared the records to the way the United States voted.28 The text below is a summary of the approach and findings; Appendix A provides a full set of definitions, describes our approach, and presents the results.
We looked at two categories of votes: plenary votes in the General Assembly and a subset of these votes that the U.S. Department of State identified as “important votes” in a given year.29 While a state’s plenary vote record more accurately portrays its true international preferences, we gave more analytic weight to a state’s record on the “important” votes.30 There are only a small number of “important” votes in any given year, averaging about 13, and their topics relate primarily to international security issues that are of direct relevance to our analytical effort. Prior to the actual voting on “important” votes, the U.S. ambassador to the UN designates the vote as “important to the United States.” The ambassador then lobbies other members of the UN to vote with the United States on these issues and does his or her best to ensure that the U.S. view prevails. Since a state’s decision to support the United States on an “important” vote can entail a choice between voting as the state would otherwise prefer and supporting the United States, we
28 Empirical studies have shown the utility of UN voting data as a comparable cross-national measure of alignment with the United States, as well as an indicator of the extent of influence that U.S. aid has in swaying the behavior of other states. Axel Dreher and Nathan Jensen, , Country or Leader? Political Change and UN General Assembly Voting, KOF Swiss Economic Institute, KOF Working Paper No. 217, February 2009; Axel Dreher, Peter Nunnenkamp, and Rainer Thiele, “Does U.S. Aid Buy UN General Assembly Votes? A Disaggregated Analysis, Public Choice, Vol. 136, Nos. 1–2, 2006; T. Y.Wang, “U.S. Foreign Aid and UN Voting: An Analysis of Important Issues,” International Studies Quarterly, Vol. 43, No. 1, March 1999: Ilyana Kuziemko and Eric Werker, “How Much Is a Seat on the Security Council Worth? Foreign Aid and Bribery at the United Nations,” Journal of Political Economy, Vol. 114, No. 5, 2006. 29 We excluded votes by “acclamation” where, for all intents and purposes, there is no disagreement. 30 A country’s plenary vote record may be a truer reflection of a regime’s international preferences because it largely reflects how a state would vote in the absence of other countervailing pressures. But we also assume that, in crisis conditions, the United States would exert its influence on the given state.

24
see a record of such votes over time as an indicator either of the extent of a general similarity of views on international security or of the state’s preference for maintaining good relations with the Unites States. In both cases, it provides insight into how a state may act in a future crisis.31 Thus, a state that consistently votes with the United States on the “important” votes in the UN probably holds similar views regarding the international environment and is likely to assist the United States when called on to do so. Conversely, a state that consistently votes against the United States on issues that the United States publicly announces as being important and for which it actively lobbies probably has views of the international environment that are not aligned well with those of the United States. We do not see the above as an iron rule, and we understand that events sometimes lead to unlikely partnerships being formed, as well as to “traditional allies” not supporting the United States. However, the odd partnerships and the failure of allies are case-specific and difficult to predict, and our focus is on the general trend of expected behavior.
To assess the extent of voting coincidence of each of the world’s states with the United States, we created a UN “support index” based on the state’s votes for each of the 19 years since the end of the Cold War (1990–2008). We used the mean of this index as our primary indicator of a country’s similarity of views with the United States. We then compared support index means in countries across regions and, eventually, subregions to observe the relative level of support from each state under consideration. We did this calculation for each state in the database. When two candidate countries had similar voting records over the 19-year period, we gave more weight to post-9/11 data, guided by the assumption that the most recent data will more accurately reflect how states might respond in the current security environment (and particularly those states affected directly by U.S. post-9/11 operations). The UN support index is unique in that we know of no other indicator that would allow us to compare all the world’s states voting decisions over many years against each other, with the U.S. choice as a benchmark for comparison.
For our second indicator of reliability, democratic development, we used the Polity IV database and compiled results from 1990–2007 (latest available data during the main data collection phase). The Polity IV database is a tool used primarily by academics that assesses the states of the world in terms of their institutions of democratic governance, using standard criteria across time and countries. The database has been in existence for several decades, is widely respected, and is considered to be the most comprehensive source for measuring the level of democratic governance in a given country. The Polity IV database is also the best suited for our purposes because it focuses on “institutional” democratic development, the actual mechanisms of democratic governance, and not on specific policies. We used both a composite score for the
31 States may choose to support the United States on an important vote for a variety of reasons and not only because they share the U.S. view on the importance of the issue. Fear, bribery, quid pro quo, and a sense of solidarity are a few of the other reasons why a state might vote with the United States on such issues. For our purposes, the end result is similar.

25
1990–2007 period and a comparison of the last five years against the overall composite score to estimate the country’s democratization trend (plus, minus, or stable). We performed this calculation for each country in the database.
The Polity IV database is somewhat limited, in that it does not provide democracy scores for countries with populations less than 500,000. We therefore used “political rights” and “civil liberties” scores derived from Freedom House to serve as a proxy measurement of democracy in countries not included in the Polity IV data set. We provide additional information on both the Polity IV and Freedom House score data in Appendix A.
Accessibility
Geographic accessibility is a key factor in assessing the utility of a base. No matter how politically reliable a state may be, if access to that state is subject to curtailment by others because of geography, its utility will be limited as a site for a U.S. base. We consider a preferred location as one that has unhindered air and naval access. Consequently, we exclude landlocked countries as potential sites for calculating base utility for short-warning missions. The only exception is in a deep inland subregion, such as central Asia, where all the countries are landlocked. For purposes of preplanned missions, accessibility is less of an issue because there is time to negotiate alternative overflight routes, and the mission is less time sensitive. In any event, we assume that any decision to develop a base in a landlocked state would pay great attention to having a multitude of routes to that state to prevent the unexpected closure of U.S. access to the base.
All other things being equal, we gave precedence to countries with a higher developed level of infrastructure suitable for the use of deployed U.S. forces. In particular, we gave more weight to countries with existing airfields suitable for handling the landing and takeoff requirements of a C-17. We relied on data from Air Mobility Command’s (AMC) Airfield Suitability and Restrictions Report (ASRR) from June 2009 for this criterion.32 Appendix B provides further detail on our selection process of specific sites for a base location within a state that has passed our reliability and accessibility criteria.
Results: Base Locations
We applied our reliability assessment by subregional (Appendix A provides full definitions of our subregions). For example, we compared states in West Africa to each other to come up with the countries that showed a greater similarity of views with the United States over the past
32 AMC’s Airfield Suitability Branch determines which, if any, AMC aircraft can land at a given airfield based on a variety of information, including runway and taxiway distances, parking aprons, and potential obstructions, such as newly positioned light poles or heavy bird traffic in the area. The branch maintains a computer database for over 3,200 airfields worldwide, accessible through Global Decision Support System and available from any “.mil” computer.

26
two decades. The rationale for the subregion-by-subregion approach was to ensure that we considered choices in every subregion of the world for our modeling effort. We used the similarity of views on important votes as the primary determinant of reliability. When there were only small differences (within five points) between the countries and if there was sufficient data for the UN voting record, we used the level of democratic development as a tie breaker. In addition, any state to be considered further had to pass the accessibility filter. Based on this approach, we chose the top two politically reliable states with unconstrained access in each subregion of the world. All but one of the 17 subregions we considered had two viable candidate states (the one subregion only had one plausible candidate host state). The resulting list of 33 states provided the starting point for further examination in our modeling effort. We added nine additional locations to the list to include states with an existing major U.S. presence that were not included in the initial list, for a total of 42 states for inclusion in our modeling effort. Each potential host state selected had to have a site suitable for an FOS at which an Army unit could be based.33 We selected the specific location within a candidate host state on the basis of the presence of an existing host-state military base (or an existing U.S. facility) and/or proximity to sea- and/or airports. We used the coordinates for the specific site in our modeling effort. We added two U.S. territories—Guam and Puerto Rico—and four U.S. locations—existing bases in northeast CONUS (Fort Drum, New York), southeast CONUS (Fort Stewart, Georgia), Alaska (Fort Richardson), and Hawaii (Fort Shafter)—to the list. We used several different locations in Italy and Japan (all existing U.S. facilities) because of their geographical dispersion.
The selected states are listed in Table 2.6, by subregion. South Korea is on our list, although we assume that the currently forward-based U.S. forces remain in place and, since they are engaged in an existing deterrence mission vis-à-vis North Korea, they are not available for deployment elsewhere. We did not include locations where Army units are deployed on operations—Afghanistan—in our analysis of sites for power projection, although that state may become a viable forward basing option in the future.34
We purposely structured our modeling effort comprehensively, taking into account all the world’s subregions, even though we recognize that locations just outside CONUS (such as the Bahamas) or in remote areas of the globe (such as New Zealand) make unlikely candidates for U.S. basing choices. We proceeded in such a fashion to ensure a global scope in our modeling effort and to make certain that we do not miss any unexpected or counterintuitive choices. 33 A base for Army forces would need to have an area large enough for training, including a shooting range and a maneuver area. There is no standard size for a BCT base. For example, South Camp Vilseck in Germany, home of the 2nd Cavalry Regiment (SBCT), has 2,193 acres. East Camp Grafenwoehr, home of the 172nd Brigade (HBCT) has 2,698 acres. Training ranges require much more space, with the Hohenfels Training Area in Germany consisting of 40,023 acres. DoD, FY09 Base Structure Report, 2009. We still included some island states and territories that lacked the space available, especially for a training range, because these states still could host a prepositioned set of equipment on a ship. 34 We also do not include Iraq in the analysis.
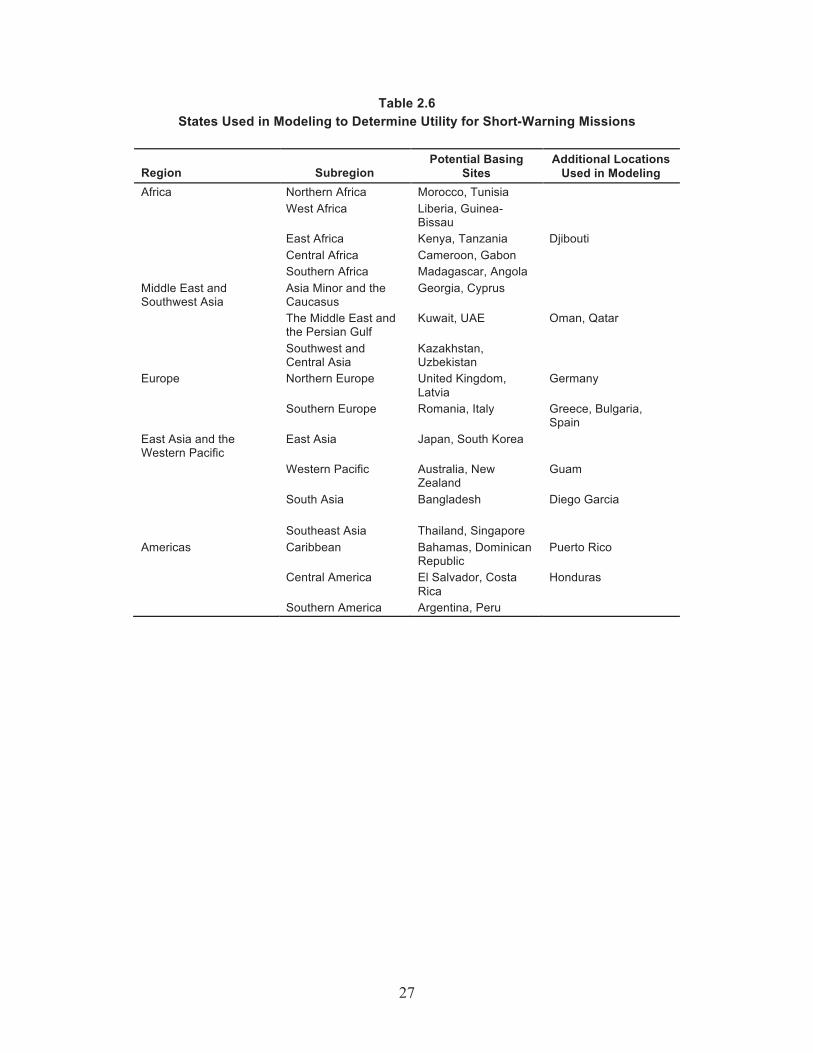
27
Table 2.6 States Used in Modeling to Determine Utility for Short-Warning Missions
Region Subregion Potential Basing
Sites Additional Locations
Used in Modeling Africa Northern Africa Morocco, Tunisia West Africa Liberia, Guinea-
Bissau
East Africa Kenya, Tanzania Djibouti Central Africa Cameroon, Gabon Southern Africa Madagascar, Angola Middle East and Southwest Asia
Asia Minor and the Caucasus
Georgia, Cyprus
The Middle East and the Persian Gulf
Kuwait, UAE Oman, Qatar
Southwest and Central Asia
Kazakhstan, Uzbekistan
Europe Northern Europe United Kingdom, Latvia
Germany
Southern Europe Romania, Italy Greece, Bulgaria, Spain
East Asia and the Western Pacific
East Asia Japan, South Korea
Western Pacific Australia, New Zealand
Guam
South Asia
Bangladesh Diego Garcia
Southeast Asia Thailand, Singapore Americas Caribbean Bahamas, Dominican
Republic Puerto Rico
Central America El Salvador, Costa Rica
Honduras
Southern America Argentina, Peru


29
3. Assessing Utility of Basing Options for Short-Warning Missions
Chapter 2 outlined how we arrived at the input data for our modeling effort to calculate the utility of various basing arrangements. That chapter outlined the logic in narrowing the choices for assessing responsiveness from potential basing sites to a small subset of the world’s states. This chapter builds on that work; it starts off by assuming that Army forces suitable for early entry, as envisioned in one of the four short-warning missions, are based at the potential locations. We test the responsiveness of such forces by using an optimization model. The chapter first describes the characteristics of the model and then presents the results of the responsiveness calculations.
Methodology
The model used to determine potential basing locations to handle all contingencies in a timely fashion is a modified version of the GPM RAND Arroyo developed in 2003. Appendix C describes the model in detail. The original version of the model was designed to find a cost-minimizing set of bases that would be able to deliver materiel to each of a set of contingencies within a certain time. In the current model, we minimize the number of bases needed rather than cost, prioritizing potential basing locations with current large (BCT-sized) Army bases first, followed by current smaller Army bases, locations of current bases of other U.S. armed forces, and new basing locations having the lowest priority. From a cost standpoint, this also roughly follows the cost of base upgrades that would be necessary to station a BCT-sized force at the desired locations.
In GPM, all materiel for each contingency must be delivered by some deadline. To set that deadline, we looked primarily at the amount of time it takes to airlift all the materiel. There are two main components to this period: the time until the first cargo aircraft touches down at the aerial port of debarkation (APOD) (the “opening” of the air bridge), then the time for all the cargo aircraft to make their deliveries (the “closing” of the air bridge). Assuming sufficient cargo aircraft are available to fully utilize the offloading facilities at the APOD, the second part of that time is purely a function of the maximum-on-ground (MOG) parameter of the APOD (plus, possibly, the time to move the materiel from the APOD to the tactical assembly area, but we assume in our analysis that the tactical assembly area is located at or near the APOD for each contingency). The time the air bridge is open is given in Table 3.1 for the four contingencies we consider. These results assume 24-hour operations at the APOD, 3.25 hours of ground time for each aircraft at the APOD, and 85 percent queuing efficiency.
Note that these times depend only on the number of C-17s required and the MOG of the APOD, not on the base from which the cargo aircraft originate. For our contingencies, we

30
Table 3.1 Air Bridge Times as a Function of MOG and C-17s Required
Task Force C-17s
Required Time Air Bridge is Open (Days)
MOG 2 MOG 4 MOG 6 MOG 8 Deterrence 684 54.5 27.2 18.2 13.6 State failure 523 41.7 20.8 13.9 10.4 Humanitarian relief operation 246 19.6 9.8 6.5 4.9 Counterterrorism 38 3.0 1.5 1.0 0.8
capped the maximum MOG at 8; although a few airfields have higher MOGs, it was possible to exhaust the C-17 inventory to have maximum flow through to an airfield with such a high MOG. We also assumed a minimum MOG of 4. Although MOGs given were lower than 4 for some of the more austere airfields, we assume that either U.S. forces would come in and improve the airfield up to MOG 4 or a sufficient number of airfields are nearby whose total MOG was at least four. Table 3.2 lists the MOGs we used for the contingencies in our analysis.
The first component of the delivery time has three parts:
1. the time it takes for the materiel to travel from the Army base to the airfield (possibly zero, if they are colocated)
2. the loading time of the materiel onto the first cargo aircraft 3. the flight time from the aerial port of embarkation (APOE) to the APOD (if such a flight
is possible, we cap the maximum distance at 3,500 nmi, the maximum unrefueled range of a loaded C-17).
The sum of these times is the element that differentiates the bases when comparing their ability to handle a particular contingency. Accordingly, our model runs vary a single parameter across all contingencies, which is the maximum amount of time before the first aircraft lands at the APOD. Depending on the value of this parameter, a base may not be able to handle a contingency in time, either because the distance between the Army base and the APOE is to great or because the flight time between the APOE and the APOD is too long.
There is also the potential for handling contingencies using surface lift, that is, some combination of overland travel and shipping via sea vessels, or sea-based prepositioned forces. For example, assume a contingency where cargo aircraft fly to an airfield of MOG 4 for a humanitarian relief operation. In addition, we cap the amount of time until the first aircraft lands at the APOD at one day.35 Table 3.1 indicates that it takes 9.8 days from the time that the first cargo aircraft touches down until all the materiel is delivered. Thus, any base that can deliver all the materiel within 9.8 + 1 = 10.8 days can handle this contingency in time. Therefore, if there is a base nearby that can deliver all the materiel via surface lift in less than 10.8 days, that base is a
35 This is a generous assumption; as our modeling results show, one day (24 hours) is sufficient for base-to-APOD time for the first aircraft in all within-region locations.

31
Table 3.2 Maximum-on-Ground Parameters
for Each Contingency
Mission Country MOG Deterrence Estonia 6 Georgia 6 Azerbaijan 4 Kuwait 8 Taiwan 4 Failed State Recovery Nigeria 8 Liberia 4 Sudan 4 Chad 4 Zimbabwe 6 Yemen 8 Pakistan 4 Bangladesh 4 Indonesia 6 Cuba 8 Panama 4 Bolivia 4 Humanitarian Relief Mali 4 Ethiopia 4 Burundi 4 Mozambique 6 Armenia 8 Uzbekistan 8 Sri Lanka 4 Thailand 8 Dominican Republic 8 Guatemala 4 Peru 4 Counterterrorism Algeria 4 Niger 4 Somalia 4 Saudi Arabia 8 Tajikistan 8 Philippines 4
viable option as a surface lift base location. For simplicity, we designate bases as either airlift or surface lift bases, although it is certainly within the purview of the model to allow a base to operate as both.
We used the Joint Flow and Analysis System for Transportation (JFAST) to compute the flight times between airfields (including exclusion zones in countries that do not extend overflight rights to U.S. aircraft) and to compute sailing and ground travel times for our surface lift calculations.

32
We also incorporate the notion of the robustness of a basing solution. One notion of robustness is to have more than one base able to deliver the materiel on time for every contingency. Alternatively, if the concern is only for new bases (thinking that it is unlikely that we would lose access to an existing Army base), we can say the basing solution is robust if at least one current or two new bases can handle every contingency.
Results: Global Analysis Figures 3.1 and 3.2 map basing options and contingencies, with both contingencies and bases
color coded by type.
Figure 3.1 Basing Options and Contingencies in the Americas
Humanitarian relief operationsCounterterrorism operationsFailed state recoveryDeterrence missions
Current large Army installationsCurrent other Army installationsCurrent other services installationsOther potential basing locations
RAND RR158-3.1
H
C
F
D
H
H
F
F
FH
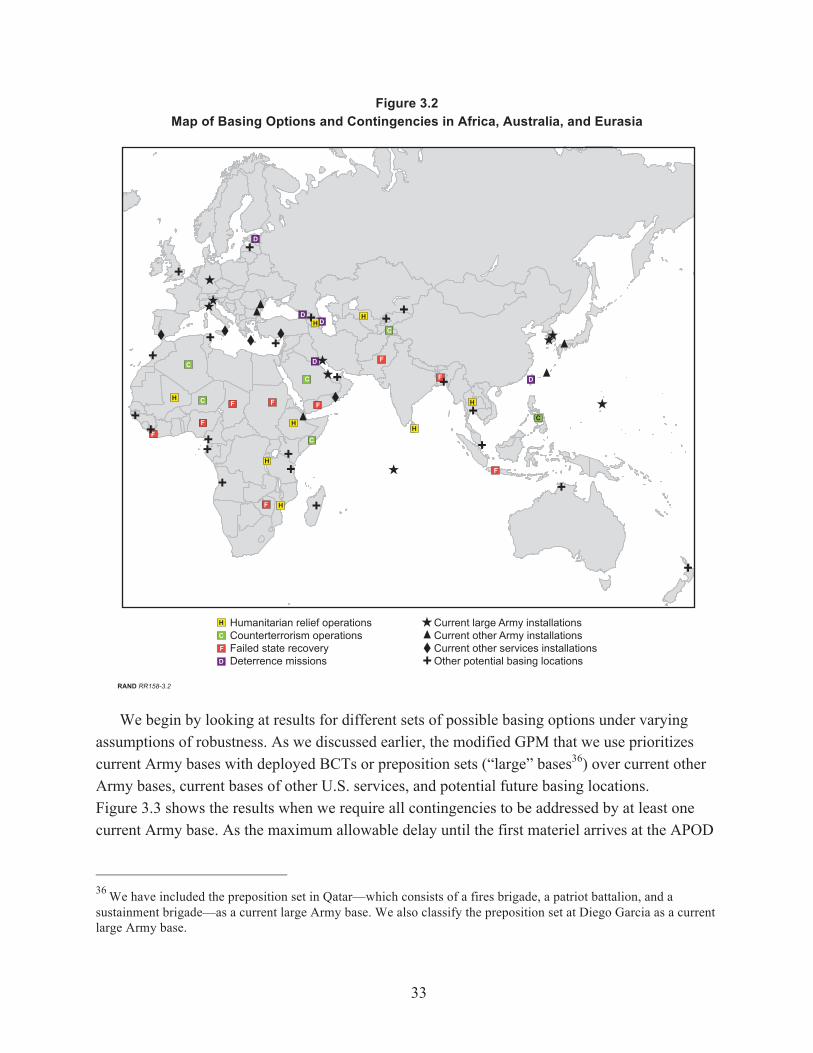
33
Figure 3.2 Map of Basing Options and Contingencies in Africa, Australia, and Eurasia
We begin by looking at results for different sets of possible basing options under varying assumptions of robustness. As we discussed earlier, the modified GPM that we use prioritizes current Army bases with deployed BCTs or preposition sets (“large” bases36) over current other Army bases, current bases of other U.S. services, and potential future basing locations. Figure 3.3 shows the results when we require all contingencies to be addressed by at least one current Army base. As the maximum allowable delay until the first materiel arrives at the APOD
36 We have included the preposition set in Qatar—which consists of a fires brigade, a patriot battalion, and a sustainment brigade—as a current large Army base. We also classify the preposition set at Diego Garcia as a current large Army base.
F
C
Humanitarian relief operationsCounterterrorism operationsFailed state recoveryDeterrence missions
Current large Army installationsCurrent other Army installationsCurrent other services installationsOther potential basing locations
RAND RR158-3.2
H
C
F
D
D
D
D
D
D
F
F
F
F
FF
F
F
H
H
C
C
C
C
C
H
H
H
H
H
H

34
Figure 3.3 Results: Contingencies Must be Addressed by at Least One Current Army Base
Humanitarian relief operations
Counterterrorism operations
Failed state recovery
Deterrence missions
Current large Army installations
Current other Army installations
RAND RR158-3.3
H
C
F
D
Delay until first materiel arrives in APOD (hours)2220181614121086420 24
Infeasible contingencies Four-base solution Three-base solution
Pisa, Italy; Kadena, Japan;
Honduras; Djibouti
Kadena, Japan; Djibouti; Puerto Rico
Current Army bases only: At least one base per contingency (nonlarge Army bases italicized)
H
H
F
F
FH
F
C
D
D
DD
D
F
F
F
F
FF
F
F
H
H
C
C
C
C
C
H
H
H
H
HH

35
increases, the results go from some contingencies being infeasible to there being a four-base solution (Kadena, Japan; Honduras; Djibouti; Pisa, Italy) when the maximum delay is 13 hours or more. In addition, when the maximum delay is 18 hours or more, there is a three-base solution (Kadena, Japan; Djibouti; Puerto Rico) that satisfies all contingencies.
For many of the cases below, multiple sets of the same size of basing solutions are feasible, but we show only one of each as an example. Later, we will examine the circumstances under which one base may be substituted for another to handle contingencies within the same region.
When we restrict the set to current large Army bases only, the results change dramatically. It is impossible to handle all the contingencies in our analysis using (single-hop) airlift only from such current bases. Accordingly, surface lift must be used for several missions. Figure 3.4 shows that the maximum allowable delay must be at least 9.75 days, at which point a four-base solution exists (Germany; Qatar; Hunter, Georgia; surface lift from Diego Garcia). In this case, the “maximum delay until materiel arrives in the APOD” is a misnomer, insofar as what we really mean is that surface lift from Diego Garcia can deliver all materiel to its contingencies in no more than the time it would have taken for an air bridge to have been opened to deliver all the materiel, plus 9.75 days.
Restricting the analysis to only deterrence and failed-state missions, a current base solution with three bases (Pisa, Italy; Honduras; Diego Garcia via surface lift) exists for a maximum delay of 12 hours or more, as shown in Figure 3.5.
Figure 3.6 shows how the basing solutions become larger if we increase the robustness requirement to at least two bases per contingency. It turns out that, for our choice of bases, only one base can handle the failed-state contingency in Bolivia, so we included that base (Hunter, Georgia) and then found a solution for which every other contingency can be handled by at least two bases in time. For our current large Army bases, surface lift is required for several missions, driving the maximum allowable delay up to 12 days for a seven-base solution, and 18 days for a five base solution. If we add other current Army bases, a seven-base solution exists for delays over seven days, and a six-base solution exists for delays over 12 days, as shown in Figure 3.7.
Because our current set of bases is somewhat restrictive, if we consider new basing locations as part of the mix, the maximum allowable delays drop to less than a day because almost all contingencies can be handled using airlift only (or surface lift that delivers as quickly as airlift would); see Figure 3.8.

36
Figure 3.4 Results: Contingencies Must be Addressed by at Least One Current Large Army Base
Humanitarian relief operations
Counterterrorism operations
Failed state recovery
Deterrence missions
Current large Army installations
RAND RR158-3.4
H
C
F
D
Delay until first materiel arrives in APOD (hours)9.75 days
Infeasible contingencies Four-base solution
Germany; Qatar; Hunter, Ga.; Diego Garcia (surface lift)
Current large Army bases only: At least one base per contingency
H
H
F
F
FH
F
C
D
D
DD
D
F
F
F
F
FF
F
F
H
H
C
C
C
C
C
H
H
H
H
HH

37
Figure 3.5 Results: Deterrence and Failed State Missions Only, Current Bases
Failed state recovery
Deterrence missions
Current large Army installations
Current other Army installations
Current other services installations
RAND RR158-3.5
F
D
Delay until first materiel arrives in APOD (hours)
2220181614121086420 24
Infeasible contingencies Three-base solution
Pisa, Italy; Honduras; Diego Garcia (surface lift)
All deterrence and failed state missions must be addressed by at least one current base
F
F
F
F
D
D
D
D
D
F
F
F
F
FF
F
F

38
Figure 3.6 Results: At Least Two Bases per Contingency, Current Large Army Bases Only
Humanitarian relief operations
Counterterrorism operations
Failed state recovery
Deterrence missions
Current large Army installations
RAND RR158-3.6
H
C
F
D
Delay until first materiel arrives in APOD (hours)2220181614121086420 24
Infeasible contingencies Seven-base solution Five-base solution
Germany; Hunter, Ga.; Kuwait; Qatar; Aviano, Italy;
Elmendorf, Ala. (surface lift);
Honolulu, Hawaii (surface lift)
Kuwait; Hunter Ga.; Qatar;
Pisa, Italy (surface lift);
Aviano, Italy (surface lift)
Current large Army bases only: At least two bases per contingencya
a Assume only one base needed for contingency in Bolivia.
H
H
F
F
FH
F
C
D
D
DD
D
F
F
F
F
FF
F
F
H
H
C
C
C
C
C
H
H
H
H
HH

39
Figure 3.7 Results: At Least Two Bases per Contingency, Current Army Bases Only
Humanitarian relief operations
Counterterrorism operations
Failed state recovery
Deterrence missions
Current large Army installations
Current other Army installations
RAND RR158-3.7
H
C
F
D
Delay until first materiel arrives in APOD (hours)2220181614121086420 24
Infeasible contingencies Six-base solutionSeven-base solution Five-base solution
Aviano, Italy (surface lift); Kuwait (surface lift);
Honolulu, HI (surface lift); Qatar; Hunter, Ga.;
Djibouti
Germany; Hunter, Ga.; Qatar;
Guam (surface lift); Djibouti; Honduras;
Kadena, Japan
Kuwait; Hunter, Ga.; Qatar;
Pisa, Italy (surface lift);
Aviano, Italy (surface lift)a Assume only one base needed for contingency in Bolivia.
Current Army bases only: At least two bases per contingency (nonlarge Army bases italicized)a
H
H
F
F
FH
F
C
D
D
DD
D
F
F
F
F
FF
F
F
H
H
C
C
C
C
C
H
H
H
H
HH

40
Figure 3.8 Results: At Least Two Bases per Contingency, Current Bases Preferred
Humanitarian relief operationsCounterterrorism operationsFailed state recoveryDeterrence missionsCurrent large Army installationsCurrent other Army installationsCurrent other services’ installationsOther potential basing locations
RAND RR158-3.8
H
C
F
D
Delay until first materiel arrives in APOD (hours)2220181614121086420 24
Infeasible contingencies Seven-base solutionNine-base Six-base solutionDiego Garcia; Honduras; Djibouti; Kadena, Japan;
Hunter, Ga.; Spain;Germany (surface lift)
Atsugi, Japan; Singapore; Pisa, Italy; Argentina; Sigonella, Italy; Wheeler-Sack, N.Y.; Diego Garcia;
Honduras; Djibouti
Kadena, Japan; Guam; Puerto Rico;Honduras; Cyprus; Djibouti
All contingencies must be addressed by at least two bases, current bases preferred
H
H
F
F
FH
F
C
D
D
DD
D
F
F
F
F
FF
F
F
H
H
C
C
C
C
C
H
H
H
H
HH

41
Results: Regional Analysis As we mentioned earlier, some bases may be substituted for others to address the same set of
contingencies within a region. The following tables look only at trade-offs for airlift. They show the results for contingencies in the Western hemisphere (Table 3.3); East Asia (Table 3.4); and the Middle East, Africa, and Europe (Table 3.5). The tables show the average, minimum, and maximum number of hours for each base until the first materiel arrives at the APOD over all feasible contingencies (although for bases with infeasible contingencies, the minimum in the table is set to zero). The tables also provide the number of infeasible contingencies (via airlift) for each basing option. In the other two tables, note that there are multiple basing options that
Table 3.3 Regional Results for Western Hemisphere Contingencies
Delay Until First Materiel Arrives at APOD (hrs)
Average Maximum Number Out
of Range Honduras 8.8 11.4 0 Dominican Republic 10.0 13.4 0 Peru 10.3 12.5 0 Bahamas 11.6 14.5 0 El Salvador 12.0 14.6 0 Fort Stewart/Hunter Army Airfield (AAF), GA 12.6 15.7 0 Puerto Rico 12.8 15.1 0 Costa Rica 15.2 17.3 0 Fort Drum/Wheeler-Sack AAF, NY 10.9 13.8 1 Argentina 13.7 15.9 1
Table 3.4 Regional Results for East Asia Contingencies
Delay Until First Materiel Arrives at APOD (hrs)
Average Maximum
Number Out of Range
Singapore 9.0 11.6 0 Thailand 9.4 13.3 0 Kadena, Japan 9.7 12.4 0 Australia 12.2 13.5 0 Guam 12.2 15.0 0 Atsugi, Japan 10.4 13.8 1 Diego Garcia 11.4 12.9 2 New Zealand N/A N/A 5

42
Table 3.5 Regional Results for Europe, Middle East,
and Africa Contingencies
Delay Until First Materiel Arrives at APOD (hrs)
Average Maximum
Number Out of Range
Cyprus 11.4 14.4 0 Djibouti 10.3 13.6 1a Turkey 10.5 13.8 1 Oman 10.4 13.7 2 Qatar 11.7 15.3 2 Kuwait 18.2 22.2 2 Kenya 46.7 49.7 2 Romania 10.6 13.8 3 Tanzania 14.9 17.8 3 Greece 10.2 12.6 4 Sigonella, Italy 10.5 12.9 4 Bulgaria 10.5 13.3 4 UAE 11.1 14.8 4 Pisa, Italy 11.3 13.9 4 Tunisia 24.1 26.7 4 Georgia 39.4 44.1 4 Latvia 12.7 14.7 5 Aviano, Italy 17.1 19.5 5 Germany 32.4 34.9 5 Uzbekistan 10.0 13.6 8 Spain 11.0 13.7 8 Cameroon 14.3 17.7 8 United Kingdom 14.4 16.2 8 Kazakhstan 10.6 13.7 9 Angola 14.4 17.6 9 Morocco 20.1 23.0 9 Gabon 44.3 47.9 9 Madagascar 34.6 36.6 10 Bangladesh 14.4 17.5 11 Liberia 13.4 17.1 14 Guinea-Bissau 14.6 17.7 14
a Although Djibouti is out of range for one contingency (the failed state recovery in Liberia), that contingency is within airlift range of the base in Puerto Rico.
can address all the contingencies, with Honduras and Singapore being the most centrally located of the set in the Western Hemisphere and East Asia, respectively.
In addition, for some contingencies (those requiring larger numbers of C-17, i.e., the short-warning missions except the counterterrorism mission), there are bases for which surface lift transports the materiel to the tactical assembly area much faster than airlift. These are shown in Tables 3.6 and 3.7. All contingencies for which surface lift is faster are highlighted in green, all

43
contingencies for which airlift is faster are in blue, and grey denotes a case where either surface and/or airlift was not available from that base to address a particular contingency. Not surprisingly, for the larger missions, surface lift tends in general to be a better option for bases and contingencies within the same region. Another way to view the values in these tables is to note how much strategic warning is required for surface lift to deliver materiel faster than airlift.
Table 3.6 Airlift and Sealift Comparisons: Americas, Africa, and Europe
Airlift Time - SurfaceLift Time (days) Cuba Panama Guatemala Zimbabwe Liberia Azerbaijan Estonia Georgia
Argentina -3.3 6.5 --- --- --- --- --- ---Bahamas 4.7 13.8 -0.3 --- --- --- --- ---Costa Rica 4.2 15.5 1.4 --- --- --- --- ---Dominican Republic 4.9 14.4 0.4 --- --- --- --- ---El Salvador 1.9 13.3 4.2 --- --- --- --- ---Honduras 3.4 13.8 -0.3 --- --- --- --- ---Hunter, GA 4.1 13.1 -1.0 --- --- --- --- ---McChord, WA -3.7 7.7 -1.0 --- --- --- --- ---Peru 1.0 12.4 1.1 --- --- --- --- ---Puerto Rico 4.6 13.0 0.0 --- 9.8 --- --- ---Wheeler-Sack, NY 2.7 11.8 -2.4 --- --- --- 5.7 ---
Atsugi, Japan --- --- --- --- --- --- --- ---Australia --- --- --- --- --- --- --- ---Guam --- --- --- --- --- --- --- ---Kadena, Japan --- --- --- --- --- --- --- ---Singapore --- --- --- --- --- --- --- ---Thailand --- --- --- --- --- --- --- ---
Angola --- --- --- -0.1 12.6 --- --- ---Cameroon --- --- --- -1.4 13.3 --- 3.4 ---Djibouti --- --- --- 0.6 --- 14.3 2.4 6.6Gabon --- --- --- -1.0 13.4 --- --- ---Guinea-Bissau -0.3 --- --- -3.0 14.6 --- 6.4 ---Kenya --- --- --- 3.3 6.1 11.3 --- 3.6LiberiaMadagascar --- --- --- 2.7 --- --- --- ---Morocco --- --- --- --- 12.0 15.7 8.8 8.0Tanzania --- --- --- 3.6 6.3 11.1 --- 3.4Tunisia --- --- --- --- 10.2 17.2 7.3 9.5
Aviano, Italy --- --- --- --- 10.0 16.4 7.0 8.7Bulgaria --- --- --- --- 7.5 17.7 4.5 10.0Cyprus --- --- --- -3.1 8.3 17.3 5.3 9.6
Greece --- --- --- --- 9.4 18.2 6.4 10.5
Sigonella, Italy --- --- --- --- 9.8 17.3 7.0 9.6
Latvia --- --- --- --- 7.9 11.5 12.9 3.7Pisa, Italy --- --- --- --- 10.2 16.7 7.3 9.0
Germany --- --- --- --- 9.1 12.7 11.1 5.0
Romania --- --- --- --- 8.4 18.8 5.4 11.1
Spain --- --- --- --- 11.8 15.8 9.2 8.1
Georgia --- --- --- --- --- 19.9 4.9 ---
Turkey --- --- --- -3.5 8.2 17.3 5.3 9.6United Kingdom --- --- --- --- 10.0 13.6 11.2 5.9
Qatar --- --- --- -0.7 --- 11.1 -0.7 3.4
Bangladesh --- --- --- --- --- 8.3 --- 0.6Diego Garcia --- --- --- 1.3 --- --- --- ---Kuwait --- --- --- -0.7 --- 11.0 -0.8 3.3Oman --- --- --- 0.8 --- 12.8 1.0 5.1
UAE --- --- --- -0.3 --- 11.5 -0.4 3.8
Americas Africa Europe
RAND DRR5237-Table 4.6a
Airlift faster Cannot compare (air or surface lift infeasible)Surface lift faster
Humanitarian relief operations Failed state recovery Deterrence missionsH
H
F
F F F F
D
D DD
Euro
peA
mer
icas
East
Asi
aA
fric
aM
iddl
e Ea
stan
d So
uth
Asi
a

44
Table 3.7 Airlift and Sealift Comparisons: East Asia, Middle East, and South Asia
Airlift Time - SurfaceLift Time (days) Cuba
ArgentinaBahamasCosta RicaDominican RepublicEl SalvadorHondurasHunter, GAMcChord, WAPeruPuerto RicoWheeler-Sack, NY
Atsugi, JapanAustraliaGuamKadena, JapanSingaporeThailand
AngolaCameroonDjiboutiGabonGuinea-BissauKenyaLiberiaMadagascarMoroccoTanzaniaTunisia
Aviano, ItalyBulgariaCyprus
Greece
Sigonella, Italy
LatviaPisa, Italy
Germany
Romania
Spain
Georgia
TurkeyUnited Kingdom
Euro
peA
mer
icas
East
Asi
aA
fric
a
Humanitarian relief operations Failed state recovery Deterrence missionsH F D
Taiwan Indonesia Kuwait Bangladesh Pakistan Sudan Yemen Sri Lanka
--- --- --- --- --- --- --- ------ --- --- --- --- --- --- ------ --- --- --- --- --- --- ------ --- --- --- --- --- --- ------ --- --- --- --- --- --- ------ --- --- --- --- --- --- ------ --- --- --- --- --- --- ------ --- --- --- --- --- --- ------ --- --- --- --- --- --- ------ --- --- --- --- --- --- ------ --- --- --- --- --- --- ---
15.1 -1.8 --- --- --- --- --- ---17.7 5.3 --- 10.3 --- --- --- -0.919.1 4.0 --- --- --- --- --- ---21.4 4.7 --- --- --- --- --- ---19.1 8.3 --- 13.3 10.8 --- --- 2.119.2 7.0 0.9 11.9 9.4 --- -2.1 0.7
--- --- -2.9 --- --- -5.6 -4.4 ------ --- -4.4 --- --- -6.3 -5.8 ------ 2.8 5.2 9.9 13.1 4.4 5.1 1.0--- --- -3.9 --- --- -6.2 -5.4 ------ --- --- --- --- -3.2 --- ------ --- 3.9 --- 11.9 1.4 2.5 0.5
--- 2.6 3.0 --- 10.8 0.4 1.6 0.9--- --- -1.4 --- --- -0.4 -1.4 ------ --- 3.7 --- 11.6 1.1 2.3 0.2--- --- 0.1 --- 8.1 1.3 0.2 ---
--- --- -0.7 --- 7.3 0.5 -0.6 ------ --- -0.6 --- 7.4 0.5 -0.5 ------ --- 1.3 6.1 9.3 2.5 1.4 -2.8
--- --- 1.0 --- 9.0 2.2 1.1 ---
--- --- 0.2 --- 8.2 1.4 0.3 ---
--- --- -5.6 --- 2.3 -4.4 -5.5 ------ --- -0.4 --- 7.6 0.7 -0.3 ---
--- --- -4.4 --- 3.6 -3.3 -4.3 ---
--- --- 0.3 5.0 8.2 1.4 0.4 ---
--- --- -1.3 --- --- -0.2 -1.2 ---
--- --- -0.3 4.4 7.6 0.9 -0.2 -4.5
--- --- 0.9 5.7 8.9 2.1 1.0 -3.2--- --- -3.5 --- --- -2.3 -3.4 ---
Middle East and South AsiaEast AsiaFD D F F HFF
Qatar
BangladeshDiego GarciaKuwaitOman
UAE
Mid
dle
East
and
Sout
h A
sia
RAND DRR5237-Table 4.6b
Airlift faster Cannot compare (air or surface lift infeasible)Surface lift faster
--- 3.0 8.1 10.1 14.4 1.3 2.4 1.2
16.7 6.6 2.7 --- 11.2 --- -0.3 2.6--- 5.2 4.0 12.4 12.6 0.8 1.9 3.0--- 2.9 --- 10.1 14.3 1.2 2.4 1.1--- 3.0 6.1 10.1 14.0 3.0 4.1 1.2
--- 3.3 8.0 10.5 14.7 1.7 2.8 1.5

45
Take as an example the deterrence mission in Kuwait. For five of the bases in Europe (Cyprus; Greece; Romania; Sigonella, Italy; and Turkey), surface lift is faster than airlift even with no strategic warning. However, with at least 5.6 days of strategic warning, every European base could deliver the materiel to Kuwait faster by surface lift.37
Findings: Responsiveness Our analysis shows that there are many good choices for basing Army forces for short-
warning missions in all regions of the world. Changes in Army posture and forward basing could bring about a more robust set of bases and improve the response time for short-warning missions in all contingencies. It is also clear that the responsiveness benefits from such changes are marginal and usually measured in hours rather than days. Forward basing arrangements already in place provide substantial reach and contingency response capabilities.
That leads us to conclude that, unless there is a clear need for greater responsiveness in a specific region or subregion, responsiveness gains alone are too small to justify major new investments. There are some caveats to that general conclusion. Especially if combined with greater regional presence that advances national policy goals (we address this issue in Chapter 5), some adjustments in posture might be worth considering further. Such adjustments might include greater presence in an existing forward location or provisions for contingency use of existing facilities, especially if the infrastructure is already in place.
Not surprisingly, our analysis also makes clear that airlift is most responsive for small- and medium-sized short-warning contingencies and for the leading edge of a large deployment. Ensuring that APODs have adequate MOG to receive deploying Army forces rapidly is an essential capability that would increase the speed of deployment. Surface movement (land or water) is competitive for bases and contingencies within the same region, as well as for some contingencies in nearby regions. For the larger force packages, such as those associated with a deterrence mission, surface movement may be preferred. The unique value of sea-based prepositioned equipment is that it makes surface lift even more competitive for preemptive movement provided some strategic warning.
As for the specific locations suitable for consideration for greater Army presence, the responsiveness criteria alone make certain states appear to be the most attractive. Since the United States already either has access agreements allowing it to use host-nation bases or has military facilities in most of these states, the issue is one of increasing that presence. The sites
37 To deliver materiel from Latvia to Kuwait, airlift is 5.6 days faster than surface lift, assuming both started at the same time. Accordingly, a 5.6-day head start for surface lift would get the materiel to Kuwait as fast as airlift from Latvia, and 5.6 days was the largest gap between surface lift and airlift times for European bases to deliver materiel to Kuwait. In our GPM runs, all surface lift assumes no strategic warning.

46
described in the following paragraphs offer some advantages over existing ones, but we see them more as complements to than as substitutes for existing major Army bases abroad.
In Europe, basing of Army forces in Romania and Bulgaria would allow presence in states with a high level of reliability and improve the response time for short-warning contingencies in the Middle East and parts of Africa.38 Rotational sites (FOSs) are already in place in these states.
In Southwest Asia and the greater Middle East region, Cyprus and Oman emerge as the top choices for improving response time. Reliability assessments place these states lower than the potential sites in Europe, but the strategic importance of Oman is clear. The United Kingdom operates two sovereign military bases (Akrotiri and Dhekelia) in Cyprus, and these might be an even more reliable basing option than Cyprus-government controlled territory. U.S. facilities are already in place in Oman.
In Africa, our analysis shows that increased presence in Djibouti and Kenya would improve Army responsiveness. Djibouti’s strategic location comes across in all the analyses because it allows rapid response to contingencies in East Africa and the Arabian Peninsula and is also a good backup choice for response to contingencies in adjoining regions. A joint base is already in place in Djibouti. Minor U.S. installations exist in Kenya.
A number of good choices exist in East Asia and the Western Pacific, including Singapore, Thailand, and northern Australia. U.S. facilities already exist in Singapore and Australia, while access arrangements are in place with Thailand. Singapore and Thailand offer similar response improvements. The relatively limited land area of Singapore limits the type of Army basing arrangements. Aside from these choices, Guam is also a good option for forward basing or prepositioning and avoids reliability concerns. Between Diego Garcia and Guam, there is good coverage of southeast Asia and the western Pacific.
In the Americas, the proximity of CONUS bases makes forward basing arrangements of limited additional value for short-warning response missions. If there were a need for such forward basing, many good choices exist in Central America and the Caribbean, with Honduras emerging as one good choice. In South America, Peru is worth consideration. There is already a FOS in Honduras and a U.S.-operated facility in Peru. Aside from these choices, Puerto Rico is a good option for forward basing and avoids reliability issues. A unit based in Puerto Rico also would make it viable to respond to some West African contingencies.
38 The caveat here is that we assume that Greece and/or Turkey allow overflight.

47
4. Assessing Utility of Basing Options for Steady State Requirements
GPM’s primary utility is to determine the optimal basing posture for missions that are time sensitive. It does not, however, provide many insights into the ideal basing posture for the potentially critical but non–time sensitive mission of steady-state security cooperation and BPC through train and assist operations. In the past, such missions have been planned well in advance and have had limited personnel and material requirements. If the past model is a good harbinger of the type of future demand for security cooperation, it is arguable whether such missions even require a substantial overseas basing footprint. However, if future provision of security cooperation takes a different form from the previous pattern that security cooperation was provided and requires more substantial resources of personnel and materiel, basing in country may offer advantages.
In this chapter, first we discuss the pros and cons of forward basing for security cooperation purposes. Then, we examine the potential approaches to the BPC mission focusing on forward presence. Finally, we provide some specific options for forward presence in Africa for security cooperation purposes.
Benefits and Drawbacks of Forward Presence for Security Cooperation
There are any number of ways to address BPC needs, with the specifics dependent on the context of the mission and the goals of the effort. The primary starting point for thinking about BPC needs is the realization that demand for BPC missions is inherently political. Choice of partners, the type of assistance provided, and the intensity of effort all stem from a political determination. Assuming that the decision is in place to engage in security cooperation with the goal of BPC, there are many pathways to training a foreign security force. Depending on the urgency of the mission, the security environment in place, and the scale of the effort, there can be great variations in the size and scope of the training mission.39 Other than for some unique situations involving a state under direct internal threat, it is not a given that stationing Army forces in country for BPC training is essential.40 Even in such unique situations, there may be 39 Department of Defense Instruction (DoDI) 5000.68, for instance, lists three conditions under which SFA mission might be executed: politically sensitive environments where an overt U.S. presence is unacceptable to the host state, environments where a limited and overt use presence is acceptable to the host state, and environments where a large-scale U.S. presence is considered both desirable and acceptable by the host state. DoDI 5000.68, Security Force Assistance (SFA), Washington, D.C.: U.S. Department of Defense, October 2010, p. 3. 40 In recent years the U.S. military has only rarely permanently based personnel in a country for the purposes of BPC. These exceptions have included the two massive wartime efforts in Afghanistan and Iraq, in which the United

48
alternatives; training might take place in a neighboring state or in the United States. Given all the above, attempting to determine the basing requirement for BPC missions comes up against limitations. We can portray a range of potential solutions and the force packages and basing arrangements associated with them, but we cannot a priori come up with an optimal solution in the way that the GPM can determine an optimal solution for short-warning missions.
The political determination includes a consideration of the pros and cons of stationing Army forces abroad for the BPC mission. In terms of the advantages, we see the following as most important:
1. Since Army forces are the primary element of U.S. land power, the decision to base Army forces in a state sends a clear signal of U.S. commitment to the country and/or region.
2. The very presence of Army forces in country can enhance and lead to longer-term relations with a partner’s military. Quite aside from the longer-term thinking that comes with the costs and investments required to allow the basing of Army forces in country, a full-time presence leads to a perspective shift in the way the host-state forces perceive interaction with U.S. forces.
3. There are specific benefits—better cultural awareness and knowledge of the country and/or region—that accrue to Army personnel from dealing full time with host-state nationals. While some of this knowledge also can be gained from short rotations into the country, the extent of such knowledge grows substantially if the soldiers are stationed in country for an extended period.
4. A full-time presence and the consequent ability to respond quickly to any emergencies increase compatibility with a partner army, and interpersonal bonds grow between U.S. soldiers and personnel of the host state.
Stationing Army forces abroad for the BPC mission also has disadvantages, and we see the following as the most important:
1. At the political level, there is an increased commitment in place to the host state. As a result of the BPC mission, the institutions of the state, and especially its security services, become more identified with the United States. In countries where the government has low legitimacy, the association of the United States with the security forces and the U.S. commitment to the regime may be problematic. But there can be a host of ramifications for the perception of the United States in the region is the commitment is not well thought out or if the United States has to back out of it.
2. Basing in country has potential unintended regional effects that may not be in line with the larger U.S. goals in the region. Presence of U.S. forces in country and the political signal that it entails can exacerbate a dispute with a neighboring country because the regime of the country in which the U.S. forces are stationed may become more
States was involved in the wholesale creation of a partner’s military virtually from scratch. Other exceptions have been the foreign internal defense operations in Colombia and the Philippines and Global War on Terror efforts in Africa centering around Joint Task Force (JTF)–Horn of Africa in Djibouti. What these exceptions have in common is that they are essentially “wartime” operations rather than true steady-state phase 0 efforts.

49
emboldened and willing to pursue more risky policies vis-à-vis its neighbors. Furthermore, neighboring states may be compelled to seek outside support to offset the increased capability of the state in which the U.S. forces are based.
3. The presence of U.S. military forces in country can lead to a backlash against the United States because such presence can be a rallying point for nationalists and those who wish to use the nationalist cover for their political goals.
4. In terms of the impact on U.S. Army personnel, lengthy unaccompanied tours in a developing country may lead to retention problems and increase the stress on officers and noncommissioned officers (NCOs).
In short, the needs for forward presence and in-country basing for carrying out the BPC mission need to be considered carefully. The strategic importance of a country to the United Sates and reasons stemming from U.S. defense strategy and national-level policies may make it desirable to base Army forces in country for the BPC mission, even though all the drawbacks to such presence (as outlined above) may be present. Conversely, even when none of the drawbacks are in place, the decision to station forces in country for BPC purposes still may not be forthcoming. In other situations, the BPC rationale may be one of the contributing reasons for in-country basing, with the primary reason being deterrence or partner assurance or regional power projection. In the following sections, we sketch out some concepts for provision of BPC and security force assistance (SFA) to the extent it pertains to in-country presence.
Future demand for SFA and BPC remains the main unknown when it comes to discussions of forward presence and basing. If the demand for U.S. SFA grows substantially in the post-Iraq and post-Afghanistan environment, the more far-reaching approaches we outline below may become pertinent. Even if the demand does not materialize, some of the concepts we put forth below may be worth implementing.
Approaches to BPC Presence
We identified three generic approaches to BPC that might require an overseas footprint:
1. the deployment of small training teams 2. the short-term intermittent rotation of a battalion- to brigade-sized element to conduct
joint maneuver training with partners 3. the in-theater deployment of a brigade-size element that could conduct periodic unit
maneuver training with partners or provide training detachments for partner unit-level and individual training.
These approaches are not mutually exclusive and can be employed either autonomously or in coordination with each other. The three approaches stem from our assessment and understanding of how the United States recently has conducted BPC and SFA.
Small Training Teams
Under the first approach, small teams of soldiers would be deployed to provide comprehensive training to battalion-sized units in the host state. The teams would consist of

50
about 72 soldiers and could train a light infantry or motorized infantry battalion over a period of 12 to 22 weeks.41 The training detachment would consist of four elements: a staff training section, a training section, a security section, and a support section. The staff training section would consist of 16 officers and senior NCOs and would focus on training host-state battalion and company-level staff and leadership elements in combat operations, fires and effects, personnel management, intelligence, and logistics planning and execution.42 The training section would consist of 40 trainers and would focus on training the battalion’s infantry and other military occupational specialties.43 The security section would consist of 10 soldiers equipped with three M1114/M1151A1 uparmored high-mobility multipurpose wheeled vehicles (HMMWVs).44 The final element of the training detachment would be a six-soldier support section equipped with one medium tactical vehicle (M1083) and one HMMWV.45
Such a detachment would be easily deployable, requiring approximately four C-17 missions. While these kinds of detachments are easily deployable from the United States, it is possible that, under some circumstances, the U.S. Army might want to have them forward deployed on a more permanent basis. Such circumstances could include BPC operations with a long-term partner or when the BPC mission is considered particularly critical and would benefit from a sustained and continuous presence.
Once deployed, this training detachment should be able to train a partner infantry battalion in 12 to 22 weeks. The longer period assumes that the entire training detachment is focused on building a battalion essentially from scratch by conducting initial entry training (9 weeks), infantry military occupational skill training (5 weeks), and unit collective training (8 weeks).46 If
41 This is a generic training detachment, but in reality, each such detachment would be tailored to the training and security requirements of the host state. U.S. Marine Corps detachments training Georgian light infantry battalions for deployment to Afghanistan can fluctuate in size between 10 and 70 Marines during a six-month training cycle. John Vandiver, “U.S. Training Georgians for Afghanistan,” European Stars and Stripes, September 4, 2009. 42 Size based on Operation Enduring Freedom infantry battalion embedded transition teams, which include support to company officers and NCOs. See also FM 3-24.2, Tactics in Counterinsurgency, Washington, D.C.: Headquarters, Department of the Army, March 2009, pp. 8–7. 43 This assumes a trainer-to-soldier ratio of 1 to 18 and 700 soldiers to be trained. This ratio is based on the number of drill sergeants in the training brigades at Fort Benning’s U.S. Army Infantry School. The 198th Infantry Brigade has a soldier to drill sergeant ratio of 18 to 1. The 192nd Infantry Brigade has three drill sergeants per 55–60 trainees in a platoon. See 198th Infantry Brigade, “Cadre Authorization” U.S. Army Infantry Homepage, Ft. Benning, Ga., March 18, 2009, and 192nd Infantry Brigade, “Training Battalion Responsibilities,” Ft. Benning, Ga, undated a. 44 Derived from FM 3-24.2, 2009, p. 8–7. The IBCT has a HMMWV-equipped six-soldier security section attached to the special troops battalion. See U.S. Army Armor Center, Armor/Cavalry Reference Data: Brigade Combat Teams, Fort Knox Supplemental Manual 71-8, Fort Knox, Ky., November 2005. 45 Based on the headquarters of a rifle company (IBCT). 46 Initial entry training and military occupational skill training are based on the U.S. Army Infantry One Station Unit Training (OSUT) Course at Fort Benning (192nd Infantry Brigade, undated a, and 192nd Infantry Brigade, “Training Overview,” Ft. Benning, Ga, undated b). According to How the Army Runs, Basic Combat Training runs for ten weeks. This course teaches basic military skills to new enlistees with no or limited prior military experience

51
the partner unit to be trained has already undergone basic training, then the training period can be reduced to 12 weeks that would consist of 8 weeks of collective training and four weeks of individual skill and small unit reinforcement and refresher training.47 With these training time lines, a training detachment could train between 2 and 3.5 partner infantry battalions a year. This approach could be useful for conducting peacekeeping, counterinsurgency, and counterterrorism training in Africa and central and southwest Asia.
The task force described above is larger and more robust than one SF might deploy to train a similar-sized host-nation force. To train a battalion-sized unit, the SF would generally deploy about three 12-soldier SF operational detachments. However, during peacetime, SF usually focuses on providing individual and collective training to established units, not on raising them from scratch, and does not usually conduct initial entry training.48 Finally, SF personnel often rely on operating from secure bases and the logistics support of others. As a result, the missions and structure of an SF BPC effort are not necessarily comparable with those of the team presented above.
Intermittent Rotation of Battalion- to Brigade-Size Units
The second generic approach to BPC would involve the intermittent rotation of battalion- and brigade-sized units to conduct readiness, interoperability, and joint maneuver training with partner armies. This approach is modeled on U.S. European Command’s (USEUCOM’s) JTF-East and relies on partner facilities that have space for unit training. It could also include a small permanently deployed headquarters detachment that would oversee the periodic unit rotations. One potential application for this approach would be to pair U.S. units with one or more of the operational- or tactical-level training centers of the African Union’s regional ready brigades. One advantage of this model is that it would allow U.S. units and personnel to train with countries that they may operate alongside in the future and in regions where they might be deployed. As
(U.S. Army War College, How the Army Runs: A Senior Leader Reference Handbook, Carlisle Barracks, Penn., 2011–2012, p. 3889). The collective training is derived from U.S. Army Europe’s training of Georgian light infantry battalions. A 65-soldier training team on a 12-week rotation would train Georgian units to prepare them for deployment to Iraq. The first four weeks were spent on individual training before moving to small unit and battalion training. (See Derrick Crawford, “U.S. Soldiers Help Ready Georgian Infantry for Iraq,” U.S. European Command website, August 17, 2006.) The initial Georgia “train and equip” program envisioned about 100 days (15 weeks) of training per unit. This tactical training was intended to instruct Georgian infantry battalions in light infantry tactics and focused on individual combat skills, and squad and platoon tactics. (See DoD, “Georgia ‘Train and Equip’ Program Begins,” press release, April 29, 2002.) This is far shorter than the 7 to 8 months that a U.S. mechanized infantry battalion is supposed to spend in collective training to prepare for an NTC rotation (Correspondence with Jim Crowley, RAND, June 23, 2009). Tom Lippiatt (RAND) suggests that three to four months of collective training for peacekeeping and stability operations is required (conversation, July 1, 2009). 47 Based on the Georgia train and equip program discussed in the previous footnote. 48 Conversation with Brian Shannon, RAND, March 28, 2011.
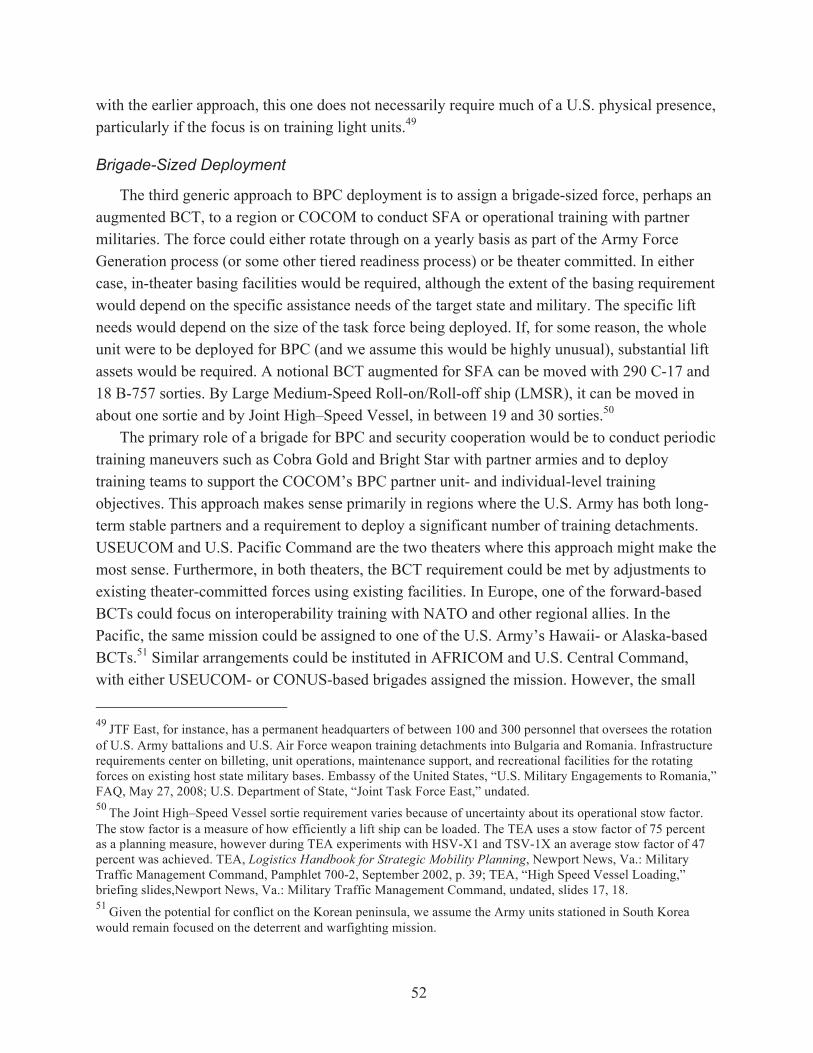
52
with the earlier approach, this one does not necessarily require much of a U.S. physical presence, particularly if the focus is on training light units.49
Brigade-Sized Deployment
The third generic approach to BPC deployment is to assign a brigade-sized force, perhaps an augmented BCT, to a region or COCOM to conduct SFA or operational training with partner militaries. The force could either rotate through on a yearly basis as part of the Army Force Generation process (or some other tiered readiness process) or be theater committed. In either case, in-theater basing facilities would be required, although the extent of the basing requirement would depend on the specific assistance needs of the target state and military. The specific lift needs would depend on the size of the task force being deployed. If, for some reason, the whole unit were to be deployed for BPC (and we assume this would be highly unusual), substantial lift assets would be required. A notional BCT augmented for SFA can be moved with 290 C-17 and 18 B-757 sorties. By Large Medium-Speed Roll-on/Roll-off ship (LMSR), it can be moved in about one sortie and by Joint High–Speed Vessel, in between 19 and 30 sorties.50
The primary role of a brigade for BPC and security cooperation would be to conduct periodic training maneuvers such as Cobra Gold and Bright Star with partner armies and to deploy training teams to support the COCOM’s BPC partner unit- and individual-level training objectives. This approach makes sense primarily in regions where the U.S. Army has both long-term stable partners and a requirement to deploy a significant number of training detachments. USEUCOM and U.S. Pacific Command are the two theaters where this approach might make the most sense. Furthermore, in both theaters, the BCT requirement could be met by adjustments to existing theater-committed forces using existing facilities. In Europe, one of the forward-based BCTs could focus on interoperability training with NATO and other regional allies. In the Pacific, the same mission could be assigned to one of the U.S. Army’s Hawaii- or Alaska-based BCTs.51 Similar arrangements could be instituted in AFRICOM and U.S. Central Command, with either USEUCOM- or CONUS-based brigades assigned the mission. However, the small
49 JTF East, for instance, has a permanent headquarters of between 100 and 300 personnel that oversees the rotation of U.S. Army battalions and U.S. Air Force weapon training detachments into Bulgaria and Romania. Infrastructure requirements center on billeting, unit operations, maintenance support, and recreational facilities for the rotating forces on existing host state military bases. Embassy of the United States, “U.S. Military Engagements to Romania,” FAQ, May 27, 2008; U.S. Department of State, “Joint Task Force East,” undated. 50 The Joint High–Speed Vessel sortie requirement varies because of uncertainty about its operational stow factor. The stow factor is a measure of how efficiently a lift ship can be loaded. The TEA uses a stow factor of 75 percent as a planning measure, however during TEA experiments with HSV-X1 and TSV-1X an average stow factor of 47 percent was achieved. TEA, Logistics Handbook for Strategic Mobility Planning, Newport News, Va.: Military Traffic Management Command, Pamphlet 700-2, September 2002, p. 39; TEA, “High Speed Vessel Loading,” briefing slides,Newport News, Va.: Military Traffic Management Command, undated, slides 17, 18. 51 Given the potential for conflict on the Korean peninsula, we assume the Army units stationed in South Korea would remain focused on the deterrent and warfighting mission.

53
force size of partner militaries (especially in AFRICOM) or political sensitivities against deploying large number of U.S. troops in many U.S. Central Command countries would necessitate different arrangements than those that might apply in Europe. Both of these considerations are also relevant in SOUTHCOM.
Basing Implications As we discussed earlier, the three options for provision of BPC are not mutually exclusive.
Below, we provide a possible notional way to operationalize the three approaches with respect to AFRICOM and paying particular attention to forward-basing implications. We discuss AFRICOM as an illustration; most of the observations and proposed practices also apply to other regions of the world.
We assume that a BCT augmented for SFA is assigned to AFRICOM as part of the Army Force Generation cycle. Although the brigade remains based in CONUS, it deploys headquarters and support elements in two in-theater sites, with each amounting to a small FOS. Based on our reliability assessments and the need to support operations in west and east Africa, the two sites might be located in Liberia and Kenya. The brigade would rotate units up to a battalion size, if needed, to provide training and to exercise with partner militaries. Specific units within the brigade could be paired with the African Union’s standing ready brigades and/or its training centers (these include the Kofi Annan International Peacekeeping Training Center in Ghana, l’ Ecole de Maintien de la Paix Alioune Blondin Bêye in Mali, and le Cours Supérieur Interarmées de Défense, in Cameroon). A long-term presence at these institutions would also support institutional capacity building efforts. The nuts and bolts of the actual training of the host-state security forces would be provided by training teams specially formed by the brigade using its organic and attached assets. Depending on the size and scope of the effort, the training teams might deploy in country for an extended period.
Focusing specifically on the basing aspects, we identified several overarching approaches within AFRICOM that would channel the way that assistance would be forthcoming. One approach would be to shore up the states in the Sahel and in Central and East Africa as part of the overall U.S. counterterrorism effort. As part of this approach, a robust on-the-ground presence would mean establishing FOSs in key states and CSLs in adjoining states. Using our reliability and accessibility findings, the potential FOS locations would include Senegal, Ghana, Cameroon or Gabon, Kenya, and Djibouti. Facilities in these states would provide the hubs for supporting efforts in neighboring countries. For example, a FOS in Ghana would support activities (and CSLs) in Benin, Burkina Faso, and Niger, while a FOS in Senegal would support BPC in Mali and Mauritania. If a presence in North Africa were desired, Morocco might be an appropriate location.
Another, more low-footprint, approach might consist of joint FOSs in states on the periphery of Africa and supporting activities (and CSLs) in key partner states on the continent. Using our

54
reliability and accessibility findings, the potential FOS locations might include Cape Verde, São Tome and Príncipe, Madagascar, and Djibouti. Each of these FOSs would provide support to BPC activities in West, Central, southern and eastern Africa, respectively.
Both of the above approaches might be paired with an institutional presence in the African Union’s training centers and/or some arrangement on a division of labor with major NATO countries and the presence they have in Africa. For example, the UK training missions in Kenya and Sierra Leone or the French training teams in Senegal and Gabon might be a part of the effort.
Conclusions Determining the basing requirement for BPC missions is difficult because the demand for
such forces and the nature of the support provided are inherently political decisions. There are multiple paths to training foreign armies, and it is not a given that U.S. Army units need to be stationed in theater to provide such training. Forward presence for BPC makes the most sense when it is coupled with other strategic rationales. Africa illustrates this observation. Some of the weakest states in the world are located in Africa. As a result, this region would benefit from a sustained effort to build regional peacekeeping, counterinsurgency, and military institutional capacity, although for such assistance to be effective and long-lasting, it would need to be part of a larger assistance effort focusing on governance and development. Counterterrorism provides a potential rationale for U.S. assistance in the Sahel and East Africa, although as we note above, long-term in-country presence is not necessarily needed to provide such assistance. Djibouti and Kenya came up consistently in our analysis of short-warning responsiveness as good choices. Combining that rationale with a regional BPC support base makes a stronger justification for an expanded Army presence in those two countries.

55
5. Findings and Recommendations
The purpose of our research was to examine the global positioning of Army forces and to recommend improvements in the stationing of Army forces for future responsiveness and effectiveness. The findings were to provide analytical assistance to Army input to national-level decisionmaking concerning the basing of U.S. forces overseas. Below, we present our main findings and then move on to the recommendations.
Findings
The Cold War–era global posture was driven by a long-term rivalry amidst a stable, if confrontational, security environment that allowed the building of a large U.S. military infrastructure in Europe and East Asia at a massive cost. Continued forward presence in these areas contributes to the ability of U.S. forces to project power rapidly and on a global scale. Changes in U.S. global posture, initiated in the first decade of the 21st century, have shifted the form of U.S. forward basing, with low-footprint and rotational bases and contingency access arrangements in areas of traditionally low U.S. presence.52 As noted earlier in this report, this study’s findings reflect U.S. basing and forward posture prior to the 2012 defense strategy guidance addressed the rebalance to the Asia-Pacific region and prior to the full development of the Army’s regionally aligned forces. The findings are nevertheless consistent with and support this trend. Because the greater degree of uncertainty in the current security environment—as contrasted with the Cold War era—makes establishment of large new bases neither warranted nor justifiable, our analysis takes as a starting point the idea that future U.S. global posture will continue to emphasize the low-footprint approach, although the remaining Cold War era U.S. bases will retain their importance in supporting U.S. power projection.
One of the more challenging and yet critical steps in any analysis of global posture is an assessment of the likelihood of unconstrained U.S. use of a given base in crisis conditions. After all, the utility of a base is reduced in a contingency if the host state imposes restrictions on the use of the base when the United States needs it the most. We developed an index of political reliability that allowed us to narrow the set of the countries in each of the world’s regions to those most likely to allow the United States unconstrained access to and use of the base. We used the set of countries that passed our criteria of reliability and accessibility for further evaluation and modeling.
52 Examples include the access arrangements in place with Romania and Bulgaria, the FOS in Djibouti, and the global CSL network.

56
To assess responsiveness of existing and potential Army bases, we evaluated the ability of current and potential bases to support the deployment of Army forces on a variety of specific (scenario-based) short-warning missions, including deployment for deterrence purposes, response to state failure, humanitarian relief, and counterterrorism. Using the RAND Arroyo Center–developed GPM, we found that there are many good choices for basing Army forces in all regions of the world and that small adjustments to Army posture can improve response time for short-warning contingencies and provide for greater robustness within the overall global posture. The adjustments include greater presence at existing facilities and locations and additional contingency access and rotational bases in states currently not hosting U.S. Army forces. Comparing the improvements in responsiveness with current posture, we found that potential gains are small, usually measured in hours rather than days. Choices regarding new bases depend on assessment of trade-offs between the costs associated with upgrading the facilities at proposed locations and the marginal benefits in responsiveness. Given the limited gains in responsiveness, robustness and strengthening defense relationships provide a more valid justification for the infrastructure improvements that might be needed.
Several specific locations emerged consistently from our analysis as improving responsiveness. Minimal adjustments by upgrading these locations may have substantial impact for robustness and responsiveness. In Europe, Africa, and Southwest Asia, Djibouti and Cyprus are the most promising for consideration of greater Army forward basing. Within the greater Middle East area, Oman and UAE emerge as good choices. In East Asia, Guam and Australia offer advantages over current arrangements; Thailand is another possibility.53 New Army basing arrangements appear to be unnecessary in the Americas, although there are many good choices.
Our analysis showed the importance of airlift and the capability to increase rapidly the MOG of austere airfields as APODs for short-warning missions. But surface lift is a good alternative to airlift for the bigger force packages associated with the more-demanding missions, especially for intraregional contingencies. In regions with highly developed road and rail transport infrastructures, surface lift has many advantages. For example, surface lift meets deterrence demands in Europe. Sealift offers advantages in East Asia and the western Pacific, particularly if we assume strategic warning and the ability to start the movement of sea-based prepositioned equipment prior to the actual crisis.54
53 Guam is a candidate because of its size and the fact that it is already home to many units of the U.S. armed forces. In our analysis, we have taken the first step in identifying potential basing candidates based on responsiveness macrofactors, but any decision to move forward will require an in-depth look at each candidate location to assess whether such a base is in fact feasible or cost-effective. 54 For example, assume that, prior to the final political decision being made on intervention, sea-based prepositioned equipment is placed on alert and sails from its home port toward a potential destination. For purposes of our modeling effort, the early sailing in response to such a warning means a reduction in the distance and time to close to the SPOD.

57
Assessing the utility of forward basing locations for purposes of steady-state security cooperation and BPC does not offer clear results akin to those for assessing responsiveness. Demand for forces for BPC is essentially a political decision and, depending on the scope and size of the effort, it is not a given that basing forces in country—other than rotating training teams—is necessary for the effectiveness of the mission. The assignment of brigades as force providers for security cooperation and BPC to the geographical COCOMs, especially if coupled with a substantial demand for such forces, may lead to the establishment of small support bases to make the effort effective. AFRICOM may be an appropriate COCOM for such an arrangement. If there is a political decision to establish some basing arrangements in support of the BPC effort in Africa, a number of states are worthy of a closer look for purposes of cost-benefit assessments, including Senegal, Ghana, Gabon, Kenya, and Djibouti.
Recommendations The results of our analysis provide an initial first cut at the states where either increased or
new U.S. Army presence may be useful for improving responsiveness and/or increasing effectiveness for security cooperation. But further action depends on the determination that greater robustness, faster responsiveness, or deepening a critical security and defense relationship is needed in a given region.
In a nutshell, the Army should consider the following:
• conducting a detailed cost estimate of the infrastructure improvements needed in the states most appropriate for increased Army presence
• monitoring demand for SFA and BPC and considering basing choices as part of the solution set, as necessary
• experimenting with different ways to provide BPC, in terms of basing arrangements, within a geographical COCOM to gain a better understanding of the costs and benefits of the different ways.
To assess the costs and benefits of further action fully, the Army and DoD will need to conduct a detailed cost estimate of the facilities and infrastructure improvements needed to create a fully functioning base in the states considered for increased Army forward basing. A comprehensive assessment would include the investment and construction costs, anticipated maintenance costs, and service industry support costs. The strain on force structure and personnel rotation costs also could entail additional costs.
Of course, we assume that the potential host state would be willing to host U.S. forces. Many of the states that come out well in our analysis already host U.S. military facilities. In these countries, a status-of-forces agreement is already in place and increasing forces would depend on the host state approval to have a higher U.S. military presence. In other states, where U.S. forces have not been stationed, a status-of-forces agreement would have to be worked out, and the host state would need to agree to the potentially politically divisive decision to host U.S. forces. In

58
any event, even prior to such negotiations, it would be necessary to have a full assessment of the costs and benefits the United States would accrue from the changes in basing arrangements.
As part of the cost-benefit assessment, there is also a need to contrast the costs associated with infrastructure improvements in plausible locations with the costs of alternative arrangements, such as prepositioning of equipment, taking into account the reliability concerns associated with each option. Quantifying reliability concerns is more difficult than calculating financial costs, but the concerns need to be taken into account in all the analyses.
Cost-benefit considerations need to be assessed in terms of the specific needs for Army forces in a given region. In regions where robustness is needed, adding rotational bases and prepositioning sites may be the optimal way to proceed. In regions where deepening a security relationship is the rationale for an expanded Army forward presence, considerations of low-footprint or high-visibility commitment may sway the specific choices, both in terms of type and location. In grey areas where only marginal responsiveness is achieved and where robustness is of secondary importance, the choice of adding to existing bases might be influenced by BPC-related considerations.
Many of the potential future basing needs are linked to the as-yet-unknown demands for future SFA and BPC missions. Robustness and increased responsiveness can be calculated using the defense planning scenarios, but from a planning perspective, there is an uncomfortably large range of choices in both the types and sizes of forward basing in new regions of importance for BPC. In that vein, demand for SFA and BPC needs close monitoring. Even if the higher demand for SFA and BPC materializes, the extent to which bases are a part of the solution is uncertain, depending on the extent of the demand and whether the high- or low-footprint route is chosen for the provision of BPC. Answers may vary by geographical COCOM.
Whether the demand comes about or not, the Army can consider experimenting with various ways of providing BPC, taking into account the various basing arrangements. The goal would be to evaluate the extent of benefits between in-country and short-term rotation as ways of providing BPC and security cooperation. For example, the same brigade assigned to a geographical COCOM for security cooperation purposes may deploy a support and headquarters element to a forward location in one subregion of the COCOM while relying on nondeployed assets in another subregion of the COCOM. After-action reports and evaluations of improvements in local security force effectiveness may bring about a better understanding of the implications of both paths of action.
Finally, for future analytical purposes, the framework we developed in our study is amenable for use by COCOMs (and Army service component commands) for planning purposes. It brings a critical strategic assessment (reliability) as a preliminary step prior to the calculations of responsiveness. Moreover, the strategic assessment is based on a unique cross-comparable data set that is empirically based, warrants continuous updating, and is not amenable to being

59
“gamed” easily.55 The original tool we developed is able to include costs in the calculations. The methodology presented here has the potential to be developed further as a decision support tool for DoD’s future posture decisions.
55 A country’s two-decades long record of voting in the UN on issues that are of specific interest to the United States is a set of data. Using such a data set for a country establishes a starting point for comparison of that country’s stance vis-à-vis the United States that is based not on assumed foreign and security policy goals but on a record of “revealed preference.”


61
Appendix A. Political Reliability and Accessibility Methodology and Findings
This appendix describes the methodology we used to create the UN support index, provides information about the Polity IV and Freedom House data, and defines the geographical regions under examination. The appendix then presents the detailed results, by region and subregion, of our reliability analysis.
United Nations Support Index
We developed the UN support index to serve as an indicator of a state’s political potential to support the future long-term overseas presence needs of the U.S. Army. We assume that the greater the coincidence between a state’s votes in the UN and those of the United States, the more likely that state is to share the international values of the United States and to support U.S. international goals. We assume that such a coincidence of interests and values will be conducive to ensuring long-term support of a U.S. military presence in that country and is an indication that the operations of U.S. forces from the base will be unconstrained. We refer to this as political reliability.
We derived the data to construct this index from the U.S. Department of State’s congressionally mandated Report to the Congress on Voting Practices at the United Nations.56 The annual report compares the General Assembly voting records of UN member states to that of the United States.57 The Department of State provides voting information on both overall General Assembly votes and “important” votes. Important votes are those on “issues which directly affected United States interests and on which the United States lobbied extensively.”58 There are typically 12–15 such votes a year, with the average (mean) for the 1990 to 2008 period being 12.5 important votes.
The UN support index measures the degree to which a country’s UN voting record on contested votes coincides with that of the United States.59 The index ranges from 100 to –100 and is derived by determining:
56 U.S. Department of State, “Voting Practices in the United Nations,” various years. 57 The U.S. Department of State has been required to issue an annual report of voting records since it was mandated by law to do so in 1983. 58 The term important votes is a congressionally mandated and defined category. See DoS, “Voting Practices in the United Nations,” 2011, p. 19 59 The Department of State also provides information on resolutions passed by unanimous consent. While the majority of UN Plenary session votes are passed by consensus, we chose to focus only on the contested votes

62
1. the percentage of votes a state cast that were identical to those cast by the United States 2. the percentage of votes a state cast that were opposite the U.S. vote 3. the number of abstentions 4. the number of times the state was absent.60
The denominator for this calculation is the number of votes cast by the United States—either plenary or important—during the UN General Assembly session. To get the actual index, we subtracted the percentage of opposite votes from the percentage of identical votes. We multiplied the result by 100 to convert the resulting sum into a number greater than one. Using this formulation, an index value of 100 would signify that a country voted identically with the United States on every vote in which the United States participated (i.e., no abstentions or absences), while an index value of –100 means that it always voted against the United States. We calculated an index for both the plenary votes and important votes.
We calculated an index value each year (1990 to 2008) for every state. However, if a state did not participate in two-thirds (66.7 percent) of the votes cast by the United States (plenary or important), we deemed that year’s index to be a potentially unreliable indicator and considered it unusable. If a state did not have a number of usable years equal to or greater than 50 percent of the period being analyzed, we considered data on that state’s UN record unreliable and flagged the country to indicate that there was insufficient data with which to make an accurate assessment of its political reliability.61 Over a 19-year period, a state must have had at least nine usable years for its UN votes to be considered reliable.62 The requirement for at least nine usable years led us to flag 19 countries from our analysis of plenary votes and 19 countries from our analysis of important votes.
The following subsections illustrate the methodological approach we used to determine political reliability.
because of the belief that such votes were over issues that mattered and that any vote that was uncontested must be over an issue that was either administrative or banal. 60 The Department of State derives its voting coincidence value by dividing the number of identical votes that a state cast by the sum of the identical and opposite votes that it cast. This value was considered inadequate for this project because it ignores the importance of abstentions and absences in a state’s voting record. Under the Department of State’s counting method, a state that voted with the United States once but abstained nine times would have the same voting coincidence value as a state that voted with the United States ten times. It is our contention that the latter state would likely be a more reliable partner than the former. 61 The countries that rarely attended the UN and/or cast only a few votes are identified in data tables later in this appendix. Using this criterion, we earmarked 19 countries in our analysis of UN important votes. These countries had the mean number of “usable” years of 5.1 years, while the median was 5 years. These states voted an average (mean) 57.5 percent of the time when they attended the UN. About 10 percent of these countries (two) had eight “usable” years and thus just missed the nine-year criterion for sufficient data. 62 However, when calculating a state’s mean UN Support Index, we used all years.

63
Example 1
During the 52nd UN General Assembly (1997), the United States cast 72 UN plenary votes. (There were actually 87 plenary votes during this session, but the United States abstained 15 times, and these abstentions are not included in the Department of State data.) Algeria voted with the United States 19 times, voted against it 42 times, abstained 10 times, and was absent from one vote. This translates into the following voting percentages: 26.4 percent identical, 58.3 percent opposite, 13.9 percent abstained, and 1.4 percent absent. Subtracting the opposite vote from the identical vote and multiplying the result by 100 gives us a UN support index value of –31.9. Because Algeria was present for 98.6 percent of the relevant plenary votes, this value is considered to be valid.
Example 2
During the 1990–2008 period, São Tomé and Príncipe’s average plenary vote record was –32.5; its important vote record was more aligned with the views of the United States, with a score of –10.6. However, during this 19-year period, São Tomé and Príncipe voted only 30 percent of the time, making it more difficult to infer adequately the political reliability of this state. As a result, we earmarked São Tomé and Príncipe to indicate that any judgments about its suitability as a basing candidate must take into account a degree of uncertainty about its political reliability.
Using these criteria, we compiled data that compare both global and regional voting records across time. In this first-cut analysis, we decided to exclude earmarked countries altogether to illuminate data only for countries with robust political reliability data. Applying this method, Figures A.1 and A.2 highlight an interesting phenomenon regarding countries with active UN voting records. While the UN General Assembly does not appear to share the global perspective of the United States (indicated by the world plenary vote mean, –26.0), when the United States does makes its position clearly known and is willing to exert its influence over an important vote, it prevails more often (mean score –1.8).

64
Figure A.1 United Nations Support Index for Plenary Votes (Mean, 1990–2008), by State
Figure A.2 United Nations Index for Important Votes (Mean, 1990–2008), by State
One of the drawbacks of relying upon aggregate, multiyear means as an indicator of political
reliability is that they can mask important positive or negative trends over time. This is apparent from Figure A.3, which illustrates that, since about 1999, support for U.S. positions at the UN has generally declined. The negative trend in support on plenary votes surpassed its 1990 low of –48.9 in 2007 with a score of –52.2. The UN support index for important votes plummeted to –30.0 in 2008, far below its 1991 peak of 26.7.
This chart also highlights another trend: a post-9/11 decline in the U.S. ability to sway UN members on votes considered particularly important to the United States. Since the 9/11 attacks, important vote averages have remained below the 50-percent threshold.
-100.0
-80.0
-60.0
-40.0
-20.0
0.0
20.0
40.0
60.0
80.0
100.0
Support Index (Mean)
-100.0
-80.0
-60.0
-40.0
-20.0
0.0
20.0
40.0
60.0
80.0
100.0
Support Index (Mean)

65
Figure A.3 United Nations Support Index Plenary Versus Important Votes (Global Average): 1990–2008
Primary Regions
Forward basing is regionally focused, in that it has implications for U.S. presence and response to contingencies in a given region. U.S. government policy statements mention the world’s regions—often stated as continents or parts of continents—but seldom define them. The “regional posture perspectives” section of the 2010 QDR refers to the following “regions:” Europe, the Pacific (or Asia-Pacific), the Greater Middle East, Africa, and the Western Hemisphere.63 The terminology differs a bit from previous QDRs.64 The terminology also does not coincide fully with DoD’s COCOMs or the areas of responsibility (AORs) of the Department of State’s bureaus.
For the purposes of our analysis, we categorized the global “regions” using a combination of geographic definitions, U.S. Department of State bureau concentrations, and COCOM AORs. Our five primary regions are Europe, Americas, Africa, East Asia and the Western Pacific, and the Middle East and Southwest Asia. We defined the countries of Europe using the geographic definitions provided by Merriam-Webster’s Geographical Dictionary.65 The Americas includes the countries of concentration in the Department of State’s Bureau of Western Hemisphere Affairs. Africa includes the geographic AOR delegated to AFRICOM. East Asia and the Western
63 DoD, 2010, pp. 64–69. 64 The 2001 QDR refers to the following “regions:” Europe, Northeast Asia, the East Asian Littoral, the Middle East and Southwest Asia, and the Western Hemisphere. DoD, Quadrennial Defense Review Report, Washington, D.C., September 30, 2001. 65 Europe, by this definition, is essentially that part of the Eurasian landmass west of the Urals and north of the Caucasus Mountains. This definition excludes both Turkey and Cyprus from Europe. Because Russia straddles both Europe and Asia, it is included in both the Europe and East Asia and the Western Pacific categories. See Merriam-Webster, Merriam-Webster’s Geographical Dictionary, 3rd ed., April 1, 2007, pp. 372–375
-100.0-80.0-60.0-40.0-20.00.020.040.060.080.0100.0
1990199119921993199419951996199719981999200020012002200320042005200620072008
Plenary Important

66
Pacific combines countries included in the Department of State’s Bureau of East Asian and Pacific Affairs and the countries of South Asia. The Middle East and Southwest Asia encompasses the states in Asia Minor and the Caucasus region, the Middle East and Persian Gulf, and Southwest and Central Asia. Figure A.4 highlights the five primary regions, plus Russia’s dual-hatted location as part of the Europe and East Asia and Western Pacific regions.
Subregions
Since our “regions” cover large areas of the Earth, we drilled down further to assess reliability at the subregional level. To do this, we divided the five primary regions into 17 subregions to determine the “best from the least” in terms of political reliability. Figures A.5–A.9 depict the subregions.
For Europe, we used two subregions. Rather than use Cold War distinctions of East and West, we used north and south distinctions, which are more in line with the contemporary security environment and are more appropriate for the purposes of power projection and distances involved. The main distinction between north and south was along the main east-west mountain ranges in Europe (Alps and Carpathians) and whether the state had a coastline or access to the Mediterranean. For the Greater Middle East region, we used three subregions, distinguishable along political lines: Asia Minor and the Caucasus, the Arab states of the Middle East and the Arabian Peninsula, and the states of Southwest and Central Asia.
We then combined an assessment of UN voting records in each subregion, with an analysis of average global democracy scores and trends (toward or away from democratization) using the Polity IV, and when necessary, Freedom House data sets. The next section provides additional detail on these data sets.
Democratic Development Data We used two databases to inform our results on the extent of democratic development.
Polity IV Project Data
The Polity IV data set is a widely used academic database that seeks to code “the authority characteristics of states in the world system for the purposes of comparative, quantitative analysis.”66 The data set includes yearly time-series data since 1800 on the authority characteristics of all states that had achieved independence by 2007 and which had populations of more than 500,000 in 2007. Although the database provides several slightly different methods to measure democracy, we chose the “POLITY” score as our indicator of a state’s level of
66 Monty G. Marshall and Keith Jaggers, Polity IV Project: Political Regime Characteristics and Transitions, 1800–1999, College Park, Md.: Center for International Development and Conflict Management, December 2000, p. 1.

67
democratization.67 This is a composite score ranging from –10 to 10 (10 being the most democratic) that is based on two composite scores (Institutionalized Democracy and Institutionalized Autocracy) that are in turn based on five measures of a state’s institutional political structure.68 We then derived democratic trend data by comparing the mean of a state’s POLITY score for the most recent five years with its overall POLITY mean. States that had an improved mean of at least two points on the scale were scored with a “+”; states that experienced a decline of at least 2 points scored a “–”; and states with less than a 2-point change were considered to be stable (S).
Freedom House Data
Due to the Polity IV data set’s criterion for inclusion (population size > 500,000), 31 states that are members of the UN do not have a POLITY score and thus cannot be classified as either democratic or autocratic. For these states, we used Freedom House country ratings, which measure political rights and civil liberties on a 1 to 7 scale, with 1 indicating the highest degree of freedom and 7 the lowest. We first calculated averages from 1990–2008 (latest available data), then calculated weighted averages from 2004–2008 to determine democratization trends over the past five years. We used a 0.7 scale, in which states moving more than 0.7 point toward 1 in the last five years were scored with a “+”; those moving away from 1 by more than 0.7 scored a “–”; and anything within a 0.7 scale we considered stable.
Regional Data—Political Reliability The first-cut analysis of political reliability focused on UN voting data for the five primary
regions: Europe, Americas, Africa, East Asia and the Western Pacific, and the Middle East and Southwest Asia. As the next several figures show, the preponderance of support for the United States in the UN comes from Europe. Figure A.4 provides important vote scores for Europe. The highest percentages were for the U.K. (48.5), followed by Latvia (43.8) and a cluster of mostly northern European states.
As Figure A.5 indicates, three of the highest overall UN support index scores were located in the East Asia and the Western Pacific region, including the Marshall Islands (59.8), Micronesia (55.2), and Australia (50.0). Of these, the Marshall Islands and Micronesia are in a Compact of Free Association with the United States.
67 For example, the Polity IV database was refined in 2002 to include a POLITY2 indicator, which standardizes scores to account more accurately for minor periods of political volatility, such as during elections or regime transitions. 68 The five component variables are competitiveness of executive recruitment, openness of executive recruitment, constraint on the chief executive, competitiveness of political participation, and regulation of participation.

68
Figure A.4 United National Important Vote Score Averages in Europe, 1990–2008
NOTE: Switzerland (19.4), Serbia (10.2) and Montenegro (23.1) are excluded because of the lack of sufficient usable years.
Figure A.5 United Nations Important Vote Score Averages in East Asia and the Western Pacific,
1990–2008
NOTE: Timor-Leste (5.2), Palau (55.8), Nauru (22.0), the Solomon Islands (14.0), Tuvalu (2.4), Kiribati (0.4), and Tonga (–9.5) are excluded because of the lack of sufficient usable years.
Figure A.6 presents the data for the Americas. Canada is in a league of its own in terms of its high voting coincidence with the United States. Of the other states in the Americas, the top ones were El Salvador (21.7), Argentina (17.8), and Costa Rica (16.0). Paraguay also scored high (15.0), but we excluded it from further consideration because of accessibility (it is landlocked).
-100.0-80.0-60.0-40.0-20.0
0.020.040.060.080.0
100.0UK
Latv
iaEs
toni
aPo
land
Neth
erlan
dsNo
rway
Hung
ary
Lith
uani
aGe
rman
yRo
man
iaDe
nmar
kIta
lyIce
land
Fran
cePo
rtuga
lBe
lgiu
mLu
xem
bour
gFi
nlan
dCz
ech
Repu
blic
Bulg
aria
Slov
enia
Irelan
dAu
stria
Swed
enSp
ainSl
ovak
Rep
ublic
Liec
hten
stein
Mona
coAl
bani
aGr
eece
Mold
ova
Croa
tiaAn
dorra
San
Marin
oMa
ltaMa
cedo
nia
Bosn
ia/He
rzeg
ovin
aUk
rain
eRu
ssia
Belar
us
Support Index (Mean)
-100-80-60-40-20
020406080
100
Marsh
all Is
lands
Micro
nesia
, Au
strali
aJa
pan
New
Zeala
ndSo
uth K
orea
Samo
aSo
lomon
Islan
dsVa
nuatu Fij
iMo
ngoli
aPa
pua N
ewRu
ssia*
Nepa
lTh
ailan
dBh
utan
Singa
pore
Maldi
ves
Philip
pines
Camb
odia
Bang
lades
hSr
i Lan
kaBr
unei
Darus
salam
Malay
sia India
Laos
Indon
esia
Burm
aNo
rth K
orea
China
Vietna
m
UN score Important Votes (av. 90-08)

69
Figures A.7 and A.8 show scores for states in the greater Middle East and Africa, respectively. In the Middle East and Southwest Asia, only Israel and Georgia voted with the United States more than 50 percent of the time over the 1990–2008 period. No countries in Africa crossed the 50-percent threshold.
Figure A.6 United Nations Important Vote Score Averages in the Americas, 1990–2008
NOTE: St. Kitts and Nevis (1.8) is excluded because of the lack of sufficient usable years.
Figure A.7 United Nations Important Vote Score Averages in the Middle East and Southwest Asia,
1990–2008
NOTE: Turkmenistan (–27.7) is excluded because of the lack of sufficient usable years.
-100.0-80.0-60.0-40.0-20.0
0.020.040.060.080.0
100.0
Cana
daEl
Salv
ador
Arge
ntina
Cost
a Rica
Para
guay
Peru
Guat
emala
Urug
uay
Nica
ragu
aHo
ndur
asCh
ileBa
ham
asPa
nam
aDo
mini
can R
epub
licBo
livia
Gren
ada
Dom
inica
Beliz
eEc
uado
rSa
int V
incen
t Br
azil
Mexic
oHa
itiBa
rbad
osTr
inida
d and
Toba
goAn
tigua
Jam
aica
Colom
biaSa
int Lu
ciaSu
rinam
eGu
yana
Vene
zuela
Cuba
Support Index (Mean)
-100.0
-80.0
-60.0
-40.0
-20.0
0.0
20.0
40.0
60.0
80.0
100.0
Israe
lGe
orgia
Turke
yUz
bekis
tanCy
prus
Tajik
istan
Arme
niaKa
zakhs
tanKy
rgyzst
anAz
erbaij
anAfg
hanis
tanKu
wait
U.A.E.
Bahra
inQa
tarSa
udi A
rabia
Pakis
tanOm
anJo
rdan
Yeme
nLe
bano
nIra
nSy
ria Iraq
Support Index (Mean)
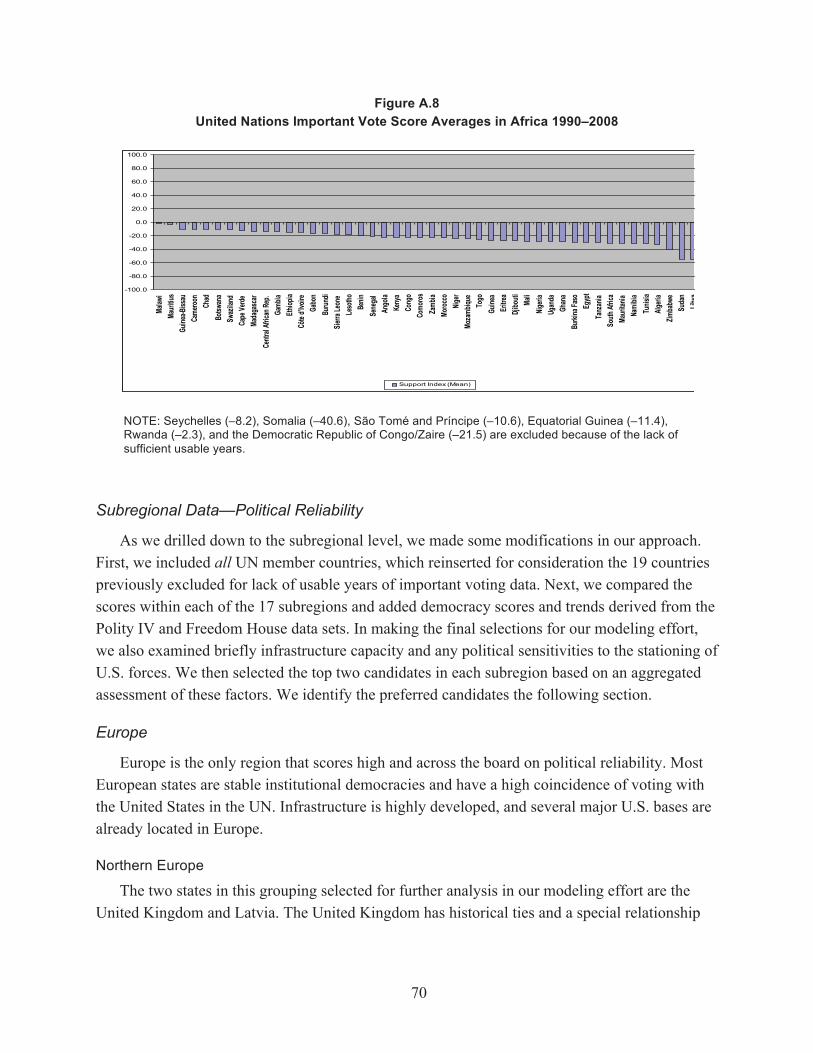
70
Figure A.8 United Nations Important Vote Score Averages in Africa 1990–2008
NOTE: Seychelles (–8.2), Somalia (–40.6), São Tomé and Príncipe (–10.6), Equatorial Guinea (–11.4), Rwanda (–2.3), and the Democratic Republic of Congo/Zaire (–21.5) are excluded because of the lack of sufficient usable years.
Subregional Data—Political Reliability
As we drilled down to the subregional level, we made some modifications in our approach. First, we included all UN member countries, which reinserted for consideration the 19 countries previously excluded for lack of usable years of important voting data. Next, we compared the scores within each of the 17 subregions and added democracy scores and trends derived from the Polity IV and Freedom House data sets. In making the final selections for our modeling effort, we also examined briefly infrastructure capacity and any political sensitivities to the stationing of U.S. forces. We then selected the top two candidates in each subregion based on an aggregated assessment of these factors. We identify the preferred candidates the following section.
Europe
Europe is the only region that scores high and across the board on political reliability. Most European states are stable institutional democracies and have a high coincidence of voting with the United States in the UN. Infrastructure is highly developed, and several major U.S. bases are already located in Europe.
Northern Europe
The two states in this grouping selected for further analysis in our modeling effort are the United Kingdom and Latvia. The United Kingdom has historical ties and a special relationship
-100.0
-80.0
-60.0
-40.0
-20.0
0.0
20.0
40.0
60.0
80.0
100.0Ma
lawi
Mauri
tius
Guine
a-Biss
auCa
meroo
nCh
adBo
tswan
aSw
azila
ndCa
pe Ve
rdeMa
daga
scar
Centr
al Afr
ican R
ep.
Gamb
iaEth
iopia
Côte
d’Ivo
ireGa
bon
Burun
diSie
rra Le
one
Leso
thoBe
ninSe
nega
lAn
gola
Keny
aCo
ngo
Como
rosZa
mbia
Moroc
coNig
erMo
zamb
ique
Togo
Guine
aEr
itrea
Djibo
uti Mali
Nigeri
aUg
anda
Ghan
aBu
rkina
Faso
Egyp
tTa
nzan
iaSo
uth Af
rica
Mauri
tania
Nami
biaTu
nisia
Algeri
aZim
babw
eSu
dan
Libya
Support Index (Mean)

71
Table A.1 Rankings Combining United Nations Important Votes and Democracy Trends—Northern Europe
State
Important Votes Plenary Votes Democracy UN
Scorea Post 9/11 Trend
UN Scorea
Post 9/11
Post 9/11 Trend Scorea Trend
United Kingdom 45.8 26.2 Neg. 31.3 10.4 Neg. 10 Stable Latvia 43.8 25 Neg. 13.3 –5.1 Neg. 8 Stable Estonia 43.5 24 Neg. 12 –8 Neg. 6 Stable Poland 42.6 26.4 Neg. 12.7 –4.6 Neg. 9.6 Stable Netherlands 42.2 24.7 Neg. 16.2 –6.6 Neg. 10 Stable Norway 41.8 23.7 Neg. 11.5 –8 Neg. 10 Stable Lithuania 41.3 22.9 Neg. 12.3 –7 Neg. 10 Stable Germany 41 22.9 Neg. 15.6 –7.1 Neg. 10 Stable Denmark 40.7 23.9 Neg. 11.9 –6.4 Neg. 10 Stable Iceland 40.5 23 Neg. 11.4 –7.7 Neg. (1.0 FH) Stable Belgium 39.3 22.7 Neg. 15.2 –6.9 Neg. 9.8 Stable Luxembourgb 39.2 21.9 Neg. 15.1 –7.2 Neg. (1.0 FH) Stable Finland 38.8 21.9 Neg. 10.6 –9.1 Neg. 10 Stable Czech Republicb 38.7 22.1 Neg. 13.2 –6.6 Neg. 9.6 Stable Ireland 37.3 22.3 Neg. 3.9 –14.3 Neg. 10 Stable Austria 37.1 22.6 Neg. 5.6 –11.9 Neg. 10 Stable Sweden 37.1 21.7 Neg. 5.3 –12.8 Neg. 10 Stable Slovak Republicb 35.5 21.6 Neg. 11.4 –8.3 Neg. 9.2 Stable Liechtensteina 33.8 20.1 Neg. 5.4 –12.6 Neg. (1.0 FH) Stable Switzerlandb, c 19.4 19.4 Stable –13.7 –13.7 Stable 10 Stable Russiad –5.9 –42.3 Neg. –16.7 –43.6 Neg. 6.2 Stable Belarusab –24.6 –69.2 Neg. –30.4 –59.2 Neg. –7 Stable
a Average 1990–2008. b Landlocked. c Insufficient UN voting data. d Included in our analysis of both Northern Europe and East Asia.
with the United States. It already hosts several U.S. military bases. Latvia is an alternative candidate, based primarily on the high UN important vote rankings shown in Table A.1. That said, a cluster of states—Estonia, Poland, Netherlands, Norway—has scores very close to Latvia’s, and any one of them might be a good candidate for basing. Germany, the current host of most of U.S. Army forces in Europe, is also close to the top. In this subgroup, Poland has the highest post-9/11 voting coincidence record on important votes. Political sensitivities vis-à-vis Russia may be an issue in terms of stationing of U.S. forces in Latvia or Estonia.
Southern Europe
The two states in this grouping selected for further analysis in our modeling effort are Romania and Italy (Table A.2). While Hungary has the highest UN score on important votes, it is

72
Table A.2 Rankings Combining United Nations Important Votes and Democracy Trends—Southern Europe
State
Important Votes Plenary Votes Democracy UN
Scorea Post 9/11 Trend
UN Scorea
UN Scorea
Post 9/11 Scorea Trend
Hungaryb 41.5 22.9 Neg. 13 –6.2 Neg. 10 Stable Romania 40.8 24.9 Neg. 11.1 –8 Neg. 8.4 Stable Italy 40.6 22.7 Neg. 13.9 –7.8 Neg. 10 Stable France 40.3 21.9 Neg. 23.1 5.6 Neg. 9 Stable Portugal 39.8 22.7 Neg. 11.5 –8.1 Neg. 10 Stable Bulgaria 38.2 22.9 Neg. 11.2 –7.3 Neg. 8.7 Stable Slovenia 37.3 22.9 Neg. 11.3 –7.3 Neg. 10 Stable Spain 36.6 22.7 Neg. 8.6 –7.7 Neg. 10 Stable Monaco 33.5 21 Neg. 16 –2.6 Neg. (1.5 FH) Stable Albania 33.4 26.8 Neg. 8.2 –0.2 Neg. 6.8 Stable Greece 32.7 21 Neg. 5.7 –8.5 Neg. 10 Stable Moldovab 32 18.9 Neg. 7.6 –11.3 Neg. 7.7 Stable Croatia 31.8 21.9 Neg. 7.9 –9.9 Neg. 6.3 Pos. Andorrab 29.8 21.7 Neg. 9.3 –9.8 Neg. (1.0 FH) Stable San Marinob 28.1 23.5 Neg. 1.6 –11.8 Neg. (1.0 FH) Stable Malta 26.8 9.7 Neg. –5 –16.4 Neg. (1.0 FH) Stable Macedoniab 24 21.9 Neg. –2.4 –9 Neg. 7.8 Stable Montenegroc 23.1 23.1 Stable –14.5 –14.5 Stable 8 Pos. Bosnia and Herzegovina 22.6 22.9 Pos. 0.3 –5.1 Neg. N/A N/A Ukraine 19.3 10.1 Neg. –11.9 –20.5 Neg. 6.4 Stable Serbia and Montenegroc 18 17.9 Stable –8.7 –8.6 Stable N/A N/A Serbiab, c 10.2 10.2 Stable –19.9 –19.9 Stable 8 Pos. a Average 1990–2008. b Landlocked. c Insufficient UN voting data.
landlocked. Romania ranked high in vote scores (40.8). Romania also hosts a U.S. FOS. Italy scored high and is the host to an extensive set of U.S. bases. Several states—France, Portugal, Bulgaria—have scores very close to those of Italy and Romania, and any one of them also might be a good candidate for basing of U.S. forces.
East Asia and the Western Pacific
The East Asia and the Western Pacific region varies greatly in terms of voting coincidence with the United States. We include the Pacific island states in our analysis for the sake of completeness, but many of these states are located far from any realistic contingencies for U.S. Army forces and are not viable candidates for basing considerations. We further took note of

73
existing security cooperation agreements with the United States when examining countries in South and Southeast Asia.
East Asia
The two states in this subgroup selected for further analysis in our modeling effort are Japan and South Korea (Table A.3). Both states stand out as suitable candidates because of their high UN important vote and democracy scores. Both are also close U.S. allies, and the United States already has an extensive basing presence in the two states. There are few alternatives to these choices. Mongolia’s geographic location as a landlocked country between Russia and China disqualifies it from consideration. We excluded Taiwan altogether from our analysis because it is not a UN member and because of the political sensitivities of stationing U.S. forces on a territory that China considers to be an integral part of the state.
Western Pacific
The two states in this subgroup selected for further analysis in our modeling effort are Australia and New Zealand (although only the former is a realistic candidate). We did not select the Marshall Islands and Micronesia, despite their special relationship with the United States (Free Compact of Association) and their strong support for U.S. in the UN (Table A.4), because of their small landmass, lack of adequate basing infrastructure (particularly airfields), and the fact that Guam, a U.S. territory, is located nearby and has the necessary infrastructure. Palau is another state linked to the United States by a Compact of Free Association. It lacks sufficient infrastructure, but its location on the western end of Micronesia may elevate it to being considered as a possible alternative basing site.
Table A.3 Rankings Combining United Nations Important Votes and Democracy Trends—East Asia
State
Important Votes Plenary Votes Democracy UN
Scorea Post 9/11 Trend
UN Scorea
UN Scorea
Post 9/11 Scorea Trend
Japan 40.1 24.9 Neg. 7.9 –10.6 Neg. 10 Stable South Korea 24.2 12.9 Neg. –4.1 –14.9 Neg. 8 Stable Mongoliab 3.4 –18 Neg. –36.5 –50.9 Neg. 10 Stable Russiac –5.9 –42.3 Neg. –16.7 –43.6 Neg. 6.2 Stable North Korea –49.9 –65.8 Neg. –61.2 –65.1 Neg. –9 Stable China –50.6 –72.9 Neg. –53.3 –63 Neg. –7 Stable a Average 1990–2008. b Landlocked. c Included in our analysis of both Northern Europe and East Asia.

74
Table A.4 Rankings Combining United Nations Important Votes and Democracy Trends—Western Pacific
State
Important Votes Plenary Votes Democracy UN
Scorea Post 9/11 Trend
UN Scorea
UN Scorea
Post 9/11 Scorea Trend
Marshall Islands 59.8 68 Pos. 28.4 37.1 Pos. (1.0 FH) Stable Palau 55.8 65.8 Pos. 32.9 41.1 Pos. (1.3 FH) Stable Micronesia 55.2 54.9 Neg. 32.4 40.6 Pos. (1.2 FH) Stable Australia 50 50.9 Pos. 14.3 10.6 Neg. 10 Stable New Zealand 35.7 21 Neg. 1 –16 Neg. 10 Stable Nauru 22 22.5 Pos. –5.8 –6.1 Neg. (1.6 FH) Stable Samoa 21.1 1.3 Neg. –17.8 –31 Neg. (2.0 FH) Stable Solomon Islands 14 –15.1 Neg. –22.1 –40.8 Neg. 8 Pos. Vanuatu 8.3 –0.4 Neg. –19.3 –17.3 Pos. (2.0 FH) Stable Fiji 6.3 –10.6 Neg. –27.4 –39.8 Neg. 3.6 Neg. Tuvalub 2.4 1.6 Neg. –17 –19.3 Neg. (1.0 FH) Stable Papua New Guinea 0.5 –10.4 Neg. –27.4 –30.9 Neg. 10 Stable Kiribatib 0.1 1.3 Pos. –0.1 0.1 Pos. (1.1 FH) Stable Tongab –9.7 –8.7 Pos. –22.3 –25.1 Neg. (3.8 FH) Stable a Average 1990–2008. b Insufficient UN voting data.
Southeast Asia
The two states in this subgroup selected for further analysis in our modeling effort are Thailand and Singapore. Although Table A.5 shows that Timor-Leste ranked the highest in the Southeast Asia subregion in terms of UN important votes and democracy scores, we filtered it out of the selection process because its voting record is incomplete; it lacks the infrastructure for purposes of basing U.S. Army forces; and the proximity of northern Australian bases decrease its attractiveness. Thailand has a stable security relationship with the United States. Singapore currently allows U.S. access to its territory as a logistics hub. That said, the scores of both states are in the negative range, and neither performs well on the democratic scale. The Philippines show similar characteristics and would be a backup choice.
South Asia
The state in this subgroup selected for further analysis in our modeling effort is Bangladesh. Selecting states in South Asia presented a series of challenges (Table A.6). The states with the highest UN scores, Nepal and Bhutan, fell off because they are landlocked and low on the democracy scores. The Maldives have a small landmass and lack adequate infrastructure. By process of elimination, we selected Bangladesh as the “best of the least” in the subregion. However, the realistic choice in this subregion is the existing facility at Diego Garcia.

75
Table A.5 Rankings Combining United Nations Important Votes and Democracy Trends—Southeast Asia
State
Important Votes Plenary Votes Democracy UN
Scorea Post 9/11 Trend
UN Scorea
UN Scorea
Post 9/11 Scorea Trend
Timor Lesteb 5.2 5.2 N/A –39.5 –39.5 N/A 6.5 Pos. Thailand –12.6 –36.2 Neg. –43.5 –56.9 Neg. 6.6 Neg. Singapore –13.1 –50.9 Neg. –40.4 –55.7 Neg. –2 Stable Philippines –22.9 –47.5 Neg. –45.4 –58.6 Neg. 8 Stable Cambodia –25.8 –56 Neg. –41.8 –61.8 Neg. 2 Stable Brunei Darussalam –36.2 –67 Neg. –48.6 –63.7 Neg. (5.8 FH) Stable Malaysia –39.9 –72.9 Neg. –49.8 –65 Neg. 3 Stable Laosc –42.4 –63.6 Neg. –55.9 –64.8 Neg. –7 Stable Indonesia –42.6 –73 Neg. –53.1 –66.3 Neg. 5.7 Pos. Vietnam –57.5 –76.9 Neg. –61.8 –71.4 Neg. –7 Stable a Average 1990–2008. b Insufficient UN voting data. c Landlocked.
Table A.6 Rankings Combining United Nations Important Votes and Democracy Trends—South Asia
State
Important Votes Plenary Votes Democracy UN
Scorea Post 9/11 Trend
UN Scorea
UN Scorea
Post 9/11 Scorea Trend
Nepalb –12.4 –48.2 Neg. –43 –58.6 Neg. 1.1 Neg. Bhutanb –13.1 –39.5 Neg. –39.8 –49 Neg. –8.8 Stable Maldives –18.7 –50 Neg. –42.6 –59 Neg. (5.5 FH) Stable Bangladesh –32.6 –64.3 Neg. –48.6 –64 Neg. 4.8 Neg. Sri Lanka –33.4 –63.4 Neg. –49 –62.7 Neg. 5.4 Stable India –40.2 –59.7 Neg. –52.5 –52.1 Pos. 9 Stable Burma –45.2 –72.2 Neg. –55.3 –66.5 Neg. –7.4 Stable a Average 1990–2008. b Landlocked.
Middle East and Southwest Asia
The Middle East and Southwest Asia region has few democracies and a generally low level of voting coincidence with the United States in the UN. That said, a number of states in this region have provided logistical and other basing support for U.S. forces operating in the region since 2001. We took this type of security cooperation, along with sensitivities to the Arab-Israeli conflict, into consideration when assessing viable candidates in this region.

76
Asia Minor and Caucasus
The states in this subgroup selected for further analysis in our modeling effort are Georgia and Cyprus. Both have positive UN vote scores and democratic credentials (Table A.7). The United Kingdom has a military base in Cyprus. Turkey’s post-9/11 UN score leads us to consider it an unsatisfactory choice in comparison with Georgia or Cyprus. Armenia is landlocked.
Middle East and Persian Gulf
The states in this subgroup selected for further analysis in our modeling effort are Kuwait and United Arab Emirates (UAE). Israel has by far the highest score but is unsuitable for basing purposes because of political sensitivities and the Israeli-Arab conflict. The two states selected, Kuwait and the UAE (Table A.8), are autocratic, and neither has been particularly supportive of the United States at the UN. However, they also have hosted U.S. forces on their territories and have supported the United States during security crises in the past. While the two states do not meet our criteria of political reliability, they are the “best of the least” in the subregion. Saudi Arabia, Bahrain, and Jordan are other alternatives.
Southwest and Central Asia
The states in this subgroup selected for further analysis in our modeling effort are Kazakhstan and Uzbekistan. Making selections was challenging because none of the states in this subregion fit our criteria for political reliability. Because central Asia is a deep inland region, we included landlocked states in our analysis. States in the subregion are autocracies and performed poorly in terms of their UN scores. Nevertheless, the region’s importance in terms of geographic proximity to potential security hot spots made it essential that we select the “best from the least” (Table A.9). Kazakhstan and Uzbekistan have been supportive of the United States during the Operation Enduring Freedom.
Table A.7 Rankings Combining United Nations Important Votes and Democracy Trends—
Asia Minor and Caucasus
State
Important Votes Plenary Votes Democracy UN
Scorea Post 9/11 Trend
UN Scorea
UN Scorea
Post 9/11 Scorea Trend
Georgia 30.7 15.6 Neg. 6.7 –11.4 Neg. 5.7 Stable Cyprus 14.3 4.9 Neg. –17 –18.3 Neg. 10 Stable Turkey 6.5 –22.4 Neg. –5.4 –23.5 Neg. 7 Stable Armeniab –9.8 –38.5 Neg. –18.8 –43.7 Neg. 5 Stable Azerbaijanb –28.1 –63.6 Neg. –30.7 –54.7 Neg. –7 Stable a Average 1990–2008. b Landlocked.

77
Table A.8 Rankings Combining United Nations Important Votes and Democracy Trends—
Middle East and Persian Gulf
State
Important Votes Plenary Votes Democracy UN
Scorea Post 9/11 Trend
UN Scorea
UN Scorea
Post 9/11 Scorea Trend
Israel 79.5 78 Neg. 64.2 61.2 Neg. 9.9 Stable Kuwait –16.2 –57.5 Neg. –44.4 –64.2 Neg. –7 Stable UAE –22.7 –59.8 Neg. –48.1 –67.1 Neg. –8 Stable Saudi Arabia –24.6 –60.9 Neg. –49.8 –66.8 Neg. –10 Stable Bahrain –26.4 –63.8 Neg. –48.3 –66.9 Neg. –7.7 Stable Jordan –30.3 –58.4 Neg. –50.9 –67.2 Neg. –2.1 Stable Qatar –32.3 –65.8 Neg. –49.3 –67 Neg. –10 Stable Oman –32.9 –71.8 Neg. –50.6 –69.3 Neg. –8.4 Stable Yemen –34.9 –64 Neg. –53.5 –68.1 Neg. –2 Stable Iraq –36.4 –35.3 Neg. –64.3 –65.6 Neg. N/A N/A Lebanon –37.9 –63.9 Neg. –55.3 –67.5 Neg. N/A N/A Syria –55.8 –77.7 Neg. –61 –71 Neg. –7.4 Stable a Average 1990–2008.
Table A.9 Rankings Combining United Nations Important Votes and Democracy Trends—
Southwest and Central Asia
State
Important Votes Plenary Votes Democracy UN
Scorea Post 9/11 Trend
UN Scorea
UN Scorea
Post 9/11 Scorea Trend
Kazakhstanb –3.4 –39.5 Neg. –20.3 –49.7 Neg. –5.2 Stable Uzbekistanb –4 –42.7 Neg. –9.6 –35.5 Neg. –9 Stable Kyrgyzstanb –15.5 –50.6 Neg. –25.4 –54.3 Neg. –1.1 Stable Tajikistanb –17 –46 Neg. –18.6 –44.9 Neg. –2 Stable Afghanistanb –26.7 –49.5 Neg. –40.9 –51.8 Neg. N/A N/A Turkmenistanb, c –27.7 –48.4 Neg. –18.7 –44.3 Neg. –9 Stable Pakistan –39.3 –66.1 Neg. –50 –58.6 Neg. –3.4 Stable Iran –48.7 –72.1 Neg. –55.4 –67.9 Neg. –0.6 Neg a Average 1990–2008. b Landlocked. c Insufficient UN voting data.
Americas
States in the Americas generally fit our criteria for political reliability. Most of them are willing to support the United States in the UN on important votes. Almost all are democratic. The infrastructure in the region is adequate to support U.S. military basing. The United States

78
has access to several military facilities in Central and South America through cooperative security agreements in place to combat the drug trade in the region. Because of the close proximity of most of the region to the United States, the 2010 QDR states that there is no need to establish new U.S. bases in the region. For purposes of a global basing system, we include the Americas in our analysis.69
South America
The states in this subgroup selected for further analysis in our modeling effort are Argentina and Peru. We excluded Paraguay because it is landlocked (Table A.10). Uruguay and Chile are viable alternatives to our choices.
The Caribbean
The states in this subgroup selected for further analysis in our modeling effort are the Bahamas and the Dominican Republic, although we do not see a rationale to establish Army bases in such close proximity to the United States or its possessions. There are many viable backups to our choices (Table A.11).
Table A.10 Rankings Combining United Nations Important Votes and Democracy Trends—South America
State
Important Votes Plenary Votes Democracy UN
Scorea Post 9/11 Trend
UN Scorea
UN Scorea
Post 9/11 Scorea Trend
Argentina 17.8 –14.2 Neg. –18.6 –42.1 Neg. 7.9 Stable Paraguayb 15 –14.1 Neg. –31.2 –46 Neg. 7.4 Stable Peru 13 –0.6 Neg. –34.3 –45 Neg. 7 Stable Uruguay 12.6 –15.1 Neg. –30.9 –48.2 Neg. 10 Stable Chile 8.7 –19.3 Neg. –33 –45.8 Neg. 9 Stable Boliviab 2.4 –30.6 Neg. –36.6 –53.1 Neg. 8.5 Stable Ecuador 0.3 –32.2 Neg. –40.3 –56.1 Neg. 6.6 Stable Brazil –1.6 –36.3 Neg. –38.8 –52.6 Neg. 8 Stable Colombia –10.2 –29.5 Neg. –43.9 –56.1 Neg. 7 Stable Suriname –10.3 –45 Neg. –37.9 –52.3 Neg. (2.5 FH) Stable Guyana –10.3 –44.2 Neg. –42.2 –57.5 Neg. 6 Stable Venezuela –20.3 –67.7 Neg. –46 –66.1 Neg. 6.2 Stable a Average 1990–2008. b Landlocked.
69 DoD, 2010.

79
Table A.11 Rankings Combining United Nations Important Votes and Democracy Trends—Caribbean
State
Important Votes Plenary Votes Democracy UN
Scorea Post 9/11 Trend
UN Scorea
UN Scorea
Post 9/11 Scorea Trend
Bahamas 7.2 –19.8 Neg. –35.3 –51.1 Neg. (1.3 FH) Stable Dominican Republic 3.4 –20.7 Neg. –27.2 –49.5 Neg. 8 Stable Grenada 2.2 –20.4 Neg. –29.9 –45.8 Neg. (1.5 FH) Stable Dominica 1.9 –32.3 Neg. –24.2 –39.8 Neg. (1.1 FH) Stable Saint Kittsb 1.8 –14.6 Neg. –14 –14.5 Neg. (1.4 FH) Stable Saint Vincent and the Grenadines 0.3 –29.6 Neg. –28.1 –44.6 Neg. (1.5 FH) Stable Haiti –3.8 –34.9 Neg. –38 –51.9 Neg. 5 Stable Barbados –4 –44.6 Neg. –38.4 –57.7 Neg. (1.0 FH) Stable Trinidad and Tobago –4.4 –35.9 Neg. –39.1 –54.8 Neg. 10 Stable Antigua and Barbuda –6.6 –41 Neg. –37.9 –54.7 Neg. (2.9 FH) Stable Jamaica –8.4 –47.1 Neg. –39.5 –57.6 Neg. 9 Stable Saint Lucia –10.3 –47.9 Neg. –40.9 –57.5 Neg. (1.4 FH) Stable Cuba –60.2 –79.1 Neg. –63.8 –71.2 Neg. –7 Stable a Average 1990–2008. b Insufficient UN voting data.
Central America
The states in this subgroup selected for further analysis in our modeling effort are El Salvador and Costa Rica. Both have high UN scores and democratic credentials (Table A.12). For lack of other suitable subregions, we included data for Canada with countries in this subregion.
Africa
Africa was a particularly problematic region in which to identify candidates for further analysis. Not a single country scored above the 50-percent threshold on important votes. The “best of the least” were either landlocked (Botswana, Swaziland) or were on the periphery of the region and offered little value over existing facilities (Mauritius vis-à-vis Diego Garcia). Given the range of missions that might be assigned to U.S. forces in Africa, the political reliability scores may have more value in shaping choices for security cooperation.
Northern Africa
The states in this subgroup selected for further analysis in our modeling effort are Morocco and Tunisia. Morocco had the highest UN important vote score (Table A.13). Egypt ranked

80
Table A.12 Rankings Combining United Nations Important Votes and Democracy Trends—Central America
State
Important Votes Plenary Votes Democracy UN
Scorea Post 9/11 Trend
UN Scorea
UN Scorea
Post 9/11 Scorea Trend
El Salvador 21.7 1.3 Neg. –30.6 –43.5 Neg. 7 Stable Costa Rica 16 –14.5 Neg. –28.5 –47.1 Neg. 10 Stable Guatemala 12.8 –4 Neg. –30.9 –43.7 Neg. 8 Stable Nicaragua 11.4 –12.8 Neg. –32.3 –45.4 Neg. 8.1 Stable Honduras 10 –8.5 Neg. –31.8 –42.7 Neg. 6.9 Stable Panama 7.1 –18.7 Neg. –30.5 –50.6 Neg. 9 Stable Belize 0.3 –27.1 Neg. –38 –54.6 Neg. (1.2 FH) Stable Mexico –1.8 –18.7 Neg. –42.5 –51.3 Neg. 7.6 Stable Canada 51.2 47.1 Neg. 18.1 4.4 Neg. 10 Stable a Average 1990–2008.
Table A.13 Rankings Combining United Nations Important Votes and Democracy Trends—Northern Africa
State
Important Votes Plenary Votes Democracy UN
Scorea Post 9/11 Trend
UN Scorea
UN Scorea
Post 9/11 Scorea Trend
Morocco –23.1 –55.6 Neg. –46.6 –65.9 Neg. –6 Stable Egypt –29.4 –73.2 Neg. –52.1 –69.6 Neg. –5.1 Stable Tunisia –31.4 –66.9 Neg. –51.2 –68.8 Neg. –3.6 Stable Algeria –33.4 –74.9 Neg. –54.9 –71.5 Neg. –1 Stable Libya –55 –75.9 Neg. –59.9 –70.8 Neg. –7 Stable a Average 1990–2008.
slightly higher than Tunisia, but the latter has a less authoritarian regime, a better average democracy score, and slightly better post-9/11 UN scores. That said, Egypt is a viable alternative.70
Southern Africa
The states in this subgroup selected for further analysis in our modeling effort are Madagascar and Angola. Neither state is high on the list based on the UN scores, but geography imposes constraints on our choices (Table A.14). We excluded Malawi because it is landlocked. Botswana and Mauritius are strong, stable democracies, but the former is landlocked and the latter is far from the mainland and does not offer many advantages over Diego Garcia. Swaziland and Lesotho are also landlocked, and the former is the least democratic state in the region. 70 Note that these calculations were completed prior to the tumultuous Arab Spring, which has led to significant instability and uncertainty with respect to Egypt’s future political landscape. The framework we have applied in this study does not reflect current realities in the region.

81
Table A.14 Rankings Combining United Nations Important Votes and Democracy Trends—Southern Asia
State
Important Votes Plenary Votes Democracy UN
Scorea Post 9/11 Trend
UN Scorea
UN Scorea
Post 9/11 Scorea Trend
Malawib –1.8 –25.5 Neg. –28.9 –42 Neg. 5.5 Stable Mauritius –4.1 –42 Neg. –39.3 –54.1 Neg. 10 Stable Botswanab –10.1 –40.7 Neg. –40.3 –51.9 Neg. 9 Stable Swazilandb –11.4 –42.7 Neg. –33.9 –45.1 Neg. –9 Stable Madagascar –13.9 –28.4 Neg. –35.2 –45.5 Neg. 7 Stable Lesothob –18.2 –44.7 Neg. –34.4 –55.2 Neg. 6 Stable Angola –21.6 –44.2 Neg. –37.3 –44.7 Neg. –2.4 Stable Comoros –22.5 –53.3 Neg. –42.4 –58.5 Neg. 3.9 Pos. Zambiab –22.8 –54.6 Neg. –42.9 –62.7 Neg. 3.8 Stable Mozambique –24.6 –55.2 Neg. –42.7 –58.4 Neg. 6 Stable South Africa –30.5 –66.4 Neg. –37.6 –62.6 Neg. 9 Stable Namibia –31.4 –56.3 Neg. –46.9 –61.1 Neg. 6 Stable Zimbabweb –40.7 –67 Neg. –48.8 –60.7 Neg. –4 Stable a Average 1990–2008. b Landlocked.
Eastern Africa
The states in this subgroup selected for further analysis in our modeling effort are Kenya and Tanzania. Our choices for eastern Africa (Table A.15) were constrained in the same manner as those for southern Africa. The small landmass and distant location of the Seychelles from the mainland offered little benefit over Diego Garcia. Ethiopia and Uganda are landlocked. We deferred on Eritrea because of its low democracy scores. We consider Djibouti in our analysis because it has an existing U.S. military facility at Camp Lemonier. Thus, Kenya and Tanzania emerge as the “best of the least” choices in the subregion.
Western Africa
The states in this subgroup selected for further analysis in our modeling effort are Liberia and Guinea-Bissau. The two states ranked highest on the UN scores (Table A.16). Although the data for it was incomplete, São Tomé and Príncipe was a close runner-up and may be a viable alternative, especially if a base closer to central Africa were needed. Given the endemic political instability in the subregion, democracy scores might be a more important indicator of political reliability. Under these criteria, Senegal, Benin, and Ghana emerge as alternative choices.

82
Table A.15 Rankings Combining United Nations Important Votes and Democracy Trends—Eastern Africa
State
Important Votes Plenary Votes Democracy UN
Scorea Post 9/11 Trend
UN Scorea
UN Scorea
Post 9/11 Scorea Trend
Seychelles** –8.2 –18.7 Neg. –20.2 –20.1 Pos. (3.5 FH) Stable Ethiopiab –14.3 –41.2 Neg. –40.6 –54.4 Neg. 1 Stable Kenya –21.7 –44.2 Neg. –40.1 –53.7 Neg. 3.9 Pos. Eritrea –27.2 –48.8 Neg. –38.7 –60.6 Neg. –6.7 Stable Djibouti –27.6 –64.2 Neg. –49 –66.9 Neg. 1.2 Stable Ugandab –28.1 –43.6 Neg. –38.3 –45 Neg. –3.1 Stable Tanzania –30 –42.1 Neg. –47.5 –56.4 Neg. 0.6 Stable Somaliac –40.6 –44.1 Neg. –48.6 –44.4 Pos. 0 Stable Sudan –54.4 –74.7 Neg. –57.3 –69.2 Neg. –5.8 Stable a Average 1990–2008. b Landlocked. c Insufficient UN voting data.
Table A.16 Rankings Combining United Nations Important Votes and Democracy Trends—Northern Africa
State
Important Votes Plenary Votes Democracy UN
Scorea Post 9/11 Trend
UN Scorea
UN Scorea
Post 9/11 Scorea Trend
Liberia –5.2 –18.8 Neg. –27.9 –39.1 Neg. 2.1 Pos. Guinea–Bissau –9.7 –27.8 Neg. –35.4 –39 Neg. 3.4 Stable São Tomé and Príncipeb –10.6 –22.8 Neg. –32.5 –33.7 Neg. (1.9 FH) Stable Equatorial Guineab –11.4 –14.7 Neg. –13.3 –20.8 Neg. –5 Stable Cape Verde –12.8 –39.5 Neg. –42.2 –57 Neg. (1.6 FH) Stable Gambia –14.1 –39.2 Neg. –32.2 –39.9 Neg. –5 Stable Côte d’Ivoire –14.4 –41.7 Neg. –36.1 –49.3 Neg. 0.1 Stable Sierra Leone –17.6 –41.9 Neg. –35.8 –43.7 Neg. 3.4 Pos. Benin –19.7 –49.8 Neg. –40.8 –52.8 Neg. 6.2 Stable Senegal –20.4 –62.4 Neg. –44.3 –62.4 Neg. 6.2 Stable Nigerc –23.5 –52.3 Neg. –46.3 –61.1 Neg. 4.3 Stable Togo –24.9 –60.4 Neg. –46.4 –61.7 Neg. –2.6 Stable Guinea –26.8 –63 Neg. –43.7 –57.8 Neg. –1 Stable Malic –27.9 –59.1 Neg. –47.1 –62.8 Neg. 6 Stable Nigeria –28 –47.5 Neg. –46.5 –57.9 Neg. 3.5 Stable Ghana –28.8 –46.9 Neg. –46.6 –58 Neg. 5.6 Pos. Burkina Fasoc –29.3 –53.2 Neg. –47.4 –61 Neg. –1.1 Stable Mauritania –30.8 –61.1 Neg. –49.3 –62.7 Neg. –4.6 Pos. a Average 1990–2008. c Insufficient UN voting data. b Landlocked.

83
Central Africa
The states in this subgroup selected for further analysis in our modeling effort are Cameroon and Gabon. Many countries in this region are landlocked, including Rwanda, which had the highest UN score, although one based on limited voting data (Table A.17). None of the choices rate high on our criteria of political reliability.
Table A.17 Rankings Combining United Nations Important Votes and Democracy Trends—Central Africa
State
Important Votes Plenary Votes Democracy UN
Scorea Post 9/11 Trend
UN Scorea
UN Scorea
Post 9/11 Scorea Trend
Rwandab, c –2.3 –23.3 Neg. –23.5 –34.6 Neg. –3.9 Stable Cameroon –9.9 –25.6 Neg. –34.4 –39.6 Neg. –4 Stable Chadb –10 –16.7 Neg. –28.2 –16.4 Pos. –2 Stable Central African Republicb –13.9 –38.9 Neg. –41 –51.3 Neg. 2 Stable Gabon –16.8 –46 Neg. –40.8 –51.8 Neg. –4 Stable Burundib –16.9 –23.7 Neg. –38.9 –49 Neg. 2.5 Pos. Democratic Republic of the Congo/Zairec –21.5 –35.4 Neg. –20 –25.4 Neg. 1.8 Pos. Congo –21.8 –54.3 Neg. –38.2 –54.9 Neg. –4.7 Stable a Average 1990–2008. b Landlocked. c Insufficient UN voting data.


85
Appendix B. Force Packages and Potential Base Locations
This appendix describes our approach and data sources for calculating the lift requirements of the force packages for each of the short-warning missions. The appendix also provides the details on the specific base locations used in our modeling effort.
Scenario Force Packages
One of the key inputs into GPM is the number of C-17 sorties necessary to deploy the required amount of equipment, personnel, and supplies for a given mission. To address this requirement, we created four notional task forces. These task forces represent the initial time-sensitive force requirements for the deterrence mission, the response to a state failure mission, the humanitarian relief operations mission, and the counterterrorist operations mission. Force packages were not developed for the steady-state operations or support to ongoing operations missions because neither of these missions is time sensitive or depends on force deployments. As a result, they are thus not amenable to GPM analysis.
The task forces represent generic force packages that include the kinds of military capabilities that would be initially deployed to execute each of the four basic mission types. This is a simplifying assumption because, in reality, such force packages would be tailored for the specific contingency. The deterrence task force is built around an SBCT and is intended to provide an on-the-ground presence that balances speed of response with credible combat capability. It includes attack aviation, air and missile defense elements, long-range rocket artillery, combat engineers, and logistics support elements. The state failure task force is built around an IBCT with mobility enhancements and is intended provide an initial stabilization capability and to enable the follow-on deployment of a larger stabilization force package.71 It includes both combat and construction engineers, military police, civil affairs personnel, and port opening elements. The humanitarian relief operation task force is based on an MEB that has been tailored to provide humanitarian assistance. It includes a rifle battalion, civil affairs personnel, engineer assets, transportation assets, logistics assets, and medical assets. Finally, the counterterrorism task force is built around a ranger company and is intended for quick strikes against high-value terrorist assets.
71 The mobility augmentation package consists of 198 M1114/M1151A1 up-armored HMMWVs. These vehicles provide organic mobility assets to each of the IBCT’s infantry battalions and to its dismounted scout squadron. The HMMWVs are allocated on the basis of three per infantry squad or dismounted scout section plus one per infantry platoon headquarters. These additions are offset by the elimination of the truck squads in the brigade’s infantry battalion forward support companies. This leads to a net increase of 21 C-17 sorties. RAND correspondence with the Transportation Engineering Agency, July 9, 2009.

86
The total number of C-17s required to move a force package consists of three subcomponents: the number required to move the unit’s equipment, the number required to move the unit’s residual passengers, and the number required to move three days’ worth of accompanying supplies. These requirements are summarized in Table B.1.
The data for the unit lift characteristics was provided by the TEA at the Military Surface Deployment and Distribution Command (SDDC) as was the number of C-17s required to move the various components of each of the task forces.72 The number of C-17 sorties required was calculated by the TEA using the Transportability Analysis Report Generator (TARGET) model using an allowable cabin load (ACL) of 130,000 pounds for a 3,200 nautical mile (nm) critical leg.73 The number of C-17s required to move the residual passengers is calculated based on 101 soldiers per C-17 for a 3,200 nm critical leg.74 Each task force is also assumed to deploy with three days’ worth of accompanying supplies. For the state failure, humanitarian relief operation, and counterterrorism task forces this supply requirement was based on 466.67 pounds of general supplies (Class I, III, II, IV, VI, VIII, and IX) and 22.41 pounds of ammunition (class V) per soldier.75 For the deterrence task force the ammunition planning factor was increased to 112.9 pounds per soldiers because of the possibility that it may have to engage in defensive combat operations.76 The number of C-17 sorties required to move the accompanying supplies is based on a maximum of 18 463L pallets per C-17 for lower density supplies, general supplies,
72 RAND correspondence with TEA, various dates. 73 Air Force Pamphlet (AFPAM) 10-1403, Air Mobility Planning Factors, Headquarters Air Mobility Command, December 2003, p. 12. 74 The TARGET model will load passengers onto a C-17 if space is available after unit equipment has been loaded; residual passengers are those who cannot accompany the unit equipment. Transportation Engineering Agency, Deployment Planning Guide: Transportation Assets Required for Deployment, Newport News, Va.: Military Traffic Management Command, Pamphlet 700-5, May 2001, p. 5. A C-17 can carry 101 passengers over a 3,200 nm critical leg. For simplicity, we have assumed that the deployment mission will be conducted entirely by C-17s. However, the total number of sorties would be reduced slightly if residual passengers were moved by Civilian Reserve Air Fleet B-757s or B-767s. These aircraft ,which can carry, respectively, 125 and 190 passengers, are able to operate from the airfields selected for our scenarios. AFPAM 10-1403, 2003, p. 12. 75 These are TARGET’s default supply factors for three days of supplies and an average consumption rate in a temperate climate. RAND correspondence with TEA, August 27, 2009. 76 The 112.9 pound figure is derived from Class V consumption data during defensive operations for the SBCT, attack/recon helicopter battalion, HIMARS battalion, Patriot battalion, combat engineer battalion, and HBCT brigade support battalion found in U.S. Army Command and General Staff College’s Combat Service Support Battle Book. If the data for a given unit in the deterrence task force was not available in the battle book, it was derived by calculating the daily class V consumption rate per soldier of a similar unit type. U.S. Army Command and General Staff College, Combat Service Support Battle Book, Fort Leavenworth, Kan., ST 101-6, July 2007, pp. 4–5 to 4–6, 4–9 to 4–10.

87
Table B.1 Force Package Lift Characteristics
Task Force Package
Unit Lift Characteristics C-17 Sorties
Personnel Square
Feet Short Tons Vehicles
Residual Passengers
Supplies (short tons)
Unit Equipment Passengers Supplies Total
Deterrence 6,431 599,088.5 31,144.9 2,806 3,527 1,864 627 18.5 37.7 684 State Failure 5,077 439,193.3 22,452.1 2,674 2,776 1,242 484 12.3 26.1 523 Humanitarian 2,085 206,878.8 9,220.5 1,119 985 510 230 5.0 10.7 246 Counterterrorism 228 28,394.9 827.5 91 68 56 36 0.6 1.2 38 SOURCE: RAND assessment based on data provided by the Army’s Surface Deployment and Distribution Command, Transportation Engineering Agency (SDDC/TEA). NOTE: The total number of C-17 sorties has been rounded up.

88
and an ACL of 130,000 pounds of class V supplies.77 When combined and rounded up, these three lift requirements provide the total number of C-17 sorties required to move a given force package.
Closure Time One of the key data inputs that the GPM needs to optimize a basing network is the amount of
time it will take for a given set of bases to move a force package from its home station to its potential area of operations. Several underlying data requirements are necessary to generate this broader input. These inputs include the starting location (base), the port of embarkation for the task force, the port of debarkation, and the final destination of the task force. These basic geographic locations, when coupled with the distance between the points and the rate of travel, allow a basic calculation of closure time. In addition, this calculation is critically influenced by such other factors as the throughput capacity of the ports of embarkation and debarkation and the availability and capacity of lift assets. These inputs will be discussed in the following sections of this chapter.
Existing Bases
The selection criteria for candidate countries for new bases is discussed in Appendix A. This appendix examines existing U.S. bases or locations of military basing facilities where the United States has access that were selected for inclusion in the GPM analysis. The purpose of identifying existing U.S. bases or access arrangements was to create a baseline against which to evaluate the utility of placing bases in our candidate countries and to estimate the utility of the current basing infrastructure. In identifying current bases or access arrangements, no attempt was made to be inclusive of all U.S. bases; rather, the intent was to select representative bases in key countries that both could be and are being used for deployment operations and that could serve as the starting point for deployment operations. The identity of the actual base was less important than its general location. While it was not critical that these bases currently have a significant U.S. Army presence, we did focus on locations that currently or in the near future will have prepositioned combat sets, are the home station for an IBCT or an SBCT, or have other
77 Included in this calculation is the weight of the 463L pallets required to load the supplies. According to data available in FM 55-15, class V supplies have an average density of 19.72 pounds per cubic foot, and general supplies have a weighted average density of 10.78 pounds per cubic foot. A 463L pallet has a maximum load capacity of 10,000 pounds (5.0 short tons) and usable volume of 485 ft3. As a result, general cargo tends to exceed the volume capacity of a pallet before it reaches its maximum carrying capacity. Conversely, the denser class V supplies, while not exceeding a pallet’s weight limits, exceed the ACL of the C-17 if fully loaded. Eighteen 463L pallets of class V supplies have a combined weight of 89.4 short tons, while a similar number of pallets with general supplies have an overall weight of 50.4 short tons. FM 55-9 C1, Unit Air Movement Planning, Washington, D.C.: Headquarters, Department of the Army, October 1994, pp. D-1; FM 55-15, Transportation Reference Data, Washington, D.C.: Headquarters, Department of the Army, October 1997, pp. 2–26, C–1, C–2.

89
important combat assets.78 We also identified several joint bases that the U.S. Army does not currently use but that would be useful candidates for future basing considerations. These base choices are listed below in Table B.2.
Selection of Aerial Ports of Embarkation and Sea Ports of Embarkation
Each identified base or potential base must have an associated APOE and SPOE so that the time required to conduct strategic port-to-port movement can determined. In the case of installations on the U.S. mainland, the APOE and SPOE are the airfields and ports associated with the installation.79 For other U.S. military installations, the APOE and SPOE are the airfields and ports that are either closest to the installation, are habitually associated with it for deployment purposes, are part of the USAF en route system, or have an existing U.S. presence. The existing deployment infrastructure used by GPM is identified below in Table B.3.
Table B.2 Existing U.S. Bases or Access Arrangements (GPM Inputs)
U.S. Territory Overseas Joint Fort Drum, New York Fort Lewis, Washington Fort Richardson, Alaska Fort Stewart, Georgia Schofield Barracks, Hawaii Fort Allen, Puerto Rico Barrigada Complex, Guam
Bezmer AB, Bulgaria Camp As Sayliyah, Qatar Camp Arifjan, Kuwait Camp Casey, South Korea Camp Carroll, South Korea Camp Darby, Italy Camp Lemonier, Djibouti Camp Zama, Japan Caserma Ederle, Italy Coronel Enrique Soto Cano AB, Honduras Diego Garcia, BIOT Mihail Kogalniceanu AB, Romania Rose Barracks, Germany Torii Station, Japan
Al Dhafra AB, UAE Incirlik AB, Turkey NAS Sigonella, Italy NS Rota/Moron AB Complex, Spain NSA Souda Bay, Greece Thumrait AB, Oman
NOTE: We used only one base in Germany. Addition of bases at Schweinfurt and Baumholder would not materially alter our GPM analysis. SOURCE: Inclusion for GPM analysis based on RAND assessment presented earlier.
78 Information on planned prepositioning sites was derived from U.S. Army Sustainment Command, “Worldwide APS Conference,” PowerPoint briefing, March 2009. Another important source of information was Department of Defense, Base Structure Report, Fiscal Year 2009 Baseline (A Summary of DoD’s Real Property Inventory), Washington, D.C.: Office of the Deputy Under Secretary of Defense (Installations and Environment), 2009 79 TEA, Logistics Handbook for Strategic Mobility Planning, Newport News, Va.: Military Traffic Management Command, Pamphlet 700-2, September 2002, pp. 11-13.

90
Table B.3 APOEs and SPOEs for Existing Bases or Access Arrangements
Base APOE SPOE Fort Drum, New York Wheeler Sack AAF Port of New York/New Jersey Fort Stewart, Georgia Hunter AAF Port of Savannah, Georgia Fort Lewis, Washington McChord AFB Port of Tacoma, Washington Fort Richardson, Alaska Elmendorf AFB Port of Anchorage Schofield Barracks, Hawaii Hickam AFB Pearl Harbor Fort Allen, Puerto Rico Luis Munoz Marin IAP Roosevelt Roads Barrigada Complex, Guam Andersen AFB Apra Harbor Rose Barracks, Germany Ramstein AB Bremerhaven Caserma Ederle, Italy Aviono AB Livorno Camp Darby, Italy Galileo Gallilei IAP Livorno Camp Casey, Korea Osab AB Pusan Camp Carroll, Korea Daegu AB Pusan Camp Zama, Japan Atsugi NAF Yokohama Torii Station, Japan Kadena AB Naha Port Coronel Enrique Soto Cano AB, Comayagua, Honduras
Coronel Enrique Soto Cano AB Puerto Cortes
Camp Lemonier, Djibouti Djibouti Ambouli IAP Djibouti Camp Arifjan, Kuwait Ali Al Salem AB Shuaiba Camp As Sayliyah, Qatar Al Udeid AB Doha Diego Garcia, BIOT Diego Garcia NSF Diego Garcia Bezmer AB, Bulgaria Bezmer Varna Mihail Kogalniceanu, Romania Mihail Kogalniceanu Constanta Rota NS, Spain Rota NS Rota NS Sigonella, Italy Sigonella Augusta Souda, Greece Souda Souda Bay (Naval Piers) Incirlik AB, Turkey Incirlik AB Mersin Thumrait, Oman Thumrait Raysut
SOURCE: RAND assessment, based on criteria outlined in the text. For the candidate countries, the primary APOE selection criteria were that the airfield be
suitable for C-17 operations and that its primary runway be 9,000 feet long.80 An effort was also made to select airfields that were already used by the host state’s military. The actual throughput and operational capabilities of these airfields was not determined because we assumed that, if a base was placed in the candidate country, the necessary infrastructure improvements would be made. While we selected SPOEs based primarily on proximity to the APOE, we also made an effort to select ports that had berths that could accommodate U.S. LMSRs.81 As with the APOE,
80 The critical field length (standard day) for a fully loaded C-17 is about 9,000 feet for an airfield with a pressure altitude of 4,000 feet. It is shorter for airfields at lower altitudes. McDonnell Douglas, C-17 Globemaster III: Technical Description and Planning Guide, August 1996, p. VIII-6. Airfield suitability information can be found in Headquarters AMC, Airfield Suitability and Restrictions Report (ASRR), June 2009. 81 The preferred berth characteristics for a fully loaded Watson class LMSR are a length of 1,050 feet and a depth of 35.5 feet.

91
we assumed that necessary infrastructure improvements would accompany the selection of the country as a site for a U.S. base. The APOEs and SPOEs used for the project’s GPM analysis are listed in Table B.4.
Contingency APOD/SPOD Selection
There are two primary criteria for the selection of an APOD in a contingency country. First, it needs to have a runway with a length of at least 6,000 feet that is strong enough to handle a
Table B.4 APOEs and SPOEs in the Candidate Countries
Base APOE SPOE Angola Aeroporto 4 de Fevereiro
(Luanda) Luanda
Argentina Ministro Pistarini IAP Buenos Aires Australia Darwin IAP Darwin Bahamas Grand Bahama IAP Freeport Bangladesh Shah Amanat IAP Chittagong Cameroon Douala AB Douala Costa Rica Juan Santamaria IAP Puerto Moin Cyprus Akrotiri AB Limassol Dominican Republic Gregorio Luperon IAP Caucedo El Salvador El Salvador IAP Acajutla Gabon Leon M’Ba Port Gentil Georgia Lochini (Novo Alexeyevka) Poti Guinea-Bissau Oswaldo Vieira IAP Bissau Kazakhstan Almati N/A Kenya Jomo Kenyatta IAP Mombasa Latvia Riga IAP Riga Terminal Liberia Monrovia Roberts IAP Monrovia Madagascar Ivato Toamasina Morocco Menara Casablanca New Zealand Auckland IAP Auckland Peru Lima-Callao AB/Jorez Javez IAP Callao Singapore Changi IAP Pasir Panjang Terminal Tanzania Julius K. Nyerere IAP Dar Es Salaam Thailand U Taphao IAP Tung Prong NS Tunisia Sidi Ahmed AB Sfax United Arab Emirates Al Dhafra AB Jebel Ali United Kingdom RAF Mildenhall Felixstowe Uzbekistan Uzhny N/A
SOURCE: RAND assessment, based on criteria outlined in the text. NOTE: We did not identify an SPOE for either Kazakhstan or Uzbekistan because they are located deep inland on the Asian continent.

92
C-17 with a landing weight of 432,500 pounds.82 Second, airfield needed to be rated as suitable for C-17 operations in AMC’s ASRR. When multiple airfields within the country met these criteria, the actual selection was based on a subjective determination of where a contingency might occur within the country. The contingency airfields selected for the GPM analysis are listed in Table B.5.
One final critical input for GPM was the throughput of the APOD; this can set a critical minimum limit on deployment closure time. Airfield throughput is determined by the maximum number of C-17s that can simultaneously be on the ground at the airfield (MOG).83 The effects of an airfield’s MOG on the closure time for the scenario force packages are illustrated below in Figure B.1.
The primary sources used to determine an airfield’s MOG were the Tanker Airlift Control Center planners’ reports AMC prepares for many of the world’s airfields. These reports often
Table B.5 Contingency APODs
Scenario Type Country APOD ICAO Deterrence Estonia Ulemiste EETN
Georgia Lochini (Novo Alexeyevka) UGTB Republic of Korea Daegu AB RKTN Azerbaijan Heydar Aliyev IAP UBBB Kuwait Kuwait IAP OKBK Taiwan Hualien AB RCYU
State Failure Nigeria Mallam Aminu IAP DNKN Liberia Roberts Field GLRB Sudan El Fashir HSFS Chad Faya Largeau FTTY Zimbabwe Harare IAP FVHA Yemen Aden IAP OYAA Pakistan Masroor OPMR Bangladesh Shah Amanat IAP VGEG Indonesia Polonia WIMM Cuba Guantanamo Bay NS MUGM Panama Howard AFB MPHO Bolivia Jorge Wilsterman IAP SLCB
82 This 6,000 foot length is the approximate critical runway length (tropical day) for a C-17 with a full fuel load from an airfield at a 6,000-foot pressure altitude. We used tropical day requirements to err on the conservative side of what might be needed. The strength requirement is for a triple tandem landing gear weight-bearing capacity of 432,500 pounds. This is based on the landing weight of a C-17 with 130,000 pounds of cargo and 26,000 pounds of reserve fuel. Weight-bearing capacity is a measurement of the maximum gross weight of an AMC aircraft with a given landing gear configuration that the primary runway can handle for continuous operations. 83 MOG refers to the maximum number of aircraft that can be simultaneously handled on the airfield during airlift operations. MOG can be limited by available parking space (parking MOG), the availability of maintenance capability, material-handling equipment, aerial port capacity (working MOG), or the refueling capacity of the airfield (refueling MOG). AFPAM 10-1403, December 2003, p. 25.

93
Table B.5—Continued
Scenario Type Country APOD ICAO Humanitarian Relief Mali Tombouctou GATB
Ethiopia Gode HAGO Burundi Bujumbura IAP HBBA Mozambique Beira FQBR Armenia Zvartnots UDYZ Uzbekistan Yuzhny UTTT Sri Lanka Bandaranaike IAP VCBI Thailand Hat Yai IAP VTSS Dominican Republic Aeropuerto de las Américas MDSD Guatemala La Aurora IAP MGGT Peru Velazco Astete SPZO
Counterterrorism Algeria In Salah DAUI Niger Manu Dayak IAP DRZA Somalia Egal IAP HCMH Saudi Arabia King Abdulaziz AB OEDR Tajikistan Dushanbe UTDD Philippines Zamboanga IAP RPMZ
SOURCE: Data derived from HQ AMC, ASRR, 18 June 2009.
Figure B.1 The Relationship Between MOG and Closure Time
NOTE: Throughput capacity was calculated using the standard AMC formula for airfield throughput capacity. Calculations assume 24-hour operations, an aircraft ground time of 3.25 hours, and a queuing efficiency of 85 percent. AFPAM 10-1403, 2003, pp. 4, 14.
54.5
41.7
19.6
3.0
27.2
20.8
9.8
1.5
18.2
13.9
6.5
1.0
13.6
10.4
4.9
0.80
10
20
30
40
50
60
Deterrence TF State Failure TF Humanitarian ReliefOperation TF
Counterterrorism TF
Clo
sure
Rat
e (D
ays)
MOG 2 MOG 4 MOG 6 MOG 8

94
contain estimates for the parking and contingency MOGs of an airfield. The parking MOG is AMC’s estimate of how much parking space is available at the airfield assuming that it is all available to AMC. The contingency MOG is an estimate of how much parking space and equipment will be made available to AMC for lift operations during a crisis. While we preferred to use the contingency MOG, this was not always available, and in such cases, we used AMC’s estimate of parking MOG under the assumption that, during a crisis, the required material handling and other necessary equipment would be made available.84 For over one-half of the selected contingency airfields, AMC did not have MOG figures, and in these cases, the MOG for an airfield was calculated using its parking aprons.85 Using this method, we assumed that 50 percent of an airfield’s suitable parking space would be made available to AMC and capped the MOG at 8.86 We also selected a floor for MOG of 4 was also selected, because deployment times for the scenario task forces to airfields with MOGs less than this were considered to be unreasonably long. In such cases, we assumed that multiple airfields could be used to increase the in-country MOG to 4.
The selection of contingency SPODs was based on a port’s suitability for LMSR operations. The main criterion used for this selection was the availability of berths long enough and with water deep enough alongside to handle a fully laden LMSR. An ideal LMSR berth would be 1,050 feet long and would have an alongside depth of 35.5 feet.87 Several of the contingency countries had limited port options, and in some cases, it was difficult to identify ports with ideal berths. Smaller lift vessels may be required; the LMSRs would have to be loaded with less than a full cargo; or less-than-ideal mooring arrangements would have to be accepted. Particularly problematic were the ports in the Bangladesh and Philippines scenarios.88 The contingency SPODs used in the GPM analysis are listed in Table B.6.
84 When AMC did not provide information on C-17 MOG, we assumed that the MOG would be the same as for the C-141. The C-17 and C-141 have nearly identical parking footprints; AMC considers that a C-17 requires 1.1 C-141 parking spots. AFPAM 10-1403, 2003, p. 11. 85 To be considered, the aprons needed to be paved. For these calculations, we assumed that a C-17 needs an apron of 220 by 224 feet to conduct deployment operations. This allows 25 feet on either side of the C-17 and 50 feet to the rear of the aircraft. Air Force Manual (AFMAN) 32-1123(I), Airfield and Heliport Planning and Design, Tyndall Air Force Base, Fla.: Headquarters Air Force Civil Engineer Support Agency/CESC, May 1999, p. 16–13. 86 We selected the cap of 8 because this was the maximum Tanker Airlift Control Center report contingency MOG for airfields broadly similar to those for which the MOGs were being calculated. The sole exception was King Abdulaziz Air Base, but this airfield was not considered to be representative of those likely to be found in our contingency countries. 87 Ideal characteristics were based on the overall length and maximum draft of a Watson-class LMSR. A berth being used for lift operations should be 100 feet longer than the overall length of the docked vessel and have two feet of water under its hull at mean low tide. FM 55-60, Army Terminal Operations, Washington, D.C.: Headquarters, Department of the Army, April 15, 1996, p. 3–8. 88 Port data were derived from Mark Windsor, Lloyd’s List Ports of the World 2009, London, 2009.

95
Table B.6 Contingency SPODs
Country Port Berths Depth (m) Algeria Bejaia Nouveau Quai Berths 21–24 12 Armenia Poti Berths 1–2 12.5 Azerbaijan Poti Berths 1–2 12.5 Bangladesh Chittagong Chittagong Container Terminal
Quay 9.1
Bolivia Buenos Aires (Argentina) Dársena de Propaneros Terminal 11.9 Burundi Mombasa (Kenya) Berths 16–18, Mbaraka Wharf 10.36,10.97 Chad Apapa (Nigeria) Container Terminal & Tin Can
Island 10.5
Cuba Guantanamo Bay NS Guantanamo Bay 10.6 Dominican Republic Caucedo Container Terminal 13.5 Estonia Tallinn (Muuga Harbor) Berths 12–13, 15–16 12.4 Ethiopia Djibouti (Djibouti) Berths 14–15 12 Georgia Poti Berths 1–2 12.5 Guatemala Puerto Quetzal Commercial Wharf 10.9 Indonesia Belawan Container Terminal 10.5 Kuwait Shuaiba Berths 9–11, 12–14, 15–18, 19–20 14 Liberia Monrovia Mano Pier 11–12 Mali Dakar (Senegal) Container Terminal 11 Mozambique Beira Berths 2–5 12 Niger Apapa (Nigeria) Container Terminal & Tin Can
Island 10.5
Nigeria Apapa Container Terminal & Tin Can Island
10.5
Pakistan Karachi Berths 6–9, 28–30 10.5, 12 Panama Manzanillo Container berths 13 Peru Callao Berths 5A–5B, 5D–5# 11 Philippines Zamboanga New Quay 10 Republic of Korea Pusan Pier 8 12.2 Saudi Arabia Dammman Multiple Berths 10.5–13.1 Somalia Djibouti (Djibouti) Berths 14–15 12 Sri Lanka Colombo Multiple Berths 12–15 Sudan Port Sudan Berths 6–7, 8–9, 17–18, Green
Terminal 10.7, 12.6,
14.2 Taiwan Hualien Berths 21–22, 23–24, 25 14, 16.5 Tajikistan N/A — — Thailand Penang (Malaysia) North Butterworth Container
Terminal 12
Uzbekistan N/A — — Yemen Aden Ma’alla Terminal, Aden Container
Terminal 11, 16
Zimbabwe Beira (Mozambique) Berths 2–5 12
Distance Calculations
The distance that equipment, personnel, and supplies have to travel is an additional piece of data required for the GPM. This information, along with assumptions about the rate of travel, is

96
required to calculate the deployment closure time for the various basing options. To calculate this closure time, three basic distances needed to be calculated: fort to port, port to port, and port to foxhole. The primary tool used to calculate these distances was U.S. Transportation Command’s JFAST model.89 JFAST has several embedded tools, including an “exclusion area editor” and a port-to-port sailing time calculator that can be used to calculate distances between most of the airfield, ports, and installations GPM examines. JFAST uses stylized air, land (road and rail), and sea networks to calculate the distance in nautical miles between thousands of installations that have a U.S. military geographic location code. In addition, JFAST can be programmed to calculate the distance between geographic location codes that avoids countries or areas that have been designated as exclusion zones through which the movement of U.S. personnel and assets is prohibited. In the few cases where JFAST lacked ground transportation network information, distances were calculated using Google Maps.
Fort-to-port calculations measure the distance from the installation where the task force is assumed to be based to the airfield (APOE) or port (SPOE) from which movement via either air or sealift is to be conducted. For existing bases, this was a straightforward calculation of the distance between the installation and the APOE or SPOE. In the case of the bases in candidate countries, it was assumed that the base would be equidistant between the identified in-country APOE and SPOE. When the APOE and SPOE were in the same urban area, we assumed that the base would be a nominal 15 nm away from both embarkation installations.90 Because both Kazakhstan and Uzbekistan are both inland, we did not calculate distance to a deployment port.
Port-to-port calculations measure the distance between the APOE or SPOE, where equipment and personnel are loaded onto air- and sealift assets, and the airfield (APOD) and port (SPOD), where they are unloaded. Port-to-port air distances were calculated by two methods. The initial method for calculating the distance between an APOE and an APOD was to find the “great circle” route distance between the two.91 This calculation finds the direct distance between any two points on the globe and takes into consideration the curvature of the earth. However, because we are assuming that there are countries that will not grant the U.S. access to their territory or airspace, it was also necessary to determine whether the direct flight route passed through one of these exclusion zones. The 13 prohibited states are
• Belarus • China • Cuba
89 The project used JFAST version 8.0 with service pack 11 updates that was released in June 2004. 90 In a few rare cases where the base was assumed to be on an airfield, the distance was calculated to the port only. 91 The “Haversine” formula was used to calculate great circle route distances. This formula calculates the distance between any two geographical coordinates on the globe by assuming that the earth is a uniform sphere with a 6,371 km radius. See Movable Type Scripts, “Calculate Distance, Bearing amd More Between Latitude/Longitude Points, website, undated.

97
• Ecuador • Iran • Libya • Myanmar • North Korea • Russia • Somalia • Sudan • Syria • Venezuela • Vietnam.
If it was determined that the direct route passed over one or more of these states, the exclusion zone tool in JFAST was used to manually calculate the length of the port-to-port route.
Port-to-port air distances were capped at 3,500 nm to ensure that bases were within the unrefueled flight range of a loaded C-17. The 3,500 nm cap was derived by adding 300 nm to the 3,200 nm leg associated with the ACL used to calculate the number of C-17 missions required to move the task forces described earlier. This additional 300 nm was added for several reasons. First, JFAST calculates air routes using a system of network nodes and links that does not calculate the shortest possible route between two locations. The great circle route and JFAST distances are thus not directly comparable, and the extra 300 nm provides an extra margin to prevent the exclusion of some links that might otherwise be possible but for an artifact embedded in JFAST. Second, while it was necessary to identify specific APODs within each contingency country so that distance could be calculated, the intent was not to exclude some bases simply on the basis of the chosen APOD. As a result, the extra 300 nm provides some leeway to assume that a contingency in a given country could be responded to using alternative bases or locations. Finally, the average C-17 payloads for the scenario task forces were well below the ACL for a 3,200 nm critical leg. As a result, most of the C-17s would be able to safely fly farther than 3,200 nm during the deployment operation.92
Sea port-to-port distances were calculated using the port-to-port sailing time calculator embedded within JFAST. It was further assumed that the lift ships were Watson-class LMSRs with an average service speed of 24 knots. An additional day was added to the travel time for each canal in the sea route.
Finally, we calculated port-to-foxhole distances between the SPODs in the contingency country and the APOD in the contingency country because the APOD was assumed to be in the locale where the contingency was occurring. These calculations were done using JFAST. To
92 The average payload for unit equipment ranged from 23 to 50 short tons, suggesting potential operational ranges of 3,500 nm or more. See Joseph F. Cassidy, C-17 Transportability of Army Vehicles, Newport News, Va.: Military Traffic Management Command, Transportation Engineering Agency, May 2002, p. 7.

98
calculate the time required to make the inland movement, we assumed that it would take two days to unload the LMSR. In addition, we assumed that, in countries with excellent road networks, the deployed units would be able to travel 400 miles per day; that in countries with moderate road networks, units could travel 200 miles per day; and hat in countries with poor road networks, the units would be able to travel 100 miles in a day.93
93 These daily distances assume units move in a single 10-hour shift. The 400-mile-per-day rate was derived from the U.S. Army planning factor for CONUS-based military convoys on controlled-access highways. We assumed that the Army would have some ability to control access to the highways used in the scenarios taking place in countries with excellent road networks. We also assumed that this deployment would occur preconflict, so that the transportation routes would be free of refugees and other potential wartime traffic. The 200-mile-per-day and 100-mile-per-day figures were derived from transportation planning factors for movement on good roads (20 miles in an hour) and poor roads (10 miles in an hour). These movement rates include rest and maintenance breaks. These distances could be doubled if unit moves could be conducted in the same fashion as transportation operations, which are based on two 10-hour shifts and driver exchanges. TEA, 2002, p. 15; FM 55-15, Transportation Reference Data, Washington, D.C.: Headquarters, Department of the Army, October 1997, p. 3–12.

99
Appendix C. Global Posturing Model
This appendix describes the GPM RAND Arroyo developed in support of calculating the optimal basing solutions for Army global posture.
The GPM determines the most cost-effective placement of bases in locations around the world to be able to respond to a wide variety of conflicts. This analysis is done using a mixed-integer program (MIP) implemented in the General Algebraic Modeling System. A mixed-integer program maximizes (or minimizes) some objective function of a combination of real-valued and integer-valued variables. A Microsoft Excel front end is used for the collection and organization of data, as well as managing outputs from the General Algebraic Modeling System.
Sets of Objects
LOC The set of possible locations for bases TYPE The types of bases that can be built at a location (equipment depots, permanent
bases, etc.) DAY The set of days (e.g. Day0, Day1, …) SCEN The list of possible scenarios.
Constants To explain the syntax, if A and B are sets of objects, then Const(A,B) is a constant that is
defined for every cross-product of an element in A and an element in B. This definition will also hold for more than two sets of objects. A similar definition will be used for variables. The units of on the amount of materiel moved will be C-17 equivalents.
SEAOUT(LOC,SCEN,DAY)
This is the maximum amount of materiel that can arrive by day DAY in scenario SCEN that can be surface lifted from a base at location LOC.
AIROUT(LOC,SCEN,DAY)
This is the maximum amount of materiel that can arrive on day DAY in scenario SCEN that can be airlifted from a base at location LOC.
Note that the parameter for sealift is cumulative, while the airlift parameter is not. Airlift is a more constant flow of materiel, while sealift arrives in more discrete amounts. In addition, if there are insufficient SPOD MOG capacities for a transport ship to arrive, it can wait until offloading space is available, while transport aircraft cannot.

100
AIROUTC17(LOC,SCEN)
This is the number of C-17 aircraft needed to maintain a maximum flow of materiel while airlifting materiel from a base at location LOC to scenario SCEN.
COST(LOC,TYPE)
This is the cost of a base of type TYPE at location LOC. In our model runs for this project, we used the cost variable to force the prioritization of current Army bases over new locations, but in general, these costs could reflect both initial startup costs (to get a base into shape) and yearly upkeep over some period.
MAXCAP(LOC,TYPE)
This is the maximum capacity of materiel of type MAT that is stored at a base of type TYPE at location LOC.
MATGOAL(SCEN,DAY)
This is the amount of materiel desired in scenario SCEN by day DAY. By breaking this variable down by region and day, we can find an assignment of bases (and,
as explained later, a set of transportation schedules) that can respond to crises in various regions. As an example, assume one were interested in finding an assignment of bases such that a battalion of troops could arrive at any scenario in five days and two more battalions to any region in 15 days. Assuming a battalion requires 200 C-17 equivalents of lift capability, then for each scenario,
200 If 5( , ) 600 If 15
0 otherwise
kMATGOAL SCEN DAYk k
=⎧⎪= =⎨⎪⎩
This enables considerable flexibility in the model, since we can define different materiel requirements for different scenarios.
LOC_FLAG(LOC)
This is an indicator variable, which equals 1 if the base location LOC should be considered in the model, and 0 otherwise. This enables the running of particular subcases (if the intent is only to deliver materiel from a few regions).

101
SCEN_FLAG(SCEN)
This is an indicator variable, which equals 1 if scenario SCEN should be considered in the model, and 0 otherwise. This enables the running of particular subcases (if the intent is only to deliver materiel to a few regions).
SEAINCAP(SCEN)/AIRINCAP(SCEN)
This is the maximum capacity of materiel that can be accepted per day in scenario SCEN via surface lift and/or airlift.
MAXAIRLIFT(SCEN)
This is the maximum number of C-17s that are available to the army in scenario SCEN.
Variables
X(LOC,TYPE)
This is an indicator variable that equals 1 if a base of type TYPE is built at location LOC, and equals zero otherwise.
SEAIN(LOC,TYPE,SCEN,DAY) / AIRIN(LOC,TYPE,SCEN,DAY)
This is the amount of materiel that is accepted from a base in location LOC of type TYPE in scenario SCEN on day DAY via surface lift and/or airlift.
The power of a MIP model like this is that it can not only find the optimal assignment of bases, but it can also (through the clever addition of a few additional constraints) provide sample transportation schedules that will get the desired amount of materiel to each region in time.
Objective Function and Constraints
Objective Function
Minimize ,
( , ) ( , )LOC TYPE
TotalCost X LOC TYPE COST LOC TYPE= ∑
Every assignment of bases to regions has a total cost that we want to minimize, subject to a set of constraints. The objective function can be tweaked to incorporate other optimization considerations into the MIP. For example, if the goal is to both minimize the amount of materiel that is airlifted and to have it completed as quickly as possible, then the objective function can be rewritten as:

102
( )
,
1 2, , ,
Minimize * ( , ) ( , )
1 ( , , , )
LOC TYPE
DAY
LOC TYPE SCEN DAY
TotalCost X LOC TYPE Cost LOC TYPE
AIRIN LOC TYPE SCEN DAYε ε
= +
+
∑
∑
where 1ε and 2ε are very small positive numbers (on the order of 10-9). Thus, the MIP would select among the solutions of minimum cost the one that minimized the amount of material that is airlifted (AIRIN).
Constraints
The constraints of the model will now be presented as equations first, then explained in writing. The inverted “A” symbol ∀ denotes “for every,” so for example, LOC∀ means “for every base location.”
Subject to:
, ( , ) 1TYPE
LOC X LOC TYPE∀ ≤∑
No more than one type of base may be stationed at any location (so for each location, at most, one of the indicator variables X(LOC,TYPE) will be equal to one, the rest will be zero).
For the remaining constraints, it will be assumed that the scenario constraints will be included only for the scenarios in which SCEN_FLAG(SCEN) is equal to one and the base locations for which LOC_FLAG(LOC) is equal to one.
,'
( , , , '), : ( , )
( , , , ')LOC TYPEDAY DAY
SEAIN LOC TYPE SCEN DAYSCEN DAY MATGOAL SCEN DAY
AIRIN LOC TYPE SCEN DAY≤
+⎛ ⎞∀ ≥⎜ ⎟
⎝ ⎠∑
This constraint guarantees that the desired amount of materiel in each scenario can be lifted to each region on time. It is defined only when MATGOAL(SCEN,DAY) is nonzero.
( , , , ), , : ( , )
( , , , )DAY
SEAIN LOC TYPE SCEN DAYLOC TYPE SCEN MAXCAP LOC TYPE
AIRIN LOC TYPE SCEN DAY+⎛ ⎞
∀ ≤⎜ ⎟⎝ ⎠
∑
This constraint guarantees that no more than the amount of materiel that is housed at a base of type TYPE at location LOC gets lifted to any scenario. Note that this constraint implicitly assumes that no more than one conflict is going on at any particular time.
,
( , , , ), : ( , )
( , , , )SCEN DAY
SEAIN LOC TYPE SCEN DAYLOC TYPE N X LOC TYPE
AIRIN LOC TYPE SCEN DAY+⎛ ⎞
∀ ≤ ×⎜ ⎟⎝ ⎠
∑

103
This constraint is a work-around to force only the SEAIN/AIRIN values that will be nonzero to be the ones for which X(LOC,TYPE) is equal to one. N will be a very large number.
, '
, , :( , , , ') ( , , )
( , , , ) ( , , )TYPE DAY DAY
TYPE
LOC SCEN DAYSEAIN LOC TYPE SCEN DAY SEAOUT LOC SCEN DAY
AIRIN LOC TYPE SCEN DAY AIROUT LOC SCEN DAY≤
∀≤
≤
∑∑
These constraints guarantee that the amount of materiel accepted in a region from each base does not exceed the amount that can be surface lifted or airlifted from that base on that day. Note that the two equations are different because SEAOUT is a cumulative variable, while AIROUT is not.
,
,
, :( , , , ) ( )
( , , , ) ( )LOC TYPE
LOC TYPE
SCEN DAYSEAIN LOC TYPE SCEN DAY SEAINCAP SCEN
AIRIN LOC TYPE SCEN DAY AIRINCAP SCEN
∀≤
≤
∑∑
These constraints guarantee that the amount of materiel coming in to a region by surface lift or airlift cannot exceed the amount that can be offloaded in the region each day.
,
, :( , , , ) 17( , ) ( )
( , , )LOC TYPE
SCEN DAYAIRIN LOC TYPE SCEN DAY AIROUTC LOC SCEN MAXAIRLIFT SCEN
AIROUT LOC SCEN DAY
∀
≤∑
These constraints guarantee that the number of C-17s used by the Army does not exceed the airlift capacity allocated to the Army. We assumed a daily maximum amount of airlift to be at the disposal of the Army. If needed, a similar surface lift constraint can be added.
Modifications of GPM for Current Study
For the current study, we modified things slightly. We considered only two types of base for each location: either surface lift or a (BCT-sized) base for airlift. In place of cost, we instead minimized the number of bases needed, prioritizing potential basing locations with current large (BCT-sized) Army bases first, followed by current smaller Army bases, locations of current bases of other U.S. armed forces, then new basing locations (the lowest priority).
To simplify the system of equations, we introduced new variables AIRTIME(LOC,SCEN) and SURFTIME(LOC,SCEN), which were the amount of time in days to deliver all materiel from a base located at LOC to a contingency at SCEN via airlift and surface lift, respectively. In

104
addition, there was a deadline parameter DEADLINE(SCEN) for the maximum time for all materiel to be delivered for each contingency. We would vary the deadline parameters for each contingency by starting with the time to close the air bridge and then adding time to it, the added time representing the maximum time until the first aircraft arrives at the APOD.
To incorporate robustness into the material delivery, we introduced two new parameters ROBUST(LOC) and ROBREQ(SCEN). These represented the robustness of base locations and the robustness requirements of contingencies, respectively. Then, the following equation had to be satisfied for all scenarios SCEN:
: ( , ) ( )
: ( , ) ( )
( ," ") ( )
( ," ") ( ) ( )LOC AIRTIME LOC SCEN DEADLINE SCEN
LOC SURFTIME LOC SCEN DEADLINE SCEN
X LOC AIR ROBUST LOC
X LOC SURF ROBUST LOC ROBREQ SCEN≤
≤
+
≥
∑
∑
The ROBUST and ROBREQ parameters are used to model different assumptions about the required robustness of basing solutions. If only one base is needed to address each contingency, then ROBUST = 1 and ROBREQ = 2 for all base locations and contingencies. Then the above equation is satisfied for all contingencies as long as at least one base can handle each contingency. If, however, every contingency needed to be addressed by either one current base or two new bases, then ROBREQ = 2 for all contingencies, ROBUST = 2 for all current bases, and ROBUST = 1 for all new bases.

105
References
192nd Infantry Brigade, “Training Battalion Responsibilities,” Ft. Benning, Ga, undated a.
———, “Training Overview,” Ft. Benning, Ga, undated b.
198th Infantry Brigade, “Cadre Authorization” U.S. Army Infantry Homepage, Ft. Benning, Ga., March 18, 2009.
AFMAN—See Air Force Manual.
Air Force Manual (AFMAN) 32-1123(I), Airfield and Heliport Planning and Design, Tyndall Air Force Base, Fla.: Headquarters Air Force Civil Engineer Support Agency/CESC, May 1999.
Air Force Pamphlet (AFPAM) 10-1403, Air Mobility Planning Factors, Headquarters Air Mobility Command, December 2003.
Amouzegar, Mahyar A., Ronald G. McGarvey, Robert S. Tripp, Louis Luangkesorn, Thomas Lang, and Charles Robert Roll, Jr., Evaluation of Options for Overseas Combat Support Basing, Santa Monica, Calif: RAND Corporation, MG-421-AF, 2006. As of February 11, 2013: http://www.rand.org/pubs/monographs/MG421.html
Amouzegar, Mahyar A., Robert S. Tripp, Ronald G. McGarvey, Edward W. Chan, and Charles Robert Roll Jr., Supporting Air and Space Expeditionary Forces: Analysis of Combat Support Basing Options, MG-261-AF, Santa Monica, Calif: RAND Corporation, 2004. As of February 11, 2013: http://www.rand.org/pubs/monographs/MG261.html
Button, Robert W., John Gordon IV, Jessie Riposo, Irv Blickstein, and Peter Wilson, Warfighting and Logistic Support of Joint Forces from the Joint Sea Base, Santa Monica:Calif: RAND Corporation, MG-649-NAVY, 2007. As of February 11, 2013: http://www.rand.org/pubs/monographs/MG649.html
Calder, Kent E., Embattled Garrisons: Comparative Base Politics and American Globalism, Princeton, N.J.: Princeton University Press, 2007.
Cassidy, Joseph F., C-17 Transportability of Army Vehicles, Newport News, Va.: Military Traffic Management Command, Transportation Engineering Agency, May 2002.
Chairman of the Joint Chiefs of Staff Guide 3401D, “CJCS Guide to the Chairman’s Readiness System,” November 15, 2010. As of April 16, 2015: http://www.dtic.mil/cjcs_directives/cdata/unlimit/g3401.pdf

106
Cooley, Alexander, Base Politics: Democratic Change and the U.S. Military Overseas, Ithaca, N.Y.: Cornell University Press, 2008.
Cooley, Alexander, and Jonathan Hopkin, “Base Closings: The Rise and Decline of the U.S. Military Bases Issue in Spain, 1975–2005,” International Political Science Review, Vol. 31, No. 4, 2010, pp. 494–513.
Cooley Alexander, and Kimberly Marten, “Base Motives: The Political Economy of Okinawa’s Antimilitarism,” Armed Forces and Society, Vol. 32, No. 4, July 2006, pp. 566–583.
Crawford, Derrick, “U.S. Soldiers Help Ready Georgian Infantry for Iraq,” U.S. European Command website, August 17, 2006. As of February 11, 2013: http://www.eucom.mil/English/FullStory.asp?art=1103
Daniels, Lisa, “SOUTHCOM Completes Haiti Disaster Response,” American Forces Press Service, June 1, 2010. As of February 13, 2013: http://www.defense.gov/news/newsarticle.aspx?id=59423
Defense Manpower Data Center, “Department of Defense: Active Duty Military Personnel Strengths by Regional Area and by Country (309A),” June 30, 2009.
Department of Defense Instruction (DoDI) 5000.68, Security Force Assistance (SFA), Washington, D.C.: U.S. Department of Defense, October 2010.
DoD—See U.S. Department of Defense.
Dreher, Axel, and Nathan Jensen, Country or Leader? Political Change and UN General Assembly Voting, KOF Swiss Economic Institute, KOF Working Paper No. 217, February 2009.
Dreher, Axel, Peter Nunnenkamp, and Rainer Thiele, “Does U.S. Aid Buy UN General Assembly Votes? A Disaggregated Analysis, Public Choice, Vol. 136, Nos. 1–2, 2006, pp. 139–164.
Embassy of the United States, “U.S. Military Engagements to Romania,” FAQ, May 27, 2008. As of April 16, 2015: http://romania.usembassy.gov/policy/us-military-engagements-to-romania.html
FM—See U.S. Army Field Manual.
Fraser, Douglas, “DOD News Briefing with Gen. Fraser from Miami, Florida,” news transcript, January 21, 2010. As of February 13, 2013: http://www.defense.gov/transcripts/transcript.aspx?transcriptid=4548
GAO—See U.S. Government Accountability Office.

107
Guillory, Victor, and Tom Fry, “DoD Briefing on Operation Unified Assistance, the Post-Tsunami Relief Effort,” news transcript, January 14, 2005. As of February 13, 2013: http://www.defense.gov/transcripts/transcript.aspx?transcriptid=1653
Hasenauer, Heike, “Responding to the Tsunami Disaster,” Soldiers Magazine, March 2005, pp. 25–29.
Headquarters Air Mobility Command, Airfield Suitability and Restrictions Report (ASRR), June 2009.
Henry, Ryan, “Transforming the U.S. Global Defense Posture,” Naval War College Review, Vol. 59, No. 2, Winter/Spring 2006, pp. 12–28.
Joint Publication (JP) 1-02, Dictionary of Military and Associated Terms, Washington, D.C.: U.S. Department of Defense, April 12, 2001 (as amended through April 2010).
Keen, Ken, “DOD News Briefing with Lt. Gen. Keen from Haiti,” news transcript, January 26, 2010. As of February 13, 2013: http://www.defense.gov/transcripts/transcript.aspx?transcriptid=4546
Kruzel, John J., “U.S. Forces in Haiti to Grow to 20,000,” American Forces Press Service, January 21, 2010. As of February 13, 2013: http://www.defense.gov/news/newsarticle.aspx?id=57661
Kuziemko, Ilyana, and Eric Werker, “How Much Is a Seat on the Security Council Worth? Foreign Aid and Bribery at the United Nations,” Journal of Political Economy, Vol. 114, No. 5, 2006, pp. 905–930.
Lang, Thomas, Defining and Evaluating Reliable Options for Overseas Combat Support Basing, Santa Monica, Calif: RAND Pardee Graduate School, RGSD-250, 2009. As of February 11, 2013: http://www.rand.org/pubs/rgs_dissertations/RGSD250.html
Marshall, Monty G., and Keith Jaggers, Polity IV Project: Political Regime Characteristics and Transitions, 1800–1999, College Park, Md.: Center for International Development and Conflict Management, December 2000.
McDonnell Douglas, C-17 Globemaster III: Technical Description and Planning Guide, August 1996.
McGarvey, Ronald G., Robert S. Tripp, Rachel Rue, Thomas Lang, Jerry M. Sollinger, Whitney A. Conner, and Louis Luangkesorn, Global Combat Support Basing: Robust Prepositioning Strategies for Air Force War Reserve Materiel, Santa Monica, Calif: RAND Corporation, MG-902-AF, 2010. As of February 12, 2013: http://www.rand.org/pubs/monographs/MG902.html

108
Merriam-Webster, Merriam-Webster’s Geographical Dictionary, 3rd ed., April 1, 2007.
Movable Type Scripts, “Calculate Distance, Bearing and More Between Latitude/Longitude Points,” website, undated. As of February 15, 2023: http://www.movable-type.co.uk/scripts/latlong.html
Peltz, Eric, John M. Halliday, and Aimee Bower, Speed and Power: Toward an Expeditionary Army, Santa Monica: Calif: RAND Corporation, MR-1755-A, 2003. As of February 11, 2013: http://www.rand.org/pubs/monograph_reports/MR1755.html
Sand, Peter H., United States and Great Britain in Diego Garcia: The Future of a Controversial Base, New York: Palgrave McMillan, 2009.
Schubert, Frank N., and Theresa L. Kraus, eds., The Whirlwind War: The United States Army in Operations Desert Shield and Desert Storm, Washington, D.C: U.S. Army Center of Military History, 2000.
Shlapak, David A., John Stillion, Olga Oliker, and Tanya Charlick-Paley, A Global Access Strategy for the U.S. Air Force, Santa Monica, Calif: RAND Corporation, MR-1216-AF, 2002. As of February 12, 2013: http://www.rand.org/pubs/monograph_reports/MR1216.html
TEA—See Transportation Engineering Agency.
Transportation Engineering Agency, Deployment Planning Guide: Transportation Assets Required for Deployment, Newport News, Va.: Military Traffic Management Command, Pamphlet 700-5, May 2001.
———, Logistics Handbook for Strategic Mobility Planning, Newport News, Va.: Military Traffic Management Command, Pamphlet 700-2, September 2002.
———, “High Speed Vessel Loading,” briefing slides,Newport News, Va.: Military Traffic Management Command, undated.
U.S. Army Armor Center, Armor/Cavalry Reference Data: Brigade Combat Teams, Fort Knox Supplemental Manual 71-8, Fort Knox, Ky., November 2005.
U.S. Army Command and General Staff College, Combat Service Support Battle Book, Fort Leavenworth, Kan., ST 101-6, July 2007.
U.S. Army Field Manual (FM) 55-60, Army Terminal Operations, Washington, D.C.: Headquarters, Department of the Army, April 15, 1996
——— 55-9 C1, Unit Air Movement Planning, Washington, D.C.: Headquarters, Department of the Army, October 1994.

109
——— 55-15, Transportation Reference Data, Washington, D.C.: Headquarters, Department of the Army, October 1997.
——— 55-17, Cargo Specialist’s Handbook, Washington, D.C.: Headquarters, Department of the Army, February 1999.
——— 3-24.2, Tactics in Counterinsurgency, Washington, D.C.: Headquarters, Department of the Army, March 2009.
U.S. Army Sustainment Command, “Worldwide APS Conference,” PowerPoint briefing, March 2009.
U.S. Army War College, How the Army Runs: A Senior Leader Reference Handbook, Carlisle Barracks, Penn., 2011–2012.
U.S. Congress, Commission on Review of Overseas Military Facility Structure of the United States, Final Report, August 15, 2005.
U.S. Department of Defense, Base Structure Report, Fiscal Year 2008 Baseline (A Summary of DoD’s Real Property Inventory), Washington, D.C.: Office of the Deputy Under Secretary of Defense (Installations and Environment), undated. As of September 1, 2009: http://www.acq.osd.mil/ie/download/bsr/BSR2008Baseline.pdf
———, Quadrennial Defense Review Report, Washington, D.C., September 30, 2001.
———, “Georgia ‘Train and Equip’ Program Begins,” press release, April 29, 2002. As of February 11, 2013: http://www.defenselink.mil/releases/release.aspx?releaseid=3326
———, Strengthening U.S. Global Defense Posture, Report to Congress, September 2004.
———, “Wall of Water: U.S. Troops Aid Tsunami Victims,” 2005 Year in Review, 2006. As of February 13, 2013: http://www.defense.gov/home/features/2006/2005yearinreview/article2.html
———, Base Structure Report, Fiscal Year 2009 Baseline (A Summary of DoD’s Real Property Inventory), Washington, D.C.: Office of the Deputy Under Secretary of Defense (Installations and Environment), 2008.
———, Base Structure Report, Fiscal Year 2009 Baseline (A Summary of DoD’s Real Property Inventory), Washington, D.C.: Office of the Deputy Under Secretary of Defense (Installations and Environment), 2009.
———, Quadrennial Defense Review Report, Washington, D.C., February 2010.
U.S. Department of State, “Joint Task Force East,” undated. As of September 4, 2009: http://bulgaria.usembassy.gov/odc_jtf.html

110
———, “Voting Practices in the United Nations,” various years. As of April 16, 2015: http://www.state.gov/p/io/rls/rpt/
U.S. Government Accountability Office, “DoD’s Overseas Infrastructure Master Plans Continue to Evolve,” Washington, D.C., GAO-06-913R, August 22, 2006.
———, “Force Structure: Actions Needed to Improve DOD’s Ability to Manage, Assess, and Report on Global Defense Posture Initiatives,” Washington, D.C., GAO-09-706R, July 2, 2009.
———, Defense Infrastructure: Opportunities Exist to Improve the Navy’s Basing Decision Process and DoD Oversight, Washington, D.C., GAO-10-482, May 2010.
Vandiver, John, “U.S. Training Georgians for Afghanistan,” European Stars and Stripes, September 4, 2009.
Vick, Alan, David T. Orletsky, Bruce Pirnie, and Seth G. Jones, The Stryker Brigade Combat Team: Rethinking Strategic Responsiveness and Assessing Deployment Options, Santa Monica, Calif: RAND Corporation, MR-1606-AF, 2002. As of February 11, 2013: http://www.rand.org/pubs/monograph_reports/MR1606.html
Wang, T. Y., “U.S. Foreign Aid and UN Voting: An Analysis of Important Issues,” International Studies Quarterly, Vol. 43, No. 1, March 1999, pp. 199–210.
Windsor, Mark, Lloyd’s List Ports of the World 2009, London, 2009.
Yeo, Andrew, “Not in Anyone’s Backyard: The Emergence and Identity of a Transnational Anti-Base Network,” International Studies Quarterly, Vol. 53, No. 3, 2009, pp. 571–594.