aromatic profiles of spray-dried encapsulated - biblioteca digital
TRANSCRIPT

Galmarini, M. V.; Zamora, M. C.; Baby, R.; Chirife, J.; Mesina, V.
Aromatic profiles of spray-dried encapsulated orange flavours: influence of matrix composition on the aroma retention evaluated by sensory analysis and electronic nose techniques
Preprint del documento publicado en International Journal of Food Science & Technology Vol. 43 Issue 9, september 2008
Este documento está disponible en la Biblioteca Digital de la Universidad Católica Argentina, repositorio institucional desarrollado por la Biblioteca Central “San Benito Abad”. Su objetivo es difundir y preservar la producción intelectual de la Institución.La Biblioteca posee la autorización del autor para su divulgación en línea.
Cómo citar el documento:
Galmarini, M. V., Zamora, M. C., Baby, R., Chirife, J. and Mesina, V. (2008), Aromatic profiles of spray-dried encapsulated orange flavours: influence of matrix composition on the aroma retention evaluated by sensory analysis and electronic nose techniques. International Journal of Food Science & Technology, 43:1569–1576. doi: 10.1111/j.1365-2621.2007.01592.x.Disponible en: http://bibliotecadigital.uca.edu.ar/repositorio/investigacion/aromatic-profiles-spray-dried-orange.pdf [Fecha de consulta: ….........]
(Se recomienda indicar fecha de consulta al final de la cita. Ej: [Fecha de consulta: 19 de agosto de 2010]).
Aromatic profiles of spray dried encapsulated orange flavours: influence
of matrix composition on aroma retention evaluated by sensory analysis
and electronic nose techniques.
1,2Galmarini, M.V.; 1,2Zamora, M.C., 1,3Baby, R.; 2Chirife, J., 3,4Mesina, V. 1Consejo Nacional de Investigaciones Científicas y Técnicas (CONICET), Av.
Rivadavia 1917 – (C1033AAJ) - Buenos Aires, Argentina
2Facultad de Ciencias Agrarias, Universidad Católica Argentina (UCA), Cap. Gral.
Ramón Freire 183 - (C1426AVC) - Buenos Aires, Argentina.
3 Centro de Investigaciones en Sólidos (CINSO), Juan B. de Lasalle 4397 -
(B1603ALO) - Villa Martelli, Argentina
4Instituto de Investigaciones Científicas y Técnicas de las Fuerzas Armadas (CITEFA),
Juan B. de Lasalle 4397 - (B1603ALO) - Villa Martelli, Argentina
Running title: Aromatic profiles of encapsulated flavours
Corresponding author: Mara Virginia Galmarini
Email: [email protected] de Ciencias Agrarias, Universidad Católica Argentina (UCA), Cap. Gral.
Ramón Freire 183 - (C1426AVC) - Buenos Aires, Argentina.
Tel/ fax (54 – 11) 4552-2711
ABSTRACT
Spray dried orange flavour encapsulated in different amorphous matrices comprised of
maltodextrin (MD) and different combinations with; sucrose, trehalose, lactose,
modified starch and gum arabic (ga); were evaluated by sensory analysis and
electronic nose (e-nose). With both techniques the flavours encapsulated in MD-
sucrose and MD -lactose-sucrose were perceived as similar. However, the e-nose did
not detect any differences among the other matrices (MD-trehalose, MD, MD-sucrose
at a different concentration and MD-ga). On the contrary, sensory analysis was able to
group MD-trehalose and MD describing them by: woody, marmalade, syrup, citrus
terpens, and Vitamin C; MD -sucrose at 40% and 10% concentration and MD -lactose-
sucrose were grouped and represented by powder juice, tangerine and pungency,
while MD-ga was differentiated from the rest by the attributes peely, plastic, solvent
and green. In this way, it was shown that matrix composition determines the aromatic
profile of spray dried encapsulated orange flavours.
Keywords: Spray dried – Orange encapsulated flavours – Sensory profile – electronic
nose – trehalose - sucrose
INTRODUCTION
Spray drying is the most common technique to produce flavour powders from
food flavour emulsion; recipes for spray-dried flavours contain, in addition to the liquid
flavour, carrier materials such as maltodextrin (MD), gum arabic and modified starch.
Ingredients are mixed, emulsified/homogenized and spray dried; water content is
reduced to below 5% and the flavour is encapsulated in an amorphous glassy
carbohydrate matrix.
The requirements for an ideal spray-drying carrier include a high degree of
solubility, limited viscosity at the 35-45% solution solids range, emulsifying
characteristics, good drying properties, non hygroscopic character, bland taste, non
reactivity, and low cost. For these reasons maltodextrins are commonly used for this
type of spray drying applications. Also, the high glass transition temperature (Tg) of low
DE maltodextrins provides good product stability to the dried powder (Beristain et. al
2002; Bhandari & Hartel, 2005).
It is well known that, among other factors, the type of carrier governs flavour
retention during the spray drying process (Menting et al. 1970; Thijssen, 1971); and for
this reason disaccharides, such as sucrose or lactose are sometimes included with
maltodextrin in commercial formulations to improve retention characteristics.
However, the low Tg of sucrose (Roos, 1995) may adversely affect stability.
Food powders containing amorphous carbohydrates can undergo several physical
changes which lead to deterioration of quality (Roos & Karel, 1991). Recent work done
on strawberry and orange spray dried powder flavours showed that the presence of
sucrose in the carrier formulation (MD and sucrose) affected storage stability in a
negative way (Busso Casatti et al., 2006), because it reduces the glass transition
temperature dramatically when 40 % of sucrose is incorporated in the dry carbohydrate
matrix.
Trehalose is a naturally occurring non reducing disaccharide which consists of
two glucose molecules linked in a 1,1-position by a α -glycosidic bond. In the last years
the use of trehalose as a functional food additive has been approved in many
countries. The glass transition temperature for trehalose is much higher than that of
sucrose (115 ºC as opposed to 77 ºC for sucrose; Komes et al., 2003) which would
contribute to the physical stability of spray dried matrices containing trehalose instead
of sucrose. It is well known that during spray drying encapsulation of flavours partial
loss of volatile compounds usually occurs leading to an alteration of the total volatile
composition and/or a variation of the ratio of the different compounds in the spray dried
product. Komes et al. (2003; 2005) observed that the addition of trehalose to
dehydrated strawberry and apricot purees resulted in the lowest loss of total aroma as
well as of individual fruit volatiles when compared to sucrose.
In present work aromatic profiles of orange oil encapsulated in different spray
dried carbohydrate matrices are studied. Orange oil aroma is a complex mixture of
various chemical components, primarily (+)-limonene (>90%) responsible for the base
sensory character of the citrus oils. The aroma is determined by the aldehydes, mainly
octanal and decanal, and both citrals and esters. The sesquiterpenes aldehydes, α and
β sinensal contribute particularly to the specific sweet orange aroma (Wright, 1995).
Even though odour mixtures bear a strong resemblance in their character to the quality
characteristics of the individual components, no single compound possess the odour
quality characteristic of the blend (Lawless & Heymann, 1998). In addition, the
retention of aroma compounds during spray drying encapsulation is expected to
depend on the interactions of aroma compounds and encapsulating components of the
matrix. This results in changing the volatile profile and the sensory perception of aroma
up on reconstitution of the flavour powder.
Unlike the traditional instruments (e.g. gas chromatography) which discriminate
the different flavour components, electronic noses (e-noses) measure the aroma

components as a whole, thus resembling the human nose. However, it must be noted
that the e-noses measure not total odour intensity, but rather give an undefined
measure of the total volatiles, being them aromatic or not (Stephan et al., 2000). Some
semi-specific metal oxides sensors do exist, but the ability to, for example, detect the
character impact component of some aroma is still far away. In this way, it is important
to compare the study with sensory analysis which gives a specific perception of a
particular flavour while allowing a descriptive and a quantitative evaluation of the
different aroma compounds. This comparative and complementary analysis was used
by Baby et al. (1999) to determine odour intensities of different dilutions of powder
orange juice using a sensory panel and an e-nose as measuring instruments,
observing that both intensities could fit to similar mathematical functions.
The aim of this work was to compare the aromatic profile of spray dried orange
flavours encapsulated in different carbohydrate matrices by means of sensory analysis
and an e-nose. In addition, the efficiency of aroma retention of sucrose and trehalose
(in a mixture with maltodextrin) were compared in order to explore the potential of this
disaccharide as a carrier for producing spray dried flavours.
MATERIALS AND METHODS
Samples
Five commercial spray dried encapsulated orange flavours (samples 1 to 5) (5
% water content) and one sample specially prepared using trehalose were
manufactured in a flavour company located in Buenos Aires, Argentina. Table 1 shows
the composition of the spray dried flavours. Maltodextrin DE 12 (MD 12) accounts for
most of the amorphous dried matrix in samples 1 and 2; while in samples 3, 4, 5 and 6
it has been partially replaced by one or the other of the following disaccharides:
sucrose, lactose and trehalose. Samples 1, 3, 4, 5 and 6 also have a small proportion
of modified starch in their composition while sample 2 has only MD and gum arabic.
The sample containing trehalose (number 6) was specially prepared for this study since
this disaccharide is not locally commercially used for this purpose yet. Processing
conditions during flavour oil emulsification (which can affect emulsion size) were similar
for all samples; the same for operating conditions of the atomizer during spray drying,
to minimize effects on particle size distribution of the spray-dried powder.
Sensory Analysis
Panel training
Twelve paid assessors (12 females, 19-23 years old) students of Facultad de
Ciencias Agrarias, Pontificia Universidad Católica Argentina were trained in descriptive
analysis of orange flavours (eight hours). During training period, judges performed the
following tasks: 1) Odour identification using standard solutions (Table 2); 2) Attribute
generation of the different orange samples with the aid of standards (Table 2), 3)
Matching of aromas, 4) Use of unstructured scales.
Aroma profiling
The experiment was divided in two phases: 1º) Triangle Test (ASTM, 1977) was
performed to compare orange flavours and develop information about the
characteristics of the samples. During two testing sessions (2 hours long each),
assessors were required to pick the sample which they believed was different and
describe the attributes responsible for that difference. The powder flavour solutions
(5% in distilled water) were placed (15 mL) in sealed glass flasks (35 ml capacity, 3 cm
diameter opening) and presented to assessors identified with random three digit codes.
Testing took place in individual booths kept at a temperature of 22 ± 2ºC and
illuminated with red light in order to mask differences due to colour intensity.
Descriptors which accounted for the differences were listed and their frequency of
mention was analyzed in order to obtain a control sample for the descriptive analysis.
This control sample was the one with the highest frequency of mention for the given
attribute (Table 2).
2º) Descriptive Analysis was done by a combination of the quantitative descriptive
analysis (QDA) method (Stone & Sidel, 1993) and the difference-from-control test
(Meilgaard et. al, 1991). The aid of standards was provided in order to quantify the 14
attributes: freshly squeezed, juice powder, citrus terpens, vitamin C, tangerine, candy,
solvent, plastic, peely, marmalade, woody, pungency, green, syrup. Six samples and a
control - which was specific for each attribute - were presented in each session (seven
sessions; two hour long each, aprox.); assessors did not know that the control sample
was the same as one of the coded samples. For every descriptor judges were asked to
sniff the headspace generated in the control sample and then quantify the given
descriptor for the six samples by comparing aroma intensity with the control; samples
were evaluated in duplicate. Evaluation was done only by sniffing the headspace in
order to be able to compare results with those obtained with the e-nose.
E-nose Analysis
The E-nose used MOSES II (MOdular SEnsor System), Tübingen, Germany, was
equipped with eight tin dioxide (SnO2) sensors and eight quartz microbalance (QMB)
sensors. Different doping of tin oxide sensors as well as different polymeric coatings of
QMB sensors confer them higher sensitivity and special selectivity for certain gases.
Surface resistivity of SnO2 sensors changes according to the oxidant or reducing
properties of the adsorbed gases. The quartz crystals of QMB are operated in an
oscillator circuit and in the absence of analyte gas they oscillate with their usual
frequency (12-14 MHz). If the polymer coating adsorbs selectively an analyte gas
(adsorption is temporary and reversible) the crystal mass increases, thus reducing the
frequency of vibration. In consequence, the frequency change results proportional to
the analyte concentration (Mitrovics et. al, 1997).
In this experience only the oxide sensors were used since they allowed a better
discrimination among samples. Solutions at 5% in water of the six samples were
analyzed. For each sample three vials containing 3 ml of the solution were prepared,
incubated at 40 ºC for 15 minutes with a 20 minute interval between samples and
placed in a headspace sampler Dani HSS 86.50. Volatiles were carried to the sensors
by a stream of synthetic air (flow rate 30 ml/min).
Each analyzed specimen produced, consequently, a plot of sixteen curves (being
each one the output signal of each sensor versus time). It is necessary to reduce the
large quantity of data so as to describe each sample with a minimal number of
parameters. The Principal Component Analysis (PCA) algorithm makes use of the
advantage that sensors are relatively non specific and that it can combine the signals
of all the sensors in a unique signal. Employing this method, similar odours tend to be
grouped in clusters and the result is a bidimensional plot (axes are the components
which contribute most to the odours expressed in %).
Statistical Analysis
The binomial distribution was used to calculate the significant level for the
triangle test, based on a number of correct answers. Analysis of variance (ANOVA)
was carried out to assess attributes significantly different among samples using the
General Linear Model command in SPSS v. 13.0. The variability of each descriptor was
studied using a model where assessor was considered a random factor and sample
and replication fixed factors. Multiple means comparisons were carried out by Student-
Neuman- Keuls (SNK) test at p< 0.05. PCA was conducted to examine the relationship
among attributes and samples, correlation matrix was used and the minimum
eigenvalue was set at 1. Clusters were performed by K-Means command in SPSS v.
13.0. E-nose used PCA as the statistical method to process the data obtained by
MOSES II.
RESULTS
Triangle Test
Table 3 shows the results for the triangle test for all samples. As it can be seen
all samples resulted significantly different except for sample 4 respect to sample 5.
These two samples had sucrose in low concentrations (5 and 10% respectively) and
the same amount of aroma (18%).
Analysis of Variance (ANOVA)
ANOVA of mixed model for attribute scores are summarized in Table 4.
Sources of variation were samples, assessors and sample*assessor interaction.
Replications and assessor*replication and sample*replication interactions were non
significant supporting the interpretations that the use of attributes was consistent.
Effect of assessors was significant for only one attribute (vitamin C, p<0.05) and
sample*assessor interaction was significant for two attributes (freshly squeezed,
p<0.01 and vitamin C, p<0.05) indicating that not all the judges evaluated all the
samples in the same fashion for those descriptors. Other authors observed that this
can happen when samples are very similar in their sensory properties so assessors
can not differentiate easily among them (Tang et al., 1999; Zamora & Guirao, 2002). In
order to verify this observation we examined the samples which were different from
each other for these attributes. ANOVAs were calculated for the samples whose means
had the biggest difference and which were found significantly different by SNK test
(Table 5). No significant interactions were found for freshly squeezed (samples
selected 1 and 4) F1,11=1.001 and vitamin C (samples selected 1 and 5) F1,11=1.969.
For this last attribute no significant difference was found among assessors for the most
different samples (1 and 5) F1,11= 0.886. This data shows that for these two attributes
there was an agreement among assessors. This being so, interactions (Table 4) could
be attributed to the similarity among samples rather than to different criteria used by
judges.
The means of attributes which showed significant differences among samples
are presented in Table 5. Sample 1 presented the higher mean scores for the
attributes: citrus terpens (75.3), vitamin C (65.9) and marmalade (46.4); sample 2 had

the higher mean for plastic (66.9); and sample 6 had the maximum mean value for
woody (61.4) and syrup (72.2). As regards samples 3, 4 and 5, even though neither of
them presented a maximum nor a minimum value for any attribute, all of them shared
the maximum value for freshly squeezed and candy while 4 and 5 also shared the
maximum for powder juice and pungency. These results are in accordance with triangle
tests (Table 3).
Aroma Profiling
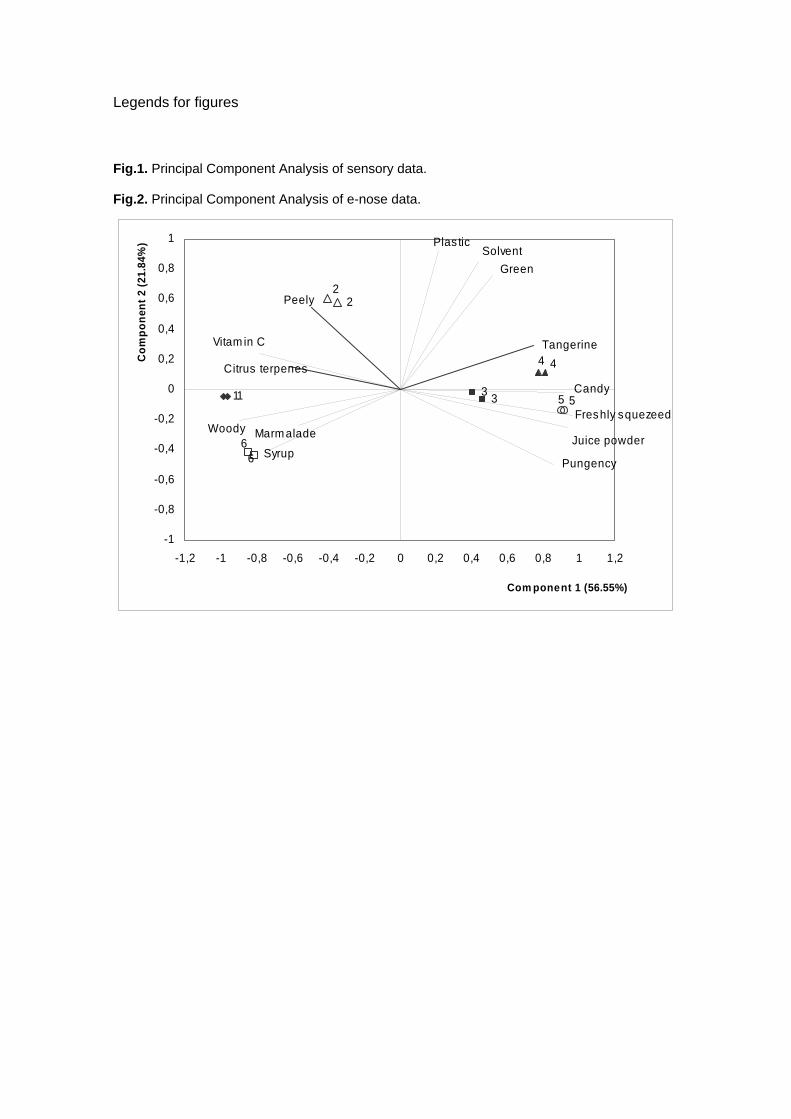
PCA explains 93.5% of the variance among samples with the first three
components; the biplot of Principal Component 1 (PC1) vs. Principal Component 2
(PC2) is shown in Fig. 1. The most important attributes which compose PC1 are juice
powder, freshly squeezed, pungency and candy opposite to woody, syrup and vitamin
C; and PC2 is defined by plastic, solvent and green.
Three different clusters were formed; samples 3, 4 and 5 (MD-sucrose (40%),
MD-sucrose (5%)-lactose (21%), MD-sucrose (10%) were grouped and described by
the attributes juice powder, freshly squeezed, candy, tangerine and pungency.
Samples 6 and 1 (MD-trehalose and MD) had mainly the aromas woody, marmalade,
syrup, citrus terpens, and vitamin C. Finally, sample 2 (MD-gum arabic) was
characterized by solvent, plastic, peely and green. Samples 4 and 5 are grouped one
more time as shown in Table 5 and in the triangle test (Table 3).
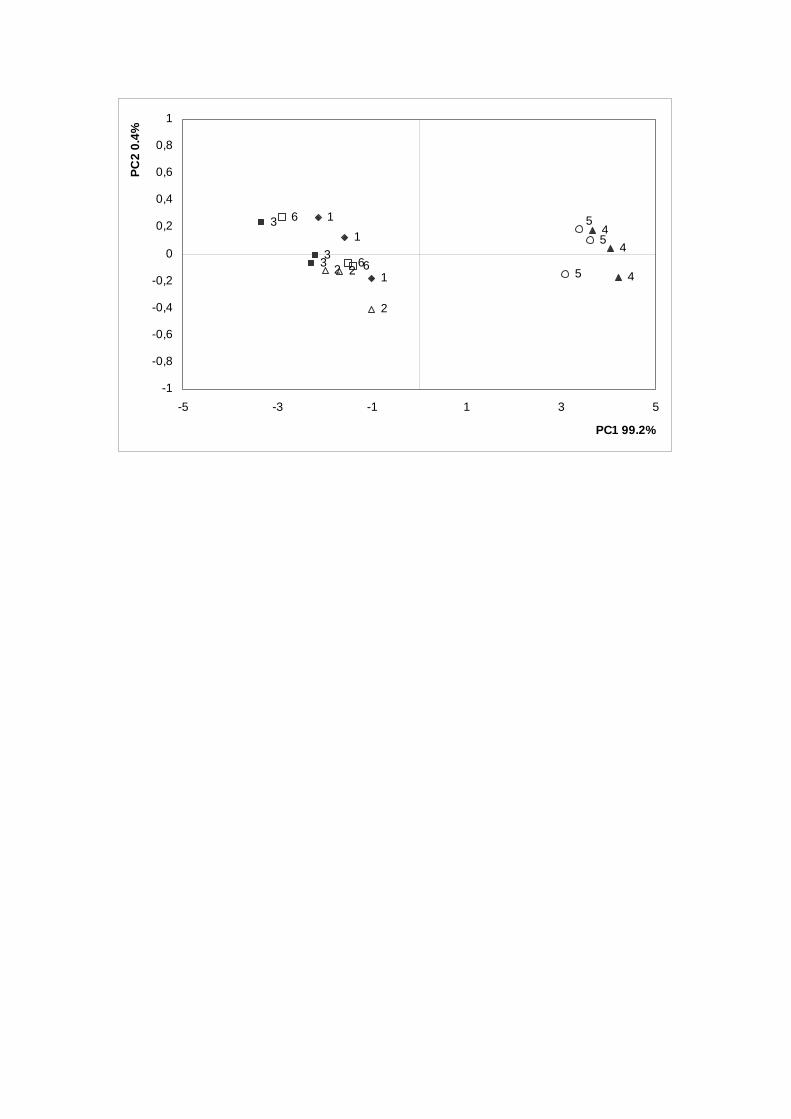
E-nose
PCA performed with data obtained by the E-nose explains 99.2% of the
variance among samples with the first component (Fig.2). Only two clusters can be
observed: samples 4 and 5 are grouped together while the rest of the samples (1, 2, 3
and 6) cannot be discriminated, forming a whole different group.
DISCUSSION
Samples 4 and 5 are perceived as similar using either sensory analysis or e-
nose evaluation. Both powder samples contained sucrose in low concentrations (5 and
10%, respectively) and the same amount of encapsulated aroma (18%) in their
composition; in addition sample 4 contained lactose in its matrix (21%) but, apparently,
lactose would not be contributing to the differential volatile retention during spray drying
process. The e-nose could not detect any differences among samples 1, 2, 3 and 6. On
the other hand, according to the sensory analysis, samples 4 and 5 were grouped
together with sample 3 (Fig.1). These three samples were described by the same
attributes but differed in the mean intensity of the descriptors mentioned, being sample
3 the one with the lowest intensity for powder juice, pungency, tangerine, solvent and
plastic. Sample 3 also had sucrose in its composition, but in a higher concentration
(40%) and had a smaller aroma fraction (13%).
The human nose was able to discriminate samples 1 and 6 from the rest (Fig.
1), describing them by the same attributes; however the e-nose did not find significant
differences. These two samples (1 and 6) differed in matrix composition as well as in
aroma proportion (sample 1: 72% maltodextrin, no disaccharide, 16% aroma; sample
6: 40% maltodextrin, 40% trehalose, 13% aroma). Finally, sample 2 was found different
from all the rest (Fig. 1); this sample contained the most aroma (20%) and gum arabic
instead of a disaccharide.
A difference between the human and e-nose is the pungency sensation
measured only by sensory analysis. This sensation is mediated not by smell fibres, but
by other chemo sensitive fibres as trigeminal nerve branches. Some compounds which
are perceived as being purely olfactory (e.g. butyl acetate, a fruity odour) can elicit
activity in the trigeminal nerve without creating sensations of burning or stinging (Cain,
1974). Electrophysiological and psychophysical evidence indicate that odours at
concentrations lower than those generally considered to be non-irritating can stimulate
both olfactory and trigeminal chemo receptors, and this stimulation can contribute to
the perceived odour intensity (Maruniak, 1988; Delwiche, 2004). Since pungency is
only detected by human nose this perception could contribute to differentiate both
measurements (human and e-nose).
As regards substitution of sucrose by trehalose in the matrix composition, it was
noted that samples 3 and 6 (MD-sucrose, MD-trehalose) had different aroma profiles
suggesting that different volatiles are retained during spray drying according to the
sugar used in the encapsulating matrix (sucrose or trehalose). Komes et al. (2005)
studied the influence of the addition of trehalose or sucrose on the retention of volatiles
in dehydrated apricot puree (foam-mat drying and freeze drying) and found that the
best retention of aroma compounds was obtained when trehalose was added. It is to
be noted, however, that in present work we used spray drying and also the volatile
composition of orange flavour is likely to be quite different from that of apricot flavour.
CONCLUSIONS
Sensory analysis proved to be a more sensitive tool than the e-nose for
grouping and describing the orange encapsulated flavours. Although both methods
produced “coherent” results, by sensory analysis samples were discriminated more
sharply. In addition, sensory analysis has the advantage that it can “name” the
difference, this can not be done with the e-nose.
As expected, the composition of the matrix likely influenced the type and the
amount of volatiles retained, as suggested by the PCA analysis. In this way, by
changing the matrix composition used for aroma encapsulation different aromatic
profiles can be obtained, which will give as a result different products. For example, if
attributes such as freshly squeezed, pungency, tangerine, candy and juice powder are
desired in the final aromatic profile of an orange flavoured product, then the matrix
used for encapsulation should include sucrose. On the other hand, if woody or
marmalade notes are desired in the final product, trehalose should be used in the
encapsulating matrix. Citrus notes are obtained by using a MD and modified starch
matrix while a matrix with MD and gum arabic would be recommended for a product in
which peely and green attributes are desired.
ACKNOWLEDGEMENTS
This work was funded by FonCyT (SeCyT) of Argentina (Project PICT Nº 9-
31951). The authors would like to thank the sensory panel for their collaboration in this
work and Cargill incorporated (Wayzata MN U.S.A.) for donating the trehalose
used in this study.
REFERENCES
ASTM 1977. Manual on Sensory Testing and Methods, STP 434, pp. 39-40. American
Society for Testing and Materials, Philadelphia, PA.
Baby, R., Cabezas, M., Calviño, A., Tomasi, O. & Walsöe de Reca, N. E. 1999.
Quantitative evaluation of aromatic additives employing an electronic nose with
sensors and a sensorial panel. In 6th International Symposium Olfaction and
Electronic Nose (ISOEN'99). Proceedings, pp.305 – 308, Tübingen, Germany.
Bhandari, B.R. & Hartel, R.W. 2005. Phase transitions during food powder production
and powder stability. In C. Onwulata, R.P. Konstance (Eds), Encapsulated and
Food Powder. pp 261-292. Marcel Dekker.
Beristain, C.I., Azuara, E. & Vernon-Carter, E. J. 2002. Effect of water activity on the
stability to oxidation of spray dried encapsulated orange peel oil using mesquite
gum as wall material. Journal of Food Science, 67, 206-211.

Busso Casati, C., Schebor, C., Zamora, M. C. & Chirife, J. 2006. Glass transition
temperatures and some physical and sensory changes in stored spray-dried
encapsulated flavours. LWT - Food Science and Technology. In press.
Cain, W.S.1974. Contribution of the trigeminal nerve to perceived odour magnitude.
Annals of the New York Academy of Sciences. 237(0), 28-34.
Delwiche, J. 2004. The impact of perceptual interactions on perceived flavour. Food
Quality and Preference. 15, 137–146.
Komes, D., Lovric, T., Kovacevic Ganic, K., & Gracin, L. 2003. Study of trehalose
addition on aroma retention in dehydrated strawberry puree. Food Technology.
Biotechnology. 41, 2, 111-119.
Komes, D., Lovric, T., Kovacevic Ganic, K., Gajdos Kljusturic, J., & Banovic, M. 2005.
Trehalose improves flavour retention in dehydrated apricot puree. International
Journal of Food Science and Technology. 40, 425-435.
Lawless, H. T., & Heyman, H.1998. Sensory Evaluation of Food. pp 58-60, Chapman &
Hall, New York, USA.
Maruniak, J. A. 1988. The sense of smell. In J. R. Piggot (Ed.), Sensory analysis of
foods, pp. 25–68. Elsevier, New York.
Meilgaard, M., Civille, G., & Carr, B. 1991. Sensory Evaluation Techniques, 2nd ed. p
88, CRC Press, Boca Raton, FL.
Menting, L. C., Hoogstad, B. & Thiejssen, H.A.C. 1970. Aroma retention during the
drying of liquid foods. Journal of Food Technology, 13, 265-280.
Mitrovics J., Hulmer H., Noetzel G., Weimar U. & Göpel W. 1997. Design of a Hybrid
Modular Sensor System for Gas and Odour Analysis. Proceedings
Transducers, p 1-4, Chicago.
Roos, Y. 1995. Phase Transitions in Food. Academic Press, N.Y., USA.
Roos, Y., & Karel, M. (1991). Phase transition of mixtures of amorphous
polysaccharides and sugars. Biotechnol. Progress, 7, 49-53.
Stone, H. & Sidel, J.L. 1993. Sensory Evaluation Practices. Second Edition, Elsevier
Academic Press. USA.
Tang, C., Hsieh, F., Heymann, H. & Huff, H. E. 1999. Analyzing and correlating
instrumental and sensory data: a multivariate study of physical properties of
cooked wheat noodles. Journal of Food Quality, 22, 193-211.
Thijseen, H.A.C., 1971. Flavour retention in drying preconcentrated food liquids. J.
Appl. Chem. Biotechnol., 21, 372-377.
Wright, J. 1995. Essential Oils. In Food Flavourings Second Edition. (P. A Ashurst,
ed.), pp 54,55 - 310, Blackie Academic and Professional, Chapman & Hall,
Glasgow, Scotland.
Zamora, M.C. & Guirao, M. 2002. Analyzing the contribution of orally perceived
attributes to the flavour of wine. Food Quality and Preference 13, 5, 275-283.

Table 1: Composition (% dry basis) of spray dried flavours
Sample Maltodextrin Modified starch Sucrose Gum
arabic Lactose Trehalose Aroma
1 78 5 - - - - 16 2 72 - - 8 - - 20 3 40 4 40 - - - 13 4 50 6 5 - 21 - 18 5 64 7 10 - - - 18 6 40 4 - - - 40 13

Table 2. Definition, attribute and standard recipe used by the trained panel to describe
orange flavours.
Attribute Standard recipe Definition Control Sample
Freshly squeezed Filter paper soaked in pure orange essence oil (“Fresh orange”, Firmenich, Argentina), placed in a sealed glass flask.
Aroma evocative of natural, fresh, recently prepared orange juice.
3
Juice powder 50 g of juice powder (“orange”, Tang, Argentina) reconstituted in 100 ml of distilled water.
Related to the aroma of orange juice obtained from reconstituted juice powder.
5
Citrus terpens Filter paper soaked in Gamma terpinene essence oil; (“Gamma terpinene”, IFF, Argentina) placed in a sealed glass flask.
Aroma associated to strong, piercing, citric smell.
1
Vitamin C Orange flavoured Vitamin C (Redoxón, Argentina)
Related to the aroma of medicine and vitamin complex.
1
Tangerine 5 g of juice powder (“Tangerine”, Clight, Argentina) reconstituted in 100 ml of distilled water.
Aromatics related to tangerine juice. 2
Candy Humidified orange flavoured acid candy (Sugus, Argentina) placed in a sealed glass flask.
Characteristic odour of orange candy. 3
Solvent 10 g of juice powder (“Tangerine”, Clight, Argentina) reconstituted in 50 ml of distilled water.
Aroma associated to solvent and paint.
2
Plastic Fresh orange juice placed in a plastic recipient, heated for 2 minutes in a microwave oven and stored at room temperature.
Aroma associated to plastic containers.
2
Peely Filter paper soaked in pure orange essence oil (“Orange peel”, Ledesma, Argentina), placed in a sealed glass flask.
Aromatics associated to orange peel No control could be established.
Marmalade Orange juice, peel and sugar heated at 85ºC for 60 min.
Aromatics associated to marmalade. No control could be established.
Woody Filter paper soaked in orange pure essence oil (“Valencia Orange”, Ledesma, Argentina), placed in a sealed glass flask.
Suggestive of the odour of tree bark. 6
Pungency Orange flavoured, effervescent antacid salts (Uvasal, Argentina).
Tingling sensation on the surface of the nose mucosa.
4
Green No standard was used. Characteristic odour of unripe orange. 2
Syrup No standard was used. Sweet 6
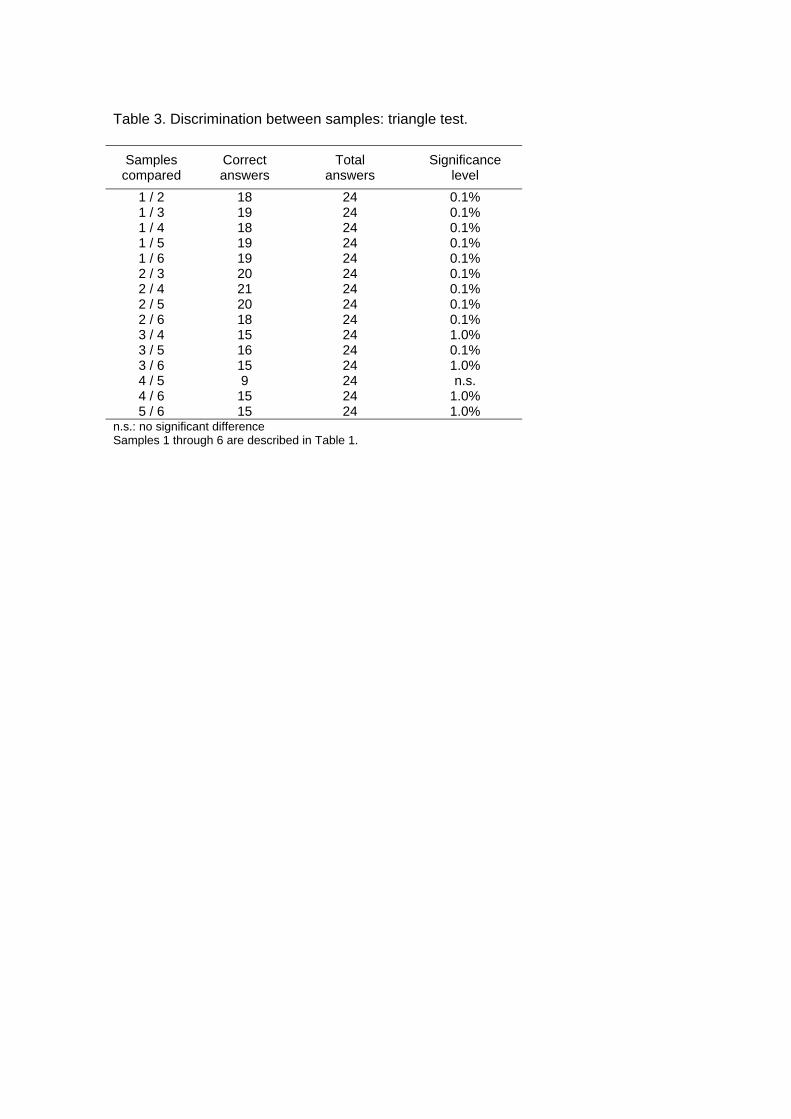
Table 3. Discrimination between samples: triangle test.
Samples compared
Correct answers
Total answers
Significance level
1 / 2 18 24 0.1% 1 / 3 19 24 0.1% 1 / 4 18 24 0.1% 1 / 5 19 24 0.1% 1 / 6 19 24 0.1% 2 / 3 20 24 0.1% 2 / 4 21 24 0.1% 2 / 5 20 24 0.1% 2 / 6 18 24 0.1% 3 / 4 15 24 1.0% 3 / 5 16 24 0.1% 3 / 6 15 24 1.0% 4 / 5 9 24 n.s. 4 / 6 15 24 1.0% 5 / 6 15 24 1.0%
n.s.: no significant difference Samples 1 through 6 are described in Table 1.
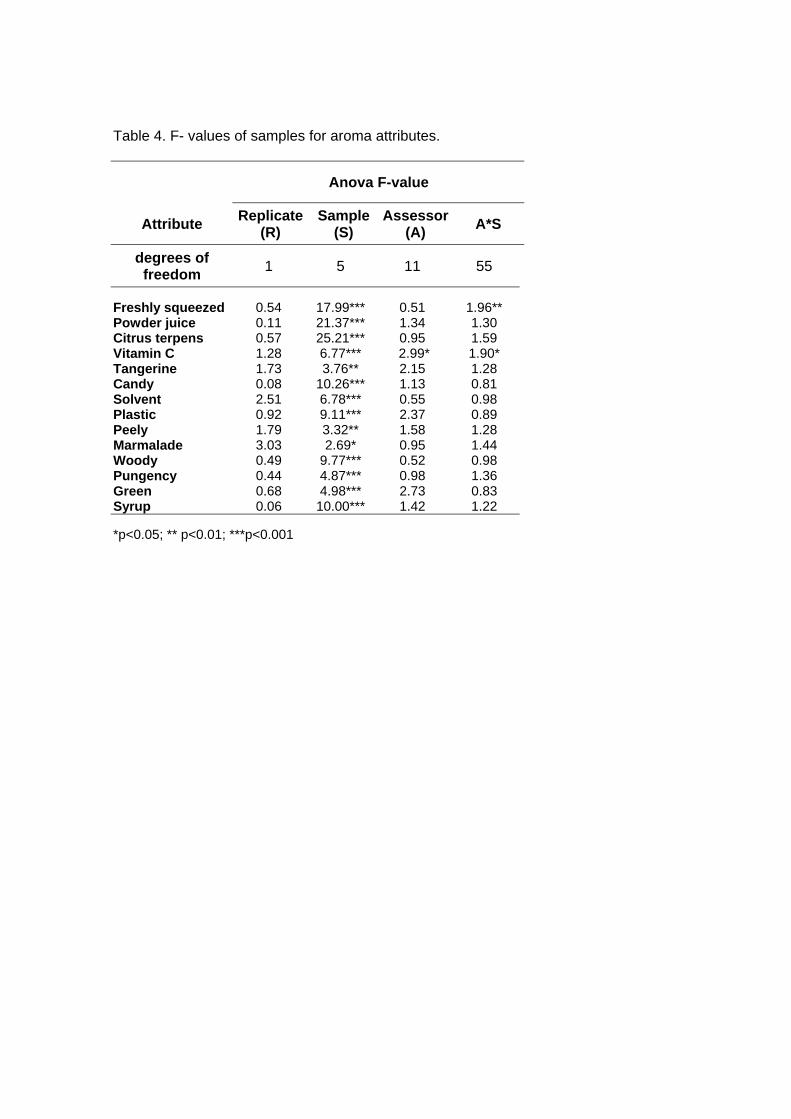
Table 4. F- values of samples for aroma attributes.
Anova F-value
Attribute Replicate (R)
Sample (S)
Assessor(A) A*S
degrees of freedom 1 5 11 55
Freshly squeezed 0.54 17.99*** 0.51 1.96** Powder juice 0.11 21.37*** 1.34 1.30 Citrus terpens 0.57 25.21*** 0.95 1.59 Vitamin C 1.28 6.77*** 2.99* 1.90* Tangerine 1.73 3.76** 2.15 1.28 Candy 0.08 10.26*** 1.13 0.81 Solvent 2.51 6.78*** 0.55 0.98 Plastic 0.92 9.11*** 2.37 0.89 Peely 1.79 3.32** 1.58 1.28 Marmalade 3.03 2.69* 0.95 1.44 Woody 0.49 9.77*** 0.52 0.98 Pungency 0.44 4.87*** 0.98 1.36 Green 0.68 4.98*** 2.73 0.83 Syrup 0.06 10.00*** 1.42 1.22 *p<0.05; ** p<0.01; ***p<0.001
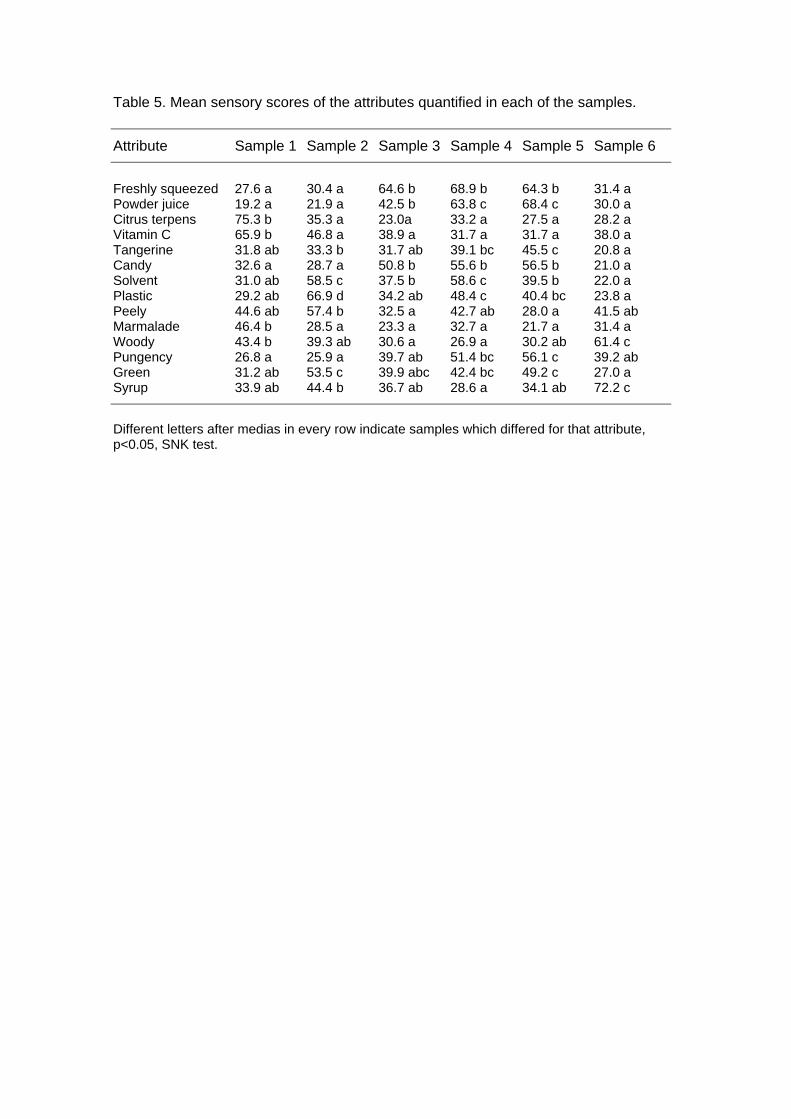
Table 5. Mean sensory scores of the attributes quantified in each of the samples. Attribute Sample 1 Sample 2 Sample 3 Sample 4 Sample 5 Sample 6
Freshly squeezed 27.6 a 30.4 a 64.6 b 68.9 b 64.3 b 31.4 a Powder juice 19.2 a 21.9 a 42.5 b 63.8 c 68.4 c 30.0 a Citrus terpens 75.3 b 35.3 a 23.0a 33.2 a 27.5 a 28.2 a Vitamin C 65.9 b 46.8 a 38.9 a 31.7 a 31.7 a 38.0 a Tangerine 31.8 ab 33.3 b 31.7 ab 39.1 bc 45.5 c 20.8 a Candy 32.6 a 28.7 a 50.8 b 55.6 b 56.5 b 21.0 a Solvent 31.0 ab 58.5 c 37.5 b 58.6 c 39.5 b 22.0 a Plastic 29.2 ab 66.9 d 34.2 ab 48.4 c 40.4 bc 23.8 a Peely 44.6 ab 57.4 b 32.5 a 42.7 ab 28.0 a 41.5 ab Marmalade 46.4 b 28.5 a 23.3 a 32.7 a 21.7 a 31.4 a Woody 43.4 b 39.3 ab 30.6 a 26.9 a 30.2 ab 61.4 c Pungency 26.8 a 25.9 a 39.7 ab 51.4 bc 56.1 c 39.2 ab Green 31.2 ab 53.5 c 39.9 abc 42.4 bc 49.2 c 27.0 a Syrup 33.9 ab 44.4 b 36.7 ab 28.6 a 34.1 ab 72.2 c
Different letters after medias in every row indicate samples which differed for that attribute, p<0.05, SNK test.
Legends for figures
Fig.1. Principal Component Analysis of sensory data.
Fig.2. Principal Component Analysis of e-nose data.
Freshly squezeed
Tangerine
Pungency
1
2
3 3
Juice powder
Citrus terpenes
Vitam in C
Candy
SolventPlas tic
Peely
Marm aladeWoody
Green
Syrup
1
2
4 4
5 5
66
-1
-0,8
-0,6
-0,4
-0,2
0
0,2
0,4
0,6
0,8
1
-1,2 -1 -0,8 -0,6 -0,4 -0,2 0 0,2 0,4 0,6 0,8 1 1,2
Com ponent 1 (56.55%)
Com
pone
nt 2
(21.
84%
)
1
1
1
66
6
2
223
3
3
4
44
5
55
-1
-0,8
-0,6
-0,4
-0,2
0
0,2
0,4
0,6
0,8
1
-5 -3 -1 1 3 5
PC1 99.2%
PC2
0.4%