arsenal: an arsenal of 'r' functions for large-scale
TRANSCRIPT

Package ‘arsenal’June 4, 2021
Title An Arsenal of 'R' Functions for Large-Scale StatisticalSummaries
Version 3.6.3
Date 2021-06-04
Description An Arsenal of 'R' functions for large-scale statistical summaries,which are streamlined to work within the latest reporting tools in 'R' and'RStudio' and which use formulas and versatile summary statistics for summarytables and models. The primary functions include tableby(), a Table-1-likesummary of multiple variable types 'by' the levels of one or more categoricalvariables; paired(), a Table-1-like summary of multiple variable types paired acrosstwo time points; modelsum(), which performs simple model fits on one or more endpointsfor many variables (univariate or adjusted for covariates);freqlist(), a powerful frequency table across many categorical variables;comparedf(), a function for comparing data.frames; andwrite2(), a function to output tables to a document.
Suggests broom (>= 0.7.1), magrittr, rmarkdown, testthat, xtable,pander, survival (>= 2.43-1), coin, pROC, MASS, splines, rpart,yaml, geepack
Depends R (>= 3.4.0), stats (>= 3.4.0)
Imports knitr (>= 1.29), utils (>= 3.4.0)
URL https://github.com/mayoverse/arsenal,
https://cran.r-project.org/package=arsenal,
https://mayoverse.github.io/arsenal/
BugReports https://github.com/mayoverse/arsenal/issues
VignetteBuilder knitr
License GPL (>= 2)
RoxygenNote 7.1.1
LazyData true
Encoding UTF-8
NeedsCompilation no
1
2 R topics documented:
Author Ethan Heinzen [aut, cre],Jason Sinnwell [aut],Elizabeth Atkinson [aut],Tina Gunderson [aut],Gregory Dougherty [aut],Patrick Votruba [ctb],Ryan Lennon [ctb],Andrew Hanson [ctb],Krista Goergen [ctb],Emily Lundt [ctb],Brendan Broderick [ctb],Maddie McCullough [art]
Maintainer Ethan Heinzen <[email protected]>
Repository CRAN
Date/Publication 2021-06-04 21:50:02 UTC
R topics documented:arsenal . . . . . . . . . . . . . . . . . . . . . . . . . . . . . . . . . . . . . . . . . . . . 3arsenal-defunct . . . . . . . . . . . . . . . . . . . . . . . . . . . . . . . . . . . . . . . 4arsenal-deprecated . . . . . . . . . . . . . . . . . . . . . . . . . . . . . . . . . . . . . 5arsenal_table . . . . . . . . . . . . . . . . . . . . . . . . . . . . . . . . . . . . . . . . 5as.data.frame.freqlist . . . . . . . . . . . . . . . . . . . . . . . . . . . . . . . . . . . . 6as.data.frame.modelsum . . . . . . . . . . . . . . . . . . . . . . . . . . . . . . . . . . 7as.data.frame.tableby . . . . . . . . . . . . . . . . . . . . . . . . . . . . . . . . . . . . 8comparedf . . . . . . . . . . . . . . . . . . . . . . . . . . . . . . . . . . . . . . . . . . 9comparedf.control . . . . . . . . . . . . . . . . . . . . . . . . . . . . . . . . . . . . . . 10comparedf.tolerances . . . . . . . . . . . . . . . . . . . . . . . . . . . . . . . . . . . . 12diffs . . . . . . . . . . . . . . . . . . . . . . . . . . . . . . . . . . . . . . . . . . . . . 14formulize . . . . . . . . . . . . . . . . . . . . . . . . . . . . . . . . . . . . . . . . . . 15freq.control . . . . . . . . . . . . . . . . . . . . . . . . . . . . . . . . . . . . . . . . . 17freqlist . . . . . . . . . . . . . . . . . . . . . . . . . . . . . . . . . . . . . . . . . . . . 18freqlist.internal . . . . . . . . . . . . . . . . . . . . . . . . . . . . . . . . . . . . . . . 19internal.functions . . . . . . . . . . . . . . . . . . . . . . . . . . . . . . . . . . . . . . 20keep.labels . . . . . . . . . . . . . . . . . . . . . . . . . . . . . . . . . . . . . . . . . 21labels . . . . . . . . . . . . . . . . . . . . . . . . . . . . . . . . . . . . . . . . . . . . 22mdy.Date . . . . . . . . . . . . . . . . . . . . . . . . . . . . . . . . . . . . . . . . . . 23mockstudy . . . . . . . . . . . . . . . . . . . . . . . . . . . . . . . . . . . . . . . . . . 25modelsum . . . . . . . . . . . . . . . . . . . . . . . . . . . . . . . . . . . . . . . . . . 26modelsum.control . . . . . . . . . . . . . . . . . . . . . . . . . . . . . . . . . . . . . . 28modelsum.family . . . . . . . . . . . . . . . . . . . . . . . . . . . . . . . . . . . . . . 29modelsum.internal . . . . . . . . . . . . . . . . . . . . . . . . . . . . . . . . . . . . . 30NA.operations . . . . . . . . . . . . . . . . . . . . . . . . . . . . . . . . . . . . . . . . 30padjust . . . . . . . . . . . . . . . . . . . . . . . . . . . . . . . . . . . . . . . . . . . . 31paired . . . . . . . . . . . . . . . . . . . . . . . . . . . . . . . . . . . . . . . . . . . . 32paired.control . . . . . . . . . . . . . . . . . . . . . . . . . . . . . . . . . . . . . . . . 33paired.internal . . . . . . . . . . . . . . . . . . . . . . . . . . . . . . . . . . . . . . . . 34
arsenal 3
selectall . . . . . . . . . . . . . . . . . . . . . . . . . . . . . . . . . . . . . . . . . . . 35summary.comparedf . . . . . . . . . . . . . . . . . . . . . . . . . . . . . . . . . . . . . 36summary.freqlist . . . . . . . . . . . . . . . . . . . . . . . . . . . . . . . . . . . . . . 37summary.modelsum . . . . . . . . . . . . . . . . . . . . . . . . . . . . . . . . . . . . . 38summary.tableby . . . . . . . . . . . . . . . . . . . . . . . . . . . . . . . . . . . . . . 40tableby . . . . . . . . . . . . . . . . . . . . . . . . . . . . . . . . . . . . . . . . . . . . 42tableby.control . . . . . . . . . . . . . . . . . . . . . . . . . . . . . . . . . . . . . . . 44tableby.internal . . . . . . . . . . . . . . . . . . . . . . . . . . . . . . . . . . . . . . . 47tableby.stats . . . . . . . . . . . . . . . . . . . . . . . . . . . . . . . . . . . . . . . . . 49tableby.stats.internal . . . . . . . . . . . . . . . . . . . . . . . . . . . . . . . . . . . . 52write2 . . . . . . . . . . . . . . . . . . . . . . . . . . . . . . . . . . . . . . . . . . . . 53write2.internal . . . . . . . . . . . . . . . . . . . . . . . . . . . . . . . . . . . . . . . . 56write2specific . . . . . . . . . . . . . . . . . . . . . . . . . . . . . . . . . . . . . . . . 57yaml . . . . . . . . . . . . . . . . . . . . . . . . . . . . . . . . . . . . . . . . . . . . . 58%nin% . . . . . . . . . . . . . . . . . . . . . . . . . . . . . . . . . . . . . . . . . . . . 59
Index 60
arsenal An Arsenal of ’R’ Functions for Large-Scale Statistical Summaries
Description
An Arsenal of ’R’ functions for large-scale statistical summaries, which are streamlined to workwithin the latest reporting tools in ’R’ and ’RStudio’ and which use formulas and versatile summarystatistics for summary tables and models.
Details
The package download, NEWS, and README are available on CRAN: https://cran.r-project.org/package=arsenal
Functions
Below are listed some of the most widely used functions available in arsenal:
tableby: Summary statistics of a set of independent variables by a categorical variable.
paired: Summary statistics of a set of independent variables paired across two timepoints.
modelsum: Fit models over each of a set of independent variables with a response variable.
freqlist: Approximate the output from SAS’s PROC FREQ procedure when using the /list optionof the TABLE statement.
comparedf: Compare two data.frames and report any differences between them, much like SAS’sPROC COMPARE procedure.
write2word, write2html, write2pdf: Functions to output tables to a single Word, HTML, or PDFdocument.
write2: Functions to output tables to a single document. (Also the S3 backbone behind the write2*functions.)
4 arsenal-defunct
keep.labels: Keep the 'label' attribute on an R object when subsetting.
formulize: A shortcut to generate one-, two-, or many-sided formulas.
mdy.Date and Date.mdy: Convert numeric dates for month, day, and year to Date object, and viceversa.
is.Date: Test if an object is a date.
%nin%: Test for "not in".
allNA and includeNA: some useful functions for dealing with NAs.
Data
mockstudy: Mock study data for examples.
Examples
library(arsenal)
arsenal-defunct Defunct functions in arsenal
Description
Details about defunct functions in arsenal
Arguments
x, y See comparedf.
... Other arguments.
Details
comparison.control was renamed to comparedf.control in version 3.0.0.
compare.data.frame was renamed to comparedf in version 3.0.0.
length.tableby was removed in version 2.0.0.
includeNA.character and includeNA.numeric were removed in version 2.0.0 and replaced witha default method.
rangeTime was removed in version 1.5.0.
See Also
arsenal-deprecated, comparedf
arsenal-deprecated 5
arsenal-deprecated Deprecated functions in arsenal
Description
Details about deprecated functions in arsenal
See Also
arsenal-defunct
arsenal_table arsenal tables with common structure
Description
arsenal tables with common structure
Usage
has_strata(x)
## S3 method for class 'arsenal_table'x[i, j, ...]
## S3 method for class 'arsenal_table'labels(object, ...)
## S3 replacement method for class 'arsenal_table'labels(x) <- value
## S3 method for class 'arsenal_table'print(x, ...)
## S3 method for class 'arsenal_table'merge(x, y, all = FALSE, all.x = all, all.y = all, ...)
## S3 method for class 'freqlist'merge(x, y, all = TRUE, ...)
## S3 method for class 'summary.arsenal_table'print(x,...,format = if (!is.null(x$text) && x$text %in% c("html", "latex")) x$text else
6 as.data.frame.freqlist
"markdown",escape = x$text %nin% c("html", "latex"),width = NULL,min.split = NULL
)
Arguments
x, y, object An object of class "arsenal_table"
i, j A vector to index x with: either names of variables, a numeric vector, or alogical vector of appropriate length. i indexes the x-variables, and j indexes theby-variables.
... Other arguments (only used in print.summary.arsenal_table)
value A list of new labels.all, all.x, all.y
Logicals, denoting which terms to keep if not all are in common.
format Passed to kable: the format for the table. The default here is "markdown".To use the default in kable, pass NULL. If x$text specifies LaTeX or HTMLformatting, that format is used in the table.
escape Passed to kable: should special characters be escaped when printed?
width, min.split
Passed to smart.split for formatting of the "term" column.
See Also
merge, labels
as.data.frame.freqlist
as.data.frame.freqlist
Description
Convert freqlist object to a data.frame.
Usage
## S3 method for class 'freqlist'as.data.frame(x, ..., labelTranslations = NULL, list.ok = FALSE)
as.data.frame.modelsum 7
Arguments
x An object of class "freqlist".
... Arguments to pass to freq.control
labelTranslations
A named list (or vector) where the name is the label in the output to be replacedin the pretty rendering by the character string value for the named element ofthe list, e.g., list(age = "Age(Years)",meansd = "Mean(SD)").
list.ok If the object has multiple by-variables, is it okay to return a list of data.framesinstead of a single data.frame? If FALSE but there are multiple by-variables, awarning is issued.
Value
A data.frame corresponding to the freqlist object.
as.data.frame.modelsum
as.data.frame.modelsum
Description
Coerce a modelsum object to a data.frame.
Usage
## S3 method for class 'modelsum'as.data.frame(x, ..., labelTranslations = NULL, list.ok = FALSE)
Arguments
x A modelsum object.
... Arguments to pass to modelsum.control.labelTranslations
A named list (or vector) where the name is the label in the output to be replacedin the pretty rendering by the character string value for the named element ofthe list, e.g., list(age = "Age(Years)",meansd = "Mean(SD)").
list.ok If the object has multiple by-variables, is it okay to return a list of data.framesinstead of a single data.frame? If FALSE but there are multiple by-variables, awarning is issued.
Value
A data.frame.
8 as.data.frame.tableby
Author(s)
Ethan Heinzen, based on code originally by Greg Dougherty
See Also
modelsum, summary.modelsum
as.data.frame.tableby as.data.frame.tableby
Description
Coerce a tableby object to a data.frame.
Usage
## S3 method for class 'tableby'as.data.frame(x, ..., labelTranslations = NULL, list.ok = FALSE)
Arguments
x A tableby object.
... Arguments to pass to tableby.control.labelTranslations
A named list (or vector) where the name is the label in the output to be replacedin the pretty rendering by the character string value for the named element ofthe list, e.g., list(age = "Age(Years)",meansd = "Mean(SD)").
list.ok If the object has multiple by-variables, is it okay to return a list of data.framesinstead of a single data.frame? If FALSE but there are multiple by-variables, awarning is issued.
Value
A data.frame.
Author(s)
Ethan Heinzen, based on code originally by Greg Dougherty
See Also
tableby, tableby
comparedf 9
comparedf Compare two data.frames and report differences
Description
Compare two data.frames and report any differences between them, much like SAS’s PROC COMPAREprocedure.
Usage
comparedf(x, y, by = NULL, by.x = by, by.y = by, control = NULL, ...)
## S3 method for class 'comparedf'print(x, ...)
Arguments
x, y A data.frame to compare
by, by.x, by.y Which variables are IDs to merge the two data.frames? If set to "row.names",merging will occur over the row.names. If set to NULL (default), merging willoccur row-by-row.
control A list of control parameters from comparedf.control.
... Other arguments, passed to comparedf.control when appropriate.
Author(s)
Ethan Heinzen, adapted from code from Andrew Hanson
See Also
summary.comparedf, comparedf.control, diffs, n.diffs, n.diff.obs
Examples
df1 <- data.frame(id = paste0("person", 1:3), a = c("a", "b", "c"),b = c(1, 3, 4), c = c("f", "e", "d"),row.names = paste0("rn", 1:3), stringsAsFactors = FALSE)
df2 <- data.frame(id = paste0("person", 3:1), a = c("c", "b", "a"),b = c(1, 3, 4), d = paste0("rn", 1:3),row.names = paste0("rn", c(1,3,2)), stringsAsFactors = FALSE)
summary(comparedf(df1, df2))summary(comparedf(df1, df2, by = "id"))summary(comparedf(df1, df2, by = "row.names"))
10 comparedf.control
comparedf.control Control settings for comparedf function
Description
Control tolerance definitions for the comparedf function.
Usage
comparedf.control(tol.logical = "none",tol.num = c("absolute", "percent", "pct"),tol.num.val = sqrt(.Machine$double.eps),int.as.num = FALSE,tol.char = c("none", "trim", "case", "both"),tol.factor = c("none", "levels", "labels"),factor.as.char = FALSE,tol.date = "absolute",tol.date.val = 0,tol.other = "none",tol.vars = "none",max.print.vars = NA,max.print.obs = NA,max.print.diffs.per.var = 10,max.print.diffs = 50,max.print.attrs = NA,...,max.print.diff = 10
)
Arguments
tol.logical, tol.num, tol.char, tol.factor, tol.date, tol.other
A function or one of the shortcut character strings or a list thereof, denoting thetolerance function to use for a given data type. See "details", below.
tol.num.val Numeric; maximum value of differences allowed in numerics (fed to the func-tion given in tol.num).
int.as.num Logical; should integers be coerced to numeric before comparison? DefaultFALSE.
factor.as.char Logical; should factors be coerced to character before comparison? DefaultFALSE.
tol.date.val Numeric; maximum value of differences allowed in dates (fed to the functiongiven in tol.date).
tol.vars Either "none" (the default), denoting that variable names are to be matched as-is, a named vector manually specifying variable names to compare (where the
comparedf.control 11
names correspond to columns of x and the values correspond to columns of y),or a character vector denoting equivalence classes for characters in the variablenames. See "details", below.
max.print.vars Integer denoting maximum number of variables to report in the "variables notshared" and "variables not compared" output. NA will print all differences.
max.print.obs Integer denoting maximum number of not-shared observations to report. NA willprint all differences.
max.print.diffs.per.var, max.print.diffs
Integers denoting the maximum number of differences to report for each variableor overall. NA will print all differences for each variable or overall.
max.print.attrs
Integers denoting the maximum number of non-identical attributes to report.NAwill print all differences.
... Other arguments (not in use at this time).
max.print.diff Deprecated.
Details
The following character strings are accepted:
• tol.logical = "none": compare logicals exactly as they are.
• tol.num = "absolute": compare absolute differences in numerics.
• tol.num = "percent", tol.num = "pct" compare percent differences in numerics.
• tol.char = "none": compare character strings exactly as they are.
• tol.char = "trim": left-justify and trim all trailing white space.
• tol.char = "case": allow differences in upper/lower case.
• tol.char = "both": combine "trim" and "case".
• tol.factor = "none": match both character labels and numeric levels.
• tol.factor = "levels": match only the numeric levels.
• tol.factor = "labels": match only the labels.
• tol.date = "absolute": compare absolute differences in dates.
• tol.other = "none": expect objects of other classes to be exactly identical.
A list with names mapped to x can be used to specify tolerances by variable. One unnamed elementis supported as the default.
tol.vars: If not set to "none" (the default) or a named vector, the tol.vars argument is a charactervector denoting equivalence classes for the characters in the variable names. A single character inthis vector means to replace that character with "". All other strings in this vector are split bycharacter and replaced by the first character in the string.
E.g., a character vector c("._","aA"," ") would denote that the dot and underscore are equivalent(to be translated to a dot), that "a" and "A" are equivalent (to be translated to "a"), and that spacesshould be removed.
The special character string "case" in this vector is the same as specifying paste0(letters,LETTERS).
12 comparedf.tolerances
Value
A list containing the necessary parameters for the comparedf function.
Author(s)
Ethan Heinzen
See Also
comparedf, comparedf.tolerances, summary.comparedf
Examples
cntl <- comparedf.control(tol.num = "pct", # calculate percent differencestol.vars = c("case", # ignore case
"._", # set all underscores to dots."e") # remove all letter e's
)
cntl <- comparedf.control(tol.char = list("none", # the defaultx1 = "case", # be case-insensitive for the variable "x1"x2 = function(x, y) tol.NA(x, y, x != y | y == "NA") # a custom-defined tolerance
))
comparedf.tolerances comparedf tolerances
Description
Internal functions defining tolerances for the comparedf.control function. To create your owntolerance definitions, see the vignette.
Usage
tol.NA(x, y, idx)
tol.num.absolute(x, y, tol)
tol.num.percent(x, y, tol)
tol.num.pct(x, y, tol)
tol.factor.none(x, y)
tol.factor.levels(x, y)
comparedf.tolerances 13
tol.factor.labels(x, y)
tol.char.both(x, y)
tol.char.case(x, y)
tol.char.trim(x, y)
tol.char.none(x, y)
tol.date.absolute(x, y, tol)
tol.logical.none(x, y)
tol.other.none(x, y)
Arguments
x, y vectors of the appropriate lengths and types.
idx A logical vector of appropriate length.
tol A numeric tolerance
Details
tol.NA takes as differences between two vectors any elements which are NA in one but not theother, or which are non-NA in both and TRUE in idx. It is useful for handling NAs in customtolerance functions.
Value
A logical vector of length equal to that of x and y, where TRUE denotes a difference between x andy, and FALSE denotes no difference between x and y.
Author(s)
Ethan Heinzen
See Also
comparedf.control, comparedf
14 diffs
diffs Extract differences
Description
Extract differences (diffs()), number of differences (n.diffs()), or number of not-shared obser-vations (n.diff.obs()) from a comparedf object.
Usage
n.diff.obs(object, ...)
## S3 method for class 'comparedf'n.diff.obs(object, ...)
## S3 method for class 'summary.comparedf'n.diff.obs(object, ...)
n.diffs(object, ...)
## S3 method for class 'comparedf'n.diffs(object, ...)
## S3 method for class 'summary.comparedf'n.diffs(object, ...)
diffs(object, ...)
## S3 method for class 'comparedf'diffs(object,what = c("differences", "observations"),vars = NULL,...,by.var = FALSE
)
## S3 method for class 'summary.comparedf'diffs(object,what = c("differences", "observations"),vars = NULL,...,by.var = FALSE
)
formulize 15
Arguments
object An object of class comparedf or summary.comparedf.... Other arguments (not in use at this time).what Should differences or the not-shared observations be returned?vars A character vector of variable names to subset the results to.by.var Logical: should the number of differences by variable be reported, or should all
differences be reported (the default).
Author(s)
Ethan Heinzen
See Also
comparedf summary.comparedf
formulize formulize
Description
A shortcut to generate one-, two-, or many-sided formulas from vectors of variable names.
Usage
formulize(y = "",x = "",...,data = NULL,collapse = "+",collapse.y = collapse,escape = FALSE
)
Arguments
y, x, ... Character vectors, names, or calls to be collapsed (by "+") and put left-to-rightin the formula. If data is supplied, these can also be numeric, denoting whichcolumn name to use. See examples.
data An R object with non-null column names.collapse How should terms be collapsed? Default is addition.collapse.y How should the y-terms be collapsed? Default is addition. Also accepts the spe-
cial string "list", which combines them into a multiple-left-hand-side formula,for use in other functions.
escape A logical indicating whether character vectors should be coerced to names (thatis, whether names with spaces should be surrounded with backticks or not)
16 formulize
Author(s)
Ethan Heinzen
See Also
reformulate
Examples
## two-sided formulaf1 <- formulize("y", c("x1", "x2", "x3"))
## one-sided formulaf2 <- formulize(x = c("x1", "x2", "x3"))
## multi-sided formulaf3 <- formulize("y", c("x1", "x2", "x3"), c("z1", "z2"), "w1")
## can use numerics for column namesdata(mockstudy)f4 <- formulize(y = 1, x = 2:4, data = mockstudy)
## mix and matchf5 <- formulize(1, c("x1", "x2", "x3"), data = mockstudy)
## get an interactionf6 <- formulize("y", c("x1*x2", "x3"))
## get only interactionsf7 <- formulize("y", c("x1", "x2", "x3"), collapse = "*")
## no interceptf8 <- formulize("y", "x1 - 1")f9 <- formulize("y", c("x1", "x2", "-1"))
## LHS as a list to use in arsenal functionsf10 <- formulize(c("y1", "y2", "y3"), c("x", "z"), collapse.y = "list")
## use in an lmf11 <- formulize(2, 3:4, data = mockstudy)summary(lm(f11, data = mockstudy))
## using non-syntactic names or calls (like reformulate example)f12 <- formulize(as.name("+-"), c("`P/E`", "`% Growth`"))f12 <- formulize("+-", c("P/E", "% Growth"), escape = TRUE)
f <- Surv(ft, case) ~ a + bf13 <- formulize(f[[2]], f[[3]])
freq.control 17
freq.control Control settings for freqlist function
Description
Control test and summary settings for the freqlist function.
Usage
freq.control(sparse = FALSE,single = FALSE,dupLabels = FALSE,digits.count = 0L,digits.pct = 2L,...,digits = NULL
)
Arguments
sparse a logical value indicating whether to keep rows with counts of zero. The defaultis FALSE (drop zero-count rows).
single logical, indicating whether to collapse results created using a strata variable intoa single table for printing
dupLabels logical: should labels which are the same as the row above be printed? Thedefault (FALSE) more closely approximates PROC FREQ output from SAS, wherea label carried down from the row above is left blank.
digits.count Number of decimal places for count values.
digits.pct Number of decimal places for percents.
... additional arguments.
digits A deprecated argument
Value
A list with settings to be used within the freqlist function.
Author(s)
Ethan Heinzen
See Also
freqlist, summary.freqlist, freqlist.internal
18 freqlist
freqlist freqlist
Description
Approximate the output from SAS’s PROC FREQ procedure when using the /list option of theTABLE statement.
Usage
freqlist(object, ...)
## S3 method for class 'table'freqlist(object,na.options = c("include", "showexclude", "remove"),strata = NULL,labelTranslations = NULL,control = NULL,...
)
## S3 method for class 'formula'freqlist(formula,data,subset,na.action,na.options = c("include", "showexclude", "remove"),strata = NULL,labelTranslations = NULL,control = NULL,addNA,exclude,drop.unused.levels,...
)
Arguments
object An R object, usually of class "table" or class "xtabs"
... additional arguments. In the formula method, these are passed to the tablemethod. These are also passed to freq.control
na.options a character string indicating how to handling missing values: "include" (in-clude values with NAs in counts and percentages), "showexclude" (show NAsbut exclude from cumulative counts and all percentages), "remove" (removevalues with NAs); default is "include".
freqlist.internal 19
strata (formerly groupBy) an optional character string specifying a variable(s) to usefor grouping when calculating cumulative counts and percentages. summary.freqlistwill also separate by grouping variable for printing. Note that this is differentfrom modelsum and tableby, which take bare column names (and only one, atthat!)
labelTranslations
an optional character string (or list) of labels to use for variable levels whensummarizing. Names will be matched appropriately.
control control parameters to handle optional settings within freqlist. See freq.control
formula, data, subset, na.action, addNA, exclude, drop.unused.levels
Arguments passed to xtabs.
Value
An object of class c("freqlist","arsenal_table")
Author(s)
Tina Gunderson, with revisions by Ethan Heinzen
See Also
arsenal_table, summary.freqlist, freq.control, freqlist.internal, table, xtabs
Examples
# load mockstudy datadata(mockstudy)tab.ex <- table(mockstudy[c("arm", "sex", "mdquality.s")], useNA = "ifany")noby <- freqlist(tab.ex, na.options = "include")summary(noby)
# show the top 6 rows' frequencies and percentshead(summary(sort(noby, decreasing = TRUE)[c(1:4, 6)]))
withby <- freqlist(tab.ex, strata = c("arm","sex"), na.options = "showexclude")summary(withby)
freqlist.internal Helper functions for freqlist
Description
A set of helper functions for freqlist.
20 internal.functions
Usage
is.freqlist(x)
is.summary.freqlist(x)
## S3 method for class 'summary.freqlist'head(x, n = 6L, ...)
## S3 method for class 'summary.freqlist'tail(x, n = 6L, ...)
## S3 method for class 'freqlist'sort(x, decreasing = FALSE, ...)
Arguments
x A freqlist object.
n A single integer. See head or tail for more details
... Other arguments.
decreasing Should the sort be increasing or decreasing?
Details
Note that sort() has to recalculate cumulative statistics. Note also that the reordering of rows willalso affect which labels are duplicates; you may also want to consider using dupLabels=TRUE infreq.control().
See Also
merge.freqlist, arsenal_table, sort, freqlist, summary.freqlist, freq.control,
internal.functions Internal Functions
Description
Internal Functions
Usage
smart.split(string, width = Inf, min.split = -Inf)
replace2(x, list, values)
keep.labels 21
Arguments
string A character vector
width Either Inf or NULL to specify no splitting, or a positive integer giving the largestallowed string length.
min.split Either -Inf or NULL to specify no lower bound on the string length, or a positiveinteger giving the minimum string length.
x vector
list an index vector
values replacement values
Value
For smart.split, a list of the same length as string, with each element being the "intelligently"split string.
For replace2, a vector with the proper values replaced.
See Also
replace
keep.labels Keep Labels
Description
Keep the 'label' attribute on an R object when subsetting. loosen.labels allows the 'label'attribute to be lost again.
Usage
keep.labels(x, ...)
## S3 method for class 'data.frame'keep.labels(x, ...)
## Default S3 method:keep.labels(x, ...)
## S3 method for class 'keep_labels'x[...]
## S3 replacement method for class 'keep_labels'x[i] <- value
loosen.labels(x, ...)
22 labels
## S3 method for class 'data.frame'loosen.labels(x, ...)
## Default S3 method:loosen.labels(x, ...)
Arguments
x An R object
... Other arguments (not in use at this time).
i, value See [<-.
Value
A copy of x with a "keep_labels" class appended on or removed. Note that for the data.framemethod, only classes on the columns are changed; the data.frame won’t have an extra class ap-pended. This is different from previous versions of arsenal.
Author(s)
Ethan Heinzen
See Also
labels
labels Labels
Description
Assign and extract the 'label' attribute on an R object. set_labels is the same as labels(x)<-value but returns x for use in a pipe chain. set_attr is the same as attr(x,which) <-valuebut returns x for use in a pipe chain.
Usage
## S3 method for class 'data.frame'labels(object, ...)
## S3 method for class 'keep_labels'labels(object, ...)
labels(x) <- value
## S3 replacement method for class 'keep_labels'
mdy.Date 23
labels(x) <- value
## Default S3 replacement method:labels(x) <- value
## S3 replacement method for class 'data.frame'labels(x) <- value
set_labels(x, value)
set_attr(x, which, value)
Arguments
... Other arguments (not in use at this time).
x, object An R object.
value A vector or list containing labels to assign. Labels are assigned based on names,if available; otherwise, they’re assigned in order. Can pass NULL to remove alllabels.
which See attr<-
Details
The data.frame methods put labels on and extract labels from the columns of object.
Value
The labels of object, or object with new labels.
Author(s)
Ethan Heinzen
See Also
keep.labels
mdy.Date Convert numeric dates to Date object, and vice versa
Description
Convert numeric dates for month, day, and year to Date object, and vice versa.
24 mdy.Date
Usage
mdy.Date(month, day, year, yearcut = 120)
Date.mdy(date)
is.Date(x)
Arguments
month integer, month (1-12).
day integer, day of the month (1-31, depending on the month).
year integer, either 2- or 4-digit year. If two-digit number, will add 1900 onto it,depending on range.
yearcut cutoff for method to know if to convert to 4-digit year.
date A date value.
x An object.
Details
Test if an object is a date.
More work may need to be done with yearcut and 2-digit years. Best to give a full 4-digit year.
Value
mdy.Date returns a Date object, and Date.mdy returns a list with integer values for month, day, andyear. is.Date returns a single logical value.
See Also
Date, DateTimeClasses
Examples
mdy.Date(9, 2, 2013)
tmp <- mdy.Date(9, 2, 2013)Date.mdy(tmp)
is.Date(tmp)
mockstudy 25
mockstudy Mock study data for examples
Description
Mock clinical study data for examples to test data manipulation and statistical functions. The func-tion muck_up_mockstudy() is used in examples for comparedf.
Usage
mockstudy
muck_up_mockstudy()
Format
A data frame with 1499 observations on the following 15 variables:
case a numeric identifier-patient ID
age age in years
arm treatment arm divided into 3 groups, character string
sex a factor with levels Male Female
race self-reported race/ethnicity, character string
fu.time survival or censoring time in years
fu.stat censoring status; 1=censor, 2=death
ps integer, ECOG performance score
hgb numeric, hemoglobin count
bmi numeric, body mass index, kg/m^2
alk.phos numeric, alkaline phosphatase
ast numeric, aspartate transaminase
mdquality.s integer, LASA QOL 0=Clinically Deficient, 1=Not Clinically Deficient
age.ord an ordered factor split of age, with levels 10-19 < 20-29 < 30-39 < 40-49 < 50-59 <60-69 < 70-79 < 80-89
An object of class data.frame with 1499 rows and 14 columns.
Examples
data(mockstudy)str(mockstudy)
26 modelsum
modelsum Fit models over each of a set of independent variables with a responsevariable
Description
Fit and summarize models for each independent (x) variable with a response variable (y), withoptions to adjust by variables for each model.
Usage
modelsum(formula,family = "gaussian",data,adjust = NULL,na.action = NULL,subset = NULL,weights = NULL,id,strata,control = NULL,...
)
Arguments
formula an object of class formula; a symbolic description of the variables to be mod-eled. See "Details" for more information.
family similar mechanism to glm, where the model to be fit is driven by the family. Op-tions include: binomial, gaussian, survival, poisson, negbin, clog, and ordinal.These can be passed as a string, as a function, or as a list resulting from a callto one of the functions. See modelsum.family for details on survival, ordinal,negbin, and clog families.
data an optional data.frame, list or environment (or object coercible by as.data.frameto a data frame) containing the variables in the model. If not found in data,the variables are taken from environment(formula), typically the environmentfrom which modelsum is called.
adjust an object of class formula or a list of formulas, listing variables to adjust by inall models. Specify as a one-sided formula, like: ~Age+ Sex. If a list, the namesare used for the summary function. Unadjusted models can be specified as ~ 1or as a list: list(Unadjusted = NULL).
na.action a function which indicates what should happen when the data contain NAs. Thedefault (NULL) is to use the defaults of lm, glm, or coxph, depending on thefamily specifications.
modelsum 27
subset an optional vector specifying a subset of observations (rows of data) to be usedin the results. If strata is missing, this works as vector of logicals or an index;otherwise, it should be a logical vector.
weights an optional vector specifying the weights to apply to each data observation (rowsof data)
id A vector to identify clusters. Only used for relrisk at this time.
strata a vector of strata to separate model summaries by an additional group. Notethat for families like "clog", the "usual" strata term to indicate subject groupingsshould be given in the adjust argument.
control control parameters to handle optional settings within modelsum. Arguments formodelsum.control can be passed to modelsum via the ... argument, but if acontrol object and ... arguments are both supplied, the latter are used. Seemodelsum.control for other details.
... additional arguments to be passed to internal modelsum functions.
Value
An object with class c("modelsum","arsenal_table")
Author(s)
Jason Sinnwell, Patrick Votruba, Beth Atkinson, Gregory Dougherty, and Ethan Heinzen, adaptedfrom SAS Macro of the same name
See Also
arsenal_table, modelsum.control, summary.modelsum, modelsum.internal, formulize
Examples
data(mockstudy)
tab1 <- modelsum(bmi ~ sex + age, data = mockstudy)summary(tab1, text = TRUE)
tab2 <- modelsum(alk.phos ~ arm + ps + hgb, adjust = ~ age + sex,family = "gaussian", data = mockstudy)
summary(tab2, text = TRUE)
summary(tab2, show.intercept = FALSE, text = TRUE)
tab2.df <- as.data.frame(tab2)
tab2.df[1:5,]
28 modelsum.control
modelsum.control Control settings for modelsum function
Description
Control test and summary settings for modelsum function.
Usage
modelsum.control(digits = 3L,digits.ratio = 3L,digits.p = 3L,format.p = TRUE,show.adjust = TRUE,show.intercept = TRUE,conf.level = 0.95,ordinal.stats = c("OR", "CI.lower.OR", "CI.upper.OR", "p.value", "Nmiss"),binomial.stats = c("OR", "CI.lower.OR", "CI.upper.OR", "p.value", "concordance",
"Nmiss"),gaussian.stats = c("estimate", "std.error", "p.value", "adj.r.squared", "Nmiss"),poisson.stats = c("RR", "CI.lower.RR", "CI.upper.RR", "p.value", "Nmiss"),negbin.stats = c("RR", "CI.lower.RR", "CI.upper.RR", "p.value", "Nmiss"),relrisk.stats = c("RR", "CI.lower.RR", "CI.upper.RR", "p.value", "Nmiss"),clog.stats = c("OR", "CI.lower.OR", "CI.upper.OR", "p.value", "concordance", "Nmiss"),survival.stats = c("HR", "CI.lower.HR", "CI.upper.HR", "p.value", "concordance",
"Nmiss"),stat.labels = list(),...
)
Arguments
digits Numeric, denoting the number of digits after the decimal point for beta coeffi-cients and standard errors.
digits.ratio Numeric, denoting the number of digits after the decimal point for ratios, e.g.OR, RR, HR.
digits.p Numeric, denoting the number of digits for p-values. See "Details", below.format.p Logical, denoting whether to format p-values. See "Details", below.show.adjust Logical, denoting whether to show adjustment terms.show.intercept Logical, denoting whether to show intercept terms.conf.level Numeric, giving the confidence level.ordinal.stats, binomial.stats, survival.stats, gaussian.stats, poisson.stats, negbin.stats, clog.stats, relrisk.stats
Character vectors denoting which stats to show for the various model types.stat.labels A named list of labels for all the stats used above.... Other arguments (not in use at this time).
modelsum.family 29
Details
If format.p is FALSE, digits.p denotes the number of significant digits shown. The p-values willbe in exponential notation if necessary. If format.p is TRUE, digits.p will determine the numberof digits after the decimal point to show. If the p-value is less than the resulting number of places,it will be formatted to show so.
Value
A list with settings to be used within the modelsum function.
See Also
modelsum, summary.modelsum, modelsum.internal
modelsum.family Family functions for modelsum
Description
A set of family functions for modelsum.
Usage
survival()
ordinal(method = c("logistic", "probit", "loglog", "cloglog", "cauchit"))
negbin(link = c("log", "identity", "sqrt"))
clog()
relrisk(link = "log")
Arguments
method See MASS::polr.
link See MASS::glm.nb.
Value
A list, in particular with element family.
See Also
family, coxph, polr
30 NA.operations
modelsum.internal Helper functions for modelsum
Description
A set of helper functions for modelsum.
Usage
is.modelsum(x)
is.summary.modelsum(x)
na.modelsum(object, ...)
Arguments
x A modelsum object.object A data.frame resulting from evaluating a modelsum formula.... Other arguments, or a vector of indices for extracting.
Value
na.modelsum returns a subsetted version of object (with attributes).
See Also
arsenal_table
NA.operations Some functions to handle NAs
Description
allNA tests if all elements are NA, and includeNA sets the NAs in a character vector or factor to anexplicit label.
Usage
allNA(x)
includeNA(x, label, ...)
## S3 method for class 'factor'includeNA(x, label = "(Missing)", first = FALSE, ...)
## Default S3 method:includeNA(x, label = "(Missing)", ...)
padjust 31
Arguments
x An objectlabel A character string denoting the label to set NAs to.... Other arguments (not in use at this time).first Logical; should the new label be the first level?
Author(s)
Ethan Heinzen
See Also
is.na, anyNA
padjust Adjust P-values for Multiple Comparisons
Description
Adjust P-values for Multiple Comparisons
Usage
padjust(p, method, n, ...)
## Default S3 method:padjust(p, method, n, ...)
## S3 method for class 'tableby'padjust(p, method, n, suffix = " (adjusted for multiple comparisons)", ...)
## S3 method for class 'summary.tableby'padjust(p, method, n, suffix = " (adjusted for multiple comparisons)", ...)
Arguments
p An object.method correction method. Can be abbreviated.n number of comparisons, must be at least length(p); only set this (to non-
default) when you know what you are doing!... Other arguments.suffix A suffix to add to the footnotes indicating that the tests were adjusted.
See Also
p.adjust, modpval.tableby, tests.tableby
32 paired
paired Summary Statistics of a Set of Independent Variables Paired AcrossTwo Timepoints
Description
Summarize one or more variables (x) by a paired time variable (y). Variables on the right side ofthe formula, i.e. independent variables, are summarized by the two time points on the left of theformula. Optionally, an appropriate test is performed to test the distribution of the independentvariables across the time points.
Usage
paired(formula,data,id,na.action,subset = NULL,strata,control = NULL,...
)
Arguments
formula an object of class formula of the form time ~ var1 + .... See "Details" formore information.
data an optional data frame, list or environment (or object coercible by as.data.frameto a data frame) containing the variables in the model. If not found in data,the variables are taken from environment(formula), typically the environmentfrom which the function is called.
id The vector giving IDs to match up data for the same subject across two time-points.
na.action a function which indicates what should happen when the data contain NAs. Thedefault is na.paired("in.both"). See na.paired for more details
subset an optional vector specifying a subset of observations (rows of data) to be usedin the results. Works as vector of logicals or an index.
strata a vector of strata to separate summaries by an additional group.
control control parameters to handle optional settings within paired. Two aspects ofpaired are controlled with these: test options of RHS variables and x variablesummaries. Arguments for paired.control can be passed to paired via the... argument, but if a control object and ... arguments are both supplied, thelatter are used. See paired.control for more details.
... additional arguments to be passed to internal paired functions or paired.control.
paired.control 33
Details
Do note that this function piggybacks off of tableby quite heavily, so there is no summary.pairedfunction (for instance).
These tests are accepted:
• paired.t: a paired t-test.
• mcnemar: McNemar’s test.
• signed.rank: a signed rank test.
• sign.test: a sign test.
• notest: no test is performed.
Value
An object with class c("paired","tableby","arsenal_table")
Author(s)
Jason Sinnwell, Beth Atkinson, Ryan Lennon, and Ethan Heinzen
See Also
arsenal_table, paired.control, tableby, formulize, selectall
paired.control Control settings for paired function
Description
Control test and summary settings for the paired function.
Usage
paired.control(diff = TRUE,numeric.test = "paired.t",cat.test = "mcnemar",ordered.test = "signed.rank",date.test = "paired.t",mcnemar.correct = TRUE,signed.rank.exact = NULL,signed.rank.correct = TRUE,...
)
34 paired.internal
Arguments
diff logical, telling paired whether to calculate a column of differences betweentime points.
numeric.test name of test for numeric RHS variables in paired: paired.t, signed.rank, sign.test.
cat.test name of test for categorical variables: mcnemar
ordered.test name of test for ordered variables: signed.rank, sign.test
date.test name of test to perform for date variables: paired.t, signed.rank, sign.testmcnemar.correct, signed.rank.exact, signed.rank.correct
Options for statistical tests. See wilcox.test and mcnemar.test for details.
... Arguments passed to tableby.control
Details
Note that (with the exception of total) all arguments to tableby.control are accepted in thisfunction (in fact, this function passes everything through to tableby.control). However, there aredifferent defaults for the statistical tests (shown here). For details on the other arguments, pleasesee the help page for tableby.control.
Value
A list with settings to be used within the paired function.
Author(s)
Ethan Heinzen
See Also
paired, tableby, tableby.control, summary.tableby
paired.internal Helper functions for paired
Description
A set of helper functions for paired.
Usage
na.paired(missings = c("in.both", "fill", "asis"))
Arguments
missings A character string denoting which action to take. See "Details", below.
selectall 35
Details
All methods subset out any NA time points or IDs. "in.both" (the default) subsets the data.frameto individuals who appear at both time points. "fill" adds explicit missings for the people missingsecond time points. "asis" does nothing to add or remove missings.
Value
na.paired returns a function used to subset data.frames in paired.
See Also
tableby.internal
selectall Make a column for "select all" input
Description
Make a column for "select all" input
Usage
selectall(...)
as.selectall(x)
## S3 method for class 'selectall'as.matrix(x, ...)
## S3 method for class 'selectall'x[i, j, drop = FALSE]
## S3 method for class 'selectall'is.na(x)
is.selectall(x)
Arguments
... Named arguments of the same length. These should be logical, numeric (0/1) ora factor with two levels.
x An object of class "selectall"
i, j, drop Arguments to ‘[.matrix‘
See Also
tableby, paired
36 summary.comparedf
Examples
d <- data.frame(grp = rep(c("A", "B"), each = 5))d$s <- selectall(
`Option 1` = c(rep(1, 4), rep(0, 6)),`Option 2` = c(0, 1, 0, 0, 0, 1, 1, 1, 0, 0),`Option 3` = 1,`Option 4` = 0
)summary(tableby(grp ~ s, data = d), text = TRUE)
summary.comparedf The summary method for a comparedf object
Description
Print a more detailed output of the comparedf object.
Usage
## S3 method for class 'comparedf'summary(object, ..., show.attrs = FALSE)
## S3 method for class 'summary.comparedf'print(x, ..., format = "pandoc")
Arguments
object An object of class "comparedf", as made by the comparedf S3 method.
... Other arguments passed to comparedf.control. In print, these are passed tokable.
show.attrs Logical, denoting whether to show the actual attributes which are different. For(e.g.) factors with lots of levels, this can make the tables quite wide, so thisfeature is FALSE by default.
x An object returned by the summary.comparedf function.
format Passed to kable: the format for the table. The default here is "pandoc". To usethe default in kable, pass NULL.
Value
An object of class "summary.comparedf" is returned.
See Also
comparedf, comparedf.control
summary.freqlist 37
summary.freqlist summary.freqlist
Description
Summarize the freqlist object.
Usage
## S3 method for class 'freqlist'summary(object, ..., labelTranslations = NULL, title = NULL)
## S3 method for class 'summary.freqlist'as.data.frame(x, ..., list.ok = FALSE)
Arguments
object an object of class freqlist
... For summary.freqlist, these are passed to as.data.frame.freqlist (andhence to freq.control). For the print method, these are additional argumentspassed to the kable function.
labelTranslations
A named list (or vector) where the name is the label in the output to be replacedin the pretty rendering by the character string value for the named element ofthe list, e.g., list(age = "Age(Years)",meansd = "Mean(SD)").
title Title/caption for the table, defaulting to NULL (no title). Passed to kable. Canbe length > 1 if the more than one table is being printed.
x An object of class summary.freqlist.
list.ok If the object has multiple by-variables, is it okay to return a list of data.framesinstead of a single data.frame? If FALSE but there are multiple by-variables, awarning is issued.
Value
An object of class "summary.freqlist" (invisibly for the print method).
Author(s)
Tina Gunderson, with major revisions by Ethan Heinzen
See Also
freqlist, table, xtabs, kable, freq.control, freqlist.internal
38 summary.modelsum
Examples
# load mockstudy datadata(mockstudy)tab.ex <- table(mockstudy[c("arm", "sex", "mdquality.s")], useNA = "ifany")noby <- freqlist(tab.ex, na.options = "include")summary(noby)withby <- freqlist(tab.ex, strata = c("arm","sex"), na.options = "showexclude")summary(withby)summary(withby, dupLabels = TRUE)
summary.modelsum Summarize a modelsum object.
Description
Format the information in object as a table using Pandoc coding or plain text, and cat it to stdout.
Usage
## S3 method for class 'modelsum'summary(object,...,labelTranslations = NULL,text = FALSE,title = NULL,term.name = "",adjustment.names = FALSE
)
## S3 method for class 'summary.modelsum'as.data.frame(x,...,text = x$text,term.name = x$term.name,adjustment.names = x$adjustment.names,width = NULL,min.split = NULL,list.ok = FALSE
)
Arguments
object A modelsum object.
summary.modelsum 39
... For summary.modelsum, other arguments passed to as.data.frame.modelsum.For as.data.frame.summary.modelsum, "width" and "min.split" are passedto smart.split. For printing the summary object, these are passed to bothas.data.frame.summary.modelsum and kable.
labelTranslations
A named list (or vector) where the name is the label in the output to be replacedin the pretty rendering by the character string value for the named element ofthe list, e.g., list(age = "Age(Years)",meansd = "Mean(SD)").
text An argument denoting how to print the summary to the screen. Default is FALSE(show markdown output). TRUE and NULL output a text-only version, with thelatter avoiding all formatting. "html" uses the HTML tag <strong> instead ofthe markdown formatting, and "latex" uses the LaTeX command \textbf.
title Title/caption for the table, defaulting to NULL (no title). Passed to kable. Canbe length > 1 if the more than one table is being printed.
term.name A character vector denoting the column name for the "terms" column. It shouldbe the same length as the number of tables or less (it will get recycled if needed).The special value TRUE will use the y-variable’s label for each table.
adjustment.names
Logical, denoting whether the names of the adjustment models should be printed.
x An object of class "summary.modelsum".
width Passed to smart.split for formatting of the "term" column.
min.split Passed to smart.split for formatting of the "term" column.
list.ok If the object has multiple by-variables, is it okay to return a list of data.framesinstead of a single data.frame? If FALSE but there are multiple by-variables, awarning is issued.
Value
An object of class "summary.modelsum"
Author(s)
Ethan Heinzen, based on code originally by Greg Dougherty
See Also
modelsum, as.data.frame.modelsum
40 summary.tableby
summary.tableby The summary method for a tableby object
Description
The summary method for a tableby object, which is a pretty rendering of a tableby object into apublication-quality results table in R Markdown, and can render well in text-only.
Usage
## S3 method for class 'tableby'summary(object,...,labelTranslations = NULL,text = FALSE,title = NULL,pfootnote = FALSE,term.name = ""
)
## S3 method for class 'summary.tableby'as.data.frame(x,...,text = x$text,pfootnote = x$pfootnote,term.name = x$term.name,width = NULL,min.split = NULL,list.ok = FALSE
)
Arguments
object An object of class "tableby", made by the tableby function.
... For summary.tableby, other arguments passed to as.data.frame.tableby.For printing the summary object, these are passed to both as.data.frame.summary.tablebyand kable.
labelTranslations
A named list (or vector) where the name is the label in the output to be replacedin the pretty rendering by the character string value for the named element ofthe list, e.g., list(age = "Age(Years)",meansd = "Mean(SD)").
text An argument denoting how to print the summary to the screen. Default is FALSE(show markdown output). TRUE and NULL output a text-only version, with thelatter avoiding all formatting. "html" uses the HTML tag <strong> instead ofthe markdown formatting, and "latex" uses the LaTeX command \textbf.
summary.tableby 41
title Title/caption for the table, defaulting to NULL (no title). Passed to kable. Canbe length > 1 if the more than one table is being printed.
pfootnote Logical, denoting whether to put footnotes describing the tests used to gener-ate the p-values. Alternatively, "html" to surround the outputted footnotes with<li>.
term.name A character vector denoting the column name for the "terms" column. It shouldbe the same length as the number of tables or less (it will get recycled if needed).The special value TRUE will use the y-variable’s label for each table.
x An object of class "summary.tableby".
width Passed to smart.split for formatting of the "term" column.
min.split Passed to smart.split for formatting of the "term" column.
list.ok If the object has multiple by-variables, is it okay to return a list of data.framesinstead of a single data.frame? If FALSE but there are multiple by-variables, awarning is issued.
Value
An object of class summary.tableby
Author(s)
Ethan Heinzen, based on code by Gregory Dougherty, Jason Sinnwell, Beth Atkinson, adapted fromSAS Macros written by Paul Novotny and Ryan Lennon
See Also
tableby.control, tableby
Examples
set.seed(100)## make 3+ categories for responsensubj <- 90mdat <- data.frame(Response=sample(c(1,2,3),nsubj, replace=TRUE),
Sex=sample(c("Male", "Female"), nsubj,replace=TRUE),Age=round(rnorm(nsubj,mean=40, sd=5)),HtIn=round(rnorm(nsubj,mean=65,sd=5)))
## allow default summaries on RHS variablesout <- tableby(Response ~ Sex + Age + HtIn, data=mdat)summary(out, text=TRUE)labels(out)labels(out) <- c(Age="Age (years)", HtIn="Height (inches)")summary(out, stats.labels=c(meansd="Mean-SD", q1q3 = "Q1-Q3"), text=TRUE)
42 tableby
tableby Summary Statistics of a Set of Independent Variables by a CategoricalVariable
Description
Summarize one or more variables (x) by a categorical variable (y). Variables on the right side ofthe formula, i.e. independent variables, are summarized by the levels of a categorical variable onthe left of the formula. Optionally, an appropriate test is performed to test the distribution of theindependent variables across the levels of the categorical variable.
Usage
tableby(formula,data,na.action,subset = NULL,weights = NULL,strata,control = NULL,...
)
Arguments
formula an object of class formula; a symbolic description of the variables to be sum-marized by the group, or categorical variable, of interest. See "Details" for moreinformation. To only view overall summary statistics, a one-sided formula canbe used.
data an optional data frame, list or environment (or object coercible by as.data.frameto a data frame) containing the variables in the model. If not found in data,the variables are taken from environment(formula), typically the environmentfrom which the function is called.
na.action a function which indicates what should happen when the data contain NAs. Thedefault is na.tableby(TRUE) if there is a by-variable, and na.tableby(FALSE)if there is not. This schema thus includes observations with NAs in x variables,but removes those with NA in the categorical group variable and strata (if used).
subset an optional vector specifying a subset of observations (rows of data) to be usedin the results. Works as vector of logicals or an index.
weights a vector of weights. Using weights will disable statistical tests.
strata a vector of strata to separate summaries by an additional group.
control control parameters to handle optional settings within tableby. Two aspects oftableby are controlled with these: test options of RHS variables across levels ofthe categorical grouping variable, and x variable summaries within the grouping
tableby 43
variable. Arguments for tableby.control can be passed to tableby via the... argument, but if a control object and ... arguments are both supplied, thelatter are used. See tableby.control for more details.
... additional arguments to be passed to internal tableby functions or tableby.control.
Details
The group variable (if any) is categorical, which could be an integer, character, factor, or orderedfactor. tableby makes a simple summary of the counts within the k-levels of the independentvariables on the right side of the formula. Note that unused levels are dropped.
The data argument allows data.frames with label attributes for the columns, and those labels willbe used in the summary methods for the tableby class.
The independent variables are a mixture of types: categorical (discrete), numeric (continuous), andtime to event (survival). These variables are split by the levels of the group variable (if any), thensummarized within those levels, specific to the variable type. A statistical test is performed tocompare the distribution of the independent variables across the levels of the grouping variable.
The tests differ by the independent variable type, but can be specified explicitly in the formulastatement or in the control function. These tests are accepted:
• anova: analysis of variance test; the default test for continuous variables. When LHS variablehas two levels, equivalent to two-sample t-test.
• kwt: Kruskal-Wallis Rank Test, optional test for continuous variables. When LHS variablehas two levels, equivalent to Wilcoxon test.
• wt: An explicit Wilcoxon test.
• medtest: A median test.
• chisq: chi-square goodness of fit test for equal counts of a categorical variable across cate-gories; the default for categorical or factor variables
• fe: Fisher’s exact test for categorical variables
• trend: trend test for equal distribution of an ordered variable across a categorical variable;the default for ordered factor variables
• logrank: log-rank, the default for time-to-event variables
• notest: no test is performed.
To perform a mixture of asymptotic and rank-based tests on two different continuous variables, anexample formula is: formula = group ~ anova(age) + kwt(height). The test settings in tableby.controlapply to all independent variables of a given type.
The summary statistics reported for each independent variable within the group variable can be setin tableby.control.
Finally, multiple by-variables can be set using list(). See the examples for more details.
Value
An object with class c("tableby","arsenal_table")
44 tableby.control
Author(s)
Jason Sinnwell, Beth Atkinson, Gregory Dougherty, and Ethan Heinzen, adapted from SAS Macroswritten by Paul Novotny and Ryan Lennon
See Also
arsenal_table, anova, chisq.test, tableby.control, summary.tableby, tableby.internal,formulize, selectall
Examples
data(mockstudy)tab1 <- tableby(arm ~ sex + age, data=mockstudy)summary(tab1, text=TRUE)
mylabels <- list(sex = "SEX", age ="Age, yrs")summary(tab1, labelTranslations = mylabels, text=TRUE)
tab3 <- tableby(arm ~ sex + age, data=mockstudy, test=FALSE, total=FALSE,numeric.stats=c("median","q1q3"), numeric.test="kwt")
summary(tab3, text=TRUE)
# multiple LHSsummary(tableby(list(arm, sex) ~ age, data = mockstudy, strata = ps), text = TRUE)
tab.test <- tableby(arm ~ kwt(age) + anova(bmi) + kwt(ast), data=mockstudy)tests(tab.test)
tableby.control Control settings for tableby function
Description
Control test and summary settings for the tableby function.
Usage
tableby.control(test = TRUE,total = TRUE,total.pos = c("after", "before"),test.pname = NULL,numeric.simplify = FALSE,cat.simplify = FALSE,cat.droplevels = FALSE,ordered.simplify = FALSE,date.simplify = FALSE,
tableby.control 45
numeric.test = "anova",cat.test = "chisq",ordered.test = "trend",surv.test = "logrank",date.test = "kwt",selectall.test = "notest",test.always = FALSE,numeric.stats = c("Nmiss", "meansd", "range"),cat.stats = c("Nmiss", "countpct"),ordered.stats = c("Nmiss", "countpct"),surv.stats = c("Nmiss", "Nevents", "medSurv"),date.stats = c("Nmiss", "median", "range"),selectall.stats = c("Nmiss", "countpct"),stats.labels = list(),digits = 3L,digits.count = 0L,digits.pct = 1L,digits.p = 3L,format.p = TRUE,digits.n = 0L,conf.level = 0.95,wilcox.correct = FALSE,wilcox.exact = NULL,chisq.correct = FALSE,simulate.p.value = FALSE,B = 2000,times = 1:5,...
)
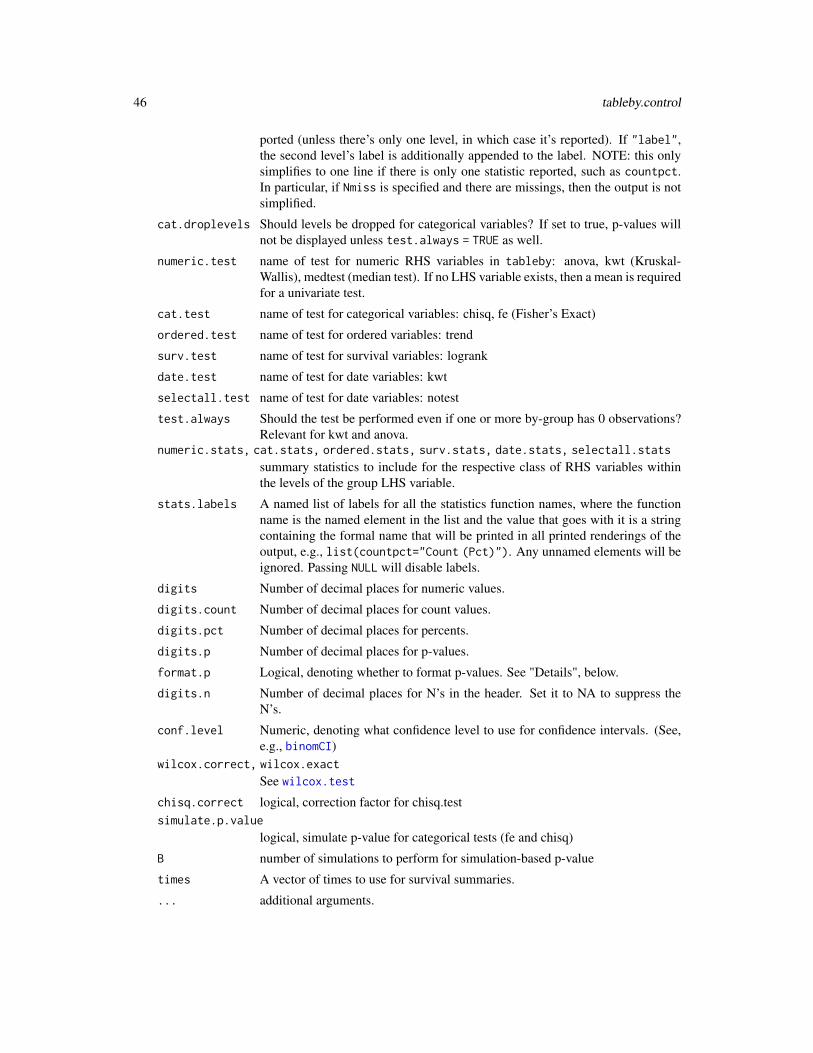
Arguments
test logical, telling tableby whether to perform tests of x variables across levels ofthe group variable.
total logical, telling tableby whether to calculate a column of totals across groupvariable.
total.pos One of "before" or "after", denoting where to put the total column relative tothe by-variable columns.
test.pname character string denoting the p-value column name in summary.tableby. Mod-ifiable also with modpval.tableby.
numeric.simplify, date.simplify
logical, tell tableby whether to condense numeric/date output to a single line.NOTE: this only simplifies to one line if there is only one statistic reported, suchas meansd. In particular, if Nmiss is specified and there are missings, then theoutput is not simplified.
cat.simplify, ordered.simplify
logical, tell tableby whether to remove the first level of the categorical/ordinalvariable if binary. If TRUE, only the summary stats of the second level are re-
46 tableby.control
ported (unless there’s only one level, in which case it’s reported). If "label",the second level’s label is additionally appended to the label. NOTE: this onlysimplifies to one line if there is only one statistic reported, such as countpct.In particular, if Nmiss is specified and there are missings, then the output is notsimplified.
cat.droplevels Should levels be dropped for categorical variables? If set to true, p-values willnot be displayed unless test.always = TRUE as well.
numeric.test name of test for numeric RHS variables in tableby: anova, kwt (Kruskal-Wallis), medtest (median test). If no LHS variable exists, then a mean is requiredfor a univariate test.
cat.test name of test for categorical variables: chisq, fe (Fisher’s Exact)
ordered.test name of test for ordered variables: trend
surv.test name of test for survival variables: logrank
date.test name of test for date variables: kwt
selectall.test name of test for date variables: notest
test.always Should the test be performed even if one or more by-group has 0 observations?Relevant for kwt and anova.
numeric.stats, cat.stats, ordered.stats, surv.stats, date.stats, selectall.stats
summary statistics to include for the respective class of RHS variables withinthe levels of the group LHS variable.
stats.labels A named list of labels for all the statistics function names, where the functionname is the named element in the list and the value that goes with it is a stringcontaining the formal name that will be printed in all printed renderings of theoutput, e.g., list(countpct="Count (Pct)"). Any unnamed elements will beignored. Passing NULL will disable labels.
digits Number of decimal places for numeric values.
digits.count Number of decimal places for count values.
digits.pct Number of decimal places for percents.
digits.p Number of decimal places for p-values.
format.p Logical, denoting whether to format p-values. See "Details", below.
digits.n Number of decimal places for N’s in the header. Set it to NA to suppress theN’s.
conf.level Numeric, denoting what confidence level to use for confidence intervals. (See,e.g., binomCI)
wilcox.correct, wilcox.exact
See wilcox.test
chisq.correct logical, correction factor for chisq.testsimulate.p.value
logical, simulate p-value for categorical tests (fe and chisq)
B number of simulations to perform for simulation-based p-value
times A vector of times to use for survival summaries.
... additional arguments.
tableby.internal 47
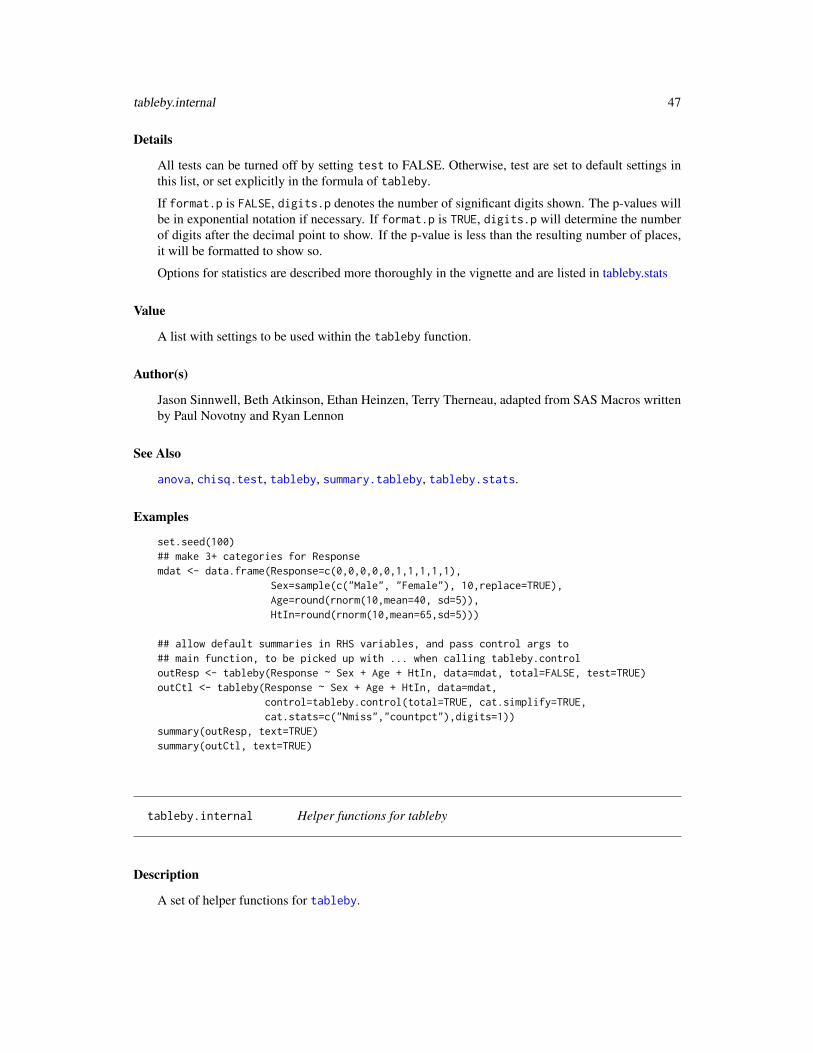
Details
All tests can be turned off by setting test to FALSE. Otherwise, test are set to default settings inthis list, or set explicitly in the formula of tableby.
If format.p is FALSE, digits.p denotes the number of significant digits shown. The p-values willbe in exponential notation if necessary. If format.p is TRUE, digits.p will determine the numberof digits after the decimal point to show. If the p-value is less than the resulting number of places,it will be formatted to show so.
Options for statistics are described more thoroughly in the vignette and are listed in tableby.stats
Value
A list with settings to be used within the tableby function.
Author(s)
Jason Sinnwell, Beth Atkinson, Ethan Heinzen, Terry Therneau, adapted from SAS Macros writtenby Paul Novotny and Ryan Lennon
See Also
anova, chisq.test, tableby, summary.tableby, tableby.stats.
Examples
set.seed(100)## make 3+ categories for Responsemdat <- data.frame(Response=c(0,0,0,0,0,1,1,1,1,1),
Sex=sample(c("Male", "Female"), 10,replace=TRUE),Age=round(rnorm(10,mean=40, sd=5)),HtIn=round(rnorm(10,mean=65,sd=5)))
## allow default summaries in RHS variables, and pass control args to## main function, to be picked up with ... when calling tableby.controloutResp <- tableby(Response ~ Sex + Age + HtIn, data=mdat, total=FALSE, test=TRUE)outCtl <- tableby(Response ~ Sex + Age + HtIn, data=mdat,
control=tableby.control(total=TRUE, cat.simplify=TRUE,cat.stats=c("Nmiss","countpct"),digits=1))
summary(outResp, text=TRUE)summary(outCtl, text=TRUE)
tableby.internal Helper functions for tableby
Description
A set of helper functions for tableby.
48 tableby.internal
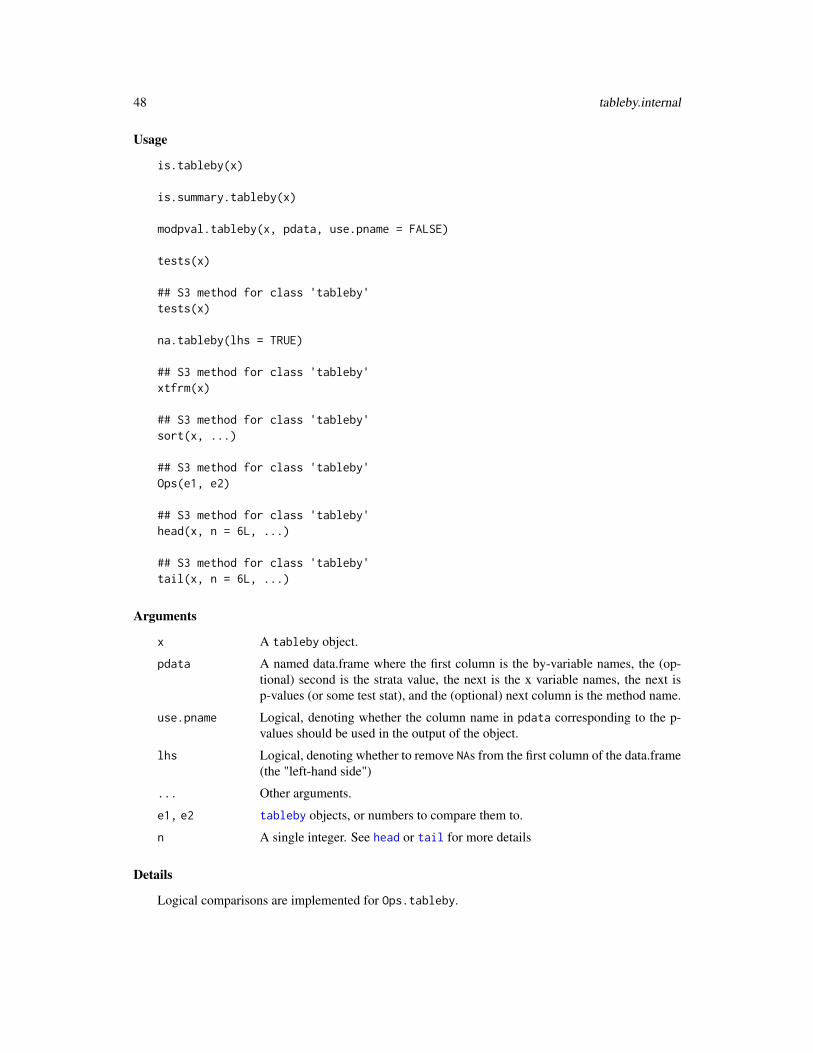
Usage
is.tableby(x)
is.summary.tableby(x)
modpval.tableby(x, pdata, use.pname = FALSE)
tests(x)
## S3 method for class 'tableby'tests(x)
na.tableby(lhs = TRUE)
## S3 method for class 'tableby'xtfrm(x)
## S3 method for class 'tableby'sort(x, ...)
## S3 method for class 'tableby'Ops(e1, e2)
## S3 method for class 'tableby'head(x, n = 6L, ...)
## S3 method for class 'tableby'tail(x, n = 6L, ...)
Arguments
x A tableby object.
pdata A named data.frame where the first column is the by-variable names, the (op-tional) second is the strata value, the next is the x variable names, the next isp-values (or some test stat), and the (optional) next column is the method name.
use.pname Logical, denoting whether the column name in pdata corresponding to the p-values should be used in the output of the object.
lhs Logical, denoting whether to remove NAs from the first column of the data.frame(the "left-hand side")
... Other arguments.
e1, e2 tableby objects, or numbers to compare them to.
n A single integer. See head or tail for more details
Details
Logical comparisons are implemented for Ops.tableby.
tableby.stats 49
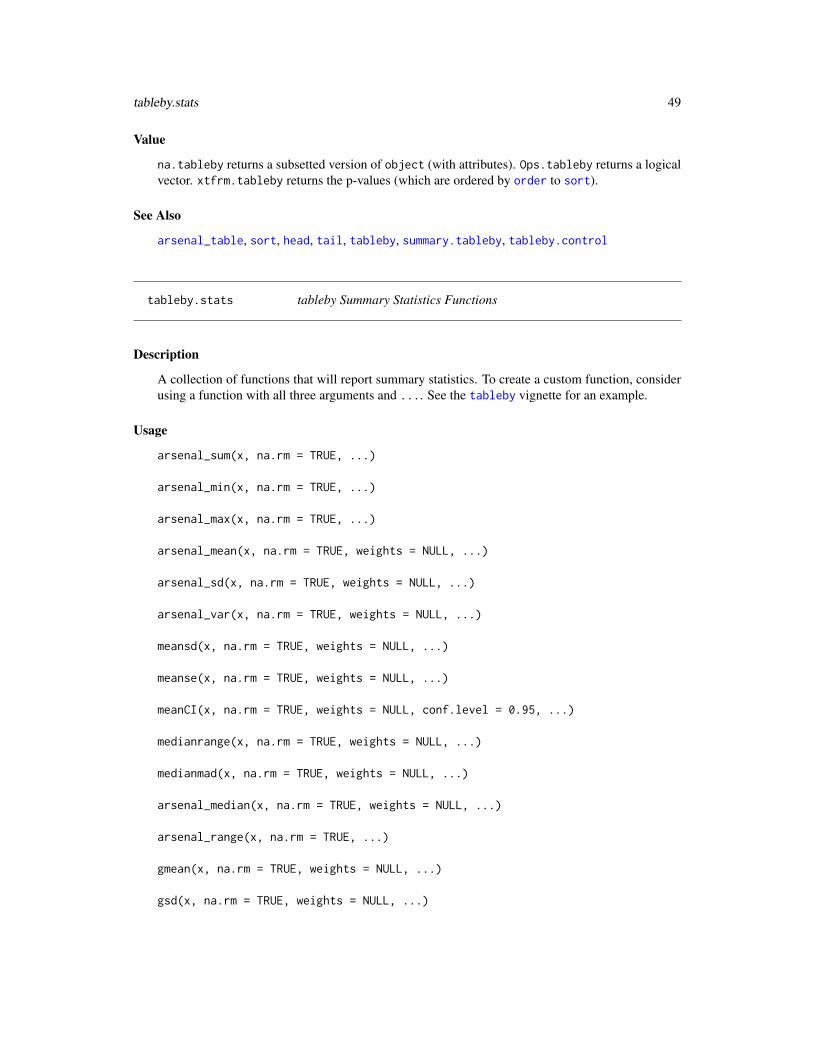
Value
na.tableby returns a subsetted version of object (with attributes). Ops.tableby returns a logicalvector. xtfrm.tableby returns the p-values (which are ordered by order to sort).
See Also
arsenal_table, sort, head, tail, tableby, summary.tableby, tableby.control
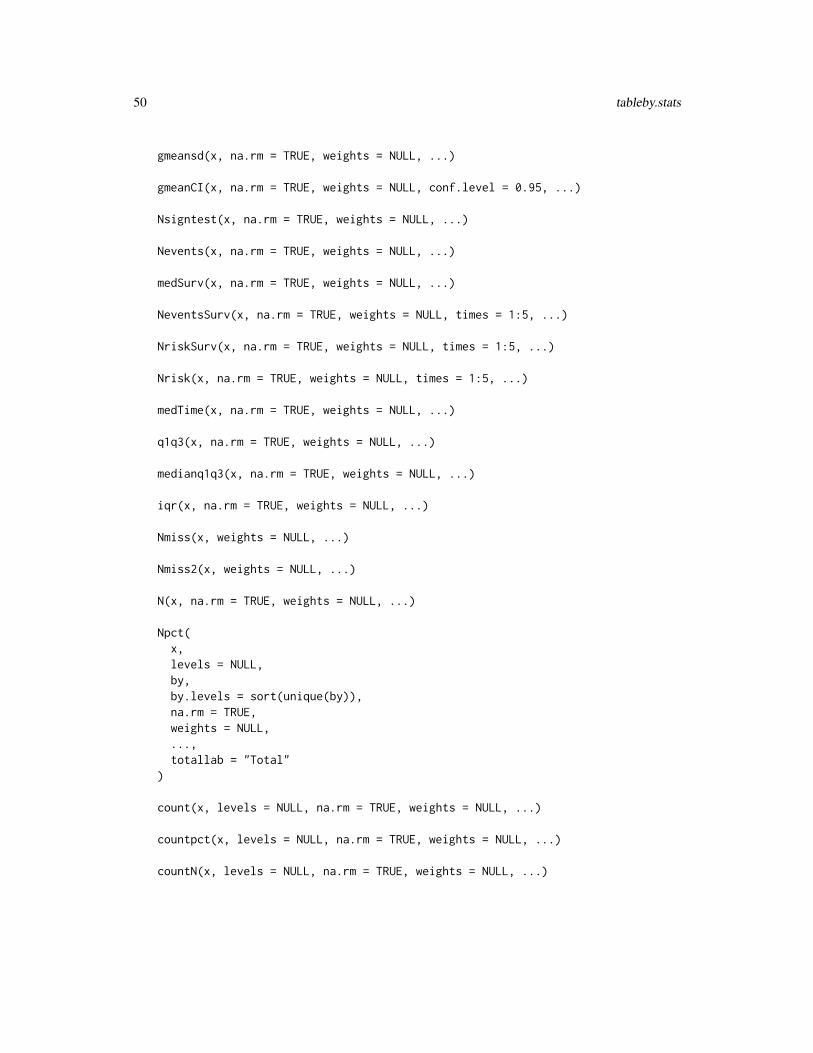
tableby.stats tableby Summary Statistics Functions
Description
A collection of functions that will report summary statistics. To create a custom function, considerusing a function with all three arguments and .... See the tableby vignette for an example.
Usage
arsenal_sum(x, na.rm = TRUE, ...)
arsenal_min(x, na.rm = TRUE, ...)
arsenal_max(x, na.rm = TRUE, ...)
arsenal_mean(x, na.rm = TRUE, weights = NULL, ...)
arsenal_sd(x, na.rm = TRUE, weights = NULL, ...)
arsenal_var(x, na.rm = TRUE, weights = NULL, ...)
meansd(x, na.rm = TRUE, weights = NULL, ...)
meanse(x, na.rm = TRUE, weights = NULL, ...)
meanCI(x, na.rm = TRUE, weights = NULL, conf.level = 0.95, ...)
medianrange(x, na.rm = TRUE, weights = NULL, ...)
medianmad(x, na.rm = TRUE, weights = NULL, ...)
arsenal_median(x, na.rm = TRUE, weights = NULL, ...)
arsenal_range(x, na.rm = TRUE, ...)
gmean(x, na.rm = TRUE, weights = NULL, ...)
gsd(x, na.rm = TRUE, weights = NULL, ...)
50 tableby.stats
gmeansd(x, na.rm = TRUE, weights = NULL, ...)
gmeanCI(x, na.rm = TRUE, weights = NULL, conf.level = 0.95, ...)
Nsigntest(x, na.rm = TRUE, weights = NULL, ...)
Nevents(x, na.rm = TRUE, weights = NULL, ...)
medSurv(x, na.rm = TRUE, weights = NULL, ...)
NeventsSurv(x, na.rm = TRUE, weights = NULL, times = 1:5, ...)
NriskSurv(x, na.rm = TRUE, weights = NULL, times = 1:5, ...)
Nrisk(x, na.rm = TRUE, weights = NULL, times = 1:5, ...)
medTime(x, na.rm = TRUE, weights = NULL, ...)
q1q3(x, na.rm = TRUE, weights = NULL, ...)
medianq1q3(x, na.rm = TRUE, weights = NULL, ...)
iqr(x, na.rm = TRUE, weights = NULL, ...)
Nmiss(x, weights = NULL, ...)
Nmiss2(x, weights = NULL, ...)
N(x, na.rm = TRUE, weights = NULL, ...)
Npct(x,levels = NULL,by,by.levels = sort(unique(by)),na.rm = TRUE,weights = NULL,...,totallab = "Total"
)
count(x, levels = NULL, na.rm = TRUE, weights = NULL, ...)
countpct(x, levels = NULL, na.rm = TRUE, weights = NULL, ...)
countN(x, levels = NULL, na.rm = TRUE, weights = NULL, ...)
tableby.stats 51
countrowpct(x,levels = NULL,by,by.levels = sort(unique(by)),na.rm = TRUE,weights = NULL,...,totallab = "Total"
)
countcellpct(x,levels = NULL,by,by.levels = sort(unique(by)),na.rm = TRUE,weights = NULL,...,totallab = "Total"
)
binomCI(x, levels = NULL, na.rm = TRUE, weights = NULL, conf.level = 0.95, ...)
rowbinomCI(x,levels = NULL,by,by.levels = sort(unique(by)),na.rm = TRUE,weights = NULL,conf.level = 0.95,...,totallab = "Total"
)
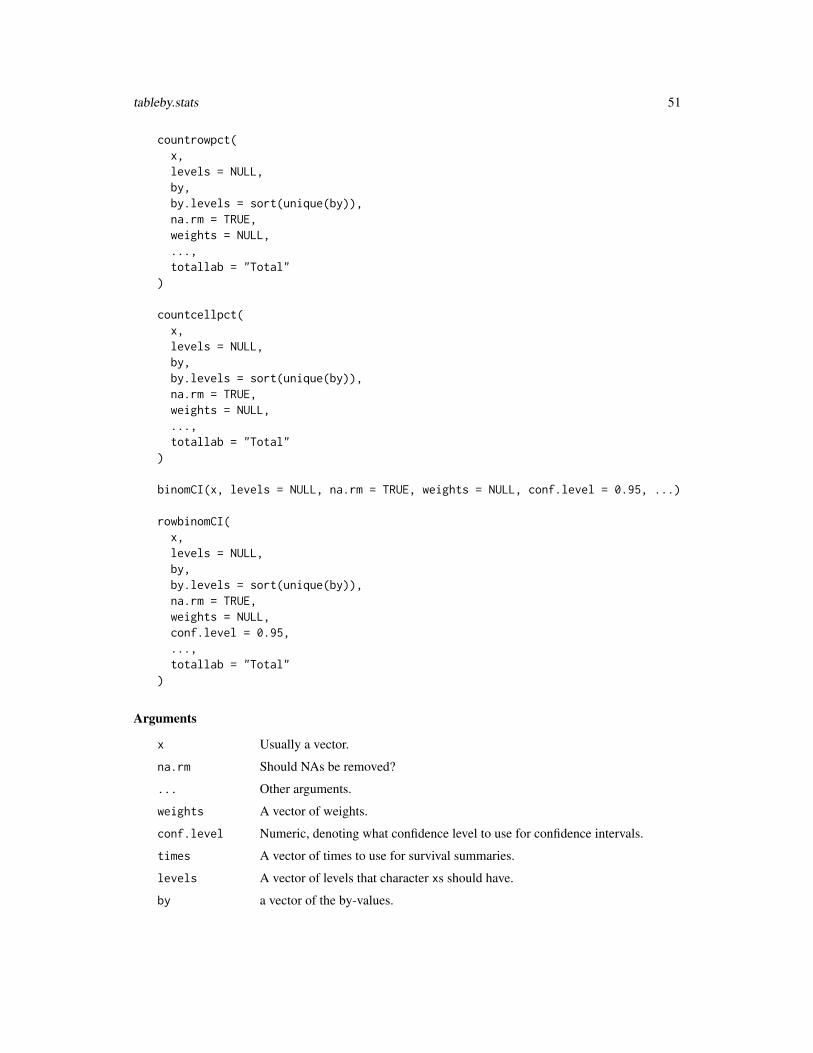
Arguments
x Usually a vector.
na.rm Should NAs be removed?
... Other arguments.
weights A vector of weights.
conf.level Numeric, denoting what confidence level to use for confidence intervals.
times A vector of times to use for survival summaries.
levels A vector of levels that character xs should have.
by a vector of the by-values.
52 tableby.stats.internal
by.levels a vector of the levels of by.
totallab What to call the total "column"
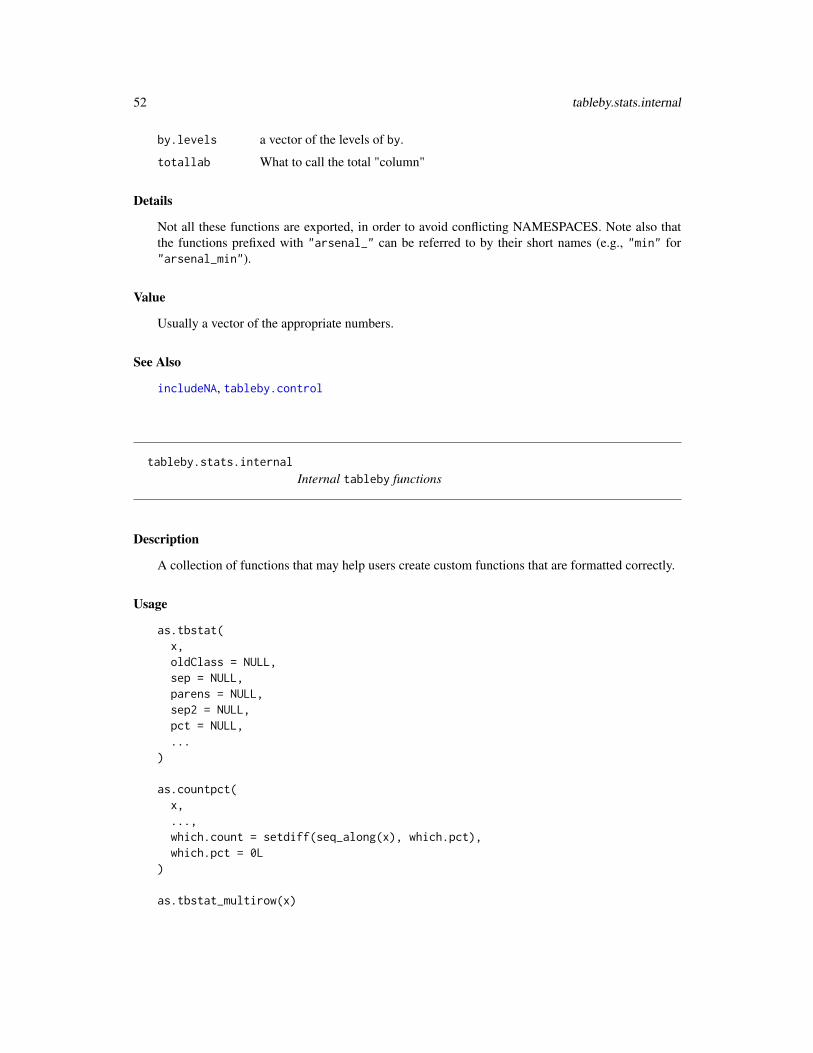
Details
Not all these functions are exported, in order to avoid conflicting NAMESPACES. Note also thatthe functions prefixed with "arsenal_" can be referred to by their short names (e.g., "min" for"arsenal_min").
Value
Usually a vector of the appropriate numbers.
See Also
includeNA, tableby.control
tableby.stats.internal
Internal tableby functions
Description
A collection of functions that may help users create custom functions that are formatted correctly.
Usage
as.tbstat(x,oldClass = NULL,sep = NULL,parens = NULL,sep2 = NULL,pct = NULL,...
)
as.countpct(x,...,which.count = setdiff(seq_along(x), which.pct),which.pct = 0L
)
as.tbstat_multirow(x)
write2 53
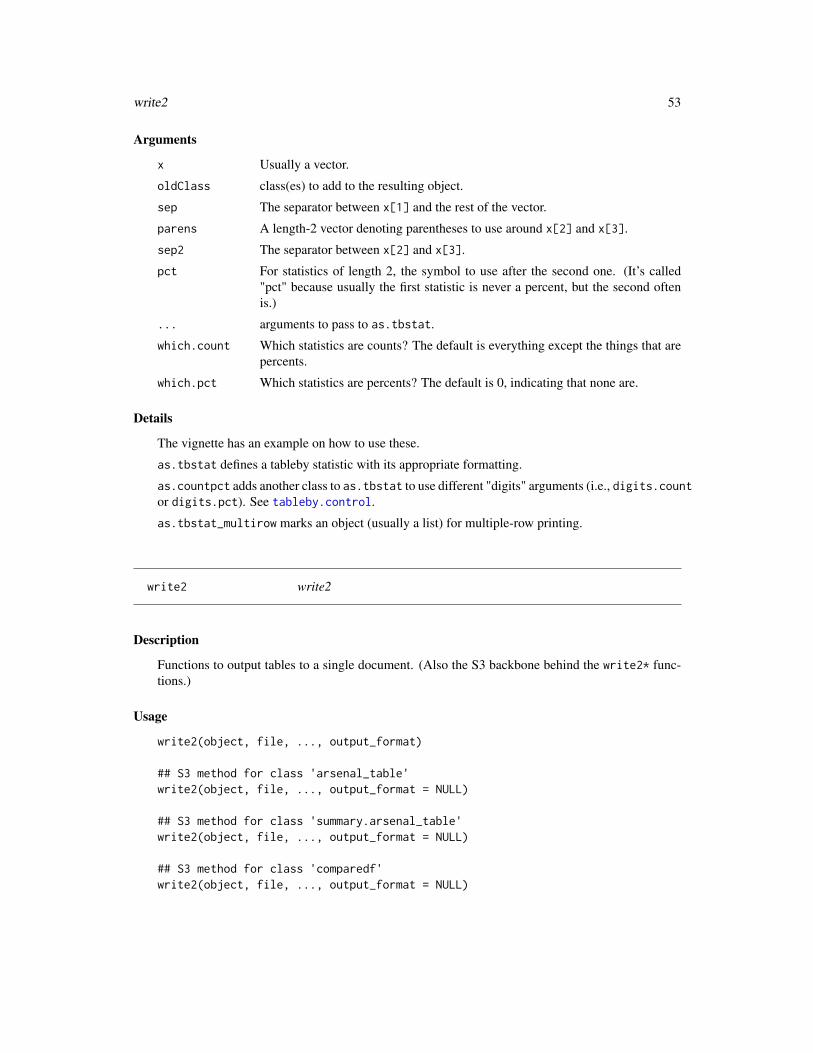
Arguments
x Usually a vector.
oldClass class(es) to add to the resulting object.
sep The separator between x[1] and the rest of the vector.
parens A length-2 vector denoting parentheses to use around x[2] and x[3].
sep2 The separator between x[2] and x[3].
pct For statistics of length 2, the symbol to use after the second one. (It’s called"pct" because usually the first statistic is never a percent, but the second oftenis.)
... arguments to pass to as.tbstat.
which.count Which statistics are counts? The default is everything except the things that arepercents.
which.pct Which statistics are percents? The default is 0, indicating that none are.
Details
The vignette has an example on how to use these.
as.tbstat defines a tableby statistic with its appropriate formatting.
as.countpct adds another class to as.tbstat to use different "digits" arguments (i.e., digits.countor digits.pct). See tableby.control.
as.tbstat_multirow marks an object (usually a list) for multiple-row printing.
write2 write2
Description
Functions to output tables to a single document. (Also the S3 backbone behind the write2* func-tions.)
Usage
write2(object, file, ..., output_format)
## S3 method for class 'arsenal_table'write2(object, file, ..., output_format = NULL)
## S3 method for class 'summary.arsenal_table'write2(object, file, ..., output_format = NULL)
## S3 method for class 'comparedf'write2(object, file, ..., output_format = NULL)
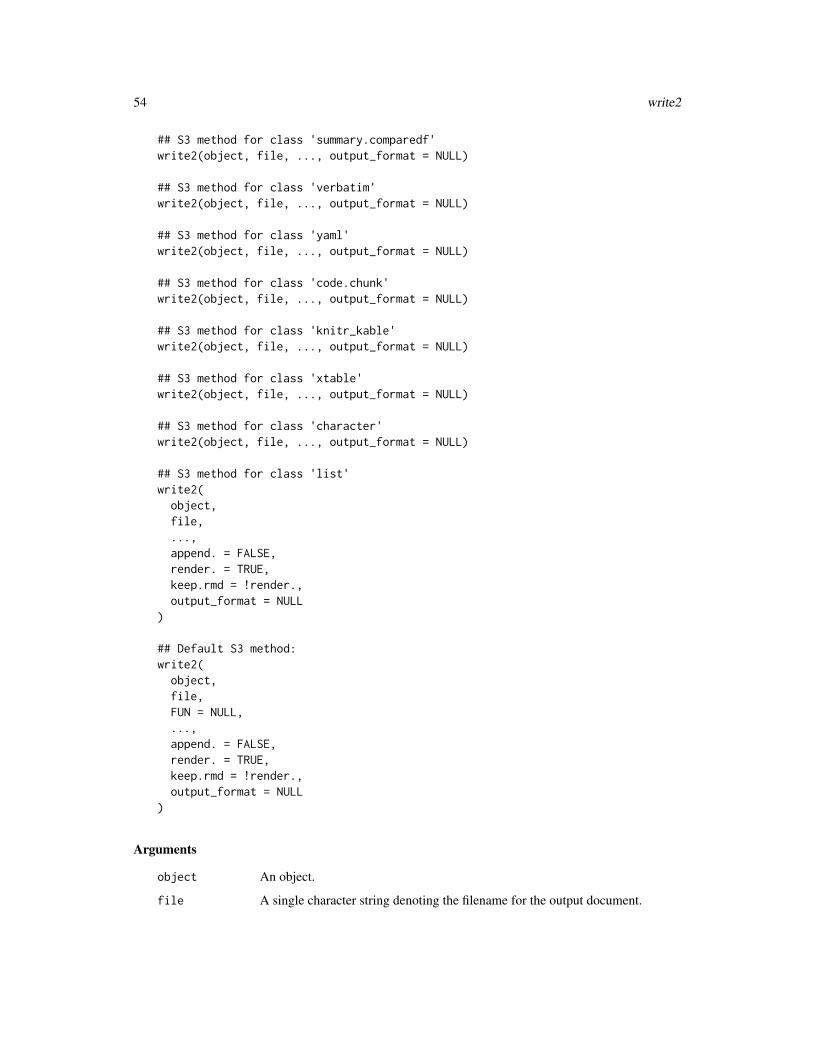
54 write2
## S3 method for class 'summary.comparedf'write2(object, file, ..., output_format = NULL)
## S3 method for class 'verbatim'write2(object, file, ..., output_format = NULL)
## S3 method for class 'yaml'write2(object, file, ..., output_format = NULL)
## S3 method for class 'code.chunk'write2(object, file, ..., output_format = NULL)
## S3 method for class 'knitr_kable'write2(object, file, ..., output_format = NULL)
## S3 method for class 'xtable'write2(object, file, ..., output_format = NULL)
## S3 method for class 'character'write2(object, file, ..., output_format = NULL)
## S3 method for class 'list'write2(object,file,...,append. = FALSE,render. = TRUE,keep.rmd = !render.,output_format = NULL
)
## Default S3 method:write2(object,file,FUN = NULL,...,append. = FALSE,render. = TRUE,keep.rmd = !render.,output_format = NULL
)
Arguments
object An object.
file A single character string denoting the filename for the output document.
write2 55
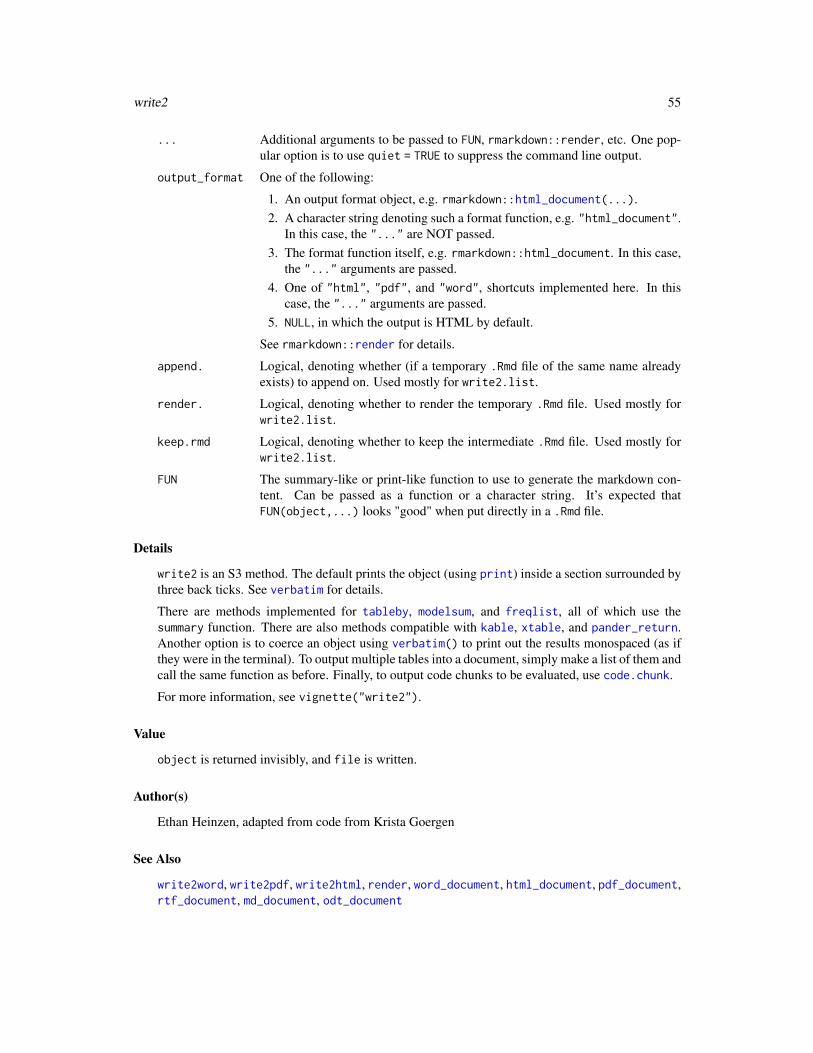
... Additional arguments to be passed to FUN, rmarkdown::render, etc. One pop-ular option is to use quiet = TRUE to suppress the command line output.
output_format One of the following:
1. An output format object, e.g. rmarkdown::html_document(...).2. A character string denoting such a format function, e.g. "html_document".
In this case, the "..." are NOT passed.3. The format function itself, e.g. rmarkdown::html_document. In this case,
the "..." arguments are passed.4. One of "html", "pdf", and "word", shortcuts implemented here. In this
case, the "..." arguments are passed.5. NULL, in which the output is HTML by default.
See rmarkdown::render for details.
append. Logical, denoting whether (if a temporary .Rmd file of the same name alreadyexists) to append on. Used mostly for write2.list.
render. Logical, denoting whether to render the temporary .Rmd file. Used mostly forwrite2.list.
keep.rmd Logical, denoting whether to keep the intermediate .Rmd file. Used mostly forwrite2.list.
FUN The summary-like or print-like function to use to generate the markdown con-tent. Can be passed as a function or a character string. It’s expected thatFUN(object,...) looks "good" when put directly in a .Rmd file.
Details
write2 is an S3 method. The default prints the object (using print) inside a section surrounded bythree back ticks. See verbatim for details.
There are methods implemented for tableby, modelsum, and freqlist, all of which use thesummary function. There are also methods compatible with kable, xtable, and pander_return.Another option is to coerce an object using verbatim() to print out the results monospaced (as ifthey were in the terminal). To output multiple tables into a document, simply make a list of them andcall the same function as before. Finally, to output code chunks to be evaluated, use code.chunk.
For more information, see vignette("write2").
Value
object is returned invisibly, and file is written.
Author(s)
Ethan Heinzen, adapted from code from Krista Goergen
See Also
write2word, write2pdf, write2html, render, word_document, html_document, pdf_document,rtf_document, md_document, odt_document
56 write2.internal
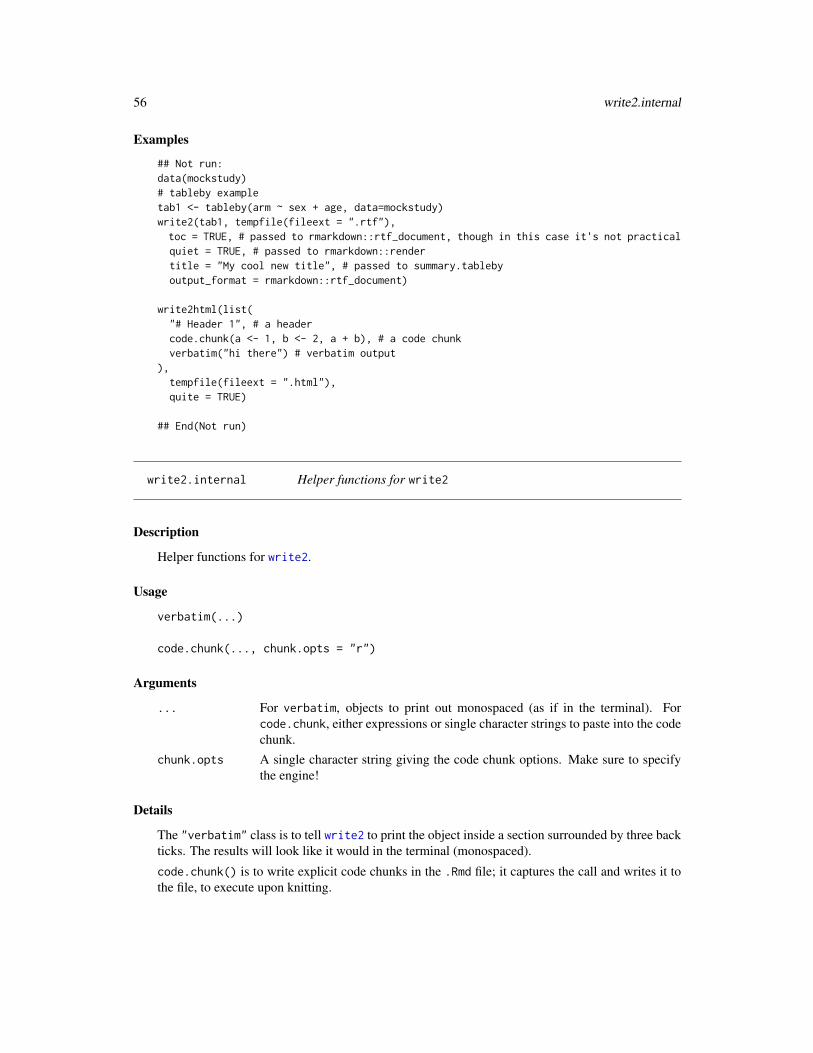
Examples
## Not run:data(mockstudy)# tableby exampletab1 <- tableby(arm ~ sex + age, data=mockstudy)write2(tab1, tempfile(fileext = ".rtf"),toc = TRUE, # passed to rmarkdown::rtf_document, though in this case it's not practicalquiet = TRUE, # passed to rmarkdown::rendertitle = "My cool new title", # passed to summary.tablebyoutput_format = rmarkdown::rtf_document)
write2html(list("# Header 1", # a headercode.chunk(a <- 1, b <- 2, a + b), # a code chunkverbatim("hi there") # verbatim output
),tempfile(fileext = ".html"),quite = TRUE)
## End(Not run)
write2.internal Helper functions for write2
Description
Helper functions for write2.
Usage
verbatim(...)
code.chunk(..., chunk.opts = "r")
Arguments
... For verbatim, objects to print out monospaced (as if in the terminal). Forcode.chunk, either expressions or single character strings to paste into the codechunk.
chunk.opts A single character string giving the code chunk options. Make sure to specifythe engine!
Details
The "verbatim" class is to tell write2 to print the object inside a section surrounded by three backticks. The results will look like it would in the terminal (monospaced).
code.chunk() is to write explicit code chunks in the .Rmd file; it captures the call and writes it tothe file, to execute upon knitting.
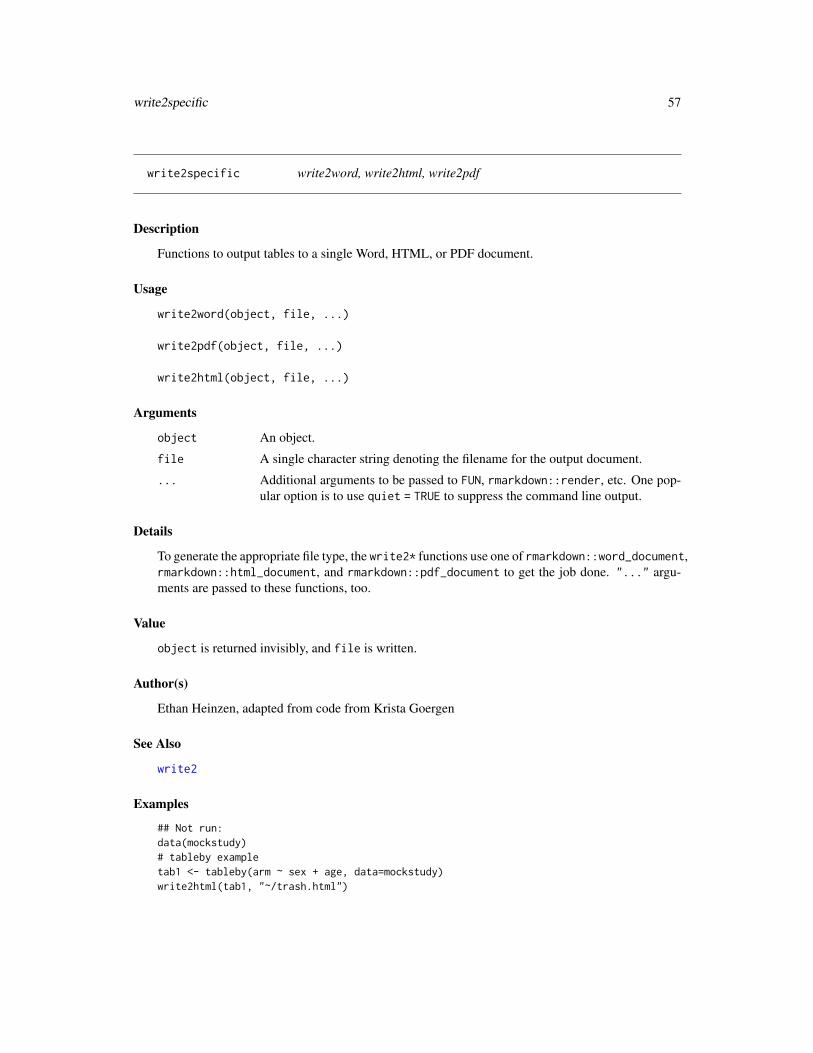
write2specific 57
write2specific write2word, write2html, write2pdf
Description
Functions to output tables to a single Word, HTML, or PDF document.
Usage
write2word(object, file, ...)
write2pdf(object, file, ...)
write2html(object, file, ...)
Arguments
object An object.
file A single character string denoting the filename for the output document.
... Additional arguments to be passed to FUN, rmarkdown::render, etc. One pop-ular option is to use quiet = TRUE to suppress the command line output.
Details
To generate the appropriate file type, the write2* functions use one of rmarkdown::word_document,rmarkdown::html_document, and rmarkdown::pdf_document to get the job done. "..." argu-ments are passed to these functions, too.
Value
object is returned invisibly, and file is written.
Author(s)
Ethan Heinzen, adapted from code from Krista Goergen
See Also
write2
Examples
## Not run:data(mockstudy)# tableby exampletab1 <- tableby(arm ~ sex + age, data=mockstudy)write2html(tab1, "~/trash.html")
58 yaml
# freqlist exampletab.ex <- table(mockstudy[, c("arm", "sex", "mdquality.s")], useNA = "ifany")noby <- freqlist(tab.ex, na.options = "include")write2pdf(noby, "~/trash2.pdf")
# A more complicated examplewrite2word(tab1, "~/trash.doc",
keep.md = TRUE,reference_docx = mystyles.docx, # passed to rmarkdown::word_documentquiet = TRUE, # passed to rmarkdown::rendertitle = "My cool new title") # passed to summary.tableby
## End(Not run)
yaml Include a YAML header in write2
Description
Include a YAML header in write2
Usage
yaml(...)
## S3 method for class 'yaml'print(x, ...)
## S3 method for class 'yaml'c(..., recursive = FALSE)
is.yaml(x)
Arguments
... For yaml(), arguments to be bundled into a list and passed to as.yaml. Forprint.yaml(), extra arguments. For c.yaml(), "yaml" objects to be concate-nated.
x An object of class "yaml".
recursive Not in use at this time.
Value
A text string of class "yaml".
Author(s)
Ethan Heinzen, adapted from an idea by Brendan Broderick
%nin% 59
See Also
as.yaml, write2
Examples
x <- yaml(title = "My cool title", author = "Ethan P Heinzen")xy <- yaml("header-includes" = list("\\usepackage[labelformat=empty]{caption}"))yc(x, y)
%nin% Not in
Description
The not-in operator for R.
Usage
x %nin% table
Arguments
x vector or NULL: the values to be matched.
table vector or NULL: the values to be matched against.
Value
The negation of %in%.
Author(s)
Raymond Moore
See Also
%in%
Examples
1 %nin% 2:10c("a", "b") %nin% c("a", "c", "d")
Index
∗ datasetsmockstudy, 25
[.arsenal_table (arsenal_table), 5[.keep_labels (keep.labels), 21[.selectall (selectall), 35[<-.keep_labels (keep.labels), 21%in%, 59%nin%, 4, 59
allNA, 4allNA (NA.operations), 30anova, 44, 47anyNA, 31arsenal, 3arsenal-defunct, 4arsenal-deprecated, 5arsenal_max (tableby.stats), 49arsenal_mean (tableby.stats), 49arsenal_median (tableby.stats), 49arsenal_min (tableby.stats), 49arsenal_range (tableby.stats), 49arsenal_sd (tableby.stats), 49arsenal_sum (tableby.stats), 49arsenal_table, 5, 19, 20, 27, 30, 33, 44, 49arsenal_var (tableby.stats), 49as.countpct (tableby.stats.internal), 52as.data.frame, 26, 32, 42as.data.frame.freqlist, 6, 37as.data.frame.modelsum, 7, 39as.data.frame.summary.freqlist
(summary.freqlist), 37as.data.frame.summary.modelsum
(summary.modelsum), 38as.data.frame.summary.tableby
(summary.tableby), 40as.data.frame.tableby, 8, 40as.matrix.selectall (selectall), 35as.selectall (selectall), 35as.tbstat (tableby.stats.internal), 52
as.tbstat_multirow(tableby.stats.internal), 52
as.yaml, 58, 59
binomCI, 46binomCI (tableby.stats), 49
c.yaml (yaml), 58chisq.test, 44, 47clog (modelsum.family), 29code.chunk, 55code.chunk (write2.internal), 56comparedf, 3, 4, 9, 10, 12, 13, 15, 25, 36comparedf.control, 4, 9, 10, 12, 13, 36comparedf.tolerances, 12, 12count (tableby.stats), 49countcellpct (tableby.stats), 49countN (tableby.stats), 49countpct (tableby.stats), 49countrowpct (tableby.stats), 49coxph, 26, 29
data.frame, 23Date, 24Date.mdy, 4Date.mdy (mdy.Date), 23DateTimeClasses, 24diffs, 9, 14
family, 29formula, 26, 32, 42formulize, 4, 15, 27, 33, 44freq.control, 7, 17, 18–20, 37freqlist, 3, 6, 17, 18, 19, 20, 37, 55freqlist.internal, 17, 19, 19, 37
glm, 26glm.nb, 29gmean (tableby.stats), 49gmeanCI (tableby.stats), 49gmeansd (tableby.stats), 49
60
INDEX 61
gsd (tableby.stats), 49
has_strata (arsenal_table), 5head, 20, 48, 49head.summary.freqlist
(freqlist.internal), 19head.tableby (tableby.internal), 47html_document, 55
includeNA, 4, 52includeNA (NA.operations), 30internal.functions, 20iqr (tableby.stats), 49is.Date, 4is.Date (mdy.Date), 23is.freqlist (freqlist.internal), 19is.modelsum (modelsum.internal), 30is.na, 31is.na.selectall (selectall), 35is.selectall (selectall), 35is.summary.freqlist
(freqlist.internal), 19is.summary.modelsum
(modelsum.internal), 30is.summary.tableby (tableby.internal),
47is.tableby (tableby.internal), 47is.yaml (yaml), 58
kable, 6, 36, 37, 39–41, 55keep.labels, 4, 21, 23
labels, 6, 22, 22labels.arsenal_table (arsenal_table), 5labels<- (labels), 22labels<-.arsenal_table (arsenal_table),
5lm, 26loosen.labels (keep.labels), 21
McNemar’s test, 33mcnemar.test, 34md_document, 55mdy.Date, 4, 23meanCI (tableby.stats), 49meansd (tableby.stats), 49meanse (tableby.stats), 49medianmad (tableby.stats), 49medianq1q3 (tableby.stats), 49
medianrange (tableby.stats), 49medSurv (tableby.stats), 49medTime (tableby.stats), 49merge, 6merge.arsenal_table (arsenal_table), 5merge.freqlist, 20merge.freqlist (arsenal_table), 5mockstudy, 4, 25modelsum, 3, 7, 8, 26, 28–30, 38, 39, 55modelsum.control, 7, 27, 28modelsum.family, 26, 29modelsum.internal, 27, 29, 30modpval.tableby, 31, 45modpval.tableby (tableby.internal), 47muck_up_mockstudy (mockstudy), 25
N (tableby.stats), 49n.diff.obs, 9n.diff.obs (diffs), 14n.diffs, 9n.diffs (diffs), 14na.modelsum (modelsum.internal), 30NA.operations, 30na.paired, 32na.paired (paired.internal), 34na.tableby (tableby.internal), 47negbin (modelsum.family), 29Nevents (tableby.stats), 49NeventsSurv (tableby.stats), 49nin (%nin%), 59Nmiss (tableby.stats), 49Nmiss2 (tableby.stats), 49Npct (tableby.stats), 49Nrisk (tableby.stats), 49NriskSurv (tableby.stats), 49Nsigntest (tableby.stats), 49
odt_document, 55Ops.tableby (tableby.internal), 47order, 49ordinal (modelsum.family), 29
p.adjust, 31padjust, 31paired, 3, 32, 33–35paired.control, 32, 33, 33paired.internal, 34pander_return, 55pdf_document, 55
62 INDEX
polr, 29print, 55print.arsenal_table (arsenal_table), 5print.comparedf (comparedf), 9print.summary.arsenal_table
(arsenal_table), 5print.summary.comparedf
(summary.comparedf), 36print.yaml (yaml), 58
q1q3 (tableby.stats), 49
reformulate, 16relrisk, 27relrisk (modelsum.family), 29render, 55replace, 21replace2 (internal.functions), 20rowbinomCI (tableby.stats), 49rtf_document, 55
selectall, 33, 35, 44set_attr (labels), 22set_labels (labels), 22signed rank test, 33smart.split, 6, 39, 41smart.split (internal.functions), 20sort, 20, 49sort.freqlist (freqlist.internal), 19sort.tableby (tableby.internal), 47summary.comparedf, 9, 12, 15, 36summary.freqlist, 17, 19, 20, 37summary.modelsum, 8, 27, 29, 38summary.tableby, 34, 40, 44, 45, 47, 49survival (modelsum.family), 29
table, 19, 37tableby, 3, 8, 33–35, 40, 41, 42, 44, 47–49, 55tableby.control, 8, 34, 41, 43, 44, 44, 49,
52, 53tableby.internal, 35, 44, 47tableby.stats, 47, 49tableby.stats.internal, 52tail, 20, 48, 49tail.summary.freqlist
(freqlist.internal), 19tail.tableby (tableby.internal), 47tests (tableby.internal), 47tests.tableby, 31
tol.char.both (comparedf.tolerances), 12tol.char.case (comparedf.tolerances), 12tol.char.none (comparedf.tolerances), 12tol.char.trim (comparedf.tolerances), 12tol.date.absolute
(comparedf.tolerances), 12tol.factor.labels
(comparedf.tolerances), 12tol.factor.levels
(comparedf.tolerances), 12tol.factor.none (comparedf.tolerances),
12tol.logical.none
(comparedf.tolerances), 12tol.NA (comparedf.tolerances), 12tol.num.absolute
(comparedf.tolerances), 12tol.num.pct (comparedf.tolerances), 12tol.num.percent (comparedf.tolerances),
12tol.other.none (comparedf.tolerances),
12
verbatim, 55verbatim (write2.internal), 56
wilcox.test, 34, 46word_document, 55write2, 3, 53, 56, 57, 59write2.internal, 56write2html, 3, 55write2html (write2specific), 57write2pdf, 3, 55write2pdf (write2specific), 57write2specific, 57write2word, 3, 55write2word (write2specific), 57
xtable, 55xtabs, 19, 37xtfrm.tableby (tableby.internal), 47
yaml, 58