arsenic in ground water
DESCRIPTION
arsenic in ground waterTRANSCRIPT


ARSENIC IN GROUND WATER

This page intentionally left blank

ARSENIC IN GROUND WATER
edited by
Alan H. WelchU.S. Geological Survey
Kenneth G. StollenwerkU.S. Geological Survey
KLUWER ACADEMIC PUBLISHERSNEW YORK, BOSTON, DORDRECHT, LONDON, MOSCOW

eBook ISBN: 0-306-47956-7Print ISBN: 1-4020-7317-8
©2003 Kluwer Academic PublishersNew York, Boston, Dordrecht, London, Moscow
Print ©2003 Kluwer Academic Publishers
All rights reserved
No part of this eBook may be reproduced or transmitted in any form or by any means, electronic,mechanical, recording, or otherwise, without written consent from the Publisher
Created in the United States of America
Visit Kluwer Online at: http://kluweronline.comand Kluwer's eBookstore at: http://ebooks.kluweronline.com
Dordrecht

ContentsContributorsPreface
1
2
3
4
5
6
7
8
vii
Arsenic Thermodynamic Data and EnvironmentalGeochemistryD. Kirk Nordstrom and Donald G. Archer
1
xi
Spectroscopic Investigations of ArsenicSpecies in Solid PhasesAndrea L. Foster
Geochemical Processes Controlling Transportof Arsenic in Groundwater: A Review ofAdsorptionKenneth G. Stollenwerk
Geothermal ArsenicJenny G. Webster and D. Kirk Nordstrom
Role of Large Scale Fluid-Flow in SubsurfaceArsenic EnrichmentM.B. Goldhaber, R.C. Lee, J.R. Hatch,J.C. Pashin, and J. Treworgy
Arsenic in Ground Water Used for DrinkingWater in the United StatesSarah J. Ryker
Arsenic in Groundwater – South and East AsiaPauline L. Smedley
The Scale and Causes of the GroundwaterArsenic Problem in BangladeshDavid G. Kinniburgh, Pauline L. Smedley,Jeff Davies, Chris J. Milne, Irina Gaus,Janice M. Trafford, Simon Burden,S. M. Ihtishamul Huq, Nasiruddin Ahmad,Kazi Matin Ahmed
27
67
101
127
165
179
211

9 Mechanisms of Arsenic Release toWater from Naturally Occurring Sources,Eastern Wisconsin 259M.E. Schreiber, M.B. Gotkowitz, J.A. Simo,and P.G. Freiberg
10 Arsenic in Southeastern Michigan 281Allan Kolker, S. K. Haack, W. F. Cannon,D. B. Westjohn, M.-J. Kim, Jerome Nriagu,and L. G. Woodruff
Occurrence of Arsenic in Ground Water ofthe Middle Rio Grande Basin, CentralNew Mexico 295Laura M. Bexfield and L. Niel Plummer
Arsenic Contamination in the WaterSupply of Milltown, MontanaJohnnie N. Moore and William W. Woessner
329
Natural Remediation Potential ofArsenic-Contaminated Ground Water 351Kenneth G. Stollenwerk and John A. Colman
Modeling In Situ Iron Removal fromGroundwater with Trace Elementssuch as AsC.A.J. Appelo and W.W.J.M. de Vet
In Situ Arsenic Remediation in a Fractured,Alkaline AquiferAlan H. Welch, Kenneth G. Stollenwerk,Douglas K. Maurer and Lawrence S. Feinson
403
421
381
References cited
Index 471
vi
15
14
13
12
11

Contributors
C.A.J. AppeloHydrochemical ConsultantAmsterdamThe Netherlands
Jeff DaviesBritish Geological SurveyWallingford, OxfordshireUK
Nasiruddin AhmadDepartment of Public HealthEngineeringDhaka, Bangladesh
W.W.J.M. de VetHydron-ZHGoudaThe Netherlands
Kazi Matin AhmedDepartment of GeologyUniversity of DhakaDhaka, Bangladesh
Lawrence S. FeinsonU.S. Geological SurveyCarson City, NV
Michael J. FocazioU.S. Geological SurveyReston, VA
Donald G. ArcherNational Institute of Standardsand TechnologyGaithersberg, MD Andrea L. Foster
U.S. Geological SurveyMenlo Park, CALaura M. Bexfield
U.S. Geological SurveyAlbuquerque, NM Philip Freiberg
Redwood National ParkOrick, CASimon Burden
British Geological SurveyNottinghamUK
Irina GausBritish Geological SurveyWallingford, OxfordshireUKW.F. Cannon
U.S. Geological SurveyReston, VA M.B. Goldhaber
U.S. Geological SurveyDenver, CO
John A. ColmanU.S. Geological SurveyNorthborough, MA

Madeline B. GotkowitzWisconsin Geological AndNatural History SurveyMadison, WI
Chris J. MilneBritish Geological SurveyWallingford, OxfordshireUK
S.K. HaackU.S. Geological SurveyLansing, MI
Johnnie N. MooreDepartment of GeologyUniversity of MontanaMissoula, MT
J.R. HatchU.S. Geological SurveyDenver, CO
D. Kirk NordstromU.S. Geological SurveyBoulder, CO
S.M. Ihtishamul HuqDepartment of Public HealthEngineeringDhaka, Bangladesh
Jerome NriaguUniversity of MichiganSchool of Public HealthAnn Arbor, MI
M. –J KimKorea Institute of Science andTechnologySeoul, South Korea
J.C. PashinGeological Survey of AlabamaTuscaloosa, AL
L. Neil PlummerU.S. Geological SurveyReston, VA
David KinniburghBritish Geological SurveyWallingford, OxfordshireUK
Allan KolkerU.S. Geological SurveyReston, VA
R.C. LeeU.S. Geological SurveyDenver, CO
Douglas K. MaurerU.S. Geological SurveyCarson City, NV
viii
M.E. SchreiberDepartment of GeologicalSciencesVirginia TechBlacksburg, VA
Sarah J. RykerU.S. Geological Survey(Present Address)Carnegie Mellon UniversityPittsburgh, PA

J. Antonio SimoDepartment of Geology andGeophysicsUniversity of Wisconsin-MadisonMadison, WI
Kenneth G. StollenwerkU.S. Geological SurveyDenver, CO
Janice M. TraffordWallingford, OxfordshireUK
J. TreworgyEarth Science DepartmentPrincipia CollegeElsahy, IL
Jenny G. WebsterEnvironmental Chemistry/WaterQualitySchool of Environmental &Marine ScienceUniversity of AucklandAuckland NZ
Alan H. WelchU.S. Geological SurveyCarson City, NV
D.B. WestjohnU.S. Geological SurveyLansing, MI
ix
L.G. WoodruffU.S. Geological SurveyMounds View, MN
William W. WoessnerDepartment of GeologyUniversity of MontanaMissoula, MT

This page intentionally left blank
Interest in arsenic in ground water has greatly increased in the pastdecade because of the increased awareness of human health effects and thecosts of avoidance or treatment of ground water supplies used forconsumption. The goal of this book is to provide a description of the basicprocesses that affect arsenic occurrence and transport by providing sufficientbackground information on arsenic geochemistry and descriptions of high-arsenic ground water, both affected and unaffected by human activity.
An understanding of thermodynamics, adsorption, and the speciation ofarsenic in solid phases, which are described in first three chapters, is neededto predict the fate of arsenic in ground water systems. Large-scale and deepmovement of ground water can and has redistributed arsenic in the nearsurface environment, as described in the next two chapters. These large-scalesystems can affect large volumes of both ground water and surface water,such as in the Yellowstone system, and can produce mineralised zones thatsubsequently release arsenic to ground water supplies. Regionalidentification of high-arsenic ground water and its consumption as describedin the next three chapters clearly demonstrates a need for increased water-quality monitoring, particularly in south and southeast Asia. Chapters 9-11provide examples of high arsenic ground water associated with sulfidemineral oxidation and alkaline conditions. Finally, smaller scale studies ofthe effects of human activities that have produced high-arsenic ground waterand methods for attenuation of ground water are presented.
This volume would not have been possible without the financial supportof the National Research and National Water-Quality Assessment Programsof the U.S. Geological Survey. The support by these programs is gratefullyacknowledged. The able assistance of Nancy Damar, Teresa Foglesong,Chris Stone, and Angie Thacker in the preparation of this volume is greatlyappreciated.
Finally, the editors dedicate this book to the victims of arsenic poisoningin the hope that it will help in some small way to lesson the impact of arsenicon humans.
Preface

This page intentionally left blank

Chapter 1
Arsenic thermodynamic data and environmentalgeochemistry
D. Kirk Nordstrom1 and Donald G. Archer2
Thermodynamic data are critical as input to models that attempt to interpretthe geochemistry of environmentally important elements such as arsenic.Unfortunately, the thermodynamic data for mineral phases of arsenic and theirsolubilities have been highly discrepant and inadequately evaluated. Thispaper presents the results of a simultaneous weighted least-squares multipleregression on more than 75 thermochemical measurements of elementalarsenic, arsenic oxides, arsenic sulfides, their aqueous hydrolysis, and a fewrelated reactions. The best-fitted thermodynamic database is related to mineralstability relationships for native arsenic, claudetite, arsenolite, orpiment, andrealgar with diagrams and with known occurrences and mineraltransformations in the environment to test the compatibility of thermodynamicmeasurements and calculations with observations in nature. The resultsprovide a much more consistent framework for geochemical modeling and theinterpretation of geochemical processes involving arsenic in the environment.
1.
Aqueous geochemical models have become routine tools in theinvestigation of water-rock interactions (Alpers and Nordstrom, 1999;Drever, 1997; Langmuir, 1997; Nordstrom and Munoz, 1994; Parkhurst andPlummer, 1993), in the study of bioavailability and toxicity of contaminantsto organisms (Morrison, 1989; Parker et al., 1995), in the prediction ofarsenic behaviour in mining pit lakes in Nevada (Tempel et al., 1999), in the
An evaluation of thermodynamic data for modeling the aqueousenvironmental geochemistry of arsenic
1U.S. Geological Survey, Boulder, CO, USA2National Institute of Standards and Technology,Gaithersburg, MD, USA
INTRODUCTION

2 Chapter 1
prediction of arsenic mobility from mine wastes (Doyle et al., 1994), in theprediction of ore deposit formation (Heinrich and Eadington, 1986), and inany quantitative interpretation of reactions in aqueous solution and naturalwater (Morel and Hering, 1993; Stumm and Morgan, 1996). As with allcomputerized models, the quality of the output depends on the quality of theinput and thermodynamic data is one of the primary sets of data input tomost geochemical codes. Unfortunately, the consistency and quality ofthermodynamic data is not adequate for the wide variety of aqueousgeochemical calculations needed for water quality investigations. Data forenvironmentally relevant arsenic species is a good example. Grenthe et al.(1992 p. 390), in their major critique of uranium thermodynamic data, statedthat a complete re-analysis of thermodynamic data for arsenic species isnecessary and data on uranium-arsenic complexes and compounds wouldnecessarily be compromised. Nordstrom (2000) agreed with this conclusionand considered the consequences of estimating stability constants for somedivalent and trivalent arsenate complexes on speciation of arsenate for someground waters from Bangladesh. Those results demonstrated that speciationcan change considerably but saturation indices are not significantly affectedfor these dilute waters. Presumably, waters of higher concentration would beaffected more strongly.
Numerous compilations of thermodynamic data are available and manyof these contain thermodynamic data for arsenic species. However, merenumbers of compilations do not provide any idea of the quality of the datanor the number or quality of the original measurements upon which the dataare based. The presence of nearly identical property values in apparentlydifferent sources may give the erroneous impression that the properties for aparticular substance are well determined when in fact they may be based onthe same original source that, like a cousin, may be twice removed from thereference given. Most compilations of data for arsenic species cannot beconsidered reliable. The database of Sadiq and Lindsay (1981) has been usedto speciate arsenic for waters and soils by Sadiq et al. (1983), and Sadiq(1990, 1997). Unfortunately, this database was not developed using criticalevaluation procedures (e.g. see Ball and Nordstrom, 1998; Nordstrom, 2000)and several errors can be found there, including lack of consistency withthermodynamic relationships, inappropriate use of values from the literature,no evaluation of original sources, no evaluation of networks, and noconsideration of temperature dependence. This database is not unique; thereare many other similarly unevaluated compilations in the publishedliterature. Many dangerous assumptions such as those outlined above canbefall the unaware investigator.
Another factor that exacerbates this sort of problem is that somedatabases were republished at later dates without incorporation of changes inthe literature that had occurred since the original publication date. The more

1. Arsenic thermodynamic data and environmental geochemistry 3
recent publication dates might lead one to believe that these databases arebased on more up-to-date information than might actually be the case.Examples involve publication series such as Wagman et al. (1968, 1982) orthe series of Robie and Waldbaum (1968), Robie et al, (1978), and Robieand Hemingway (1995).
We illustrate these problems with a specific case. Young and Robins(2000) listed 13 values of the Gibbs energy of formation, of orpiment,
each from a different literature source. These values ranged fromto and, if examined closely, fell into groups
of values. The first group contained two values, –168 and , andwere cited as Wagman et al. (1982) and Robie et al. (1978). However, theWagman et al. (1982) citation was a republication of values from an earlierpublication (Wagman et al., 1968) whose properties for arsenic compoundswere generated about 1964 and were not documented. Robie et al. (1978)took the 1964 value from Wagman et al. (1968), changed it slightly andrepublished it. Another group of values falls around –95 to . Oneof those values, , was obtained by Barton (1969) fromexamination of multi-phase equilibrium temperatures for liquid (arsenic +sulfur), realgar, and orpiment, assumptions about the fugacity of sulfur inmixed arsenic + sulfur melts, and extrapolations from the meltingtemperature to 298 K. Naumov et al. (1974) made a small change in thisvalue and included it in their data compilation. Also in this group are twosolubility studies in which the Gibbs energies of formation were calculatedfrom the measured solubilities and, among other things, the Gibbs energy offormation of where the latter value was taken from Naumov etal. (1974). Naumov et al. based their value of for in part,on a value of for arsenolite calculated from an erroneous value reportedby Beezer et al. (1965). Because the values calculated from the twosolubility studies were based on erroneous auxiliary data, their agreementwith Barton’s (1969) equilibrium study is happenstance. Another group ofvalues ranged from –90.7 to and was based on a fluorinecombustion study from Johnson et al. (1980) combined with variousauxiliary data. Finally, two additional, but smaller values (–86 and
were listed. One of these values was from Pokrovski (1996) whoreanalyzed earlier solubility data using yet another set of auxiliarythermodynamic data, and the other was from Bryndzia and Kleppa (1988)who used direct synthesis calorimetry to determine the enthalpy offormation. Bryndzia and Kleppa (1988) reported for theenthalpy of formation of orpiment. To make matters worse, the more recentcompilation of Robie and Hemingway (1995) lists the enthalpy as
with Bryndzia and Kleppa (1988) as the source. Thus, we seeexamples of most of the problems mentioned above.

In this paper we present the results of an evaluation of selectedthermodynamic data of arsenic species. The results are of two types with onethat consists of data that have been fitted with a weighted least-squaresregression, and a second that is derived from the first least-squaresdetermined group by standard thermodynamic relationships. The results (inTables 1a, 1b, and 2) and their implications for geochemistry andgeochemical modelling are then discussed with known occurrences,observed mineral transformations in the environment and calculatedrelationships. The objective is to provide a consistent and coherentframework of thermodynamic calculations and field relationships for mineralstabilities among arsenic species.
2. GENERAL APPROACH AND THE EVALUATION OF
ELEMENTAL ARSENIC
From hundreds of papers that were found from the literature containingmeasurements on arsenic reactions from which thermodynamic data mighthave been extracted, measurements on 77 substances or reactions containedin 40 studies were selected for simultaneous least-squares regression. Thesesubstances or reactions were limited to elemental arsenic and simplecompounds, the oxides and sulfides, their solubilities and hydrolysisproducts. Elemental arsenic was regressed separately because a differentfitting procedure was used. This procedure is explained below. Details of theoriginal papers that formed the basis for the least-squares regression of allthe data and corrections that were made to the original measurements will befound in Archer and Nordstrom (2000). These details are beyond the scopeof this paper.
Treatment of the measured reactions for arsenic species requiredadoption of thermodynamic properties of some other substances, e.g.
etc. Most previous thermodynamic property compilations suffer fromsome type of networking problem. Consequently, such a choice cannot bemade lightly. The most obvious choices could be either Wagman et al.(1968) or the CODATA values from Cox et al. (1989). The Wagman et al.(1968) values were generated quite some time ago and there are apparentproblems with sulfate and carbonate species. These species are, of course,important in geochemical modeling of ground waters. On the other hand,there are problems with thermodynamic properties of at least some of thealkali halides given in the CODATA recommendations (Archer, 1992; Rardand Archer, 1995), species that are also important in geochemical modeling.We also have reactions that involve species not considered by Cox et al.
4 Chapter 1

1. Arsenic thermodynamic data and environmental geochemistry 5
(1989) as being “key”, e.g. . There are undisclosed optimizedproperties inherent in the CODATA recommendations, a fact that makesthermodynamic consistency based on the CODATA properties not possible(Archer, 2000). Hence, we chose to use the Wagman et al. (1968) properties,recognizing that its problems potentially affect the present work less thanwould the problems associated with the CODATA values. Properties givenbelow are based on the common conventional standard pressure of 1 atm(101.325 kPa).
Thermodynamic properties for were calculated from a least-squares representation using a cubic-spline method described previously(Archer, 1992; Archer et al., 1996). Briefly, a function f(T) was used,where:
and where T is temperature, was 1 K , was the molar heatcapacity, was 1.0 , was the coefficient for the contributionto the heat capacity of the conduction electrons, and was arbitrarily chosento be 0.32 for the present case. The function (T) of equation (1) was fittedwith a cubic spline using polynomials of the form:
where the subscript i refers to the polynomial that contains the specifiedvalue of T and spans the temperature range . A particular pairis referred to as a "knot." A "natural spline" end condition (i.e. secondderivative equal to 0) was imposed at the highest temperature end knot. Theend condition imposed at the lowest temperature knot was a value of -b(-0.2) for the first derivative. This approach was equivalent to assuming thatthe Debye temperature was independent of temperature near 0 K. (For thepurpose of calculation: . The calculated heat capacity was:
Equation (3) was integrated numerically to obtain the enthalpy. Themodel was determined by fitting to the selected values with a nonlinearleast-squares program. The vector of residuals was calculated using thenumerical integration of equation (3) to obtain the enthalpy increments.Included in the representation were the enthalpy increment measurementsfrom Klemm et al. (1963) and the heat capacity values given by Culvert

6 Chapter 1
(1967), Paukov et al. (1969), and Anderson (1930). The heat capacitymeasurements from Culvert ranged from 0.7 K to 4 K. We have includedonly the measurements from 1 K to 4 K, as the lower temperaturemeasurements are affected significantly by nuclear spin contributions. Theheat capacity measurements from Paukov et al. and Anderson spanned thetemperature ranges of 13.8 K to 289 K and of 57 K to 291 K, respectively.The enthalpy increment measurements reported by Klemm et al. (1967)were performed with a Bunsen ice calorimeter. Klemm et al. foundeccentricities in several different properties of arsenic near 500 K, includingthe enthalpy, unit cell measurements, and electrical and magnetic properties.Taylor et al. (1965) measured the unit cell dimensions, and electrical andmagnetic properties, as functions of temperature for arsenic crystals. Theydid not observe the effects reported by Klemm et al. Because the second-order transition reported by Klemm et al. was not reproducible, we did notinclude it in our representation of the thermal properties of arsenic. Theresults gave the standard state entropy at 298 K ofwhich compares very favourably to the value obtained by Ball et al. (1988)of by refitting the heat capacity data of Hultgren et al.(1973). The value given by Hultgren et al. (1973) isand appears in Robie et al. (1978) and Robie and Hemingway (1995). Theentropy value of that appears in Table 1a was obtained bytaking the fitted elemental arsenic data and fitting it with all the other arsenicdata. Even though this entropy value has decreased slightly in the overallfitting, the residual indicates that the entropy has a loweruncertainty than indicated by Hultgren et al. (1973) and the difference in theentropy from refitting is not significant.
3. RESULTS AND DISCUSSION
The results of simultaneous weighted least-squares regression of the dataand some of the unfitted but derived quantities are shown in Tables 1a, 1b,and 2. Table 1a displays elemental arsenic, its simple oxides, and thereactions for arsenic oxidizing to arsenic trioxides. Table 1b introduces thehydrolysis species for As(III) and As(V) in solution, the hydrolysisreactions, and the solubility reactions for the simple oxides. Single speciesare shown at the top of each table with the reactions underneath. Thefollowing discussion describes some of the mineral occurrences for thesesubstances, describes their relative stabilities from field observations, andconsiders the implications of the evaluated thermodynamic data in terms ofthese occurrences.

1. Arsenic thermodynamic data and environmental geochemistry 7
3.1
There is no known mineral with the formula of but polymorphicminerals have been identified for and . These minerals arecompiled in Table 3 along with their formulae, crystal class and space group,and references for their crystallography and occurrence. Additional arsenicsulfide minerals of different stoichiometries than have been includedin this list because they commonly occur with the other phases, although nothermodynamic data is known for them.
Arsenolite and claudetite have nearly identical free energies of formation,making it difficult to determine the most stable phase under standard stateconditions. Wagman et al. (1982) give claudetite as the most stable
Minerals in the As-S-O system

8 Chapter 1

1. Arsenic thermodynamic data and environmental geochemistry 9

10 Chapter 1
polymorph. Robie and Hemingway (1995), however, list arsenolite as themost stable phase, giving Wagman et al. (1982) as the only source for thefree energy data yet reporting rather different numbers. Carefulconsideration of solubility, electrochemical, vapor pressure, heat capacity,entropy, and reaction enthalpy data along with the least squares weightedregression of the data leads to claudetite having the greater stability by –0.19
(Archer and Nordstrom, in press). One of the more definitive studieswas by Kirschning and Plieth (1955) who determined the temperature oftransition to be –33°C, above which claudetite was the more stable phase.Palache et al. (1944) report an observation that suggests claudetite forms athigher temperatures than arsenolite (>100°C), as well as paramorphism ofarsenolite after claudetite but with such a small difference in free energy,small changes in temperature, pressure, grain size, humidity, and the salinityof solutions in contact could easily change the relative stability. It is clearthat arsenolite and claudetite have formed as a secondary product ofweathering. These dimorphs are typically white powdery coatings that haveformed from the oxidation of arsenopyrite (Palache et al., 1944; Roberts andRapp, 1965), from the oxidation of realgar (Beyer, 1989; Kelley, 1936;

1. Arsenic thermodynamic data and environmental geochemistry 11
Palache et al., 1944), from the oxidation of native arsenic (Clark, 1970;Palache et al., 1944), and from the weathering of scorodite (Eckel, 1997).They are often intimately associated with each other (Dana and Ford, 1949).
Orpiment appears to have a wide range of stability, being found as ahypogene mineral in epithermal ore deposits (i.e. formed from ascendinghydrothermal solutions at temperatures of roughly 50-200oC, Lindgren,1928; Park and MacDiarmid, 1975), as a precipitate in hot springs of warmto boiling temperatures (see Chapter 4, this volume), in fumarolicencrustations (Vergasova, 1983; White and Waring, 1963), as a sublimatefrom mine fires and burning coal seams (Lapham et al., 1980; Palache et al.,1944; Zacek and Ondrus, 1997), and, commonly, as a supergene mineral(formed under surface or near-surface weathering conditions) from theweathering of realgar and sometimes arsenopyrite (Dana and Ford, 1949;Palache et al., 1944). Realgar, however, seems to be more typical ofhypogene mineralization. Beran et al. (1994), for example, found fluidinclusions in realgar from the Allchar deposit, Macedonia, that gavehomogenization temperatures of 144-170°C. At the Mercur gold deposit inUtah, USA, Jewell and Parry (1988) found a calcite-realgar vein assemblagein which the fluid inclusion in the calcite gave formation temperatures of150-190°C. Orpiment also occurs at Mercur in a separate vein assemblagewith pyrite. Although realgar is found in fumarolic encrustations, mine firesublimates, and hot spring environments (Clarke, 1924; Palache et al., 1944;Zacek and Ondrus, 1997), it is not commonly found as a direct precipitatefrom solution at temperatures less than 100°C like orpiment. As long ago as1851, de Senarmount (1851) found that when either pulverized realgar ororpiment were heated in a sealed tube with at 150°C they wouldrecrystallize to realgar. Mixtures of realgar and orpiment were observed bythe senior author to coat rocks from a hydrothermal steam vent of about180°C at Solfatara, Italy (also see Sinno, 1951). Migdasov and Bychkov(1998) note that a zonation between orpiment and realgar seems to occur inthe Uzon Caldera, Kamchatka, with realgar occurring between 70 and 95°C.This temperature range seems to be the lowest observed for the formation ofrealgar that we are aware of. It is also noteworthy that the occurrence of anamorphous (to X-ray diffractometry) orpiment phase is well known (Eary,1992) but no one has reported an amorphous realgar phase. Amorphousphases commonly result when insoluble precipitates are formed at lowtemperatures (0-50°C). These observations suggest that realgar may be morestable at higher temperatures and orpiment is more stable at lowtemperatures. To test the consistency of this observation withthermodynamic data, we calculated the equilibrium boundaries betweenorpiment and and between and arsenic as a function ofthe partial pressure of , and temperature. It was assumed that thefugacity of was equal to the partial pressure. The results shown in

12 Chapter 1
Figure 1 indicate that although the stability field of orpiment decreases withincreasing temperature, so does the stability field of realgar because ofencroachment from the expanding field of native arsenic. Both orpiment andrealgar require higher fugacities of sulfur to maintain equilibrium stability athigher temperatures. Although there are uncertainties in the thermodynamicproperties for realgar and orpiment that need further refinement, the generalfeatures of this stability diagram are probably correct. Hence, both orpimentand realgar are stable over a wide range of temperature but realgar is stableover a narrow range of sulfur fugacity. Although this stability diagram doesnot show any increasing stability of realgar with temperature, it does pointout an important aspect. Orpiment and realgar are often found together andsometimes one or the other is found alone. These observations can help toconstrain the sulfur fugacity of the hydrothermal system. The coexistingorpiment/realgar assemblage provides a convenient buffer for the sulfurfugacity and may provide a fugacity estimate if the temperature is known ora geothermometer if the fugacity is known.
The formation of sulfide minerals such as realgar and orpiment is usuallythought of as a simple inorganic precipitation phenomenon. Recentinvestigations by Huber et al. (2000), however, have found an anaerobic,hyperthermophilic, facultatively organotrophic archaeon that respiresarsenate and precipitates realgar. Pyrobaculum arsenaticum, is the firstmicroorganism to be reported that can precipitate realgar biologically overits temperature range of growth, 68 to 100°C. It growschemolithoautotrophically with carbon dioxide as a carbon source, hydrogenas electron donor, and arsenate, thiosulfate, or sulfur as electron acceptors. Italso respires selenate when grown organotrophically and forms elementalselenium. It was isolated from the Pisciarelli Solfatara, Italy. Newman et al.(1997) also found a bacterium, Desulfotomaculum auripigmentum, thatprecipitates orpiment both intracellularly and extracellularly.
Realgar, when exposed to solar radiation, transforms to a powderymaterial identified as pararealgar, a polymorph of realgar (Roberts et al.,1980). Pararealgar differs from realgar only in the manner in which the
molecules stack in the unit cell (Bonazzi et al., 1995). When differentwavelengths of light were tested, Douglass et al. (1992) found that less than670 nm was needed to detect the transformation and the lower thewavelength, the faster the reaction. Raman spectroscopy has been used tocharacterize pararealgar and it has become an important tool in theunderstanding of art history and art preservation (Trentelman et al., 1996).Earlier literature (Palache et al., 1944; Wells, 1962) describes realgar asbreaking down to orpiment and arsenolite when exposed to light for longperiods of time. This observation is interesting in that it suggests that theassemblage orpiment plus arsenolite may be more stable than realgar understandard state conditions.

1. Arsenic thermodynamic data and environmental geochemistry 13
Apparently alacrinite is also a low-temperature polymorph that simplystacks differently as well (Burns and Percival, 2001). We are not aware ofany thermodynamic data on either pararealgar or alacrinite but since thecrystal structures are identical except for molecular stacking, the freeenergies should be very similar to within the accuracy of calorimetric orsolubility measurements. Duranusite and dimorphite (and possibly uzonite)are secondary alteration products of realgar (Clark, 1972; Marquez-Zavaliaet al., 1999).
Native arsenic has been reported from numerous arsenic-rich mineraldeposits (Clarke, 1924; Dana and Ford, 1949; Eckel, 1997; God andZemann, 2000) but the descriptions of small aggregates, crystalline, massive,and botryoidal arsenic are consistent with a hypogene origin (e.g. Clark,1970; Paronikyan and Matevosyan, 1965). It is commonly found when thereis an abundance of arsenic sulfide minerals in a hydrothermal deposit.Hence, native arsenic is a product of low-temperature epithermalmineralization (50-200°C) under sulfur-deficient and strongly reducingconditions rather than a weathering product. Where native arsenic is foundexposed to weathering, under dry conditions, it has usually developed acoating of arsenolite or claudetite or both (Clark, 1970; Palache et al., 1944).In low-temperature sedimentary conditions (0-50°C) there is frequentlymuch more sulfur and iron available than arsenic so that the arsenic isincorporated into arsenian pyrite or orpiment rather than occurring in thenative form. Arsenolamprite is a dimorph of arsenic that is very rare and is
14 Chapter 1
known to occur in carbonate-hosted mineralized zones. It may be stabilizedby high concentrations of trace elements because the original type materialcontained up to 3% Bi.
Many other arsenic-containing minerals are known and have somethermochemical measurements but they are beyond the scope of this paper.
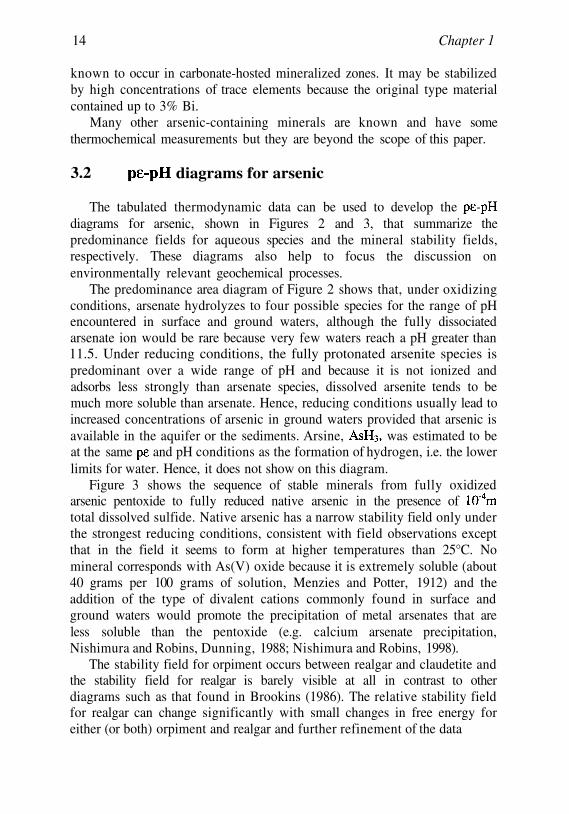
3.2 diagrams for arsenic
The tabulated thermodynamic data can be used to develop thediagrams for arsenic, shown in Figures 2 and 3, that summarize thepredominance fields for aqueous species and the mineral stability fields,respectively. These diagrams also help to focus the discussion onenvironmentally relevant geochemical processes.
The predominance area diagram of Figure 2 shows that, under oxidizingconditions, arsenate hydrolyzes to four possible species for the range of pHencountered in surface and ground waters, although the fully dissociatedarsenate ion would be rare because very few waters reach a pH greater than11.5. Under reducing conditions, the fully protonated arsenite species ispredominant over a wide range of pH and because it is not ionized andadsorbs less strongly than arsenate species, dissolved arsenite tends to bemuch more soluble than arsenate. Hence, reducing conditions usually lead toincreased concentrations of arsenic in ground waters provided that arsenic isavailable in the aquifer or the sediments. Arsine, was estimated to beat the same and pH conditions as the formation of hydrogen, i.e. the lowerlimits for water. Hence, it does not show on this diagram.
Figure 3 shows the sequence of stable minerals from fully oxidizedarsenic pentoxide to fully reduced native arsenic in the presence oftotal dissolved sulfide. Native arsenic has a narrow stability field only underthe strongest reducing conditions, consistent with field observations exceptthat in the field it seems to form at higher temperatures than 25°C. Nomineral corresponds with As(V) oxide because it is extremely soluble (about40 grams per 100 grams of solution, Menzies and Potter, 1912) and theaddition of the type of divalent cations commonly found in surface andground waters would promote the precipitation of metal arsenates that areless soluble than the pentoxide (e.g. calcium arsenate precipitation,Nishimura and Robins, Dunning, 1988; Nishimura and Robins, 1998).
The stability field for orpiment occurs between realgar and claudetite andthe stability field for realgar is barely visible at all in contrast to otherdiagrams such as that found in Brookins (1986). The relative stability fieldfor realgar can change significantly with small changes in free energy foreither (or both) orpiment and realgar and further refinement of the data

1. Arsenic thermodynamic data and environmental geochemistry 15

16 Chapter 1
would help eliminate these ambiguities. An earlier attempt to fit thethermodynamic data resulted in an impossible chemography in which realgarwas never stable over any temperature range relative to native arsenic andorpiment. Errors in enthalpy, entropy, and free energy are too large at themoment to get a better estimate for these stability fields than what we havetabulated.
3.3 Matters of stoichiometry
The first problem has to do with the appropriate stoichiometry of acompound. For example, arsenic (III) oxide appears in the literature as
or Similarly, the formula for realgar appears variously asor AsS. The higher order stoichiometries reflect the unit
structure of bonding in dominantly covalent compounds. They are usefulfrom a bonding and crystal structure viewpoint but serve no purpose inchemical thermodynamics and only the simplest unit stoichiometry is used inthis paper: for arsenolite and claudetite, AsS for realgar, and fororpiment.
Several different formulae were given in the earlier literature to describethe species formed when was dissolved in water under neutral ormildly acidic conditions. In fact, one finds several of these listed in Wagmanet al. (1968; 1982) which gave properties for both andThose species were redundant to each other in Wagman et al. (1982), aswere the species and Redundant species cannot beincluded in model calculations, if one expects to obtain correct results fromthe simulation. These two redundancies were not identified as such in theoriginal tables but were noted by Wagman et al. (1982) in an introduction tothe 1982 publication. Raman spectra (Loehr and Plane, 1968) wereconsistent with being the predominant form of dissolved As(III) indilute neutral solution. We adopted this formulation here and did notconsider the other earlier formulae.
3.4 Polymerization in aqueous solution
At higher concentrations of dissolved As(III), polymeric species mayform in solution and the implications from their formation must beunderstood. A particular equilibrium constant for an aqueous reaction willdepend on what species, or what other reactions, are presumed to exist in thesolution. It sometimes happens that tables of thermodynamic properties mayhave been generated by averaging equilibrium constants for a particularreaction or by averaging other thermodynamic properties derived therefrom.In some instances, appropriate attention had not been given to the fact that

1. Arsenic thermodynamic data and environmental geochemistry 17
the equilibrium constants that were being averaged had been obtainedoriginally from different assumptions regarding the species present in thesolution. Such averaged equilibrium constants will introduce errors in theoverall model assumed for the system. An example of indiscriminateaveraging of equilibrium constants for the generation of tabulatedthermodynamic properties was given previously by one of the authors(Archer, 1998).
Such a problem arises with respect to the first dissociation constant ofarsenious acid, Table 4 gives some of the equilibrium constantvalues found in the literature for the first deprotonation step. The values inthe table are for 298.15 K and all are standard-state values; this means thatadjustments were made to some of the values given in the literature. Thevalues in the table fall, more or less, into two groups of values. The firstfour values were determined from potentiometric titration followed with aglass electrode. The value from Garrett et al. (1940) was obtained from astudy of the pH and the solubility of in solutions containing differentamounts of sodium hydroxide or hydrogen chloride. The two values fromIvakin et al. (1976) were determined from 1) a study of the absorptivity ofarsenic-containing solutions and 2) potentiometric titrations of arseniousacid with an alkaline solution of arsenious acid.
Two distinctly different model assumptions characterize the two groupsof values. The first group was obtained with an assumption that the onlyreaction that occurred in the solution was the deprotonation reaction as inequation 4.
The second group of values came from studies where it was assumed thatpolymerization reactions occurred, such as the formation of inaddition to the deprotonation reaction. For chemical and mathematicalreasons, the dissociation constant calculated from a set of measurementsbecomes smaller as one introduces polymeric anions into the model. Thedifferences of the models chosen, at first appearance, could serve to explainthe differences of the equilibrium constants given in the previous table.Unfortunately, the situation, from the perspective of data evaluation, is morecomplex. In principle, there should be a sufficient dilution of arsenious acidfor which one would not expect the formation of a significant proportion ofspecies like upon addition of base. For such a condition, theequilibrium constant determined assuming that only the monomer exists,should approach that determined for the multi-species model. Britton andJackson (1934) performed potentiometric titration at two concentrations ofarsenious acid (0.0170 and 0.0914 molar) and obtained essentially the same

18 Chapter 1
value. Therefore, all of the variation of the equilibrium constants is not yetexplained by the assumptions of different models.
Raman spectroscopic studies of aqueous solutions of arsenious acids havebeen conducted for water solutions saturated with arsenic oxide and forratios of ranging from 3.5 to 15 (Loehr and Plane, 1968).The spectra obtained in those studies were interpreted as being consistentwith the formation of mono-arsenic species only. No peak was observed thatwas attributed to either an As-As bond or to an As-O-H-O-As species, wherea delocalization occurs about the hydrogen atom. Ivakin et al. (1976)assumed that one of the species that existed in aqueous solution was
However, colligative property determinations, e.g. the freezing-point depression measurements from Roth and Schwartz (1926), were notconsistent with significant dimerization of the arsenious acid. Thus, one isleft with a quandary. One can accept the conclusion from the Ramanspectroscopy and the larger value of K for eq 4. But then one has no way ofexplaining the greatly increased solubility of As(III) in basic solutions overthat predicted by assumption of the monomeric-only model. Conversely, ifone accepts the formation of poly-As(III) species in solution, then how doesone interpret the Raman spectroscopy results? (There is a recent theoreticalstudy that suggests the existence of circular trinuclear arsenic species inneutral solution (Tossell, 1997). Additionally, a recent study by Pokrovski etal. (1996) may also support the existence of polynuclear arsenic species insolution.). The problem of which value or which model to accept for the firstdeprotonation step, is not merely academic. This is because the Gibbs energyof formation of is a primary contribution to the Gibbs energies offormation of the aqueous arsenite ion and crystalline arsenite compounds.
Our interest here is the generation of a set of properties that are useful formodeling the geochemistry of clean and contaminated waters, industrial

1. Arsenic thermodynamic data and environmental geochemistry 19
process and waste fluids, and related problems. These fluids are generallydilute in arsenic and do not contain the high levels of hydroxide consideredby Garrett et al. (1940). Therefore, we have not included in our tables, ormethod, the polymeric forms suggested by Garrett et al. (1940), Ivakin et al.(1976), and Pokrovski et al. (1996).
To suppress dissociation of the arsenic acid, the measurements wereconducted in solutions acidified with hydrochloric acid of (1 to 6) M. Thepresence of large amounts of chloride in the acidified arsenic solutions isproblematic. The formation of for x from 0 to 2, has beenproposed to explain the observed increases of solubility of As(III) inhydrochloric acid (Garrett et al., 1940).
Arcand (1957) determined distribution coefficients of As(III) between ahydrochloric acid phase and a dichlorodiethyl ether phase. He used hismeasurements, determined at different concentrations of HCl(aq), to arguethat complexes of the type existed in those solutions for xfrom 0 to 3. He used solubility data of arsenic trioxide in and
to argue the existence of in acid solutions also. Hecalculated approximate equilibrium constants for formation of
, , and . Finally, he showed that theassumptions of species and values of the equilibrium constants nearlyquantitatively represented the dependence of Foerster and Pressprich’s(1927) emf measurements on the concentration of hydrochloric acid in thesolution. Consequently, there were unaccounted species with differentactivities in Foerster and Pressprich’s (1927) measurement cells and the lackof accounting of these species may have compromised the determination of
determined for eq 5 in some thermodynamic compilations. Thesignificance of a lack of confidence in the thermodynamic properties ofarsenic acid is that they contribute to the formation properties of the arsenateions, , and and also to the thermodynamicproperties of crystalline arsenate compounds.
3.5 Complications in chloride media
Wagman et al. (1968, 1982) gave a value for the Gibbs energy offormation of undissociated arsenic acid. That value was obtained fromvalues reported by Foerster and Pressprich (1927) and auxiliary values.Foerster and Pressprich (1927) measured the electromotive force (emf) ofcells in which the electrochemical reaction was presumed to be:

20 Chapter 1
3.6 Discrepancies in the arsenic sulfide system
Some tabulations of thermodynamic properties of arsenic compounds listthe enthalpies of formation for and to be of the order of –71and , respectively. These values, when accompanied withreasonable values of the entropies of the crystalline phases, and theelements, lead to Gibbs energies of formation of the same magnitude. Thoseenthalpies were obtained from oxygen combustion measurements performedby Britzke et al. (1933). The products of the combustion were a mixture ofarsenic oxides and compounds. (It was recognized some time ago thatthere are two crystalline forms of each of and and that eachpair has an equilibrium interconversion temperature substantially aboveroom temperature.) Barton (1969) examined the phase behavior of the As+Ssystem as a subset of his work on the Fe+As+S system and concluded thatthe enthalpies of formation were much too negative and that better valueswere on the order of –36 and for andrespectively. Johnson et al. (1980) measured the enthalpy of fluorinecombustion of samples of the high-temperature form of AsS and of glassy
They combined those values with other measured properties andsome estimates to obtain enthalpies of formation of and
for and respectively. Subsequently Bryndzia andKleppa (1988) used direct-synthesis calorimetry and obtained enthalpies offormation of and for and
respectively. The differences between these two more recententhalpy determinations for these two arsenic sulfide minerals, (–5 and –9)
remain large for the purpose of calculating equilibria in a systemcontaining arsenic, sulfur, water and other potential components. Bryndziaand Kleppa (1988) observed previously that enthalpies of formation of othermaterials determined by means of fluorine combustion disagreed with bothobserved phase behavior and high-temperature solution calorimetry, e.g., thecase of chalcopyrite. Nonetheless, the fluorine reactions for these materialsapparently went to completion with well-defined end products and a cavalierdismissal of them would not be wise.
Fortunately, for at least orpiment, there is additional informationavailable that helps to clarify the picture. In a separate study, Webster (1990)measured the solubility of synthetic orpiment in water and her value gives
for the reaction:
at 298.15 K. This value is in very good agreement with the enthalpy offormation determined by Bryndzia and Kleppa (1988). Based on the lack of

1. Arsenic thermodynamic data and environmental geochemistry 21
agreement of the Gibbs energy of orpiment determined from fluorinecombustion measurements with that obtained from 298.15 K equilibriumdata, we gave insignificant weight to the fluorine combustion results for bothorpiment and realgar.
Helz et al. (1995) interpreted differences between the solubilitydeterminations made independently by Webster (1990) and by Mironova etal. (1984) as being due to differences in the Gibbs energies of formation ofthe crystalline orpiment samples used in the respective studies. Webster(1990) used a synthetic orpiment and Mironova et al. (1984) used a naturallyoccurring orpiment crystal. Helz et al. (1995) concluded that the sample usedby Webster (1990) was less stable than the naturally occurring orpiment byapproximately . The Gibbs energy of formation obtained fromWebster’s solubility determinations for the synthetic crystal is, however, invery good agreement with the enthalpy of formation determined by Bryndziaand Kleppa (1988) and the entropy determined from low-temperatureadiabatic calorimetry. The latter two values were obtained from naturalorpiment crystals. We also note the following. Bryndzia and Kleppa (1988)determined the enthalpy of fusion of natural orpiment to be at298.15 K. Myers and Felty (1970) determined the enthalpy of fusion ofnatural orpiment to be at 588 K. Adjustment of that valueto 298.15 K gave using the enthalpy increment forvitreous from Johnson et al. (1980) and the enthalpy increment fororpiment from Blachnik et al. (1980). Blachnik et al. (1980) measured theenthalpy of fusion of a synthetic orpiment. Their enthalpy of fusion, whenadjusted to 298.15 K, was These results suggestthermodynamic equivalence of some synthetic orpiments with some naturalorpiments within about or less. Finally, we note that theuncertainty in the Gibbs energy of reaction for 298.15 K from Mironova etal. (1984) was and thus represents the entire difference betweenthe Gibbs energies of reaction from Mironova et al. (1984) and that fromWebster (1990). Thus, it is not so clear that the differences in the solubilitydeterminations must have arisen from differences in the stabilities of thedifferent crystal samples rather than having arisen from differences in thesolubility determinations per se (i.e. systematic error).
For orpiment, the solubility data and the entropy determined fromcalorimetric measurements support Bryndzia and Kleppa’s (1988)determination of its enthalpy of formation. This might lead one to accepttheir value for the enthalpy of formation of realgar also. However, if onealso takes Bryndzia and Kleppa’s value for the enthalpy of formation forrealgar and an entropy value determined from calorimetric values, theresulting Gibbs energy of formation of realgar has a fugacity of that islarger than that of orpiment, which is the opposite of what is expected on thebasis of chemography or on the basis of Barton’s (1969) phase diagram for

22 Chapter 1
the As + S system. Therefore, calorimetric measurements failed to provideinformation of sufficient accuracy to predict a reasonable phase diagram forthe arsenic + sulfur phase diagram and other considerations must be applied.We obtained thermodynamic properties of the realgar phases by acceptingBarton’s value for the chemical potential of the reaction:
the entropy of from Weller and Kelley (1964), and the enthalpyof transition for the transition of to at 540 K. Theenthalpy of formation calculated by this method is 3.2 moreexothermic than that obtained by Bryndzia and Kleppa (1988). Thesecalculations presume that the entropy obtained from Weller and Kelley’s(1964) calorimetric measurements from 52 K to 300 K, the assumption of anon-degenerate ground state for the of realgar at 0 K, and theassumption that no phase transition occurs between 0 K and 52 K arecorrect.
Eary (1992) prepared an amorphous sample of by precipitation ofthe sulfide from an aqueous solution of buffered at pH 4.0, towhich was added an excess of The precipitate was aged 1 to 3days, and washed with water to remove the buffer. X-ray analysis showedno realgar, orpiment, crystalline sulfur or crystalline arsenic. Earydetermined the solubility of this material at 298.15 K, 313.15 K, 333.15 K,and 363.15 K in solutions with the presence and absence of added sulfide.He gave equilibrium constants for the reaction:
at the four temperatures. The heat capacity of the reaction was estimated,from values of the heat capacities given in
Archer and Nordstrom (in press), and where we have assumed that the heatcapacity of the amorphous material is approximately equal to that of thecrystalline material. These values were used to calculate:
This relation was used to determine the entropy of reaction,The entropy of reaction corresponds to an entropy of
of We note that there is a lower bound to theuncertainty of the amorphous material, that being the entropy of crystallineorpiment, approximately 165 Therefore, a symmetricaluncertainty cannot be assigned in this case and we give 298.15

1. Arsenic thermodynamic data and environmental geochemistry 23
K) = (200 +60/-35) . The Gibbs energy of reaction waswhich when combined with other
Gibbs energies of formation for the species in equation (9) leads to
3.7
This value leads to They alsoobtained pK = 7.9 for the reaction:
This value leads to Clarke and Helz(2000) analyzed phase behavior in the copper + arsenic + sulfur+ watersystem and obtained a somewhat different value for the equilibrium constantfor eq 11. They obtained This value leads to
The minimum uncertainty inthis value, and presumably the immediately previous value is at least 1.8
. We took the former value that arose solely from the treatment ofEary’s solubility determinations over those obtained in the mixed arsenic +copper aqueous sulfidic system, because of difficulties in establishing theactivity of arsenic sulfide in the latter system.
3.8 Hydrolysis constants for aresenious acid
by two methods, potentiometric and spectrophotometric. The solutions had
Thioarsenites
There has been some debate as to the identity of the aqueous arsenicspecies that are present in an aqueous solution in equilibrium withwhere that solution contains an excess of sulfide over that which would bepresent from dissolution of alone (see e.g. Krupp, 1990; Spycher andReed, 1989). We had believed this controversy to have been settled recentlyby Helz et al. (1995) who utilized spectroscopy, molecular orbitalcalculations, and the solubility studies to arrive at the conclusion that theprincipal aqueous species in excess-sulfidic solutions are and
Helz et al. (1995) fitted th(1992) to obtain pK= 5.5 for the reaction:
e solubility measurements determined by Eary
Ivakin et al. (1979) determined the second and third ionization constantsof arsenious acid in NaCl and KCl solutions. The pK values were determined

24 Chapter 1
ionic strength 1 M and the temperature of the measurements was 293.15 K.The individual pK values were:
where the subscript to the equilibrium constant identifies the deprotonationstep. We adjusted these values for the ionic strength effect, obtaining
and We used estimates of the entropies ofreactions (14) and (15) (–125 and respectively), to calculatethe Gibbs energies for 298.15 K. These values led to Gibbs energies ofreaction of and for reactions (14) and(15), respectively. These values are entered in Table 1b parentheticallybecause there is only one investigation and estimates had to be used toderive the values.
Sufficient physicochemical measurements exist to evaluate thethermodynamic properties for the simple arsenic minerals: native arsenic,arsenolite, claudetite, crystalline orpiment, andamorphous orpiment. The evaluation has been done by examining theavailable literature, screening and selecting the data, and performing asimultaneous weighted multiple least-squares regression on substances andreactions of arsenic, its oxides, its sulfides, and their aqueous hydrolysisproducts. These results have been combined with known occurrences andmineral transformations observed in nature to provide a coherent frameworkfor mineral reactions in the system. The results show thefollowing:
Claudetite is the most stable phase of arsenic trioxide under standardstate conditions.Claudetite and arsenolite are products of weathering of severalarsenic sulfide minerals, of native arsenic, and of scorodite.
1.
2.
4. CONCLUSIONS
1. Arsenic thermodynamic data and environmental geochemistry 25
Claudetite and arsenolite are stable in equilibrium with waters ofhigh pH.Orpiment is more stable than realgar at standard state conditions andis stable in equilibrium with waters of low pH.Orpiment and realgar can form under a wide variety of conditionsthat include hydrothermal mineralization, hot spring environments,mine fire sublimates, and fumarolic encrustations.Realgar appears to be more stable than orpiment in high temperatureenvironments (100-200°C).Native arsenic is stable only under strongly reducing conditions andalthough it appears as a stable phase under standard state conditions,field observations indicate it only forms under hydrothermalconditions.New polymorphs of realgar, pararealgar and alacrinite, have beencharacterized and reported in the literature and appear to form underearth’s surface conditions. Pararealgar forms by visible lightradiation of realgar. No thermodynamic data exist for these phases.
ACKNOWLEDGEMENTS
The senior author wished to acknowledge the support of the NationalResearch Program of the USGS and the support of the EPA to actuallysample for thioarsenite species at Yellowstone National Park (unpublisheddata).
3.
4.
5.
6.
7.
8.

This page intentionally left blank

Chapter 2
Spectroscopic Investigations of Arsenic Species inSolid Phases
Andrea L. FosterMineral Resource Program, U.S. Geological Survey, Menlo Park, CA
Many of the important chemical reactions controlling arsenic partitioningbetween solid and liquid phases in aquifers occur at particle-water interfaces.Several spectroscopic methods exist to monitor the electronic, vibrational, andother properties of atoms or molecules localized in the interfacial region.These methods provide information on valence, local coordination,protonation, and other properties that is difficult to obtain by other means.This chapter synthesizes recent infrared, x-ray photoelectron, and x-rayabsorption spectroscopic studies of arsenic speciation in natural and syntheticsolid phases. The local coordination of arsenic in sulfide minerals, in arsenateand arsenite precipitates, in secondary sulfates and carbonates, adsorbed oniron, manganese, and aluminium hydrous oxides, and adsorbed onaluminosilicate clay minerals is summarized. The chapter concludes with adiscussion of the implications of these studies (conducted primarily in modelsystems) for arsenic speciation in aquifer sediments.
1. INTRODUCTION
Potable ground water supplies in many countries (including Bangladesh,India, Taiwan, Mongolia, Vietnam, Argentina, Chile, Mexico, Ghana, andthe United States) contain dissolved arsenic (As) in excess of themaximum level recommended for potable waters by the World HealthOrganization (WHO, 1993). The primary source of As is natural (derivedfrom interactions between ground water and aquifer sediments) in theselocations, and not anthropogenic (Azcue and Nriagu, 1994; Cebrian et al.,1994; Chen et al., 1994; Nickson et al., 2000; Welch et al., 1988; Welch etal., 2000). Aquifer sediments are composed of inorganic and organicparticles of various size and chemical reactivity that undergo a multitude ofsimultaneous chemical reactions, each occurring at a unique rate. These

28 Chapter 2
reactions occur almost exclusively at particle-water interfaces (Stumm,1992) and because of this, spectroscopic techniques that are sensitive tophysical or chemical properties of specific atomic and molecular species inthe bulk phase or at particle surfaces are needed. Such investigationsprovide unique information that is difficult or impossible to obtain by othermethods.
The designation of an aquifer as either a net “source” or “sink” withrespect to As depends on the overall mass of As transferred from solidphases to the dissolved phase (and vice versa) in all interfacial reactions.The most important interfacial reactions involving As species are adsorptionand precipitation reactions (resulting in arsenic retention by the solid phase),desorption and dissolution reactions (resulting in arsenic release from thesolid phase), and oxidation/reduction reactions (resulting in retention orrelease, depending on the particular chemistry of reactants and products;(Welch et al., 1988; Welch et al., 2000). Other reactions, such as ionexchange, hydrolysis, complexation, and polymerization that are importantfor trace metal cations (Davis and Kent, 1990) have not been shown to beinfluential in the partitioning of trace metalloid oxoanions such as arsenic inthe environment, but may be critical in specific systems.
The particles comprising aquifer sediments range in size from sand (2-0.5mm diameter; (Allaby and Allaby, 1990) to colloid (between 1 nm andin diameter; (Stumm, 1992). Smaller-sized particles and/or those withcomplex shapes have a higher surface area-to-volume ratio and morereactive surface area (i.e., the fraction of total surface area that participates ininterfacial reactions) per unit mass than larger, simply shaped particles(Parks, 1990). As a result, the smallest particles may dominate the overallmass transfer in aquifer sediments. These particles are commonly x-rayamorphous, meaning that their structure cannot be resolved using standard x-ray diffraction techniques. However, they are partially ordered, withcrystalline domains typically < 15 Å in diameter (Waychunas et al., 1996).Commonly, the smallest particles are also physically or chemically attachedto the surface of larger particles.
Mineral or particle surfaces are enriched with As due to several processesthat are collectively referred to as sorption (Parks, 1990), but the chemicalproperties of surface-associated As have been difficult to study directly.Outer-sphere, or physisorption, describes weak, long range, attractive forcesbetween the surface and sorbing As; inner-sphere, or chemisorption, refers tothe formation of chemical bonds between the surface and adsorbing As.Stronger adsorption is expected by the formation of a bidentate (two bond)adsorbed complex rather than a monodentate (1 bond) complex. Selectivechemical extraction methods have been useful for empirical determination ofthe dominant chemical/mineralogical compartments retaining As in aquifer

2. Spectroscopic Investigations of Arsenic in Solid Phases 29
sediments and soils, but it is generally agreed that these techniques havelimited applicability (Davis and Kent, 1990; Gruebel et al., 1988) and do notprovide the kind of information about interfacial reactions (particularly thecomposition and geometry of adsorbed As complexes) that geochemicalmodelers need for predictive purposes (Parks, 1990).
Spectroscopic techniques (particularly infrared, x-ray photoelectron, andx-ray absorption spectroscopy) have been applied to fill the information gapabout chemical speciation and interfacial reactions of As in model andnatural materials. They have been used to determine the structure of x-rayamorphous particles involved in interfacial reactions, to identify the types ofsorption reactions occurring in simplified model systems containing As andone or more phases, and to identify the valence and speciation ofpredominant As species present in natural, heterogeneous materials. Thischapter summarizes much of the recent spectroscopic information on arsenicspeciation in minerals and other solid phases that are analogous to phasespresent in aquifer sediments. These data are primarily derived from analysisof synthetic samples or natural model compounds.

30
2.
Chapter 2
MACROSCOPIC AND MOLECULAR-SCALETECHNIQUES FOR THE CHARACTERIZATIONOF ARSENIC IN SOLID PHASES
Solid-phase As can be found in many different forms in aquifersediments: examples include: (1) stoichiometric arsenic minerals; (2) solidsolution of arsenic in minerals or x-ray amorphous phases from trace (<1000 ppm) to atom percent levels; (3) coprecipitation of As with mineralsduring their formation; and (4) adsorption of As on particle surfaces. Thissection gives a brief background on the macroscopic and spectroscopictechniques that are commonly used for ascertaining As species in thesephases.
2.1 Extraction Methods of Arsenic Speciation in SolidPhases
Extraction methods were developed to obtain empirical informationabout the chemistry of a particular element in heterogeneous material thatmay contain multiple species of the element of interest. Species of anelement partitioned into solution by a particular extraction solution aregrouped into compartments named according to the dominant minerals orphases present in that compartment. When extraction solutions are appliedin order from the least to most chemically aggressive, the classiccompartmentalization, (in order from most to least available) is obtained: awater-exchangeable fraction, a carbonate fraction, a fraction associated withorganic matter, a fraction retained on iron, aluminum, and/or manganeseoxides or oxyhydroxides, and a residual fraction (usually assumed torepresent As hosted by silicate or sulfide minerals; (Tessier et al., 1979).Refinement of the original sequential extraction techniques now allows forthe discrimination of As associated with crystalline Fe hydroxides from Asassociated with x-ray amorphous Fe hydroxides and the specificidentification of sulfide-associated As (Keon et al., 2000). However, thestandard interpretation of sequential extraction data presupposes that there isno mass transfer between compartments during extraction, an assumptionthat has not proved valid in some empirical tests (Gruebel et al., 1988;Ostergren et al., 1999). As an example, during the extraction of Asassociated with Fe oxyhydroxides, the As released was partially readsorbedby aluminosilicate clay minerals (initially free of arsenic) that were notattacked by the extraction solution. This lead to an underestimation of thefraction of As associated with the Fe oxyhydroxides, and an overestimationof the fraction associated with the aluminosilicate residual (Gruebel et al.,1988).

2. Spectroscopic Investigations of Arsenic in Solid Phases 31
Another difficulty in the interpretation of sequential extraction data isthat the availability of As from most stoichiometric As minerals does not fitneatly into one of the predefined chemical/mineralogical compartments,because it will be a function of the mineral solubility and dissolution kineticsunder the chemical conditions of the extraction solution(s). For example,Voigt and Brantley (1997) determined that As in the mineral hoernesite
was released during the exchangeable, carbonate, andFe oxyhydroxide extraction steps before it was completely dissolved, leadingto an overestimation of the fraction of As in ion-exchangeable sites and Asassociated with carbonate minerals.
2.2 Spectroscopic Methods for Arsenic Speciation inSolid Phases
Spectroscopic analysis involves the measurement of energy absorbed oremitted by a system in response to an external perturbation. The absorptionand/or emission of energy results from changes in quantized magnetic,rotational, vibrational, or electronic energy levels of atoms or molecules inthe system. The external perturbation usually (but not always) takes theform of electromagnetic radiation. The widely used spectroscopictechniques of x-ray fluorescence and atomic absorptionspectrometry providequantitative information about the elemental composition of a sample; othertechniques, such as infrared, x-ray photoelectron, and x-ray absorptionspectroscopy, provide quantitative or semi-quantitative elemental speciationof a sample. The latter three techniques are briefly reviewed below. For adetailed explanation of general spectroscopic principles, the reader isreferred to Levine (1975).
2.2.1 Infrared (IR) and Raman Spectroscopy
IR and Raman are sensitive to the rotation and vibration of molecules insolid phases (crystalline or x-ray amorphous). Molecular units of similarstructure and composition absorb IR radiation in the same energy range,usually independent of the larger structure of the material; this propertymakes IR spectroscopy useful for studying molecules in the interfacialregion such as surface hydroxyl groups and As oxoanions on mineralsurfaces, and for fingerprinting the local environment of As in crystalline

32 Chapter 2
and x-ray amorphous solids. Some IR techniques can be conducted in situ(in the presence of adsorbed water), and others are solely ex-situ (the latterexperimental condition is less representative of the hydrated conditionspresent at mineral surfaces in the aquifer environment, but has analyticalbenefits). The interaction of arsenic oxoanions with surface hydroxyl groupson mineral surfaces can be studied by examination of changes in the IRsignal of arsenic group vibrations and/or surface hydroxyl group vibrationsas a function of arsenic sorption. IR spectra of natural materials are typicallycomplex and difficult to interpret quantitatively due to overlap of molecularvibrations arising from all the phases in the sample (Smith, 1996). For thisreason most IR studies of arsenic species have been conducted in synthetic,simplified systems.
Ex situ IR data are collected on dried, diluted powder films in a lowvacuum environment or one purged with a dry gas such as Attenuatedtotal reflectance (ATR)-IR spectroscopy provides surface-sensitive IRmeasurements and can be used for in situ studies of sorption phenomena.Raman spectroscopy is a related vibrational spectroscopy that providescomplimentary information to IR. It can also be used to collect vibrationalspectra of aqueous samples. Typical data reduction for vibrational spectrainvolves subtraction of a background spectrum collected under identicalconditions from the raw, averaged sample spectrum. Data analysis usuallyconsists of an examination of changes in peak position and shape and peakfitting (Smith, 1996). These and other spectral parameters are tracked as afunction of macroscopic variables such as pH, adsorption density, and ionicstrength.
2.2.2 X-ray Photoelectron Spectroscopy (XPS)
During an XPS analysis the sample is irradiated by photons in the softx-ray energy range of the electromagnetic spectrum (usually from a Mg orA1 x-ray source), and the signal intensity is measured as a function ofbinding energy of the escaping photoelectrons. This technique is surface-sensitive (usually < 100 Å; (Hochella, 1995). With an x-ray source, thephotoelectron spectrum is most sensitive to changes in electronic states, andcan be used to determine both valence and speciation information.Laboratory XPS experiments are conducted under ex-situ, mid-to-highvacuum conditions torr; Demuth and Avouris, 1983) due to theneed to characterize surfaces before and after reaction with specific agents(and so that the photoelectron signal is not significantly attenuated by gasesand water vapour in air).

2. Spectroscopic Investigations of Arsenic in Solid Phases 33
XPS spectra can be collected from powders or single crystals. Thebroadscan (low resolution) XPS spectrum, usually spanning ~1,000 eV,shows several peaks corresponding to the elements present in the samplesuperimposed upon a background. When high resolution (narrow scan)spectra are collected over smaller intervals spanning a peak of interest, asingle peak is usually observed to be composed of several peaks. Thesepeaks (called chemical shifts) are due multiple species of a single elementpresent in a sample. Chemical shifts arise from coordinative differences, asin surface vs. bulk atoms, and/or the presence of multiple oxidation states.Peak positions are calibrated by reference to an appropriate standard (usuallygold) collected under identical conditions as the sample. A backgroundfunction is subtracted from the photopeaks of interest, and peak fitting usingappropriate lineshape functions is applied. Details of XPS data collectionand analysis procedures as applied to arsenic can be found in Nesbitt et al.(1998; 1995; 1999). Similar to IR spectroscopy, XPS analysis is not an idealtechnique for the study of arsenic in complex, heterogeneous naturalmaterials due to peak overlap from all the elements present. However, it hasbeen very useful for the analysis of arsenic valence in model systems andsingle phases, as will be shown by examples in the sections to follow.
2.2.3 X-ray Absorption Fine Structure (XAFS) Spectroscopy
In an As K-edge XAFS experiment, both the source radiation and theabsorbed/emitted radiation are in the hard x-ray region of theelectromagnetic spectrum. The technique is sensitive to the scattering ofelectrons ejected from the innermost atomic core levels, and in contrast to IRor XPS, is exclusively element-specific. Quantitative oxidation stateinformation is routinely determined from x-ray absorption near-edgespectroscopy (XANES) spectra of materials with As concentrations as low as50 ppm, and under optimal conditions, and given plenty of time for datacollection, detection limits can be lowered. Quantitative information aboutthe number, distance, identity, and disorder (static and thermal) of atoms 5-7Å away from the average As atom is derived from analysis of extended x-rayabsorption fine structure (EXAFS) spectra in materials with Asconcentrations as low as 100 ppm, but commonly greater than 500 ppm.Spectra can be collected under in situ or ex situ conditions. The elementspecificity of XAFS spectroscopy makes it the technique of choice forexamining trace element species (particularly valence states) in complexnatural materials such as aquifer sediments. However, as with the otherspectroscopic methods, the identification of As species (as opposed tosimply determining oxidation states) present in natural materials is
34 Chapter 2
complicated by the presence of multiple species, because the bulk XAFSspectrum is a weighted sum of all species of a particular element present in asample. Nevertheless, it is often possible to identify the predominant Asspecies or at least eliminate potential species as major components (> 10%)of the spectrum by fitting the unknown XANES or EXAFS spectrum with alinear combination of model component spectra.
XAFS spectra are collected from concentrated or dilute specimensunder ambient conditions with, in many cases, no sample pretreatment (agreat benefit for the analysis of natural materials). Spatially-resolved XAFStechniques exist, but they are either in development or have limitedavailability; as a result, the majority of XAFS investigations to date havebeen carried out in bulk mode. Details of XAFS data analysis methods canbe found in (Hayes and Boyce, 1982; Sayers and Bunker, 1988). TheXANES portion is energy calibrated to a model standard (for arsenic, this istypically the elemental form, assigned an energy of 11,867 eV) for oxidationstate determination. Quantitative speciation information can be obtainedfrom the EXAFS spectrum by fitting using a non-linear, least-squaresalgorithm employing theoretical backscattering phase and amplitudefunctions for model absorber (As)-backscatterer pairs (e.g., As-O, As-Ca, orAs-Fe). These functions are derived from theoretical EXAFS spectragenerated by ab initio calculations of photoelectron scattering in knownstructures.
3. ARSENIC SPECIATION IN NATURAL ANDSYNTHETIC PHASES
Aquifer sediments are ultimately derived from rock weathering. Arsenicconcentrations in unmineralized rocks of the United States are highest insedimentary units (particularly marine shales), but are also elevated involcanic rocks and in metamorphic rocks derived from sedimentary units(Welch et al., 1988). Although mineral sources of As have been directlyidentified in only a few aquifer sediments to date, pyrite, arsenopyrite, and/orunspecified sulfide minerals are often proposed to be the primary source ofAs in ground waters (Gotkowitz et al., 2000; Nickson et al., 2000; Peters etal., 1999; Robinson et al., 2000; Serfes et al., 2000; Smedley andKinniburgh, 2001).
3.1 Arsenic Speciation in Sulfide Minerals
Arsenic-bearing sulfides typically form by crystallization fromhydrothermal solutions interacting with sediments, and/or by direct

2. Spectroscopic Investigations of Arsenic in Solid Phases 35
crystallization during late-stage pegmatite formation (Peters et al., 1999).Secondary (authigenic) sulfides may also be important in As sequestration(Morse, 1994). Although As-bearing sulfides and arsenides containing Pb,Cu, Ni, and Fe are known, arsenopyrite, (FeAsS) and arsenian pyritecontaining As in trace to atom percent levels) are quantitatively the mostimportant As-bearing sulfides reported from mineralized areas and may themost important As-bearing phases in the lithologic units that were eroded toform aquifer sediments in regions where ground water As concentrations aredetrimental to human health (Smedley and Kinniburgh, 2001). In particular,arsenian pyrite is much more commonly found than the stoichiometric Assulfides, and may be the single most important reservoir for reduced arsenicin sediments.
In soils and sediments, importance has been attached to valenceassignment because valence is commonly used to infer reactivity and toxicityof As. The assignment of valence in sulfides is complicated by strongcovalent bonding, and is perhaps not very reliable except in XPS studieswhere the valence of S and other elements can be determinedsimultaneously. XPS and XAFS analysis indicate that the average arsenicvalence in arsenopyrite is -1, as would be calculated for Fe with a valence of–2 and S with a valence of -1 (Nesbitt et al., 1995; Savage et al., 2000).However, up to 15% As(0) was observed on freshly cleaved arsenopyritesurfaces in vacuum by XPS (Nesbitt et al., 1995), an indication that the bulkvalence assignment may reflect a composite of multiple reduced As species(either formed by oxidation or present as small amounts of other minerals,particularly native As, within arsenopyrite). Nickel (Ni) is typically assigneda valence of +2 in oxides, hydroxides, and silicates; however, the XPS-determined valence of Ni in niccolite (NiAs) is +1, and the valence ofarsenic is –1 (Nesbitt and Reinke, 1999). The nominal valence of As inarsenian pyrite has been determined to be between 0 and –1 by XAFSspectroscopy (Savage et al., 2000).
Light or electron microscopic identification of As-hosting sulfides inaquifer sediments is usually precluded by the low modal abundance ofsulfide phases and/or As concentrations below detection limits ofconventional energy dispersive detectors. However, identification of As-bearing minerals is relatively simple using XAFS spectroscopy (when onetype of mineral is the predominant host). XAFS spectra can be used bothquantitatively and as chemical fingerprints to discriminate between arsenianpyrite in mine tailings and bulk arsenopyrite (Savage et al., 2000; Fig. 2a and2b). As-bearing sulfide phases can also be identified based on bonddistances: The shortest As-S bonds (between 2.23 and 2.28 Å) are found inarsenian pyrite and in the arsenic sulfosalts orpiment and realgar (Table 1).At 2.34 Å, the shortest As-S bond distance in arsenopyrite is considerably

36 Chapter 2
longer than in these phases. There are also quantitative differences in theAs-Fe and As-As bond lengths in these minerals that can also be used foridentification (Table 1).
Another common concern in the examination of natural materials is thecrystallinity of the As-hosting phase: because metastable x-ray amorphousmaterials are often finer-grained, they are probably more reactive than theircrystalline counterparts (if all properties such as the type and proportion ofsurface functional groups are equivalent in the materials). Helz et al. (1995)compared arsenic speciation in natural orpiment, natural realgar, andsynthetic x-ray amorphous arsenic sulfide. Based on similarities in theprimary As-S shell at 2.38 Å and the As-As shell at ~ 3.5 Å, amorphousarsenic sulfide was found to have a structure more similar to orpiment thanrealgar. However, S atoms between 3-4 Å that can be detected in the XAFSspectrum of orpiment could not be detected in the XAFS spectrum of theamorphous analog. This discrepancy might indicate a high degree ofpositional disorder in the amorphous phase, which might mask scatteringfrom S atoms more effectively than scattering from As atoms, since the latterhave about twice the number of electrons. The formation of amorphous Assulfide has been documented in pure cultures of anerobic, dissimilatoryarsenic-reducing bacteria (Newman et al., 1997) and XANES spectroscopy

2. Spectroscopic Investigations of Arsenic in Solid Phases 37
has been used to identify orpiment-like phases in a wetland sediment (LaForce et al., 2000), suggesting a re-evaluation of the importance ofauthigenic sulfide minerals that sequester As under anoxic conditions.
The reactivity of As-bearing sulfides in the subsurface is not wellunderstood. For example, under equivalent geochemical and hydraulicconditions, will an aquifer containing arsenopyrite have greater dissolved Asconcentrations than one containing arsenian pyrite? Field observationssuggest that arsenian pyrite weathers faster than arsenic-free pyrite [Savageet al., (2000) and references therein], and an XPS study demonstrates thatarsenopyrite oxidizes relatively slowly upon exposure to air or water(Richardson and Vaughan, 1989). More recent XPS work contradicts theearlier study, indicating that 24-hour air exposure and 8-hour water exposureproduces extensive oxidation of arsenopyrite surfaces and formation ofAs(V), As(III), and As(I) ions (Nesbitt et al., 1995) Fig. 3). Nevertheless,the newer study still indicates that As oxidation is more rapid than Soxidation on fracture surfaces of arsenopyrite (Nesbitt et al., 1995; Nesbittand Reinke, 1999). This observation may hold true for As-bearing sulfidesgenerally, and may be related to differences in electronic structure (the

38 Chapter 2

2. Spectroscopic Investigations of Arsenic in Solid Phases 39
increased p-character of the As bonds relative to S bonds) and/or tosubstitutional characteristics (As appears to exhibit clustered substitution inhydrothermal arsenian pyrite; Savage et al., 2000).
A recent report provides evidence that under anoxic laboratoryconditions, solids can enhance the oxidative attack of and FeS bydissolved Fe(III), whereas in the absence of (and under sterileconditions), is not affected by dissolved Fe(III) or even (Shippersand Jorgensen, 2001). This reaction does not need molecular oxygen toproceed, and could potentially take place even in anoxic aquifers. Furtherstudy is needed on the stability of sulfides generally, and As-bearing sulfidesin particular, under anoxic and suboxic conditions.
3.1.1 Arsenic Speciation in Arsenates and Arsenites.
Of the greater than 320 known As minerals, fewer than 10 are commonlyidentified in the environment, and with the exception of scorodite, the mostcommonly reported arsenic minerals are arsenic oxides or arsenic sulfides(Welch et al., 1988). Very little structural or thermodynamic data exists forarsenate and arsenite minerals, and even less spectroscopic information.Hess and Blanchar (1976) determined solubility products for synthetic A1,

40 Chapter 2
Ca, Fe, Mn, and Pb arsenate phases; of these, the Pb and Mn arsenates werepredicted to be stable under the geochemical conditions prevailing in twoMissouri orchard soil slurries. Sadiq (1997) calculated solubility isothermsas a function of pH for several metal arsenates, and concluded that Cd, Ni,Pb, Cu, and Zn arsenates were quite soluble and not expected to form inoxidized soil systems. In contrast, Sadiq (1997) determined that
and (structural information notgiven) have similarly low solubilities, and therefore could be stable inalkaline oxidizing systems. However, under acidic oxidizing conditions,
and were predicted to be the more stable phases.Rochette et al. (1999) found that under anoxic conditions (redox potential <0 mV), the experimental solubility of arsenate phases followed the followingorder:
In addition, Cummings et al. (1999) showedthat dissimilatory metal reducing bacteria could liberate As(V) fromscorodite. The As(V) was not reduced, but once liberated formed a newferrous arsenate phase with Fe(II) produced from the reductive dissolution ofscorodite. The precipitate was x-ray amorphous, but the ratio of Fe to Aswas estimated at 1:1 by SEM-EDS. Further complicating the problem, littlethermodynamic data for metal arsenite salts exists, to our knowledge.
Despite thermodynamic predictions and direct observations that metalarsenates control dissolved As concentrations under certain geochemicalconditions, minerals containing As oxoanions have not been directlydocumented microscopically or spectroscopically in aquifer sediments, toour knowledge. Most locations where metal arsenates have been identifiedhave the common characteristic that As porewater concentrations areextremely high. Scorodite and various Ca-Fe(III) arsenatephases have been identified in seasonally dry and continuously inundatedgold mine tailings (Paktunc et al., 2000), and an unusual Mg-arsenate phasehas been described from a tidally-influenced site contaminated by industrialprocesses (Voigt and Brantley, 1997). Dissolved As concentrations in As-impacted aquifers rarely reach the levels needed to induce the precipitationof metal arsenates. However, scorodite is typically found in close associationwith sulfide phases such as arsenical pyrite or arsenopyrite (Dove andRimstidt, 1985), suggesting precipitation due to local supersaturation ratherthan precipitation from the bulk aqueous medium was the important processin its formation.
Although formation of arsenic oxoanion minerals may be uncommon inthe subsurface, many other minerals in which oxoanions are the fundamentalstructural unit (most commonly sulfates, phosphates, and carbonates) canassimilate trace amounts of arsenic via adsorption and coprecipitationprocesses. By virtue of their ubiquitous nature in sediments, these phases

2. Spectroscopic Investigations of Arsenic in Solid Phases 41
may serve as significant repositories of arsenic even when bulk arsenicconcentrations are at trace levels. Adsorbed As is subject to desorption dueto changing geochemical conditions, including phase dissolution resultingfrom changes in pH and competitive desorption (especially by highconcentrations of inorganic ligands such as andby simple organic ligands), but the availability of coprecipitated arsenicdepends more on the bulk mineral solubility, because a greater proportion ofthe arsenic is retained in the interior of the phase rather than at the surface.
The results of several EXAFS studies of arsenic species in minerals andsynthetic phases are collected in Table 2. The studies indicate that arsenicsorption on these minerals primarily occurs by two mechanisms: (1)Substitution for other oxoanions (such as carbonate or sulfate) duringcoprecipitation, and (2) Bonding through exchange with surface hydroxylgroups to structural metal ions during chemisorption. At least one study byMyneni (1995) suggests that mechanism (1) predominates when As ispresent during mineral formation, whereas mechanism (2) predominateswhen minerals are exposed to As-bearing solutions after their formation.
Substitution of arsenate for sulfate in jarosite (K, Na, NH4,H3O)Fe3[SO4]2(OH)6; Savage et al., 2000) and inettringite(Ca6Al2(SO4)3(OH)12 ·26 H2O; Myneni et al., 1997), has beendocumented by EXAFS spectroscopy. In ettringite, as in other salt phases,significant distortion of the bonds around the substituted As are observedbecause of the size mismatch between the anions (Table 2; Myneni,1995),and if substitution is significant, may decrease the stability of the substitutedmineral relative to the pure phase. Although equivalent spectroscopicevidence of arsenite substitution for other oxoanions in minerals is lacking,substitution of the structurally analogous selenite oxoanion has beendescribed in calcite (along with the selenate oxoanion, which is structurallyanalogous to arsenate; Cheng et al., 1997; Reeder et al., 1994).
Spectroscopic evidence for mechanism (2), arsenic adsorption onoxoanion precipitates, has been provided by Myneni (1995) and Myneni etal. (1997) in the arsenate-ettringite system. Arsenate was found to adsorb todifferent sites as a function of sorption density. At low sorption density, Asoxoanions exchange for surface hydroxyl groups bonded to Al atoms and athigher sorption densities As oxoanions exchange for surface hydroxylgroups bonded to Ca atoms, with minor bonding to Al atoms (Table 2).
In a separate study, Myneni et al. (1998) used IR data to examine thecoordination of As(V) in Mg, Co, Na, and Fe arsenate salts. The authorsdetermined that hydrogen bonding, which is substantial in these materials,had little effect on the position of bands corresponding to vibrations withinthe arsenate tetrahedron. However, the authors determined that the positionof the peak assigned to the symmetric stretch of the As-OH bond increases

42 Chapter 2
with successive protonation of the arsenate tetrahedron. Myneni et al (1998)also determined that the arsenate tetrahedron is very distorted in Mg, Co, Na,and Fe salts, as well as in aqueous solution.
Foster (1999) compared the local structure of arsenate in scorodite withthat of an x-ray amorphous synthetic ferric arsenate. The syntheticcompound had the characteristic pale-green/yellow color characteristic ofscorodite, and not the rust-brown or orange color characteristic of Feoxyhydroxides (which could have formed during the synthesis), but itsmeasured stoichiometry was not reported. XAFS analysis indicates that thex-ray amorphous compound has fewer Fe atomic neighbors than scorodite,and the number and position of Fe shells is more similar to As(V) sorbed onFe oxyhydroxides than to scorodite. However, the EXAFS spectrum ofscorodite is clearly distinguished from that of the x-ray amorphous ferricarsenate, which is itself different from As(V) adsorbed to Fe oxyhydroxide(Fig. 4).
The valence of arsenic associated with natural precipitates has beendetermined in surface sediments and mine tailings using XAFSspectroscopy. Jarosites from mining environments predominantly containAs(V) oxoanions substituting for sulfate and adsorbed to the jarosite surface(Foster et al., 1998; Savage et al., 2000). Hoernesite, a magnesium-arsenatephase abundant in a contaminated surface soil also contains only As(V)(detection limit: 5-10 %; Foster, 1999; see Table 2). As(III) species have notbeen observed adsorbed to or coprecipitated in salt phases in natural samplesto date, but they presumably undergo similar substitution or sorptionreactions on oxoanion precipitates. Their spectroscopic observation mayincrease as since sample handling, preparation, and analysis techniques haveimproved enormously in recent years.
3.2 Arsenic Speciation in Crystalline and X-rayAmorphous Metal Hydroxides.
Hydrous metal oxides are quantitatively the most important source/sinkterms for arsenic in aquifer sediments (Smedley and Kinniburgh, 2001).These very fine-grained solid phases commonly occur as coatings on otherminerals and are often x-ray amorphous. Hydrous ferric oxides (HFOs) arecommon products of sulfide mineral oxidation and incongruent dissolutionof minerals such as scorodite. Hydrous manganese oxides (HMOs) andhydrous aluminum oxides (HAOs) may be important for sequestering As,particularly where these oxides are very abundant relative to HFOs andunder chemical conditions where HFOs are unstable (Rochette et al., 1998).Arsenic can be associated with hydrous metal oxides as both adsorbed andcoprecipitated species. As was discussed in the previous section, the

2. Spectroscopic Investigations of Arsenic in Solid Phases 43
availability of coprecipitated As is probably lower than adsorbed As becausea higher fraction of the total As is not available for reaction with aqueoussolution.
3.2.1 The molecular-scale structure and chemistry of crystalline andX-ray amorphous metal oxide precipitates
HFOs, HMOs, and HAOs are composed of octahedrally coordinatedmetal atoms that share edges to form chains; these in turn are linked togetherto form 2-D and 3-D structures. For example, HFO phases consist of chainsof edge-sharing Fe(III) octahedra that are linked to opposing chains in threepredominant ways: by face-sharing (hematite and feroxyhyte), by edge-sharing (lepidocrocite), and by corner-sharing (goethite, akaganeite;Manceau and Combes, 1988; Waychunas et al., 1993). The common HAOphases gibbsite, boehmite, and diaspore contain similar linkages and havestructures similar to the HFOs because the Al(III) atom has the same chargeand a nearly identical ionic radius as the Fe(III) atom (Waychunas, 1991).The numerous HMO phases found in nature commonly form more complex
tunnel and layer structures than HFOs or HAOs (Manceau and Combes,1988). HMO phases also have the added complexity of multiple oxidationstates; several investigators have determined that synthetic HMO phasessuch as vernadite and birnessite have up to 30% Mn(II+III) (Nesbitt et al.,1998; Scott and Morgan, 1995). XAFS, IR, and XPS spectroscopictechniques are sensitive to different types of linkages and oxidation states,and can be used to identify these phases in natural and synthetic systems.
X-ray amorphous hydrous metal oxides are also extremely important astransitory reservoirs of As, but have been difficult to characterize usingtraditional methods. Waychunas et al. (1993) used XAFS spectroscopy toexamine structural differences between crystalline HFO phases and synthetic2-line ferrihydrite. Fe-O and Fe-Fe bond distances in the ferrihydriteindicated that this phase had a structure similar to goethite, being composedof double chains of corner-sharing octahedra linked primarily by othercorner-sharing octahedra. However, in ferrihydrite the average double chainlength was shorter and there were fewer cross-chain linkages than in thecrystalline HFOs (Waychunas et al., 1993). Therefore, for HFO phases, aswell as HMOs and HAOs, x-ray amorphous phases are not truly amorphous,but simply have smaller crystalline domains than their well-crystallinecounterparts.
The structure of x-ray amorphous synthetic hydrous manganese oxide(vernadite) and poorly crystalline birnessite was examined using XAFSspectroscopy by Manceau and Combes (1988) and Manceau et al. (1992a;1992b). XAFS results were in agreement with the structure of synthetic

44 Chapter 2

2. Spectroscopic Investigations of Arsenic in Solid Phases 45
birnessite as determined from Rietveld refinement (Post and Veblen, 1990)which has a layered structure built from linkages between edge-sharing Mnoctahedra, but suggested that synthetic vernadite contains a greaterproportion of corner-sharing Mn octahedra than birnessite. This conclusionwas reached based on the XAFS spectral similarites to todorokite, which hasa tunnel structure formed by corner-sharing Mn octadedra (Post and Bish,1988).
X-ray photoelectron studies of single mineral crystals indicate that ahydrous metal oxide surface cleaved in perfect vacuum contains structuraloxygen atoms, structural hydroxyl molecules (if any), and metal atoms.Upon exposure to air and water, oxygen atoms react to form molecules,and molecules can react to form adsorbed The structuralarrangement of surface metal atom coordination polyhedra and the pH, ionicstrength, and identity of counterions in the surrounding aqueous milieudetermines the reactivity of these surface hydroxyl and water groups.Macroscopic sorption studies, surface complexation modeling, and bondvalence calculations predict that the affinity of As for surface functionalgroups on metal oxide surfaces should vary with the distribution and type ofsurface functional groups available.
3.2.2 Arsenic sorption to and coprecipitation with hydrous metaloxides
Surface and bulk functional groups on hydrous metal oxide phases can beeasily distinguished using infrared spectroscopy. Considering the phases ofconcern to this report (Fe, Al, and Mn hydrous metal oxides), surface OHgroups fall into three categories: singly coordinated (“A-type”) OH groups,doubly coordinated (“B-type) OH groups, and triply coordinated (“C-type”)OH groups. Knowledge of the specific surface functional groups thatparticipate in As chemisorption is important because it can provide betterconstraints on the equations describing chemisorption of As that are used insurface complexation models.
Chemisorption or coprecipitation is inferred from IR spectroscopy eitherby the shift, splitting, or disappearance of peaks assigned to A, B, or C-typehydroxyl groups involved in bonding to As oxoanions, or from the shift,splitting, or disappearance of peaks assigned to the As oxoanion itself(Myneni et al., 1998; Sun and Doner, 1996). Chemisorption of As is usuallyinferred from an XAFS sample spectrum by the presence of one or moreneighboring surface metal atoms at a radius of 3-4 Å from the central Asatom. If some or all the neighboring atoms are As atoms, then formation ofmultimeric complexes or precipitates is usually inferred. If a precipitate is

46 Chapter 2

2. Spectroscopic Investigations of Arsenic in Solid Phases 47
suspected, then direct identification by electron diffraction or othermicrobeam analysis is the best means of verification. If there are noneighboring atoms detected, then the adsorbed complex is inferred to beouter-sphere, or physisorbed, with no direct bonds between the As oxoanionand the mineral surface (Brown, 1990).
3.2.3 Hydrous Ferric Oxides
As(III) and As(V) sorption on to synthetic goethite andferrihydrite has been investigated by XAFS spectroscopy; the quantitative fitresults of several studies are summarized in Tables 3 [As(V)] and 4 [As(III)].The presence of peaks in the Fourier transformed EXAFS spectrum beyondthe first shell of oxygen/hydroxyl atoms indicates chemisorption. Suchpeaks are evident in the FTs of both As(V) sorbed to HFOs (Fig. 5) andAs(III) sorbed to HFOs (Fig. 6). Due to differences in the oxoanionstructure [As-(O,OH) bond distances in the As(V) tetrahedron areapproximately 0.5 Å shorter than As-(O,OH) distances in the As(III) trigonalpyramid], the predominant sorption complexes formed by the two speciesdiffer in their characteristic interatomic As-Fe distance: As(V)-Fe(III) =3.25-3.30 Å (Fendorf et al., 1997; Manceau, 1995; Waychunas et al., 1993),and As(III)-Fe = 3.38 Å (Manning et al., 1998). Additional (but minor)peaks at 3.5-3.6 Å (Waychunas et al., 1993) and ~ 2.8 Å (Manceau, 1995)were also reported for As(V) sorption on HFOs. Similar minor peaks werenot reported in the XAFS study of As(III) sorption on HFOs (Manning et al.,1998). Minor differences in the sorption behavior of As(V) on crystallineHFOs and x-ray amorphous HFOs (i.e., ferrihydrite) have been observedunder conditions of low to medium sorption density, but overall thecomplexes formed by As(V) on HFOs are very similar (Table 3; Waychunaset al., 1993). The interatomic As(V)-Fe distance is also invariant as afunction of time and desorption by phosphate (O'Reilly et al., 2001;Waychunas et al., 1993 ; Table 5).
Several potential geometries of chemisorbed As(V) and As(III) complexescan be eliminated because the resultant As-Fe interatomic distances do notagree with EXAFS-derived distances (Waychunas et al., 1993). On thisbasis, the most likely coordination geometry for the predominant sorptioncomplexes is one in which each As(V) tetrahedron and As(III) trigonalpyramid forms two bonds with the apices of adjacent, edge-sharing Feoctahedra (i.e., a bidentate geometry; Fig. 7). Another possible complex isthe formation of a face-sharing arrangement between one As(V) tetrahedronand one Fe(III) octahedron (i.e., a tridentate complex; Fig. 7). Thisgeometry yields the identical interatomic distance as the bidentate complex,but there is only one Fe nearest neighbor, which does not agree with the
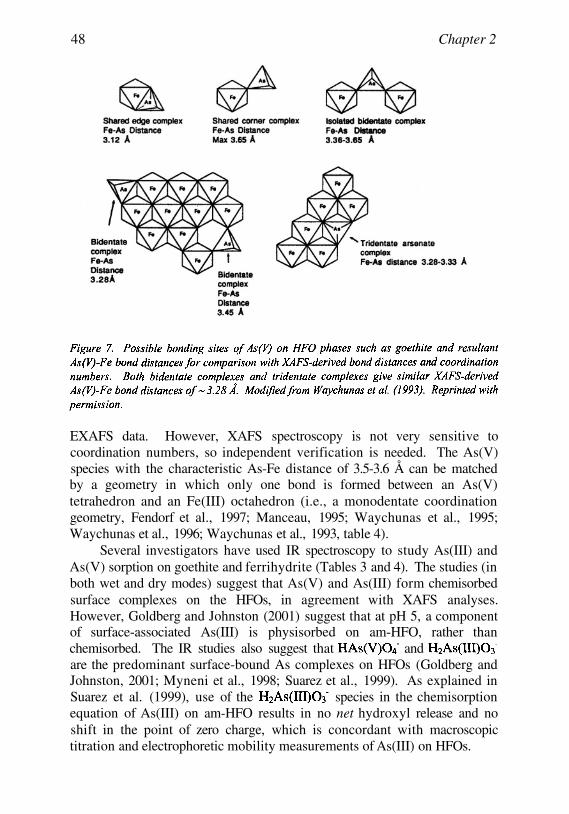
48 Chapter 2
EXAFS data. However, XAFS spectroscopy is not very sensitive tocoordination numbers, so independent verification is needed. The As(V)species with the characteristic As-Fe distance of 3.5-3.6 Å can be matchedby a geometry in which only one bond is formed between an As(V)tetrahedron and an Fe(III) octahedron (i.e., a monodentate coordinationgeometry, Fendorf et al., 1997; Manceau, 1995; Waychunas et al., 1995;Waychunas et al., 1996; Waychunas et al., 1993, table 4).
Several investigators have used IR spectroscopy to study As(III) andAs(V) sorption on goethite and ferrihydrite (Tables 3 and 4). The studies (inboth wet and dry modes) suggest that As(V) and As(III) form chemisorbedsurface complexes on the HFOs, in agreement with XAFS analyses.However, Goldberg and Johnston (2001) suggest that at pH 5, a componentof surface-associated As(III) is physisorbed on am-HFO, rather thanchemisorbed. The IR studies also suggest that andare the predominant surface-bound As complexes on HFOs (Goldberg andJohnston, 2001; Myneni et al., 1998; Suarez et al., 1999). As explained inSuarez et al. (1999), use of the species in the chemisorptionequation of As(III) on am-HFO results in no net hydroxyl release and noshift in the point of zero charge, which is concordant with macroscopictitration and electrophoretic mobility measurements of As(III) on HFOs.

2. Spectroscopic Investigations of Arsenic in Solid Phases 49
Without spectroscopic information, these macroscopic observations might betaken as indicating physisorption rather than chemisorption.
Sun and Doner (1996) used deuterated goethite to examine the affect ofAs(III/V) adsorption on surface hydroxyl (OH) groups. Deuteriumexchanges for in surface OH groups, forming OD groups on the surface.The peaks corresponding to OD vibrations are shifted relative to OH bands,

50 Chapter 2
which in goethite represent both surface and bulk OH groups. In this way thetechnique provides surface sensitive information. The authors concludedthat both As(III) and As(V) preferentially bind to A-type hydroxyl groups ongoethite at low sorption densities as noted by the decreasedintensity or disappearance of the peak corresponding to A-type OD groups(Fig. 8 a, b, c). By similar interpretation, they concluded that As(V)modifies B-type surface OD groups at mid-level sorption densities (100-200
but As(III) oxoanions react preferentially with C-type OD groups.At the highest sorption densities As(V) sorption affects C-typeOH groups, but As(III) sorption affects B-type groups (Sun and Doner,1996). These observations suggest differences in bonding sites of As(III)and As(V) oxoanions at mid to high surface coverages, but overall indicatethe predominance of A-type hydroxyl groups in As oxoanion sorption. TheA-type hydroxyl groups could participate in both the monodentate andbidentate bonding that is observed by XAFS spectroscopy. Monodentatecomplexes were observed on goethite only for As(V) and then only at lowsorption densities, where they could constitute up to 30% of the total sorbedAs(V) (Waychunas et al., 1995; Waychunas et al., 1993).
Surface complexes between As(V) or As(III) and B- and C-typehydroxyls are observed in IR studies but have not been verified by XAFSspectroscopy, probably because hydrogen bonding dominates the interactionbetween As and B- or C-type OH moieties (Sun and Doner, 1996) Fig. 8 d,e, and f). Hydrogen bonding is a long-range attractive force between atomsthat does not involve direct bonding, and therefore would be classified asphysisorption as opposed to chemisorption, which involves the formation ofa chemical bond.
3.2.4 Hydrous Aluminum Oxides (HAOs)
The As-HAO system presents special difficulties for IR and XAFSspectroscopic analysis. In an XAFS spectrum, the magnitude of peaks in theFourier transformed EXAFS spectrum is a function of several variables, twoof which are atomic number (z) and distance from the central As atom. Withonly half as many electrons as Fe, the scattering power of Al is weak,therefore peaks representing As-Al scattering in the Fourier-transformedEXAFS are smaller and more difficult to interpret. IR and Raman spectra ofAs(V) sorbed on gibbsite are difficult to interpret for an entirely differentreason: substantial overlap of peaks representing Al(V)-O/Al-OH vibrationsand As(V)-O/As(V)-OH vibrations (Myneni et al., 1998).
Notwithstanding the added ambiguity in data interpretation due to thesystem being studied, both XAFS and IR analyses indicate fairly clearly thatAs(V) forms chemisorbed species on HAO phases. XAFS spectra of As(V)

2. Spectroscopic Investigations of Arsenic in Solid Phases 51

52 Chapter 2
sorption complexes on gibbsite differ substantially from thoseof As(V) in aqueous solution, and are instead similar to a spectrum of As(V)coprecipitated with am-HAO; both observations are indirect indications ofchemisorption (Fig. 9; Foster, 1999; Ladeira et al., 2001). The predominantAs(V) sorption coordination geometry as derived from least-squares fits toXAFS spectra of As(V) sorbed to gibbsite is ~ 2 Al atoms at 3.21 Å. Boththe number and distance of Al neighbors is consistent with either achemisorbed complex or a coprecipitate with am-HAO, since thepredominant sorbed As(V) species in both cases appear to beindistinguishable by XAFS (Table 5; Foster, 1999). Note that a similarconclusion was reached by Waychunas et al. (1993) in a comparison ofAs(V) adsorbed on ferrihydrite versus As(V) coprecipitated withferrihydrite. Formation of a coprecipitate on dissolving gibbsite surfacesduring the sorption reaction cannot be ruled out.
IR studies indicate that As(V) is chemisorbed to HAO, as indicated bychanges in the vibrations assigned to the As(V)(O,OH) tetrahedron (Table5). Myneni et al. (1998) found similarities in the position of peaksand peaks in a poorly crystalline Al arsenate and in samples ofAs(V) adsorbed on gibbsite (but many peaks were obscured, as notedabove). Goldberg and Johnston (2001) concluded that As(V) chemisorbs on
am-HAO after observing that: (1) the positions of the modes ofsorbed As(V) were indifferent to pH, (2) the Raman spectra of As(V) in

2. Spectroscopic Investigations of Arsenic in Solid Phases 53
aqueous solution and As(V) adsorbed to am-HAO are significantly differentat pH 5 and 9; and (3) the splitting between IR and Raman-active bands decreases in the sorbed species indicating a decrease in symmetry(increase in tetrahedral distortion) that is consistent with chemisorption.
Most spectroscopic analyses of the As(III)-HAO system conclude thatAs(III) also chemisorbs to HAOs, but at least one report comes to a differentconclusion. XAFS analysis of As(III) sorbed to gibbsite indicates that themajority of As(III) atoms are within 3.33 Å of neighboring Al atoms. Asample prepared to be a model for As(III) coprecipitated with am-HAO isthought to have actually produced a poorly crystalline, uncharacterized Al-As(III) phase, because the number of Al neighbors is higher, and the As-Al

54 Chapter 2
bond distance longer than in sorption samples of As(III) on gibbsite (Fig. 9,Table 6). Suarez et al. (1999) concluded that was thechemisorbed species on am-HAO, based on equivalent peak positions in thesorbed and the aqueous forms of this species. In contrast, to thespectroscopic studies indicating As(III) chemisorption on HAO phases,Goldberg and Johnston (2001) found no evidence for bands insamples of As(III) sorbed to am-HAO; they concluded that the lack of signalindicated physisorption of As(III).

2. Spectroscopic Investigations of Arsenic in Solid Phases 55
The IR/Raman studies to date do not draw conclusions as to thegeometric configuration of the As(V) sorbed on HAO phases. However, byconstruction of geometric models and elimination of those inconsistent withthe XAFS-derived As-Al bond distance, Foster (1999) concluded thatadsorbed As(III) probably adopts the same type of bridging bidentatecomplexes analogous to that found on HFO phases for adsorbed As(III) andAs(V) (Figs. 7 and 10). It appears that more study is needed on this systemto determine the bonding and protonation of As(III) species sorbed to HAOs.
3.2.5 Layered Aluminosilicates
Layered aluminosilicates include the micas and clay minerals; theyshare the characteristic of having alternating layers of a gibbsite-like“aluminol” sheet and a silicon oxide (silanol) sheet, but differ in the stackingof these sheets, the presence of additional cations in various structurallocations, and the amount of structural water and hydroxyl groups. By virtueof analogy with amorphous silica and quartz, the silanol sheets are not

56 Chapter 2
predicted to react with arsenic because they possess a net negative charge.Negative charge is also accumulated on basal (001) planes of the aluminolsheet by cation substitution, therefore these faces are also assumed to have alow density of surface sites with an affinity for the negatively charged Asoxoanions. In contrast to the basal planes, the edges of layeredaluminosilicates contain amphoteric aluminum octahedra that are expected tobe the primary sites for arsenate and arsenite oxoanion bonding on thealuminosilicate minerals.

2. Spectroscopic Investigations of Arsenic in Solid Phases 57
Spectroscopic studies of As sorbed on aluminosilicates suffer from all thecomplications described for the As-HAO system in the previous section.There is, however, an additional difficulty: elements differing by < 2 inatomic number cannot be distinguished by XAFS spectroscopy (Sayers andBunker, 1988), and therefore neighboring Al atoms cannot be distinguished
58 Chapter 2
from Si. However, Al and Si bond lengths are considerably different(geometric models indicate that As-Al and As-Si distances should differ bymore than 0.2 Å), and therefore should be discriminated by EXAFSspectroscopy (Fig. 10).
Several studies show that As sorbed to aluminosilicate clay minerals ismore readily extracted than As sorbed to HAOs or HFOs (Christensen et al.,1989; Hamdy and Gissel-Nielsen, 1977), so As associated with these phasesis assumed to be fairly labile. XAFS spectroscopy of As(V) and As(III)adsorbed to model aluminosilicate clays (kaolinite and smectite) in thelaboratory confirms these macroscopic studies, indicating that nearly allAs(III) and As(V) sorbed to smectite clay is physisorbed, but that at least aportion of As(III) and As(V) sorbed on kaolinite is chemisorbed. Evidencefor physisorption on smectite comes from the lack of second-shell neighborsin smectite sorption spectra and from similarity between smectite sorptionspectra and the corresponding spectra of aqueous As(III) and As(V) (Fig. 9).Evidence for chemisorption of As(V) and As(III) on kaolinite is indicated bya shell of 1-2 Al neighbors at a distance of 3.16-3.20 Å for As(V) and 3.22 Åfor As(III) (Foster, 1999). This distance is too short for monodentatelinkages to aluminum polyhedra (Fig. 10), and suggests that bidentatecomplexes similar to those reported for As(V) adsorption on HFOs andHAOs from on kaolinite, presumably at Al edge sites. Of course, thenumber of such complexes formed would be far lower on clay minerals,which typically have a bulk surface area than the number formedon gibbsite or amorphous Al oxyhydroxide, which typically have bulksurface areas
HMO phases undergo both sorption and electron transfer reactions withAs species (Chiu and Hering, 2000; Oscarson et al., 1981b; Scott andMorgan, 1995; Sun et al., 1999; Thanabalasingam and Pickering, 1986).Heterogeneous oxidation of As(III) by HMO phases is coupled to thereductive dissolution of the HMO: the released Mn(II) can be readsorbed andre-oxidized heterogeneously via abiotic and biotically-mediated processes(Emerson et al., 1982; Junta and Hochella, 1994; Murray, 1975; Stone andUlrich, 1989). On the basis ofmacroscopic data, Scott and Morgan (Scott and Morgan, 1995) hypothesizedthat As(III) forms a chemisorbed surface complex with two Mn(IV) atoms.Unfortunately, As(III) oxidation by HMOs is too rapid under ambientconditions to allow XAFS spectroscopic determination of sorbed As(III)species on this material (Manning et al., 2002).
3.2.6 Hydrous Mn oxides (HMOs)

2. Spectroscopic Investigations of Arsenic in Solid Phases 59
Nesbitt et al. (1998) used XPS data collected on the As(III)/birnessitesystem to formulate a two-step mechanism for the process whereby As(III)donates one electron to each of two surface Mn(IV) octahedra. TheseMn(FV) octahedra are reduced, forming Mn(III), which is subsequentlyattacked by more As(III), and reduced to Mn(II). Below pH 6, Mn(II) is notappreciably sorbed by Mn(IV) hydroxides, and therefore is preferentiallypartitioned into solution. The rate of Mn(IV) reduction to Mn(III) is fasterthan the transformation of Mn(III) to Mn(II); as a result, the authorssuggested that a short-lived Mn(III)-rich hydroxide phase forms on the HMOsurface during the reaction (Fig. 11).
Despite observations that As(V) does not adsorb to HMOs in thepresence of As(III) (Scott and Morgan, 1995), XAFS spectroscopy indicatesthat in As(III)-free systems As(V) forms chemisorbed complexes onsynthetic vernadite and birnessite (type formula:
McKenzie, 1989).The complexes are bidentate andbinuclear with a characteristic As-Mn distance of ~ 3.16 Å (Foster et al.,submitted; Fig. 12, Table 7). Geometric arguments suggest that the structureof this complex is the same as was previously described for As(V) on HFOsand HAOs. As previously mentioned, synthetic birnessite and vernaditesamples typically contain up to 30% Mn(III) and/or Mn(II) due toincomplete oxidation of Mn(II) during synthesis, and this lower-valent Mncould provide binding sites for As(V). A survey of As-Mn(II) interatomicdistances in crystalline precipitates indicates that typical distances areapproximately 0.3 Å longer than the As(V)-Mn interatomic distance deducedfrom EXAFS analysis (Foster et al., submitted; Table 7). However As(V)-Mn(III) distances vary widely, and linkages to Mn(III) octahedra cannot beruled out. However, precipitate formation with Mn(II) arising fromdissolution of HMO phases is unlikely, based on comparison to the XAFSspectrum of a poorly crystalline Mn-arsenate (Fig. 12, Table 7).
4. CONCLUSION: IMPLICATIONS FOR AQUIFERSEDIMENTS
There have been very few spectroscopic studies of As species in aquifersediments, because they are complex heterogeneous materials that probablycontain many different As species, and because the typical bulkconcentrations of As are low. XAFS spectroscopy is one of the bestmethods for analysis of As species in natural samples even though the bulkspectrum is the weighted sum of all the species present in the sample.

60 Chapter 2

2. Spectroscopic Investigations of Arsenic in Solid Phases 61
However, collection of good-quality EXAFS spectra under standardconditions at synchrotron facilities is currently limited to samples containingmore than ~100 ppm As. XANES spectra can be collected even for samplescontaining very low arsenic, as was recently shown for aquifer sedimentsamples from east-central Bangladesh (Foster et al., 2000). In that study,As-XANES spectra were collected from samples containing as little as 4ppm As. Oxidation states were easily quantified, and correlated very wellwith the sediment redox conditions [as indicated by color; (Foster et al.,2000). Qualitative chemical speciation was determined by a “fingerprinting”method using a linear least-squares routine to fit the sample spectrum tomodel spectra such as those shown in Fig. 13. Preliminary XANESevaluation of the As species present suggests that As(V) sorbed to HFOs,As(III) sorbed to HFOs, and As(III) sorbed to HAOs (probably precipitatedon the edges of mica minerals) are the predominant species present.
Although Foster et al. (2000) conservatively fit only 1 or 2 differentmodel As spectra to each sample spectrum, least-squares fitting does notimpose limitations on the number of models used in the fit, nor is their anyparameter besides the fit residual to guide selection of the models used in thefits. Well-constrained fits can be obtained using principal componentanalysis (PCA) to guide selection of the type and number of componentsused in linear least-squares fits (Ressler et al., 2000). However, use of PCA

62 Chapter 2
does not remove all ambiguity from fits to As-XANES spectra; althoughmany As-XANES spectra of As(III) and As(V) models are clearlydistinguished on the basis of lineshape (Fig. 13), othermodel spectra inwhich the near (~ 4Å) -coordination environment of As is very similar arepractically indistinguishable, as illustrated in Fig. 14. Note that in contrast tothe XANES spectra, EXAFS spectra of As(V) in scorodite, in x-rayamorphous ferric arsenate, and sorbed to HFO are easily distinguished (Fig.4). Ab initio calculations of As-XANES spectra in model systems areneeded to explain these observations.
Based on spectroscopic and macroscopic studies to date, the chemistry ofAs in aquifer sediments is probably dominated by species partitioned inprimary or authigenic sulfides and species partitioned in oxyhydroxidesand/or other products of sulfide oxidation. In sulfides, reduced As speciescan be found from trace to atom percent levels; however, due to a lack ofthermodynamic equilibrium, dissolved As oxoanions may be in contact withand partitioned onto sulfide minerals (Bostick and Fendorf, 1999; Smedleyand Kinniburgh, 2001). Oxidative attack on arsenic-bearing sulfideminerals, usually through localized aquifer drawdown or by gases travelingalong fractures, is currently accepted as the primary means of release of Asfrom sulfides, but sulfide oxidation may occur under anoxic conditions to agreater extent than was previously supposed, through the action of electron

2. Spectroscopic Investigations of Arsenic in Solid Phases 63
such as dissolved nitrate and even solids (Shippers and Jorgensen,2001).
As-bearing precipitates commonly form in close association with sulfideminerals, probably because the free energy of formation of these phases isexceeded locally near the site of sulfide dissolution. For example, scoroditeand As-bearing jarosite were produced during the oxidation of arsenicalpyrite by mixed cultures of moderately thermophilic bacteria (Carlson et al.,1992). If As is present during the formation of these phases, it usuallysubstitutes for a structural oxoanion such as sulfate, carbonate, or phosphate.However, based on results previously described for the As(V)-ettringitesystem, if As interacts with carbonate, sulfate, or phosphate minerals aftertheir formation, adsorption complexes are probably formed with surfacemetal atoms instead of oxoanion substitution. The availability of arsenicfrom secondary phases is usually dependent on solubility; solubility, in turn,usually increases with increasing anoxic and extreme pH conditions, or withdecreasing crystallinity (Rochette et al., 1998).
Sorption of arsenic to hydrous metal oxide phases (usually found ascoatings on other mineral phases, or as clay-to-colloidal-sized particles) is an

64 Chapter 2
extremely important process in nature both for scavenging As and forreleasing As to the environment. Hydrous ferric oxides probably dominateAs oxoanion sorption in most aquifer sediments (Welch, 1999), but hydrousmanganese oxides (HMOs) and hydrous aluminum oxides (HAOs) can alsoaccumulate significant amounts of As species. One example is in the aquifersediments of La Pampa Province, Argentina. There it is estimated that half

2. Spectroscopic Investigations of Arsenic in Solid Phases 65
of the 10-50% of As associated with metal oxyhydroxides is partitioned ontoHMO (and possibly HAO) phases (Smedley and Kinniburgh, 2001).
Heterogeneous electron transfer reactions can also influence thepartitioning of As in aquifer sediments. As(III) is rapidly oxidized to As(V)in the presence of HMO phases. HMOs and HFOs are also susceptible toreductive dissolution by microorganisms, therefore the fate of Asassociatedwith HFOs and HMOs depends on the prevailing geochemicalconditions. HAO phases are not susceptible to redox attack, but microbesspecializing in respiration of As(V) to As(III) can produce the selectiverelease of As from these phases (Zobrist et al., 1998). Aluminosilicate clayand mica minerals rarely contain arsenic in greater than trace amounts, anddo not sorb arsenic in great quantities. However, they may be significantagents of As sorption due to secondary coatings of metal hydroxides on theirsurfaces. These coatings can be important sites of arsenic accumulation.
Although the chemistry of hydrous metal oxides varies dramatically,geometric arguments based on XAFS spectroscopic evidence indicate thatchemisorbed As(V) and As(III) oxoanions primarily form bidentatecomplexes regardless of the identity of the hydrous oxide. Singly-coordinated surface hydroxyl groups are probably the primary sites forAs(V) and As(III) chemisorption. IR and Raman spectroscopies corroboratethis evidence, and further provide detailed information about the protonationof sorbed As complexes that can be used to provide constraints on thechemical reactions used in surface complexation models. Additionalspectroscopic studies on natural aquifer sediments are needed to further testprevailing hypotheses about As chemistry in solid phases from thesubsurface, because these ideas were primarily generated from observationsof As chemistry in solid phases from near-surface environments.
ACKNOWLEDGEMENTS
The majority of the XAFS experiments cited herein (and all of the XAFSwork by Foster and colleagues) were conducted at the Stanford SynchrotronRadiation Laboratory, a national user facility operated by StanfordUniversity on behalf of the U.S. Department of Energy, Office of BasicEnergy Sciences. Work by AF cited in this chapter was supported by theDepartment of Energy through grant DE-FG03-93ER14347-A008, by theNational Science Foundation through NSF Grant CHE-0089215, by theCorning Foundation Graduate Science Fellowship program, by the U.S.Geological Survey Mineral Resources Program, and by the U. S. StateDepartment.

This page intentionally left blank

Chapter 3
Geochemical Processes Controlling Transport ofArsenic in Groundwater: A Review of Adsorption
Kenneth G. StollenwerkUS Geological Survey, Denver, CO USA
Adsorption is the predominate mechanism controlling transport of arsenic inmany groundwater systems. Hydrous oxides of iron, aluminum, andmanganese, and clay minerals are commonly associated with aquifer solidsand have been shown to be significant adsorbents of arsenic. The extent ofarsenic adsorption is influenced by the chemistry of the aqueous phaseincluding pH, arsenic speciation, and the presence and concentration ofcompeting ions. Under moderately reducing conditions, trivalent arsenite isstable and adsorption increases with increasing pH. In an oxidizingenvironment, arsenate is stable and adsorption decreases with increasing pH.The presence of phosphate, sulfate, carbonate, silica, and other anions havebeen shown to decrease adsorption of arsenic to varying degrees. The effectsof complex aqueous and solid phase chemistry on arsenic adsorption are bestsimulated using surface complexation models. Coupling of such models withhydrologic solute transport codes provide a powerful method for predicting thespatial and temporal distribution of arsenic in groundwater.
1. INTRODUCTION
Long-term exposure to arsenic (As) in drinking water has beenimplicated in a variety of health concerns including several types of cancer,cardiovascular disease, diabetes, and neurological effects (National ResearchCouncil, 1999). To protect people against the effects of long-term chronicexposure to As, the United States Environmental Protection Agency hasproposed lowering the maximum contaminant level (MCL) for As indrinking water from 50 micrograms per liter to (U.S.Environmental Protection Agency, 2001). The World Health Organizationhas set a provisional guideline concentration for drinking water of(WHO, 1993).

68 Chapter 3
Potable water supplies are compromised by As contamination ofgroundwater in many countries of the world, including Bangladesh, westernIndia, Taiwan, Mongolia, Vietnam, Argentina, Chile, Mexico, Ghana, andthe United States. In all of these locations, the source of As is primarilynatural and not anthropogenic or geothermal (Ayotte et al., 1998; Azcue andNriagu, 1994; Chen et al., 1994; Das et al., 1996; Focazio et al., 2000;Kolker et al., 1998; Korte, 1991; Matisoff et al., 1982; Nickson et al., 2000;Nimick, 1998; Panno et al., 1994; Robertson, 1989; Schlottmann and Breit,1992; Schreiber et al., 2000; Smedley et al., 2002; Sonderegger andOhguchi, 1988; Welch et al., 1988).
Higher concentrations of As tend to be found more in groundwater thanin surface water sources of drinking water; therefore, the emphasis of thispaper is on the geochemical processes that affect As transport ingroundwater. However, many of the processes discussed are also applicableto surface waters and the variably saturated zone above the groundwatertable.
The geochemistry of As can be complex. Important processes that controlthe partitioning of As between aqueous and solid phases include mineralprecipitation/dissolution, adsorption/desorption, oxidation/reduction, andbiological transformation. Adsorption/desorption is the most significantprocess controlling As concentrations in many groundwater environments,and is the focus of this review. Adsorption processes are controlled by pH,redox potential, As concentration, the concentration of competing andcomplexing ions, aquifer mineralogy, and reaction kinetics. Becausespeciation of As is important in adsorption, a discussion of the aqueouschemistry of As precedes the review of adsorption. This review is alsolimited to geochemical environments that are oxidizing to slightly reducing.
2. AQUEOUS CHEMISTRY OF ARSENIC
2.1 Speciation
Dissolved As speciation is important in determining the extent of reactionwith the solid phase and therefore the mobility of As in groundwater.Arsenic is generally present as arsenate [As(V)] or arsenite [As(III)] for Ehconditions prevalent in most groundwaters (Fig. 1). Arsenic metal rarelyoccurs, and the -3 oxidation state is found only in very reducingenvironments. Arsenite has been considered to be the more toxic oxidationstate (U.S. Environmental Protection Agency, 1976) however, more recentstudies have shown that most ingested As(V) can be reduced to As(III).

3. Geochemical Processes Controlling Transport of Arsenic inGroundwater: A Review of Adsorption
69
Thus, exposure to both forms of As may result in similar toxicologicaleffects (National Research Council, 1999).
Both As(III) and As(V) form protonated oxyanions in aqueous solutions,the degree of protonation dependent on pH. Arsenate is stable in oxidizingenvironments. For pH values common in groundwater, the predominateAs(V) species in solution are between pH 2.2 and 6.9, andbetween pH 6.9 and 11.5. Arsenite is stable in moderately reducingenvironments; predominates up to pH 9.2, and from pH9.2-12 (Ferguson and Gavis, 1972). If conditions are favorable,biomethylation can form a variety of methylated species of As(III) andAs(V) that are stable under oxidizing or reducing conditions. The morecommon methylated species include methylarsonic aciddimethylarsinic acid methylarsonous acid
and dimethylarsinous acid (Braman andForeback, 1973; Cullen and Reimer, 1989; National Research Council,1999).

70 Chapter 3
2.2 Redox transformation
Natural geochemical and biological processes play critical roles incontrolling the fate and transformation of As in the subsurface. Arsenite isthermodynamically unstable in aerobic environments and should oxidize toAs(V); however, studies have shown that this reaction proceeds slowly whenoxygen is the only oxidant. Cherry et al. (1979) measured a slow rate ofAs(III) oxidation in water saturated with pure at pH 7. After 6 monthsabout 25% of the As(III) had been oxidized compared with no oxidation indeoxygenated water. Eary and Schramke (1990) measured a half-life of 1 to3 years for oxidation of As(III) in water equilibrated with atmosphericoxygen. The rate of oxidation in these experiments was a minimum at pH 5.5and increased for both lower and higher pH values. Manning and Goldberg(1997a) reported a significant increase in the rate of oxidation of As(III) toAs(V) in alkaline solutions (pH > 9) under atmospheric conditions.
The presence of other redox sensitive species increases the rate of As(III)oxidation. Addition of ferric iron [Fe(III)] to oxygenated water increased therate of As(III) oxidation below pH 7 (Cherry et al., 1979) in agreement withthermodynamic predictions (Scott and Morgan, 1995). Oxidation of As(III)by Fe oxyhydroxide and goethite has been observed by some investigators(Haury et al., 2000; Sun and Doner, 1998) but not by others (Oscarson et al.,1981a). The reaction appears to be catalyzed by light. DeVitre et al, (1991)measured only 17% recovery of As(III) that had been added to Fe hydroxidefor 10 days in the presence of light, but 91% recovery in the absence of light.
Manganese (Mn) oxides are commonly associated with aquifer solids andhave been shown to be important oxidants of As(III). Oxidation of As(III) byMn oxides is thermodynamically favorable over a wide range of pH (Scottand Morgan, 1995), and several studies have provided direct and indirectevidence for this reaction. Oxidation of As(III) by synthetic birnessite
and manganite has been measured in laboratoryexperiments (Chiu and Hering, 2000; Moore et al., 1990; Oscarson et al.,1981a). The reaction is rapid with 80% of the As(III) oxidized to As(V)within an hour at pH values between 4-8 (Scott and Morgan, 1995; Sun andDoner, 1998). Chiu and Hering (2000) measured three times more As(III)oxidation by manganite at pH 4.0 than at pH 6.3, possibly a result of greaterAs(III) adsorption at the lower pH. The hypothesized reaction sequence isadsorption of As(III), followed by reduction of Mn(IV) or Mn(III) to Mn(II)and release of As(V) to solution (Scott and Morgan, 1995). Incorporation ofAs(V) into the Mn oxide structure has also been reported (Moore et al.,1990). The degree of Mn oxide crystallinity has a significant effect on therate of As(III) oxidation. Highly ordered, low surface area pyrolusite

3. Geochemical Processes Controlling Transport of Arsenic inGroundwater: A Review of Adsorption
71
oxidized As(III) at a much slower rate than poorly crystalline, highsurface area birnessite and cryptomelane (Oscarson et al., 1983).
Oxidation of As(III) to As(V) by lake sediments has been attributed tothe presence of Mn oxides (Oscarson et al., 1980). In these experiments,elimination of dissolved oxygen and suppression of microbial activity had noeffect on the rate of oxidation. However, treating the sediments withhydroxylamine hydrochloride or sodium acetate to remove Mn oxidessignificantly decreased oxidation of As(III) (Oscarson et al., 1981b).
Oxidation of As(III) has also been observed in groundwater. Arsenitewas injected into oxic (micromoles per liter) and suboxic
zones of groundwater at a site on Cape Cod, Massachusetts,USA. Significant oxidation of As(III) to As(V) along a 2.2 meter flow pathwas observed in both the oxic and suboxic zones (Kent et al., 2001).Manganese oxides are present in the mixutre of oxides that coat these aquifersolids (Fuller et al., 1996) and are the most likely electron acceptor in boththe low suboxic zone and possibly the oxic zone.
Clay minerals have also been reported to be capable of oxidizing As(III).Lin and Puls (2000) observed that, under a nitrogen atmosphere, oxidation ofadsorbed As(III) by halloysite, kaolinite, illite, illite/montmorillonite, andchlorite increased with reaction time; oxidation was 100% after 75 days. Thecause of oxidation was postulated to be the presence of Fe oxides or traceamounts of impurities such as iodide in the clay minerals. Manning andGoldberg (1997a) postulated that minor amounts of Mn oxides caused theobserved oxidation of As(III) by kaolinite and illite in their experiments.Work by Foster et al. (1998) has shown that titanium can mediate thetransfer of electrons from As(III) to They found that oxidation of As(III)by a Georgia kaolinite (KGa-1b), containing 1.76 weight percent wasdependent on concentration. These results were identical to separateexperiments using pure Manganese oxide impurities were ruled out inthese experiments because of the low Mn concentration in this kaolinite andthe observation that oxidation of As(III) by was independent ofconcentration.
Oxidation of As(III) to As(V) by microorganisms using oxygen as theterminal electron acceptor has been reported in laboratory cultures (Osborneand Ehrlich, 1976; Phillips and Taylor, 1976). This process has also beenobserved in natural settings. Wilkie and Hering (1996) found that As(III)from geothermal sources entering a stream was rapidly oxidized to As(V) bybacterial colonies associated with macrophytes.
While As(III) can be metastable to varying degrees in aerobicenvironments, As(V) tends to be more rapidly reduced under anaerobicconditions. There have been numerous studies in recent years that have

72 Chapter 3
identified several different strains of bacteria capable of As(V) reduction.Reaction products include dimethylarsine (McBride and Wolfe, 1971) andinorganic As(III) (Freeman, 1985; Laverman et al., 1995; Newman et al.,1997; Zobrist et al., 2000). Some microbes apparently reduce As(V) that hasentered the cell to As(III), which is then excreted as a detoxificationmechanism (Ji and Silver, 1995; Rosen et al., 1995). Other microbes canutilize As(V) as an energy source if a more preferable electron acceptor suchas oxygen is not available (Macy et al., 1996; Newman et al., 1997)(Newman et al., 1998; Stolz and Oremland, 1999).
Arsenate reduction under abiotic conditions also has been measured.Both and are capable of reducing As(V) to As(III) (Cherry et al.,1979). Arsenate reduction by is rapid, and the rate increases withdecreasing pH (Rochette et al., 2000). Intermediate by-products includearsenic sulfide species which dissociate to withinseveral days. Reduction of As(V) by aqueous Fe(II) was not observed inlaboratory experiments (Zobrist et al., 2000); however, reduction of As(V) toAs(III) was observed in the natural gradient tracer experiment of (Kent et al.,2001). In this experiment, As(V) was injected into an anoxic groundwaterzone containing high concentrations of dissolved Fe(II). Arsenate may havebeen reduced directly by Fe(II), with the aid of microorganisms, or As(V)may have been reduced by low concentrations of organic carbon in this zone.Abiotic As(V) reduction by humic substances also has been reported (Hauryet al., 2000).
3. ADSORPTION/DESORPTION
Arsenic concentrations observed in most groundwaters are orders ofmagnitude less than the solubilities of most As-bearing minerals.Thermodynamic predictions show that some As minerals could potentiallycontrol As concentrations in groundwater under common geochemicalconditions; however, these minerals are rarely if ever documented outside ofmineralized area (Foster, this volume). Therefore, adsorption reactionsbetween As and mineral surfaces are generally the most important control onthe dissolved concentration of As in groundwater environments where watersupply is an issue. Adsorption of As is a complex function of theinterrelationship between the properties of the solid surface, pH, theconcentration of As and competing ions, and As speciation.

3. Geochemical Processes Controlling Transport of Arsenic inGroundwater: A Review of Adsorption
73
3.1 Mechanism
Oxides of iron, aluminum (Al), and manganese are potentially the mostimportant source/sink for As in aquifer sediments because of their chemistry,widespread occurrence, and tendency to coat other particles. Upon exposureto water, metal ions on the oxide surface complete their coordination shellswith OH groups (Hingston et al., 1972; Fig.2). Depending on pH, these OHgroups can bind or release resulting in the development of a surfacecharge. The adsorption properties of oxides are due to the presence of these
and surface functional groups (Sposito, 1984).There are two widely accepted mechanisms for adsorption of solutes by a
solid surface. Outer-sphere surface complexation, or non-specific adsorption,involves the electrostatic attraction between a charged surface and anoppositely charged ion in solution (Fig. 3). The adsorbed ion resides at acertain distance from the mineral surface. Inner-sphere complexation, alsotermed specific adsorption, involves the formation of a coordinative complexwith the mineral surface (Hingston et al., 1972; Fig. 3). Inner-spherecomplex bonds are more difficult to break than outer-sphere complex bondsand result in stronger adsorption of ions.
Arsenic adsorbs by ligand exchange with OH and surfacefunctional groups, forming an inner- sphere complex. This type ofadsorption requires an incompletely dissociated acid (i.e., to pro-vide a proton for complexation with the surface OH group, forming andproviding a space for the anion (Hingston et al., 1972). These reactions canbe written several ways. For example:

74 Chapter 3
where, =SurfOH represents the structural metal atom and associated OHsurface functional group, and, (for example) is the surface-arsenic complex, (Dzombak and Morel, 1990). The energy required todissociate the weak acid at the oxide surface varies with pH. As a result, theamount adsorbed varies with pH. For example, the dissociation constant for
is at 9.2 (Cherry et al., 1979). Therefore, at a pH of 9.2 the free energyrequired to dissociate is a minimum and adsorption should be amaximum.
Chemical evidence of inner-sphere complex formation between As andoxide surfaces comes from experiments designed to evaluate the effects ofionic strength (I) and pH on As adsorption. Changes in I affect theelectrostatic forces near the mineral surface (Davis and Kent, 1990). Anionsthat form inner- sphere complexes coordinate directly with the oxide surfacein a manner that is relatively independent of I. In contrast, the formation ofouter-sphere complexes by weakly adsorbed anions such as sulfate and sel-enate is sensitive to I. Experimental data from Hsia et al. (1994) and Grossland Sparks (1995) show essentially no change in the concentration of As(V)adsorbed by ferrihydrite and goethite for I that ranged from 0.005 to 0.1 M,consistent with an inner-sphere surface complex. Other investigators havedemonstrated that adsorption of As(III) by amorphous kaolinite,and illite was independent of I (Manning and Goldberg, 1997a). Adsorptionof methylated As(V) species by ferrihydrite and Al oxide were also rela-tively insensitive to changes in I, indicating formation of inner-spheresurface complexes (Cox and Ghosh, 1994).
Inner-sphere surface complexation of As has also been inferred fromchanges in the isoelectric point (IEP) of the adsorbing solid. The IEP of asolid is the solution pH at which the net charge on a particle is zero (Sposito,1984). At pH values below the IEP, net surface charge is positive due toadsorption of excess At pH values greater than the IEP, net surfacecharge is negative due to desorption of Formation of inner-spheresurface complexes of anions has been shown to increase the negative chargeof solid surfaces, thereby decreasing the IEP to lower pH values. Theamount of shift in the IEP depends on the ion and its concentration, as wellas the particular solid surface. Adsorption of both As(III) and As(V) specieshave been found to lower the IEP of various oxides including goethite,ferrihydrite, gibbsite, and amorphous (Anderson and Malotky,1979; Ghosh and Teoh, 1985; Hingston et al., 1972; Jain et al., 1999;

3. Geochemical Processes Controlling Transport of Arsenic inGroundwater: A Review of Adsorption
75
Manning and Goldberg, 1996b). The magnitude of the decrease depends onAs concentration. For example, Hsia et al. (1994) measured a decrease in theIEP for ferrihydrite from pH 8 to pH 4 as As(V) concentration increasedfrom 0 to

76 Chapter 3
Using Extended X-ray Absorption Fine Structure (EXAFS) spectroscopy,Waychunas et al. (1993) determined the geometry of As(V) adsorbed onferrihydrite and goethite and confirmed the formation of a binuclear, and to alesser extent, monodentate inner-sphere surface complex. Manning et al.(1998) used EXAFS to show that As(III) also forms inner-sphere surfacecomplexes on goethite. (Note, a thorough review of the molecular-scalestructure and chemistry of As adsorbed by crystalline and x-ray amorphousmetal oxides is presented by Foster (this volume).

3. Geochemical Processes Controlling Transport of Arsenic inGroundwater: A Review of Adsorption
77
3.2 Solid Phase Adsorption Properties
Aquifer solids are rarely composed of discrete mineral phases such asquartz, feldspar, or clay minerals. Over time, weathering reactions producecomplex mixtures of different minerals of varying degrees of crystallinity.Since adsorption implies a surface or near surface phenomena, it is themineral surfaces of aquifer solids that are of principal concern. Thesesurfaces can consist of mixtures and coatings of various oxides, alumino-silicate minerals, carbonates, and organic matter (Coston et al., 1995; Farmeret al., 1991; Jenne, 1976; Taylor, 1987).
Many studies that have investigated the effects of different geochemicalproperties on adsorption of As species have used controlled laboratoryexperiments to evaluate adsorption of As by pure mineral phases such as Fe,A1, and Mn oxides, and clay minerals. Since these mineral phases are oftencomponents of aquifer solids, the data from such experiments can be used tohelp interpret the behavior of As in groundwater. Such an approach hascommonly been used to assess As adsorption by soils and lacustrine sedi-ments (Belzile and Tessier, 1990; Bowell, 1994; Fordham and Norrish,1979; Jacobs et al., 1970).
3.3 Iron oxides
Iron oxides of varying crystallinity and composition are one of the mostcommon phases associated with aquifer solids. They can be present asdiscrete particles or as coatings on other mineral surfaces. Many laboratoryinvestigations of As adsorption have used unaged hydrous Fe(III) oxideformed by rapid precipitation of Fe(III) from solution, or oxidation of Fe(II)followed by precipitation at the oxic/anoxic boundary. This phase has astoichiometry near and has been termed ferrihydrite (Eggletonand Fitzpatrick, 1988). Ferrihydrite is very poorly crystalline and has a largesurface area which results in significant adsorption capacity (Dzombak andMorel, 1990). The adsorption behavior of ferrihydrite is considered to beanalogous to that of recently formed, poorly crystalline Fe oxyhydroxidesthat are often associated with aquifer solids.
One of the most important controls on adsorption of As(III) and As(V) ispH; pH has a major influence on aqueous As speciation and on thecomposition of surface functional groups through protonation anddeprotonation reactions. At pH values less than the IEP of a solid, the netcharge is positive, facilitating adsorption of anions. At pH values greaterthan the IEP of a solid, the net charge is negative, facilitating adsorption of

78 Chapter 3
cations. However, adsorption of anions can occur when net surface charge isnegative, and cations can adsorb when net surface charge is positive.
The effect of pH on As adsorption differs between As(III) and As(V).Data for the adsorption of As(III) and As(V) by ferrihydrite that are plottedin Fig. 4 demonstrate characteristics of As adsorption commonly observed inlaboratory batch experiments (Bowell, 1994; Hsia et al., 1992; Jain andLoeppert, 2000; Manning et al., 1998; Meng et al., 2000; Pierce and Moore,1982; Wilkie and Hering, 1996). The initial As concentrations used in theseexperiments were 1.33 and and are within the range found innatural settings of As contaminated groundwater. Arsenate adsorption wasgreatest at low pH values and decreased with increasing pH. Greateradsorption of As(V) at low pH is attributable to more favorable adsorptionenergies between the more positively charged surface and negativelycharged the predominate As(V) species between pH 2.2 and 6.9.As pH increased above 6.9, became the predominate aqueousspecies, surface charge became less positive, and adsorption was lessfavorable. However, even at pH 10 there were some surface functionalgroups capable of exchanging for As(V), as shown in Fig. 4, and in studiesby Hsia et al. (1994) and Jain and Loeppert (2000).
Quantitative adsorption of As(V) as a function of pH is also influencedby the concentration of adsorption sites relative to the aqueous concentrationof As (Fig. 4). At the lower initial concentration of As(V), therewas an excess of adsorption sites and As(V) adsorption was independent ofpH up to a pH of 6. When the concentration of As(V) was increased to 13.3
available sites become filled at a lower pH and As(V) adsorption beganto decrease immediately with any further increase in pH.
The pH dependent adsorption of As(III) differs from As(V). The data inFig. 4 show that at lower pH values, more As(V) was adsorbed than As(III).However, as pH increased above about 6.5, adsorption of As(III) becamegreater than As(V). The predominate As(III) species in solution at pH valuesless than 9.2 is the neutral At higher pH values, neutral ismore readily able to donate a proton to the surface OH group than thenegatively charged As(V) species. The pH where adsorption of As(III)becomes greater than As(V) is affected by the surface charge of the solid andgenerally decreases as the IEP of the sorbent decreases.
The pH dependent adsorption of As(III) and As(V) have been comparedunder transport conditions. Joshi and Chaudhuri (1996) eluted either As(III)or As(V) through columns packed with Fe oxide-coated sand at pH 7.6.Breakthrough curves exhibited slightly greater retardation of As(III) thanAs(V). In a column experiment with Fe oxide-coated sand at pH 5.7, Gulenset al. (1979) observed that As(III) moved 5- 6 times faster than As(V).

3. Geochemical Processes Controlling Transport of Arsenic inGroundwater: A Review of Adsorption
79
The data in Fig. 4 represent separate adsorption experiments with eitherAs(III) or As(V). When As(V) and As(III) were present in solution together(2.08 mM each), Jain and Loeppert (2000) found that As(III) had little effecton adsorption of As(V) below pH 6, but caused a decrease in As(V)adsorption of as much as 25% at pH greater than 6 due to strong adsorptionof As(III). Arsenate resulted in a decrease in adsorption of As(III) of 15-25%between pH 4 and 6; however, by pH 9, As(V) decreased adsorption ofAs(III) by less than 5%.
Adsorption of the methylated As(V) species, andby ferrihydrite followed a pattern similar to As(V).
Maximum adsorption of both species occurred at lower pH values, and theamount adsorbed sharply decreased for pH values greater than 7 (Cox andGhosh, 1994). For any given pH, the negatively chargedadsorbed to a greater extent than the neutral
As ferrihydrite ages, crystallite growth occurs resulting in a decrease insurface area and the number of surface complexation sites. Fuller et al.(1996) measured a 20% decrease in adsorption of As(V) by ferrihydrite that

80 Chapter 3
had been aged for six days compared to ferrihydrite that had aged for only afew hours. Given sufficient time and appropriate conditions, ferrihydriteusually recrystallizes into goethite.
Goethite is a common Fe oxide component of aquifer solids and has alsobeen synthesized in the laboratory for use in As adsorption experiments. ThepH dependent characteristics for adsorption of As(V) and As(III) by goethiteare similar to ferrihydrite (Grossl and Sparks, 1995; Hingston et al., 1971)(Manning et al., 1998; Matis et al., 1999; Sun and Doner, 1998). However,there is generally less adsorption of As by goethite than ferrihydrite on a pergram basis because the greater degree of crystallinity of goethite, results inlower concentrations of surface-complexation sites. For example, at an initialAs concentration of and a pH of 6, Sun and Doner (1998)measured about 40% less adsorption of As(V) and As(III) by goethite
than Raven et al. (1998) measured for ferrihydrite
Hematite generally consists of more densely packed larger crystals thangoethite and has a lower surface area (Schwertman and Taylor, 1989).Bowell (1994) reported that adsorption of As(V), As(III), MMA, and DMAby hematite was about half as much as goethite. Other investigators havealso measured lower concentrations of As(V) and As(III) adsorbed byhematite (Singh et al., 1988; Van der Hoek et al., 1994; Xu et al., 1988) thanwere reported for goethite and ferrihydrite in the previously cited studies.
3.4 Aluminum oxides and oxyhydroxides
The Al(III) atom has the same charge and a nearly identical radius as theFe(III) atom. As a result, the common hydrous Al oxide phases arestructurally similar to hydrous Fe oxides (Waychunas, 1991). Oxides andhydroxides of Al also have significant adsorption capacity for As, and theirpH dependent adsorption isotherms are similar to those for Fe oxides andhydroxides; both have similar IEP’s (Anderson et al., 1976; Parks, 1965).Arsenate, and were strongly adsorbed up toa pH of about 7 by amorphous crystalline (gibbsite),
and Adsorption significantly decreased at higher pH values(Anderson et al., 1976; Cox and Ghosh, 1994; Ghosh and Teoh, 1985;Ghosh and Yuan, 1987; Halter and Pfeifer, 2001; Hingston et al., 1971; Xuet al., 1988). Arsenite adsorption increased to a maximum at pH 8, thendecreased at higher pH values (Ghosh and Teoh, 1985; Gupta and Chen,1978). In all of these studies, the amount of adsorption of As speciesincreased as initial aqueous concentration increased until sites becamesaturated.
3. Geochemical Processes Controlling Transport of Arsenic inGroundwater: A Review of Adsorption
81
The degree of crystallinity of Al oxides and hydroxides also is importantfor As adsorption. For comparable experimental conditions, x-rayamorphous adsorbed more As(V) per gram than crystallineand gibbsite (Anderson et al., 1976; Anderson and Malotky, 1979; Ghoshand Teoh, 1985; Hingston et al., 1971).
Experiments that have compared As adsorption by Fe and Al mineralswith similar structures are few. Gulledge and O’Conner (1973) reportedslightly greater adsorption of As(V) per gram of hydrous Fe oxide thanhydrous Al oxide at pH values of 5-8. Surface areas in these experimentswere not reported. Manning and Goldberg (1996b) compared adsorption ofAs(V) by goethite and gibbsite In these experiments, theinitial concentration of either solid and aqueous As(V) were identical,allowing a direct comparison of the results. Between pH 5 and 9, gibbsiteadsorbed about 17% less As(V) than goethite. Hingston et al. (1971)measured four times more adsorption of As(V) by goethite than bygibbsite between pH 5 and 9. When the initial aqueous As(V) andsolid concentration for these experiments are normalized to surface area, theinitial suspensions contained about of either goethite orgibbsite per liter. These results suggest that surface area alone may notalways be a good indicator of the number of reactive surface-complexationsites.
3.5 Manganese oxides
Manganese oxides in natural systems are often complex mineralscharacterized by poor crystallinity and mixed oxidation states (McKenzie,1989). In addition to being electron acceptors in the oxidation of As(III) toAs(V), Mn oxides can also adsorb As. Direct evidence for adsorption of Asby Mn oxides comes from laboratory experiments in which pure mineralphases have been used.
The birnessite group are the most common Mn oxides formed fromweathering processes and have a low IEP, which results in a net negativesurface charge at pH values common in groundwater. Arsenate adsorption bysynthetic birnessite (IEP ~ 2.5) was reported to be negligible (Oscarson etal., 1981a; Oscarson et al., 1983; Scott and Morgan, 1995). At the pH valuesused in these experiments (4-7), the negatively charged species,apparently could not overcome the energy barrier required to displace afunctional group from the negatively charged birnessite surface. However,As(III) was adsorbed by birnessite at pH 7; the neutralcharge on results in a lower energy barrier to exchange with surfacefunctional groups (Oscarson et al., 1983). Chiu and Hering (2000) reported

82 Chapter 3
about 30% greater adsorption of As(III) by manganite (IEP = 6.2) at pH 4.0than at pH 6.3. These results are contrary to most observations of As(III)adsorption by Fe and Al oxides where adsorption of As(III) increasesbetween pH 4.0 and 6.3.
Adsorption of both As(III) and As(V) were reported by the manganeseoxides cryptomelane (IEP = 2.9) and pyrolusite (IEP = 6.4) (Oscarson et al.,1983). Differences in the degree of crystallinity between these two mineralshad a significant effect on As adsorption. Cryptomelane, with a greatersurface area adsorbed compared to only
adsorbed by pyrolusiteBajpai and Chaudhuri (1999) evaluated As adsorption by Mn dioxide-
coated sand in column experiments. The eluent contained equalconcentrations of As(III) and As(V) in groundwater at pH 7.6.There was complete removal of As for about 135 pore volumes, equivalentto about As/g
3.6 Silica oxides
Oxides of Si have an IEP near pH 2. As a result, they have a net negativecharge at pH values common in water and are not good adsorbents for anions(Stumm and Morgan, 1981). Adsorption of As(V) by quartz was negligiblefor pH values above 3 (Xu et al., 1988). Transport of As(V) through acolumn packed with acid purified silica sand exhibited minimal adsorption(Darland and Inskeep, 1997a). Complete breakthrough of As(V) occured atpore volume 1.5, versus the expected pore volume of 1.0 for a nonreactivesolute.
3.7 Clay minerals
Aluminosilicate clay minerals are composed of alternating layers of silicaoxide and, most commonly, aluminum oxide. There are several differenttypes of sites on clay minerals that can potentially adsorb ions. By analogywith amorphous silica and quartz, OH groups of silica sheets have a negativecharge above pH 2 and are not predicted to react with As. Only the OHgroups associated with Al ions exposed at the edges of clay particles areconsidered to be proton acceptors and able to complex anionic species of As(Davis and Kent, 1990). Thus, the same geochemical properties that controladsorption of As by Al oxide minerals are also important for clay minerals,specifically pH, As concentration and speciation, and the concentration ofadsorption sites.
Results from experiments evaluating As adsorption by different clayminerals have some general commonalities. In all cases, adsorption per gram

3. Geochemical Processes Controlling Transport of Arsenic inGroundwater: A Review of Adsorption
83
of solid of both As(III) and As(V) increased with initial solutionconcentration of As. Maximum adsorption of As(V) by kaolinite,montmorillonite, illite, halloysite, and chlorite occurred up to pH values near7, then decreased with further pH increases (Frost and Griffin, 1977;Goldberg and Glaubig, 1988b; Lin and Puls, 2000; Manning and Goldberg,1997a). Adsorption of As(III) by these same clay minerals was a minimumat low pH and increased with increasing pH. Arsenate adsorbed to a greaterextent than As(III) on all clay minerals at pH <7. At higher pH values,adsorption of As(V) and As(III) were more comparable, and in some casesAs(III) adsorption exceeded that of As(V) (Frost and Griffin, 1977; Lin andPuls, 2000).
Surface area can be an important factor in adsorption of As by clayminerals. Frost and Griffin (1977) found that montmorillonite adsorbedabout twice as much As(III) and As(V) as kaolinite. The surface area ofmontmorillonite was 2.5 times greater than kaolinite. In experiments using apoorly crystallized kaolinite with a surface area comparable tomontmorillonite, the amount of As(V) adsorbed was about the same(Goldberg and Glaubig, 1988b). Halloysite and chlorite were found toadsorb As(V) to a much greater extent than kaolinite, illite, andmontmorillonite (Lin and Puls, 2000). The authors attributed this behavior tothe much larger surface area of the highly disordered halloysite. The chloriteused was an iron rich species, which could have provided additional surfacefunctional groups at Fe-OH sites. However, results from Manning andGoldberg (1996a) show that surface area is not always a good indicator ofAs(V) adsorption by clay minerals. They found that kaolinite (9.1adsorbed 30% more As(V) than illite and 50% more thanmontmorillonite
3.8 Carbonates
There is evidence that carbonate minerals could be important incontrolling the aqueous concentrations of As, especially at higher pH values.Oscarson et al. (1981b) measured no adsorption of As(III) by at pH7. Goldberg and Glaubig (1988b) observed that adsorption of As(V) bycalcite increased from a minimum of 0.7 mM/kg at pH 6 to a maximum of2.0 mM/kg at pH 11. La Force et al. (2000) observed that As was associatedwith the carbonate extractable fraction of sediment in a wetland influencedby mine wastes. Cheng et al. (1999) allowed a solution of As(III) to reactwith calcite. Using data from x-ray standing wave diffraction they concludedthat As(III) was removed from solution and occupied the carbonate sites on

84 Chapter 3
the calcite surface. These studies indicate that adsorption of As in carbonategroundwater systems could be important.
3.9 Humic acids
Organic compounds such as humic acid can adsorb on aquifer solids orbe present in aquifers as a result of depositional history. These compoundscontain surface functional groups which can adsorb ions from solution(Thurman, 1985).
Adsorption of As by two humic acids was a function of pH, Asspeciation, and the humic acid composition (Thanabalasingam andPickering, 1986). For both humic acids, adsorption of As(V) was slightlygreater than As(III). However, the pH effect differed with humic acidcomposition. Arsenate adsorption by the humic acid with a higher ash andCa content was a maximum at pH 6, whereas As(III) adsorption was amaximum at pH 8.5. For the lower ash and Ca humic acid, both As(V) andAs(III) exhibited broad adsorption maxima between pH 5.5 and 7.5.
3.10 Natural materials
Most studies of As adsorption by natural materials have been conductedon soils and lacustrine sediments (Aggett and O'Brien, 1985; Elkhatib et al.,1984a; Manning and Goldberg, 1997b). The surfaces of soil and lacustrinesediment particles tend to contain mixtures of various oxides and clayminerals that can be similar to those found on aquifer solids, although theorganic carbon content of soils and lacustrine sediments is generally greater.Chemical extraction methods have been used to qualitatively identify themineral phases in soils associated with As adsorption. Generally, adsorptionof As(III), As(V), and have been positivelycorrelated with the Fe and Al oxide and clay mineral content of soils(Elkhatib et al., 1984b; Fordham and Norrish, 1979; Jacobs et al., 1970;Livesey and Huang, 1981; Sakata, 1987; Wauchope, 1975; Wauchope andMcDowell, 1984).
Carrillo and Drever (1998) used batch reactors to investigate adsorptionof As by aquifer material collected from the bottom of wells. Adsorptiondecreased from about 2.8 mM/M Fe at pH 7 to 0.7 mM/M Fe at pH 11 andwas correlated with Fe oxide content. Arsenic speciation was not determinedin these experiments.

3. Geochemical Processes Controlling Transport of Arsenic inGroundwater: A Review of Adsorption
85
3.11 Ionic Competition
Many inorganic and organic aqueous species have an influence on Asadsorption. The following discussion deals with those elements that arecommonly found in groundwater. Solutes can compete directly with As foravailable surface binding sites and can indirectly influence adsorption byalteration of the electrostatic charge at the solid surface. Both processes areinfluenced by pH, solute concentration, and the intrinsic binding affinity ofthe solid (Davis and Kent, 1990).
3.12 Phosphate
Spectroscopic studies have shown that the surface species formed byphosphate [P(V)] are identical to those formed by As(V) (Hiemstra and VanRiemsdijk, 1999; Waychunas et al., 1993). Adsorption experiments havedemonstrated that the affinity of P(V) for surface sites is similar to As(V)(Gao and Mucci, 2001; Hingston et al., 1971; Manning and Goldberg,1996a; Manning and Goldberg, 1996b; Manning and Goldberg, 1996b;Ryden et al., 1987). Experimental data from Jain and Loeppert (2000),replotted in Fig. 5, show the influence of P(V) on adsorption of As(V) andAs(III) by ferrihydrite as a function of pH. The P(V)/As ratios (1:1 and 10:1)used in these experiments are within the range reported for manygroundwaters. Adsorption of both As(V) and As(III) decreased withincreasing P(V) concentration. For As(V), the decrease was significant overthe entire pH range. Competition for adsorption sites between As(V) andP(V) involves species with the same charge. At pH values less than about 7,
and predominate. At higher pH values, andpredominate. Phosphate had the greatest effect on As(III) adsorption at lowerpH values. At pH 9, adsorption of As(III) decreased by only a few percent,even at the highest P(V) concentration. Apparently, the neutral wasbetter able to compete for surface-complexation sites with at higherpH.
Phosphate competition with As(V) has been observed for otheradsorbents. Hingston et al. (1971) measured an 85% decrease in As(V)adsorption by goethite when the P(V)/As(V) ratio was increased from zero to12:1. Manning and Goldberg (1996b) reported that a P(V)/As(V) ratio of 1:1caused a 30% decrease in As(V) adsorption by both goethite and gibbsite atpH values less than 8, compared to P(V)-free solutions. Similar effects ofP(V) on As(V) adsorption were observed for kaolinite, montmorillonite, andillite (Manning and Goldberg, 1996a). Adding P(V) to natural systems such

86 Chapter 3
as soils has also been found to increase the mobility of As (Darland andInskeep, 1997a; Melamed et al., 1995; Peryea, 1991; Roy et al., 1986a, b).
3.13 Sulfate
Macroscopic chemical evidence indicates that sulfate [S(VI)] adsorbs viaelectrostatic attraction as an outer-sphere complex and should therefore havemuch less effect on As adsorption than inner-sphere complex formers suchas P(V). Sulfate would only be expected to adsorb when the net surfacecharge is positive, i.e., at pH values below the IEP of the solid (Hingston etal., 1972). This is consistent with experimental data for S(VI) adsorption bysynthetic ferrihydrite (Dzombak and Morel, 1990) and natural aquifer solids(Stollenwerk, 1995). Experimental data from Jain and Loeppert (2000),replotted in Fig. 6, show the influence of S(VI) on adsorption of As(V) andAs(III) by ferrihydrite as a function of pH. The S(VI)/As ratios for Fig. 6,10:1 and 50:1 reflect the fact that S(VI) concentrations in groundwater aregenerally much greater than As. Sulfate had essentially no effect on As(V)adsorption over the entire pH range. At the highest S(VI) concentration,

3. Geochemical Processes Controlling Transport of Arsenic inGroundwater: A Review of Adsorption
87
adsorption actually increased by a few percent, which the authors attributedto a possible ionic strength effect. There was a decrease in As(III) adsorptionfor both S(VI) concentrations at pH <7 but no effect at higher pH.
Similar results were observed by Wilkie and Hering (1996). For aS(VI)/As(III) ratio of 4,000:1, As(III) adsorption by ferrihydrite wassuppressed by 20% at pH 7 and 70% at pH 4. However, As(V) adsorptiondecreased by only a few percent at pH 5.
3.14 Carbonate
Limited evidence indicates that carbonate species may have some effecton adsorption of As. For the pH range of interest in groundwater, all threecarbonate species, and can be present. No attempt ismade here to distinguish between the adsorbing species, and is usedfor discussion purposes. Carbonate is a weakly adsorbing anion, but itsadsorption mechanism is not well understood. Outer-sphere complexation
88 Chapter 3
has been assumed by many investigators. However, Su and Suarez (1997)found that adsorption of lowered the electrophoretic mobility anddecreased the IEP of amorphous Al and Fe oxides, gibbsite, and goethite,implying inner-sphere complex formation. Spectroscopic evidence suggestedformation of a monodente inner-sphere complex. Adsorption of hasbeen reported to decrease adsorption of outer-sphere complexing anions suchas Cr(VI) by Fe oxides (Van Geen et al., 1994; Zachara et al., 1987).However, has also been found to increase adsorption of weaklyadsorbing sulfate and selenate by aluminum oxide in the pH range of 6 to 8(Wijnja and Schulthess, 2000). This promotive effect was a maximum at 0.3mM and decreased at higher concentrations. The authorssuggested that coadsorption of increased the positive charge on themineral surface, facilitating adsorption. There was no effect of onstrongly adsorbing P(V).
Meng et al. (2000) measured essentially no effect of on adsorptionof As(III) and As(V) by ferrihydrite. These experiments were conducted inequilibrium with air and total concentration was 0.01 mM. Fuller et al.(1993) reported little effect of 3 mM in stream water on adsorption ofAs(V) at pH 8. In a column experiment using sand that contained Fe oxidecoatings, there was essentially no difference (<5%) in transport of As(V) atpH 8.5 between solutions buffered with (1 mM and (<0.1 mM
(Darland and Inskeep, 1997a). Other evidence indicates thatmay have some effect on adsorption of As(III) but not As(V). Wilkie andHering (1996) found that 1 mM caused about a 10% decrease inAs(III) adsorption by ferrihydrite at pH 9 but no effect at pH 6. Arsenateadsorption at pH 9 decreased by only a few percent. Appelo and de Vet (thisvolume) presented evidence which suggested that adsorption of byferrihydrite decreased adsorption of As(III), and to a lesser extent As(V), ina shallow aquifer; concentration in groundwater was 5 mM and pHvalues were between 7.1 and 7.7. Results from these experiments suggestthat higher concentrations of often found in groundwater may have aneffect on As adsorption.
3.15 Silica
Silicic acid has also been shown to effectively complete withAs for adsorption sites (Davis et al., 2001). Meng et al. (2000) evaluated theeffect of Si and As adsorption in experiments as ferrihydrite wasprecipitating from solution. Adsorption of As(III) and As(V)
at pH 6.8 began to decrease in the presence of 1 mg/L Si; at 10mg/L Si, adsorption decreased by 70% for As(V) and 80% for As(III).Results from experiments using ferrihydrite that had been aged for 18-24

3. Geochemical Processes Controlling Transport of Arsenic inGroundwater: A Review of Adsorption
89
hours prior to adding Si showed that 3.1 mg/L Si had little effect onadsorption of As(III) and As(V) at pH values <8. At pH >8, As(V)adsorption was inhibited by as much as 40% (Swedlund and Webster, 1999).In the presence of 56 mg/L Si, As(III) adsorption decreased between pH 4and 10 by as much as 35%. Adsorption of As(V) was only inhibited at pH>6, but the decrease was as much as 60%. Swedlund and Webster (1999)attributed the decrease in As adsorption at high Si concentrations to acombination of competition for surface sites and polymerization of Siresulting in an increase in negative surface charge.
3.16 Organic compounds
Dissolved organic solutes can also compete for sites with As. Fulvic aciddecreased adsorption of As(V) by Al oxides. The effect was mostpronounced at pH values <7 but occurred to some extent even at higher pH(Xu et al., 1988). Fulvic acid decreased adsorption of As(V), As(III),
by Fe oxides in the pH range 4-8 (Bowell,1994). Hering et al. (1997) found little effect of natural organic matter (1-5mg/L) on adsorption of As(V) (10 by ferrihydrite at pH 6. However, 4mg/L organic matter did decrease adsorption of As(III) (10 betweenpH 4 and 6 by more than 50%
3.17 Calcium and magnesium
Some solutes have been reported to enhance adsorption of As. Forexample, adsorption of Ca by ferrihydrite at pH 9 resulted in an increase inAs(V) adsorption (Wilkie and Hering, 1996), apparently by increasing theamount of positive charge on the oxide surface. Adding Ca and Mg tosuspensions of ferrihydrite negated part of the competitive effect of Si on Asadsorption (Meng et al., 2000). The presence of Ca also enhanced adsorptionof As(V) by Al oxide at pH >8 (Ghosh and Teoh, 1985).
3.18 Kinetics
The chemical reaction step in adsorption of As(III) and As(V) by metaloxyhydroxides has been reported to be rapid, with greater than 90%adsorption occurring within a few hours (Anderson et al., 1976; Darland andInskeep, 1997b; Elkhatib et al., 1984b; Fuller et al., 1993; Grossl and Sparks,1995; Singh et al., 1988; Van der Hoek et al., 1994; Xu et al., 1988). Thisinitial rapid adsorption step is followed by a slower approach to equilibriumwhich may take up to several days. The slow rate of approach to equilibrium

90
suggests that diffusion-controlled mass transfer of As to adsorption siteslocated in the internal porosity of minerals and mineral aggregates may bethe rate limiting step (Fuller et al., 1993; Willett et al., 1988). Experimentalresults from Fuller and Davis (1989) support this hypothesis. They measuredAs(V) adsorption as ferrihydrite precipitated from solution, ensuring thatAs(V) was in contact with surface sites as they formed. Equilibrium wasattained within one hour. Waychunas et al. (1993) used EXAFS to study thetime dependence of As(V) adsorption by ferrihydrite. They observed nochange in the bonding mechanism with time and found no evidence forformation of an As(V) mineral phase.
Speciation and pH also affect As adsorption rates. Arsenate adsorptionwas generally faster than adsorption of As(III), especially at lower pH(Ghosh and Teoh, 1985; Pierce and Moore, 1982). At a higher pH of 9, therate of As(V) adsorption was slower and similar to As(III) (Ghosh and Teoh,1985; Ghosh and Yuan, 1987; Raven et al., 1998).
Breakthrough curves from column experiments have been used toprovide evidence for diffusion of As to adsorption sites as a rate-controllingmechanism. Darland and Inskeep (1997b) found that adsorption rateconstants for As(V) determined under batch conditions were smaller thanthose necessary to model breakthrough curves for As(V) from columnspacked with iron oxide coated sand; the rate constants needed to model thebreakthrough curves increased with pore water velocity. For example, at theslowest velocity of 1 cm/h, the batch condition rate constant was 4 timessmaller than the rate constant needed to model As adsorption in the columnexperiment. For a velocity of 90 cm/h, the batch rate constant was 35 timessmaller. These results are consistent with adsorption limited by diffusion ofAs(V) from the flowing phase to sites within mineral aggregates. Puls andPowell (1992) also measured more retardation and smaller rate constants forAs(V) at slower flow velocities where there was sufficient time for diffusionto adsorption sites.
3.19 Reversibility
Desorption of strongly-bound ions often takes longer to attainequilibrium than adsorption. Several factors may contribute toadsorption/desorption hysteresis including differences in the aqueouscomposition of the adsorbing and desorbing solution, diffusion, time, and thenature of the adsorption bond.
Rates of As desorption are affected by pH. Darland and Inskeep (1997a)conducted column experiments using sand that contained Fe oxide coatings.The pH during both the adsorption and desorption parts of these experimentswas maintained at a constant value of 4.5, 6.5, or 8.5. One pore volume of
Chapter 3

3. Geochemical Processes Controlling Transport of Arsenic inGroundwater: A Review of Adsorption
91
water containing As(V) was eluted through the column followed byabout 10 pore volumes of As(V)-free water. Arsenate adsorption was lowestat pH 8.5; the As(V) pulse was only retarded by 1 pore volume and the peakconcentration was Elution of As(V)-free water at pH 8.5 desorbedmore than 95% of the added As(V) within 10 pore volumes. Arsenateadsorption was greater at pH 4.5 and 6.5; As(V) broke through about 1 porevolume later than in the pH 8.5 experiment, and peak concentrations wereonly about Recovery of As(V) after 10 pore volumes was 35% at pH4.5 and 40% at pH 6.5.
Fuller et al. (1993) measured desorption rates for As(V) fromferrihydrite, aged for 24 h, as a result of increasing pH. Arsenate was firstequilibrated with ferrihydrite for 144 h at pH 8.0 The molar ratio of As(V)adsorbed to Fe in ferrihydrite was 0.10 (Fig. 7). Desorption was initiated byrapidly increasing the pH to 9.0. Within a few hours, the molar ratio ofAs(V)/Fe had decreased to about 0.08. The rate of desorption then slowed asthe rate became limited by diffusion of As(V) from pores within mineralaggregates. Within 96 h, the concentration of As(V) still adsorbed was onlyabout 5% greater than the adsorbed concentration of As(V) determined in aseparate adsorption experiment at pH 9.0. Similar desorption behavior forAs(V) from ferrihydrite were measured by Fuller and Davis (1989).
Addition of a strongly competing ion can enhance desorption of As(Darland and Inskeep, 1997b). In a column experiment at pH 4.5, a one porevolume pulse of As(V) was added to a column packed with sand,followed by elution with 20 pore volumes of As(V)-free water. About 20%of the As(V) was recovered. The column was then continuously eluted with
P(V), which resulted in an additional 40% recovery of As(V).Lin and Puls (2000) investigated the effects of aging on desorption of
As(III) and As(V) by clay minerals. Solutions containing either As(III) orAs(V) were equilibrated at pH 5.5 for 24 h, centrifuged and filtered. Fordesorption experiments, the clays were either unaged or aged for 30 and 75days. Desorption was accomplished by adding a solution containing 1 mM
at pH 7 to the clay for 10 h. Arsenic desorption varied withthe type of clay mineral, As species, and in most cases time of aging. Only afew examples of the results are given here. For halloysite and kaolinite,desorption of As(III) was almost 100% for the unaged experiments. Afteraging for 75 days, only about 15% As(III) was desorbed from halloysite, andabout 30% from kaolinite. Desorption of As(V) from halloysite decreasedfrom 85% in the unaged experiment to 65% after 75 days of aging. Forkaolinite, As(V) desorption decreased from about 98% in the unagedexperiment to 70% after 75 days of aging.

92 Chapter 3
Initial As concentration was also a factor in the amount desorbed. Pulsand Powell (1992) measured desorption of As(V) from in batchexperiments by repeated mixing with As-free solutions. A pH of 7 was usedduring both the adsorption and desorption experiments. They found that thepercent desorbed was directly proportional to the initial As(V) concentration.For an initial As(V) concentration of about was adsorbedand only 2% of this was desorbed. For an initial concentration ofabout was adsorbed and 20% was desorbed. Results indicated adecline in the energy of adsorption as surfaces became increasingly saturatedwith As(V).

3. Geochemical Processes Controlling Transport of Arsenic inGroundwater: A Review of Adsorption
93
The type of bond formed between As and the solid surface has also beenshown to be important for desorption. Grossl and Sparks (1995) attributedthe slow desorption of As(V) from the goethite surface to a two-step reactionprocess. Using pressure-jump relaxation techniques, they concluded that inthe initial adsorption step, a monodente surface complex was rapidly formedby ligand exchange with OH groups. This was followed by a slower, secondligand exchange reaction resulting in formation of a bidente complex. Thus,the adsorption rate constant reflected the rapid monodente step, whereas thedesorption rate constant was controlled by the slower breaking of the bidentebond. Formation of a binuclear inner sphere complex, and to a lesser extent,a monodente inner sphere complex between As(V) and the ferrihydrite sur-face has also been confirmed by EXAFS (Waychunas et al., 1993).
The hysteresis often observed in the adsorption and desorption of As hasimportant implications for remediation strategies designed to decrease Asconcentrations to levels that meet drinking water supply criteria. The initialefficiency may be high as the readily desorbable fraction is removed fromsolution; however, efficiencies may decrease significantly if As adsorption isnot readily reversible. Changing the chemistry of the desorbing solution canfacilitate or inhibit As desorption.
4. ADSORPTION MODELS
Two general types of models have been developed to describeadsorption/desorption reactions at mineral surfaces: (1) empirical modelsthat are based on the partioning relationships of a solute between theaqueous and solid phase, and (2) conceptual models for surfacecomplexation that treat adsorption reactions similar to ion associationreactions in solution. All of these models assume that adsorption reactionsare at equilibrium.
4.1 Empirical Adsorption Models
The most widely used empirical adsorption models include theDistribution Coefficient:
the Langmuir Isotherm:

94 Chapter 3
and the Freundlich Isotherm:
where; is the adsorbed concentration, C is the aqueous concentrationat equilibrium with the solid phase, S is the adsorption site concentration,is the distribution coefficient, is the Langmuir equilibrium constant, isthe Freundlich equilibrium constant, and “a” is the Freundlich exponent(Zheng and Bennett, 1995).
Equilibrium constants for empirical models are determined frommeasurements of the activity of a solute in water and the equilibriumadsorbed concentration. Experiments usually consist of a series of batchreactors where a solid phase is suspended in solutions that have a range ofknown solute concentrations. Equilibrium constants are then derived fromvarious types of plots of the adsorbed and aqueous concentrations. Theseequilibrium constants are highly dependent on solution and solidcomposition. For example, values of and for As adsorption have beenshown to be a function of pH, the concentration of competing ions, and themineralogy of the adsorbent (Darland and Inskeep, 1997a; Ghosh and Yuan,1987; Hingston et al., 1971; Hsia et al., 1992; Pierce and Moore, 1982;Sakata, 1987). Therefore, empirical models are limited to the specificexperimental conditions used to determine the Log K’s.
Modifications to the Langmuir and Freundlich isotherm equations havebeen made to extend their flexibility for accomodating the effects on Asadsorption of pH variability (Anderson et al., 1976) and ionic competition(Hingston et al., 1971; Roy et al., 1986a). However, even these modifiedequations are limited in their ability to simulate As adsorption in complexnatural environments.
4.2 Surface Complexation Models
Surface complexation models (SCM’s) provide a rational interpretationof the physical and chemical processes of adsorption and are able to simulateadsorption in complex geochemical systems. Chemical reactions at the solid-solution interface are treated as surface complexation reactions analogous tothe formation of complexes in solution. Each reaction is defined in terms ofa mass action equation and an equilibrium constant. The activities ofadsorbing ions are modified by a coulombic term to account for the energyrequired to penetrate the electrostatic-potential field extending away fromthe surface. Detailed information on surface complexation theory and themodels that have been developed, can be found in (Stumm et al., 1976;

3. Geochemical Processes Controlling Transport of Arsenic inGroundwater: A Review of Adsorption
95
1980), Westall and Hohl (1980), Davis and Kent (1990), Dzombak andMorel (1990) and Stumm (1992). A brief overview is presented here.
Several SCM’s have been described in the literature. The morecommonly used models include the Constant Capacitance Model (Schindlerand Stumm, 1987), the Diffuse Double Layer Model (Stumm et al., 1970)and the Triple Layer Model (Davis et al., 1978; Yates et al., 1974). All arebased on electric double layer theory but differ in their geometric descriptionof the oxide-water interface and the treatment of the electrostaticinteractions.
Application of SCM’s to describe adsorption requires accurate solutionspeciation of all elements that might have an effect on the activity of theadsorbing solute of interest. Incorporation of SCM’s in geochemicalequilibrium models such as MINTEQA2 (Allison et al., 1991) andPHREEQC (Parkhurst and Appelo, 1999) have greatly facilitatedsuchcalculations.
4.3 Model parameters
Methods for measurement of parameters used in SCM’s have beendescribed in the literature. Only a brief summary is presented here. Surfacecomplexation model parameters that can be measured directly include, (1)the solid concentration, (2) surface site density, (3) surface area, and (4)equilibrium constants for the mass action equations describing all relevantadsorption reactions. The relation between surface charge and potential iscalculated in geochemical equilibrium models.
Measurement of solid concentration is straightforward given esimates ofaquifer porosity and the density of solids. Surface area for these solids canbe measured by several techniques (Dzombak and Morel, 1990). All havetheir advantages and disadvantages. The BET, gas method is one of themost widely used techniques (see for example Coston et al., 1995).
Reasonable estimates of surface site density are important for accuratemodeling of solute adsorption (Davis and Kent, 1990). The most commonmethods for estimating surface site density include measurement ofadsorption maxima of protons, cations, or anions at pH values whereadsorption of the specific solute is greatest. Most measurements of surfacesite density for Fe, Al, and Mn oxides range from 1 to 7 (Davisand Kent, 1990). Dzombak and Morel (1990) reviewed the adsorptionliterature for ferrihydrite and selected a surface site density of 3.84
in constructing a coherent thermodynamic database foradsorption of cations and anions by ferrihydrite.

96 Chapter 3
Natural systems contain complex mixtures of minerals and it is difficultto quantify the concentration of surface sites for individual minerals. Forconsistency in applying the surface complexation modeling approach tonatural systems, Davis and Kent (1990) recommended that equilibriumconstants for strongly binding solutes be derived using the site density fromDzombak and Morel (1990) of 3.84 This appears to be areasonable choice for systems where adsorption is dominated by metaloxides. Stollenwerk (1995) measured the surface site density of aquifersolids from a sand and gravel outwash aquifer by titration of the solids with
to a pH of 3.5. The average surface site density for 51 core samples was3.3 (range 1.6-4.2 The predominate sorbents werehydrous Fe and Al oxide coatings on quartz and feldspar (Coston et al.,1995; Fuller et al., 1996).
Protonation/deprotonation reactions are included in SCM’s to describethe amphoteric behavior of oxide surfaces:
Accurate measurement of surface acidity constants for reactions 11 and12 can be difficult (Davis and Kent, 1990; Dzombak and Morel, 1990),especially for natural systems (Stollenwerk, 1995). Acidity constants areoften derived from acid-base titration data (Parks and de Bruyn, 1962), andconstants for several metal oxides have been published. These publishedvalues have been used as initial estimates for modeling adsorption in naturalsystems with complex mineralogy. The acidity constants have then beenoptimized simultaneously with equilibrium constants for other solutes togive the best fit to experimental data (Goldberg and Glaubig, 1988b; Kent etal., 1995; Kent et al., 2001).
Quantifying adsorption of As requires mass action equations such asthose listed in an earlier section of this chapter (reactions 1-6). Multiplesurface species are needed to describe the pH dependent adsorption of As.For example, the surface species and (where S= surface) are applicable to As(V) adsorption over the pH range ofgroundwater (Hsia et al., 1992; Manning and Goldberg, 1996b). Comparablesurface species that have been used for adsorption of As(III) are
and (Manning and Goldberg, 1997a). Equilibriumconstants for these reactions are generally fit to data from batch reactorexperiments similar to those used to quantify empirical models. It is

3. Geochemical Processes Controlling Transport of Arsenic inGroundwater: A Review of Adsorption
97
important that the Log K’s for these reactions be calibrated for the range ofAs concentrations expected in a particular study area.
Because the various SCM’s have different formulations for treatingadsorption reactions and the electrostatic terms, parameters fit to one modelmay not be applicable to other models (Morel et al., 1981). For example,Gao and Mucci (2001) determined different Log K’s for As(V) adsorptionby goethite when the data were fit to the Constant Capacitance Model, theBasic Stern Model, and the Triple Layer Model.
The presence of solutes that compete for adsorption sites with As shouldalso be included in SCM’s. For example, the competitive effects of the pHdependent adsorption of P(V) can be modeled using:
(Manning and Goldberg, 1996b). Similar reactions can be written for asmany solutes as needed; however, mass action equations for each additionalsolute requires a corresponding increase in the number of laboratoryexperiments needed to quantify adsorption.
Deriving equilibrium constants for surface complexation reactions basedon experimental data can be facilitated with paramater optimizationprograms such as FITEQL (Westall, 1982). Ideally, surface site density isknown; however, it can also be adjusted simultaneously with LogK’s toobtain the best match with experimental data. Parameter estimationprocedures have inherent limitations due to the covarience of estimatedparameters (Hayes et al., 1990). For example, Log K’s and surface sitedensity can be adjusted simultaneously to achieve the best fit to experimentaladsorption data. However, changing the site density necessitates a new set ofLog K’s.
Surface complexation models have been successfully used to describe thepH dependent adsorption of As(III) and As(V) by several minerals includingferrihydrite, goethite, amorphous As(OH)3, gibbsite, kaolinite,montmorillonite, and illite (Goldberg and Glaubig, 1988b; Hsia et al., 1992;Manning et al., 1998; Manning and Goldberg, 1997a). Because ofdifferences in adsorption properties between these oxides, different Log K’swere determined for each mineral.

98 Chapter 3
Use of Log K’s derived from experimental data for single anion systemshave met with mixed success in describing the effects of anion competitionon As adsorption. Swedlund and Webster (1999) were able to modelcompetitive adsorption between and As(III) or As(V) using Log K’sderived separately for each solute. Equilibrium constants for As(V) and P(V)adsorption by goethite and gibbsite derived from single anion experimentaldata were able to match As(V) adsorption reasonable well for a range ofP(V) concentrations in binary adsorption experiments (Hiemstra and VanRiemsdijk, 1999; Manning and Goldberg, 1996b). However, in other studiessingle anion Log K’s had only limited success in modeling competitiveadsorption of As(V) and P(V) by kaolinite, montmorillonite, and illite(Manning and Goldberg, 1996a), and goethite (Gao and Mucci, 2001).
Other studies have shown that SCM’s were more successful in modelingcompetitive adsorption when the Log K’s were determined for binarysystems. For example, determining Log K’s for As from experiments in thepresence of P (Goldberg, 1986).
Accurate predictions of the transport of As in groundwater requires sitespecific data to model adsorption/desorption reactions. In complex mixturesof minerals, it may not be possible to quantify the adsorption properties ofindividual minerals. Therefore, it has been suggested that adsorptionproperties of composite materials should be characterized as a whole (Davisand Kent, 1990). Previously published data for adsorption by pure mineralphases such as the surface complexation database for adsorption byferrihydrite (Dzombak and Morel, 1990) can be a useful starting point formodeling adsorption of solutes in groundwater; however, these equilibriumconstants may not reflect the adsorption properties of composite oxidecoatings on aquifer solids. For example, incorporation of Si, and to a lesserextent, Al into Fe oxyhydroxides has been shown to decrease adsorptionreactivity towards anions (Ainsworth et al., 1989; Anderson and Benjamin,1990; Anderson et al., 1985). Therefore, equilibrium constants will likelyneed to be modified for site-specific studies.
Results from two field investigations illustrate this point. Kent et al.(1995) modeled adsorption of Cr(VI) in the presence of S(VI) by naturalaquifer solids using equilibrium constants that were 1.75 Log K units lowerthan those used to model adsorption by ferrihydrite (Dzombak and Morel,1990). To model competitive adsorption of Mo(VI) and P(V) by these sameaquifer solids, Stollenwerk (1995) decreased the Dzombak and Morel (1990)equilibrium constants for both anions by 1.2 Log K units. Results from bothof these studies indicate that the dominant adsorbents had lower affinities foradsorption of anions than pure ferrihydrite.

3. Geochemical Processes Controlling Transport of Arsenic inGroundwater: A Review of Adsorption
5.
99
MODELING TRANSPORT OF ARSENIC
Predictions of the spatial and temporal distribution of As in groundwaterare achieved by coupling adsorption models with solute transport models.
Empirical adsorption models have been widely used to model transport ofreactive solutes in groundwater. The main advantage of these models is theirmathematical simplicity which readily allows incorporation in solutetransport models (Grove and Stollenwerk, 1987). However, these models arelimited in their ability to describe As adsorption in complex geochemicalsystems.
A more recent approach has been the coupling of geochemical speciationmodels with advective-dispersive solute-transport models. The chemicalreactions for each cell in the model are solved separately by the geochemicalmodel. Species are then transported one time step by the transport model.This process is repeated sequentially until the end of the simulation. Severalsuch codes have been developed. These include, but are not limited to,TRANQL (Cederberg et al., 1985), HYDROGEOCHEM (Yeh and Tripathi,1991), MST1D (Engesgaard and Kipp, 1992), PHAST (Kipp and Parkhurst,in press; Parkhurst et al., 1995), MOC PHREEQC (Engesgaard and Traberg,1996), and PHREEQC (Parkhurst and Appelo, 1999). This coupled approachhas been successfully applied to groundwater investigations (Keating andBahr, 1998; Stollenwerk, 1996; Stollenwerk, 1998).
6. SUMMARY
Adsorption of As by metal oxyhydroxides and clay minerals is likely tobe a major control on the transport of As in groundwater. Studies haveshown that adsorption of As is a complex function of the interrelationshipsbetween the properties of the solid surface, pH, the concentration of As andcompeting ions, and As speciation.
Arsenic is generally present as As(V) in oxidizing environments and asAs(III) in moderately reducing environments. However, the rate of As(III)oxidation can be relatively slow in the presence of oxygen and As(III) cancoexist with As(V). The rate of As(III) oxidation is greatly increased by thepresence of other oxidants such as manganese oxides.
The extent of As adsorption and desorption is largely controlled by pH;As(III) and As(V) respond differently to changes in pH. Arsenate adsorbsover the pH range found in most groundwaters; however, adsorption is muchstronger at lower pH values. As pH increases above about 7, the increasingnegative charge of the solid surface and the aqueous As(V) species results in

100 Chapter 3
significantly less adsorption. Arsenite also adsorbs over a large range in pH.In contrast to As(V), As(III) adsorption increases with pH, attaining amaximum at about pH 8 or 9. As a result of this contrasting behavior, As(III)is generally more mobile than As(V) in acidic environments and less mobilein alkaline environments.
Many of the solutes commonly present in groundwater can influenceadsorption of As. Anions compete directly with As for surface complexationsites, the stronger the anion adsorption the greater the competition.Adsorption of cations can increase adsorption of As by increasing thesurface charge of a solid.
The kinetics of As adsorption is rapid, with greater than 90% adsorptionoccurring within a few hours. However, several days may be required forcomplete equilibrium because of diffusion-controlled mass transfer of Asthrough water in the internal porosity of minerals and mineral aggregates.Some studies have shown that As adsorption is reversible under comparableadsorption and desorption conditions; however, other studies havedemonstrated hysteresis leading to incomplete desorption. Desorption can beenhanced by altering pH or the addition of other strongly adsorbing solutes.This observation has important implications for remediation strategiesdesigned to decrease As concentrations to levels that meet drinking watersupply criteria.
Surface complexation models are the most versatile for modeling Asadsorption for a wide range of geochemical conditions. Coupling of thesemodels with solute transport models provides a powerful tool for predictingthe spatial and temporal distribution of As in groundwater.
ACKNOWLEDGEMENTS
The author would like to thank Chris Fuller and Don Thorstenson forreading and providing a constructive review of this manuscript.

Chapter 4
Geothermal ArsenicThe source, transport and fate of arsenic in geothermal systems
Jenny G. Webster1 and D. Kirk Nordstrom2
1 University of Auckland, Auckland, New Zealand2US Geological Survey, Boulder, CO, USA
The release of arsenic from geothermal systems into surface and ground waterscompromises the use of these waters as drinking water resources. In surfacewaters, As contamination can also adversely affect aquatic ecosystems,accumulating in sediments and plants. This review examines the source ofarsenic in geothermal areas, its transport and speciation in geothermal fluidsand receiving waters, as well as the deposition and removal mechanismsoccurring in both natural environments and waste or water treatment systems.The effect of microorganisms on As mobility, and the opportunities that existfor further research in this field, are discussed. The review focuses on twogeothermally active regions which have been intensively studied: YellowstoneNational Park in the USA, and the Taupo Volcanic Zone in New Zealand, andtheir associated catchments.
1. INTRODUCTION
Arsenic (As) is a ubiquitous component of active and fossil geothermalsystems. It occurs together with other environmental contaminants such asmercury (Hg), antimony (Sb), selenium (Se), thallium (Tl), boron (B),lithium (Li), fluoride (F) and hydrogen sulfide These elements arenow recognised as being a typical “geothermal suite” of contaminants(Webster-Brown, 2000). High temperature geothermal systems occurthroughout the world, generally in one of three tectonic settings. One suchsetting is on or close to tectonic plate boundaries. The edge of the PacificPlate, for example, is defined by geothermal fields in New Zealand, PapuaNew Guinea, Philippines, Indonesia, Japan, Kamchatka, Alaska, westernUSA, Mexico, central America and Chile. Another setting is the Earth’s “hotspots”, where local magma chambers rise from near the mantle to shallowdepths in the earth’s crust, such as in Hawaii, Yellowstone and the Azores.

102 Chapter 4
Although surface expression of recent volcanism is often associated withgeothermal activity, it is not a prerequisite. The Larderello (Italy) and theGeysers (USA) geothermal steam fields, for example, are associated withinstrusive activity in areas of fissured sedimentary and metamorphic rocks(Ellis and Mahon, 1967). The third setting is in rift zones where the tectonicplates diverge, such as the Gregory Rift Valley in Ethiopia, Kenya andTanzania, the Rio Grande Rift valley in Colorado and New Mexico, and inthe rift system in Iceland. Ellis and Mahon (1977) provide a morecomprehensive description of geothermal settings.
Many geothermal fields have been developed, or are targeted fordevelopment, to generate energy from the steam and hot water reservoirsbeneath the earth’s surface.
1.1 Geothermal arsenic toxicity
The acute and chronic toxic effects of As are well documented. RecentlyAs has also been declared a human carcinogen, contributing to a highincidence of skin and other cancers in populations exposed to high levels ofAs in drinking water (WHO, 1993). The WHO drinking water guideline forAs was lowered from 0.05 mg/L to 0.01 mg/L in 1993, and the new valuehas since been adopted by many countries as a drinking water standard. InJanuary 2001 the USEPA lowered the USA drinking water limit from 0.05 to0.01 mg/L (Federal Register, 2001). However, this new standard waschallenged by the new federal administration and further review wasmandated. The results from three new scientific reports conclude that thenew standard should be less than 0.01 mg/L.
Arsenic concentrations in natural surface drainage systems frequentlyexceed 0.01 mg/L in areas of geothermal activity. The Madison River,which drains part of Yellowstone National Park (Fig. 1), for example,contains ~ 2mg/L As near West Yellowstone (Thomson, 1979). Symptomsof chronic As poisoning such as skin lesions and high As concentrations inhair and nails have been reported from geothermal areas (Chen et al., 1999),but this may not always be as a direct consequence of drinking watercontamination. At the Mt. Apo geothermal field in the Philippines, forexample, the two rivers draining the field carry elevated As concentrationsdue to hot spring activity in the river beds. During development of the field,alternative clean drinking water supplies were provided and used by localresidents, but the symptoms of high As exposure appeared to persist(Webster, 1999). The accumulation of As in edible aquatic plants is likely tohave been to blame, as high levels of As have been reported in aquatic weedsin other river systems receiving geothermal fluids (e.g., Reay, 1972).

4. Geothermal Arsenic 103
This chapter reviews what is currently known of the source and mobilityof As in geothermal systems, as well as its fate and toxicity in the near-surface environment. The discussion focuses on two of the most thoroughlystudied geothermally active regions: Yellowstone National Park in the US,which is mainly drained by the Madison and Yellowstone Rivers, and theTaupo Volcanic Zone in New Zealand, which is drained by the WaikatoRiver (Fig. 1).
2. THE SOURCE OF ARSENIC IN GEOTHERMALSYSTEMS
2.1 The source and nature of geothermal fluids
Geothermally active areas occur where an unusually high geothermalgradient allows hot water or steam to emerge at the earth’s surface. Thetemperature of geothermal fluids may be elevated by only a few degrees, orby hundreds of degrees, above ambient (e.g., Ellis, 1967; White et al.,1971). Heat sources may be related to volcanic or magmatic activity,metamorphism, faulting and radioactivity.

104 Chapter 4
Although geothermal fluids were initially thought to be of magmaticorigin, isotopic analyses over the last 50 yrs (e.g., Craig et al., 1956;Giggenbach, 1971) have indicated that they are most commonly derivedfrom meteoric waters. Deuterium-hydrogen and oxygen-isotope ratios aretypically similar to those of local surface waters, although a minorcontribution from magmatic fluids is a possibility at some fields (e.g., White,1974). Irrespective of the heat source, deeply circulating groundwaters areconductively heated in the crust. The hot fluids are of lower density thansurrounding waters, and rise through the host rock, to complete thecirculation system (Fig. 2).
The chemical composition of this fluid, which effectively constitutes the“geothermal reservoir”, is a function of fluid temperature and host rockcomposition. As a solvent, hot water has a high dielectric constant, enablingit to dissolve ionic crystalline minerals in the host rock, forming newhydrated minerals, and transporting solutes away from the reaction site. Aseries of high temperature water-rock interaction experiments wereundertaken in the 1960s to characterise the interactions between thermalwaters and a variety of rock types including basalts, andesites, rhyolites andgreywackes. The experiments were conducted at temperatures of 150 –600°C and at various pressures (Ellis and Mahon, 1977; Ellis and Mahon,1964) and confirmed that Cl, B and F could be rapidly leached into solution,even before significant alteration of the host rock had occurred. Otherelements such as Li, Rb and Cs, which had previously been assumed toderive only from magmatic fluids, were also released into the hot waterleachate during mineral alteration.
Such experiments under conditions of controlled gas fugacities and/orleachate chemistry, confirmed the importance of hot water-mineral equilibriain determining geothermal fluid compositions. Together with detailedanalysis of mineral alteration assemblages in geothermal host rocks, they ledto the development and refinement of a variety of geothermometers. Themost applicable of these are the Na/K, Na/K/Ca and geothermometers,which are based on the temperature dependent solution equilibria withfeldspars and micas, and with quartz respectively (e.g., Fournier and Potter,1982; Fournier and Truesdell, 1973; Giggenbach, 1988). The concentrationsof dissolved and are also a function of mineral solubility,controlled mainly by equilibria with carbonate and sulfide minerals.
As geothermal fluids rise through the crust, the pressure decrease allowsthe single-phase fluid to separate into two phases: steam and water. This“boiling” process usually occurs at a shallow depth, but can occur whereverthere is a sudden decrease in pressure due to rock fracture or fissure. Thesurface features in areas of geothermal activity can be grouped into two main

4. Geothermal Arsenic 105
types, on the basis of their relationship to the rising geothermal fluids (Fig.2).
Hot water springs, rich in chloride and silica and with a near-neutral pH,represent direct discharge of the hot water phase. Steam vents and featuressuch as acidic, sulfate-rich springs are formed by the interaction of the steamphase with shallow aquifer waters, which leads to precipitation andsublimation of elemental sulfur, and subsequent microbial oxidation tosulfuric acid. The intense argillic alteration of the host rock associated withthese more corrosive fluids can lead to an unstable ground surface, and theformation of bubbling “mudpools” where alteration has rendered the hostrock down to a slurry of clay minerals (e.g., Shoen et al., 1974). Surfacefeatures of intermediate chemistry can also occur. Geysers and carbonate-rich springs are also hot water discharges, for example, but include steam-heating and steam- phase mixing respectively.
Development of a geothermal field for power generations tends toincrease the rate and volume of geothermal fluids reaching the surface. Thereservoir fluid is intercepted by drilling and brought to the surface underpressure where it is “flashed” to a desirable temperature to generate thesteam to run steam turbines. The extent of steam and water separation(boiling) can be artificially manipulated to maximise plant efficiency. The

106 Chapter 4
water phase formed at this separation becomes a waste product, althoughfurther heat can sometimes be extracted. This wastewater often has highercontaminant concentrations than analogous natural hot spring water becausethe processes that remove or immobilise contaminants in natural geothermalfeatures, such as the precipitation of mineral-rich sinters, have been by-passed. Disposal of these wastewaters can be problematic. At most moderngeothermal power stations, they are re-injected into the field. However, atsome older fields such as the Wairakei Geothermal Field in New Zealand(Fig. 1b), these waters are still discharged into surface drainage systems.
2.2 The source of As in geothermal fluids
The presence of As in geothermal fluids has been known since the mid-century. Lefort reported traces of As in acid waters in the crater of
Popocatepetl volcano in Mexico in 1863 (Clarke, 1924). The firstmeasurements of As in hot springs and geysers of Yellowstone NationalPark were reported by Gooch and Whitfield (1888). Yellowstone NationalPark constitutes one of the largest geothermal systems in the world and hasbeen intensely studied, particularly over the last 40 years. Arsenicconcentrations in the thermal features of this field generally range from <0.1mg/kg to 10 mg/kg, a range that is observed in most active geothermal fields(Table 1). Notable exceptions include the geothermal fields in Iceland andHawaii where As concentrations of <0.10 mg/kg are consistently reported(Arnorsson and Linvall, 2001; Gudmundsson and Arnorsson, in press; D.Thomas, pers. comm.). These low As levels are attributed to the prevalenceof fresh basaltic host rocks, low in arsenic, in the reservoirs of the respectivegeothermal fields. At the other extreme, As concentrations of >20 mg/kg arenot uncommon in geothermal well fluids (Table 1). Geothermal fluid Asconcentrations are therefore usually three orders of magnitude greater thanthose in uncontaminated surface and ground waters.
2.2.1 Arsenic from host rock leaching
In the hot water-rock leaching experiments of Ellis and Mahon (1964;1967), appreciable quantities of As were leached from unmineralisedandesite yielding As concentrations of 1.3 mg/kg in the leachate.Subsequent experimental leaching of greywacke with hot water alsoindicated significant leaching of As, together with Sb, Se and S, attemperatures less than those in many geothermal fields (Ewers and Keays,1977). On this basis, it can be assumed that neither magmatic fluid input, nor
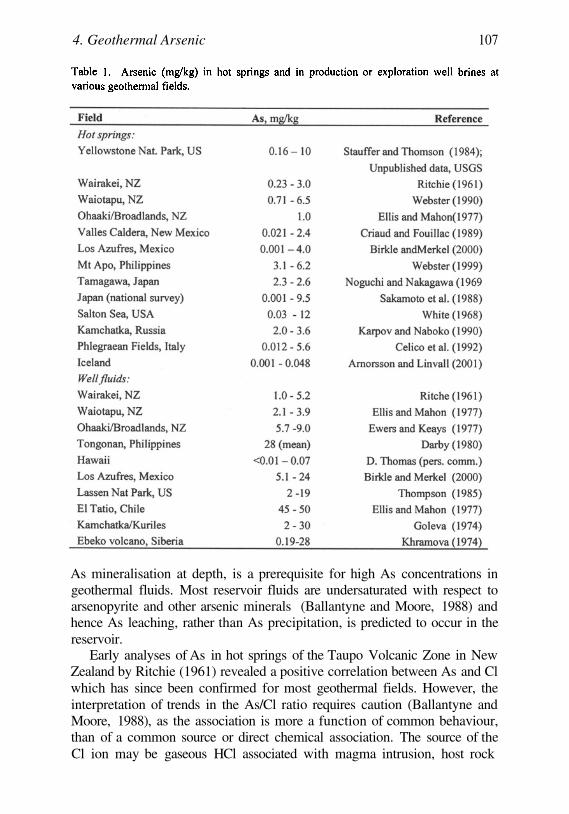
4. Geothermal Arsenic 107
As mineralisation at depth, is a prerequisite for high As concentrations ingeothermal fluids. Most reservoir fluids are undersaturated with respect toarsenopyrite and other arsenic minerals (Ballantyne and Moore, 1988) andhence As leaching, rather than As precipitation, is predicted to occur in thereservoir.
Early analyses of As in hot springs of the Taupo Volcanic Zone in NewZealand by Ritchie (1961) revealed a positive correlation between As and Clwhich has since been confirmed for most geothermal fields. However, theinterpretation of trends in the As/Cl ratio requires caution (Ballantyne andMoore, 1988), as the association is more a function of common behaviour,than of a common source or direct chemical association. The source of theCl ion may be gaseous HCl associated with magma intrusion, host rock

108 Chapter 4
leaching or seawater, whereas As is derived mainly by host rock leaching.However, both elements remain in the fluid phase during sub-surface boilingand phase separation. Consequently, As concentrations are invariably higherin the neutral pH-chloride hot springs than in the acid-sulfate features.Likewise during the separation of steam and bore water in geothermal powergeneration, As is retained in the waste bore water. This high As content isone of the main problems in the disposal of this water.
The As/Cl ratio can be used as a tool to trace the effects of geothermalfluid dilution, concentration or mixing within a geothermal field. InYellowstone National Park, for example, Stauffer and Thompson (1984)showed that the ratio could be used to identify simple mixing trends indifferent geyser basins. Many thermal waters mix with cool meteoric groundwaters on their way to the surface and show linear trends of As vs Cl with adilute end-member having As and Cl concentrations of ~0. A more recentstudy of As vs Cl concentrations in Yellowstone National Park thermalwaters is shown in Figure 3a-c (Nordstrom et al., 2001). Linear mixingtrends were identified in at least two pools; Cinder Pool and Cistern Springin Norris Geyser Basin (Fig. 3a). Cistern Spring was recognised by Fournieret al. (1986; 1992) as a spring that was very sensitive to mixing. The mixingbehaviour is caused by changes in subsurface flow patterns followingclimatic or seasonal changes in weather.
Other thermal waters from around Norris and Upper Geyser Basin tend tolie along the mixing trends defined by extensions of the Cinder Pool andCistern Spring mixing lines (Fig. 3b). This suggests that the solutes had asimilar source but that the Norris waters had undergone adiabatic cooling(boiling) which effectively increased the solute concentrations along sub-horizontal flow paths. Fournier et al. (1986) estimated that the Cl content ofthe deep thermal reservoir(s) at Yellowstone is about 400 mg/L, so thatconcentrations greater than this must reflect a concentration mechanism suchas boiling. Other conservative solutes also follow this trend. These watershave subsequently mixed with dilute shallow ground waters as they madetheir way to the surface.
A more general survey of Yellowstone thermal waters (Fig. 3c) showsthat many springs are enriched in As relative to Cl. Stauffer and Thompson(1984) showed a direct relationship between high concentrations and ahigh As/Cl ratio. A fluid with high concentrations of oxyanions at depth,especially carbonate ions, will tend to react more rapidly with the host rocks,hydrolysing and solubilising other oxyanions such as arsenite. Nordstrom etal. (2001) also provide evidence for localized enrichment of As relative to Clthrough accumulation of arsenic in precipitates near the surface or throughdynamic geyser activity.

4. Geothermal Arsenic 109
110 Chapter 4
3. SPECIATION OF ARSENIC IN GEOTHERMALFLUIDS
3.1 Dissolved As
The chemical behaviour of As in sulfide-rich fluids has been the subjectof considerable, and ongoing, debate as there are several major obstacles tothe accurate prediction of As speciation. In part, this reflects the lack of acomplete thermodynamic database for As species. Stability constants for ionpairs and complexes between the As oxyanions and polyvalent cations arefew and limited in applicability (Nordstrom, 2000). Also, polymerisation ofarsenite, arsenate and thioarsenite complexes in high As or high sulphursolutions appears likely, but is largely unconfirmed. These reactions couldsignificantly complicate As speciation. However, reliable thermodynamicdata are available for some As species, and these can be used to interpret Asbehaviour in many geothermal systems and surface water environments, aslong as the limitations are recognized.
3.1.1 Low sulfide, reduced fluids
Heinrich and Eadington (1986) and Ballantyne and Moore (1988) notedthat, from thermodynamic considerations, As was more likely to betransported in most hydrothermal solutions as arsenious acidrather than as a thio complex. is considered to be the product ofboth As oxide and orpiment dissolution in reduced fluids atacid to neutral pH, over a wide range of temperature conditions (Eary, 1992;Ivakin et al., 1979; Mironova et al., 1984; Pokrovski et al., 1996). Orpimentsolubility, as given by the following reaction:
increases with temperature, to at least 300°C (Pokrovski et al., 1996;Webster, 1990; see Figure 4a). The solubility of orpiment is independent ofpH under acidic, or acid-neutral pH conditions, but increases with furtherincrease in pH. Note that the orpiment solubilities shown in Figure 4 assumea constant sulfide concentration, and do not take into account additionalsulfide released from the orpiment. Once this additional contributionbecomes significant, orpiment solubility will decrease (refer Section 3.1.2).Polymerisation has been observed using Raman spectroscopy (Pokrovski et

4. Geothermal Arsenic 111
al., 1996), and polymer configuration and stability has been calculated(Tossell, 1997). However, polymerisation is predicted to occur only at veryhigh As concentrations (>1mol/kg; Pokrovski et al., 1996) and theseconditions are unlikely to exist in geothermal fluids .
3.1.2 High sulfide, reduced fluids
In sulfide-rich hydrothermal solutions, orpiment solubility as isinhibited but solubility as thioarsenite complexes increases. The thioarsenitesare a group of covalently bonded arsenic-sulfide complexes that may or maynot include oxygen. Reactions between arsenate ions and dissolved sulfide,for example, can result in the successive replacement of oxygen with sulfide(Pauling, 1970). However, the exact nature of the thio-complexes remainscontroversial (Helz et al., 1995; Wood et al., 1998). It was evident 40 yrsago that a simple stoichiometry and structure was likely to beunrealistic (Angeli and Souchay, 1960). A trimeric configurationwas proposed at that time and has since attracted support (Eary, 1992; Helzet al., 1995; Spycher and Reed, 1989a; Vorobeva et al., 1977; Webster,1990). Dimer species have also been proposed (Mironova and Zotov, 1980;Mironova et al., 1990), but there has been little recent support for otherearlier proposed species such as and Helz etal. (1995) suggest that the monomer may occur in undersaturated solutions,while the trimer is formed in the saturated solutions present in mostexperimental solubility studies and As-precipitating geothermal systems.Wood et al. (1998) provided Raman spectroscopic evidence for thesimultaneous existence of more than one species.
Assuming a trimer structure occurs in a saturated geothermal fluid,orpiment solubility via the following reaction:
increases with pH and sulfide concentration (Fig. 4b), but is not greatlyaffected by temperature changes below 200°C (Spycher and Reed, 1989a;Webster, 1990; Weissberg et al., 1966).
3.1.3 Redox state
The oxidation of arsenious acid to arsenate or isthermodynamically favoured when the redox conditions in low sulfide fluidsbecome sufficiently oxidizing. Oxidation occurs when a rising geothermal

112 Chapter 4
fluid is exposed to atmospheric oxygen or mixed with another oxidizingfluid, such as a shallow ground water. Arsenate ions appear to be rapidlyformed in situ in hot springs and their surface drainage systems. Of the manygeothermal features in Yellowstone National Park, predominates inmost hot springs and geysers discharging directly from the reservoir (Ball etal., 1998; Nordstrom et al., 2001). The geothermal reservoir fluids are

4. Geothermal Arsenic 113
reduced with respect to the redox couple as expected. Oxidation tohowever, occurs very rapidly in hot spring overflows and receiving
streams and rivers. A few hot springs at Yellowstone contain mostlywhich is likely to be related to fluid flow rates and/or mixing withoxygenated ground waters. Very few Yellowstone geothermal waters havebeen found with similar proportions of and unless they areoverflow drainages in the process of oxidizing.
These results are similar to distributions reported for hot springson the island of Dominica (Carribean), in the Valles Caldera (New Mexico)and from the Massive Central in France (Criaud and Fouillac, 1989). In eachcase, hot springs formed from reservoir fluids contained mainlywhereas acid-sulfate and bicarbonate features were more enriched in Itis worth noting here that reported concentrations may beunderestimated if the sample has not been appropriately preserved prior toanalysis. On site sample filtration through a (or finer) membrane toremove bacteria and cold storage in an air-tight container are recommended(Hall et al., 1999). Acidification with or HCl to pH 1.5- 2.0 is oftenrecommended, as this inhibits oxidation of by chemical oxidants such as
However, in some waters, acidification has been observed to changeAs speciation slightly, reducing to (Hall et al., 1999, Websterunpublished data.) Arsenic oxidation in the stream draining Champagne Poolat Waiotapu geothermal field in the Taupo Volcanic Zone, and in an open,concrete drain conducting geothermal waste water across the Wairakeigeothermal field suggests a short half-life of minutes for in situ oxidation(Finlayson and Webster, 1989). More importantly, however, geothermalwater collected immediately after steam separation, and before entering thedrain, does not show a similar rate of As oxidation. Instead there is noappreciable oxidation in the wastewater (collected directly into a sterileglass bottle), even if bubbled with air for several hours.
Such rapid oxidation kinetics appear likely to be catalysed bymicrobial activity, although the mechanisms by which bacteria couldfacilitate arsenite oxidation at temperatures >50°C are not well studied.However, as bacteria are clearly implicated in oxidation in geothermalsystems, progress is being made in the identification of the thermophilicbacteria that can oxidise (e.g., Gihring et al., 2001; Langner et al.,2001; Mielke et al., 2000). The ability of and thiosulphate toreduce to is well known (e.g., Cherry et al., 1979; DeKonnick,1909; Forbes et al., 1922; Rochette et al., 2000), hence geothermal waterscontaining sulfide or thiosulphate will preserve arsenic as until thereduced sulfur is oxidised or volatilised (Nordstrom et al., 2001).
Further evidence of a microbiological influence on As chemistry mayexist in the recent, intriguing observation of slight diurnal variations in the

114 Chapter 4
(total) As concentrations of various hot springs at the Waiotapu geothermalfield (James Pope, pers. comm).
3.2 Arsenic deposition from geothermal fluids
Arsenic enrichment in geothermal systems occurs predominantly near thesurface, along with other “epithermal” elements such as Sb, Au and Hg(White, 1981). In contrast, base metals such as Ag, Cu, Pb, Zn will bedeposited at greater depth. A typical example of this type of zoning occurs inthe Ohaaki geothermal system (formerly known as Broadlands) in the TaupoVolcanic Zone of New Zealand (Simmons and Browne, 2000). Here, Asconcentrations in drill core from BR 16 increased from 1.2-1.9 mg/kg at 1.5km depth, to 19-22 mg/kg near the surface (Ewers and Keays, 1977). Atdepth, As was mainly concentrated in the pyrite, as has been noted at otherfields (Ballantyne and Moore, 1988). Arsenic minerals such as arsenopyrite(FeAsS) appear to be uncommon in the rocks of the geothermal reservoiritself. However, a range of As minerals is precipitated from geothermalsurface features such as hot springs (refer Section 3.2).
It has been suggested that the observed metal zoning may simply reflectdifferent precipitation mechanisms for the base metals complexed bychloride and the epithermal metals complexed by sulfide (Drummond andOhmoto, 1985; Weissberg, 1969; White, 1981). If transported as a thio-complex, As would be expected to precipitate in response to decreasingtemperature and boiling loss) in permeable zones (Ewers, 1977).However, as noted above, As is more probably transported as inhydrothermal solutions (Ballantyne and Moore, 1988; Heinrich andEadington, 1986; Spycher and Reed, 1989a). Spycher and Reed (1989b)argue that metal zonation is due to a three-step process of fluid boiling, gas-phase transport and acid reactions with metal-bearing waters. Base metalprecipitation occurs in response to boiling and the pH increase which occurswhen gas is driven off. During boiling, As remains soluble as anoxyanion under the higher pH and lower sulfide concentrations present in thefluid. Precipitation of orpiment then occurs in response to the acidificationof hot spring waters with acid-sulfate waters (Spycher and Reed, 1989b),subaerial cooling of the fluid or increased concentrations (Webster,1990).
This scenario is consistent with the relationships discussed in Section3.1.1 and shown in Figure 4, as rapid oxidation of or would reducethe concentrations of these components and thereby increase orpimentsolubility. Note that only if the fluids boiled dry would As be taken into the

4. Geothermal Arsenic 115
gas phase. Vapour deposition of realgar could occur when the temperaturedecreases below 130°C (Spycher and Reed, 1989b).
3.3 Arsenic in hot spring deposits and scales
The As contents of coloured precipitates forming at the periphery of hotsprings, hot pool and geysers can be very high (Table 2). Analyses of redprecipitates around the periphery of Champagne Pool in the Waiotapugeothermal field (Fig. 5a), for example, revealed an amorphous depositcontaining up to 2wt% As, as well as sulfides of Hg, Sb, Tl and ore-gradeAu and Ag concentrations (Weissberg, 1969). Similar red As-richprecipitates have been reported from Steamboat Springs in Colorado (White,1967), Roosevelt Hot Springs in Utah (J. Moore, pers. comm.), and Beppuhot pool in Japan (Koga, 1961).
The mineralogy of these coloured precipitates can be difficult todetermine, given the amorphous nature of most recent deposits. Useful As:Sratios are obscured by other sulphide-bearing minerals and sometimes bynative sulphur if there is a steam component to the hot spring. Nor is colouralways a definitive indicator. For example, amorphous realgar is a bright redcolour, but so is stibnite and cinnabar (HgS). Orpiment is a yellow-green colour, reminiscent of native sulfur. However, in the absence of highlevels of antimony and mercury, As–rich precipitates in hot springs arecommonly yellow orpiment (Fig. 5b). Thermodynamic calculations providesupport for orpiment precipitation in hot spring environments. Hot springson the Waiotapu and Rotokawa geothermal fields in New Zealand, forexample, are saturated or slightly over-saturated with respect to orpiment(Webster, 1990). Also, orpiment precipitation has been observed wheresmall steam vents occur in the bed of hot spring-fed streams atthese fields.
Realgar does not appear to be actively depositing in hot springs atWaiotapu but does occur as coatings and veins in the altered rocks of thegeothermal field. This supports the hypothesis of different depositionmechanisms for realgar and orpiment, as proposed by Spycher and Reed(1989b). It has also been proposed that a transient As disulfide solid phaseoccurs in hot spring environments (Noguchi and Nakagawa, 1969), but ithas not been isolated. Scorodite has been reported from theOsorezan geothermal area in Japan (Aoki and Yui, 1981). Native As hasbeen reported from low temperature hydrothermal deposits (eg., Sergeyevaet al., 1969) but is rare. Other As sulfides, such as dimorphite andduranusite have not been reported from geothermal systems.

116 Chapter 4
The scales which form in pipes and drains of a developed field can also berich in As (Table 2). Scales rich in As and Au deposit on back pressureplates at the Ohaaki geothermal field, for example, due to the sudden drop inpressure and consequent boiling of the fluid (Simmons and Browne, 2000).The subaerial scale forming in the Wairakei borefield drain demonstrates aclose positive correlation between As and Fe content, with As depositionmainly due to adsorption on Fe-oxide (Finlayson and Webster, 1989).
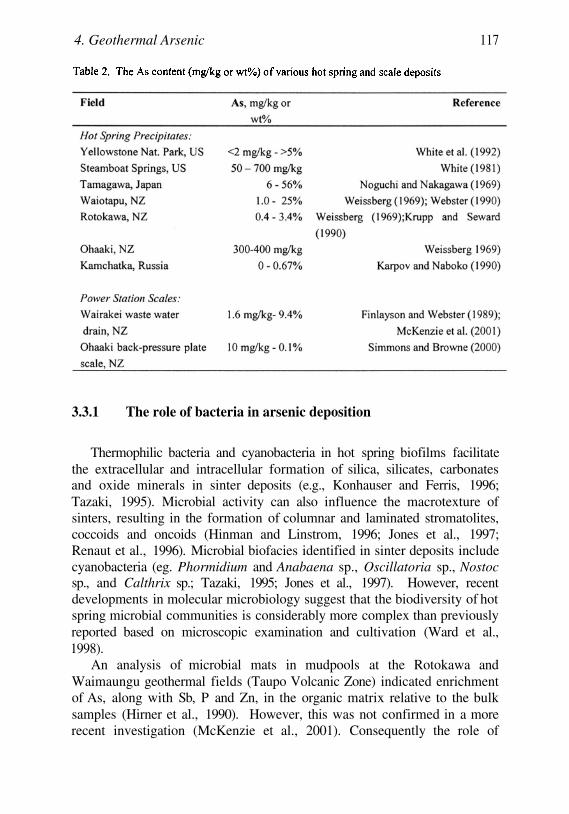
4. Geothermal Arsenic 117
3.3.1 The role of bacteria in arsenic deposition
Thermophilic bacteria and cyanobacteria in hot spring biofilms facilitatethe extracellular and intracellular formation of silica, silicates, carbonatesand oxide minerals in sinter deposits (e.g., Konhauser and Ferris, 1996;Tazaki, 1995). Microbial activity can also influence the macrotexture ofsinters, resulting in the formation of columnar and laminated stromatolites,coccoids and oncoids (Hinman and Linstrom, 1996; Jones et al., 1997;Renaut et al., 1996). Microbial biofacies identified in sinter deposits includecyanobacteria (eg. Phormidium and Anabaena sp., Oscillatoria sp., Nostocsp., and Calthrix sp.; Tazaki, 1995; Jones et al., 1997). However, recentdevelopments in molecular microbiology suggest that the biodiversity of hotspring microbial communities is considerably more complex than previouslyreported based on microscopic examination and cultivation (Ward et al.,1998).
An analysis of microbial mats in mudpools at the Rotokawa andWaimaungu geothermal fields (Taupo Volcanic Zone) indicated enrichmentof As, along with Sb, P and Zn, in the organic matrix relative to the bulksamples (Hirner et al., 1990). However, this was not confirmed in a morerecent investigation (McKenzie et al., 2001). Consequently the role of
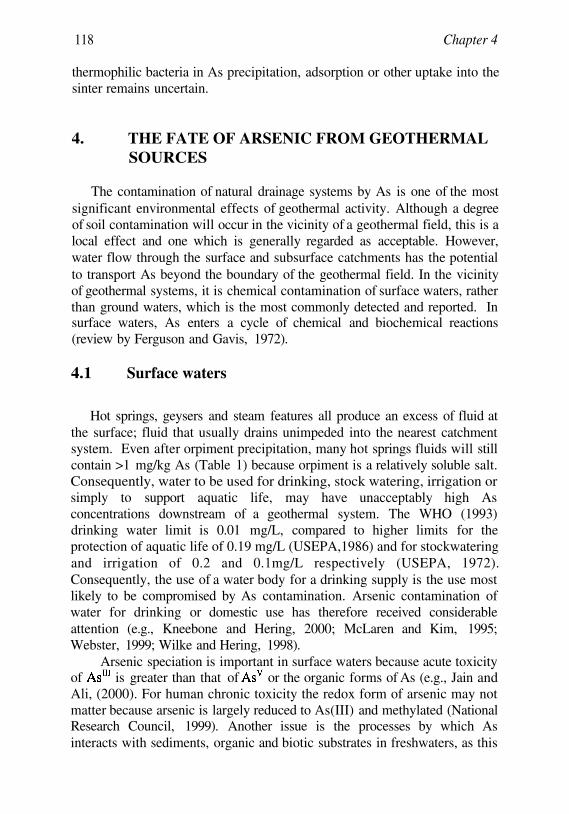
118 Chapter 4
thermophilic bacteria in As precipitation, adsorption or other uptake into thesinter remains uncertain.
4. THE FATE OF ARSENIC FROM GEOTHERMALSOURCES
The contamination of natural drainage systems by As is one of the mostsignificant environmental effects of geothermal activity. Although a degreeof soil contamination will occur in the vicinity of a geothermal field, this is alocal effect and one which is generally regarded as acceptable. However,water flow through the surface and subsurface catchments has the potentialto transport As beyond the boundary of the geothermal field. In the vicinityof geothermal systems, it is chemical contamination of surface waters, ratherthan ground waters, which is the most commonly detected and reported. Insurface waters, As enters a cycle of chemical and biochemical reactions(review by Ferguson and Gavis, 1972).
4.1 Surface waters
Hot springs, geysers and steam features all produce an excess of fluid atthe surface; fluid that usually drains unimpeded into the nearest catchmentsystem. Even after orpiment precipitation, many hot springs fluids will stillcontain >1 mg/kg As (Table 1) because orpiment is a relatively soluble salt.Consequently, water to be used for drinking, stock watering, irrigation orsimply to support aquatic life, may have unacceptably high Asconcentrations downstream of a geothermal system. The WHO (1993)drinking water limit is 0.01 mg/L, compared to higher limits for theprotection of aquatic life of 0.19 mg/L (USEPA,1986) and for stockwateringand irrigation of 0.2 and 0.1mg/L respectively (USEPA, 1972).Consequently, the use of a water body for a drinking supply is the use mostlikely to be compromised by As contamination. Arsenic contamination ofwater for drinking or domestic use has therefore received considerableattention (e.g., Kneebone and Hering, 2000; McLaren and Kim, 1995;Webster, 1999; Wilke and Hering, 1998).
Arsenic speciation is important in surface waters because acute toxicityof is greater than that of or the organic forms of As (e.g., Jain andAli, (2000). For human chronic toxicity the redox form of arsenic may notmatter because arsenic is largely reduced to As(III) and methylated (NationalResearch Council, 1999). Another issue is the processes by which Asinteracts with sediments, organic and biotic substrates in freshwaters, as this

4. Geothermal Arsenic 119
affects both As concentration and speciation. Studies of As in the riversdraining the two geothermal systems specifically featured in this review:Yellowstone National Park and the Taupo Volcanic Zone, have shown thatAs is principally transported in dissolved form (Nimick et al., 1998;Webster-Brown, 2000). “Dissolved” in this case is defined as passingthrough a filter membrane. On a macro-scale, As also appears tobehave conservatively downstream of these geothermal systems, with littlechange in As mass flux down the river (Nimick et al., 1998) or in lakes andestuaries (Timperley and Huser, 1996; Webster-Brown, 2000). Studies ofgeothermal-derived As in other freshwater systems support this observation(e.g., Deely and Sheppard, 1996; Kneebone and Hering, 2000).
4.1.1 Dissolved Arsenic Speciation
Assuming thermodynamic equilibria prevail, As released into anoxygenated surface water as should undergo immediate oxidation toarsenate ions: or at pH > 6.9, Arsenate certainlypredominates in the Waikato River (Aggett and Aspell, 1978; McLaren andKim, 1995) and in streams and rivers receiving hot spring discharge fromYellowstone National Park (Ball et al., 1998; Nimick et al., 1998; Nordstromet al., 2001). This is also the case in rivers draining the Mt. Apo geothermalfield in the Philippines (Webster, 1999), and in Hot Creek which drainsgeothermal activity in the Owens River catchment, Sierra Nevada, US(Wilke and Hering, 1998).
A half-life of ~20 mins for oxidation to was calculated for As inHot Creek and attributed to microbial catalysis (Wilke and Hering, 1998).Langner et al. (2001) derived a similar half-life for As oxidation in an acidhot spring in Yellowstone National Park. Gihring et al. (2001) foundThermus aquaticus and Thermus thermophilus in a high pH (8.8) hot springin Yellowstone Park that effectively oxidize arsenite at about the same rateas in acid hot springs. Tantalus Creek, which drains most of the thermalwaters from Norris Geyser Basin and empties them into the Gibbon River inYellowstone National Park, contains about 1.7 mg/L arsenic of which atleast 97% is (USGS, unpublished data). These results attest to theefficiency of microbial arsenic oxidation in thermal overflow waters.
In river waters, as in geothermal features, the role of bacteria in theoxidation process may be very important. Wilkie and Hering (1998) notedthat As oxidation in Hot Creek did not occur if the river water was filteredunder sterile conditions or after an antibiotic had been added. They surmisedthat bacteria attached to submerged plants were mediating oxidation.Bacteria capable of oxidation have been isolated, and some of the most

120 Chapter 4
common are Pseudomonas sp. (Cullen and Reimer, 1989). Other bacteriagenera that have been found to oxidize include Xanthomonas andAcromobacter (Ehrlich, 1996). may be predominant, but it is notexclusive. In the Waikato River, for example, high concentrations ofdo appear periodically. Sudden, short-lived pulses of and associatedhigher concentrations of total As, have been attributed to the annual, butunpredictable, overturn of the deep, stratified hydroelectric lakes (Aggett andKreigman, 1988). Interstitial sediment waters in the anoxic depths of thelakes are rich in and when thermally-driven overturn occurs, thesewaters are released downstream. However, a broader seasonal variation inAs in the Waikato has also been identified (McLaren and Kim, 1995; seeFig. 6) and attributed to seasonal activity of arsenate-reducing bacteria.Various bacteria and strains capable of reduction have been identified(e.g., Macy et al., 2000; Stolz and Oremland, 1999; Switzer et al., 1998)including Anabaena oscillaroides which has been isolated from the WaikatoRiver (Freeman, 1985).
The third group of As species in natural freshwaters are the methylatedarsenic species. Arsenic can be methylated by bacteria, algae and fungi toform gaseous mono-, di- and tri-methyl arsine (Baker et al., 1983;Cullen and Reimer, 1989; Maeda et al., 1987), which dissolve in waterforming the methylarsenic oxyacids, monomethylarsonic acid (MMAA) and

4. Geothermal Arsenic 121
dimethyldarsenic acid (DMAA). Organic As complexes are estimated tomake up <20% of the As in the Madison River draining YellowstoneNational Park (Nimick et al., 1998), which is consistent with an estimate of10-20% of total As for freshwater environments in general (Cullen andReimer, 1989). DMAA has been reported as the dominant form of As insummer in a eutrophic lake in Japan (Sohrin et al., 1997), although thesource of this As is unclear. Unlike methyl-mercury compounds, methylatedarsenic does not appear to biomagnify in the food chain (Isensee et al., 1973;Maeda et al., 1992).
4.1.2 Transport & removal from the water column
A small portion of the As released into a river from a geothermal systemwill become part of the biochemical cycle, interacting with plants, biota,suspended material and bed sediments. In the Waikato River, for example,7-8% of the As entering the river is being adsorbed onto the sediments, andsediment As concentrations as high as 1000 mg/kg have previously beenreported from the deeper hydroelectric lakes (Aggett and Aspell, 1980).Suspended sediment As concentrations provide a better indication of thedirect association between As and sediments. Concentrations of 0-60 mg/kgAs in suspended sediments are reported from the Missouri River drainingYellowstone National Park (Nimick et al., 1998), while higherconcentrations of 61-1790 mg/kg are found in the Waikato River drainingTaupo Volcanic Zone (Webster-Brown et al., 2000). The higher Asconcentrations in suspended sediments of the Waikato River are a functionof their proximity to geothermal activity. Where the Waikato River passesthrough the area of geothermal activity (Fig. 1b), As concentrations in thesilica-rich suspended sediment are limited only by the adsorption capacity ofthe suspended sediment, which is ~1500-1800 mg/kg As (Webster-Brown,2000).
A strong association between As and Fe-oxides in river and lakesediments has been reported (eg., Aggett and Roberts, 1986; Belzile andTessier, 1990; Brannon and Patrick, 1987). This association is attributed tothe adsorption of arsenate onto the Fe-oxide coatings on sediment particles.Arsenite ion, although also adsorbed, is not as rapidly or completelyadsorbed onto Fe-oxide as arsenate (Belzile and Tessier, 1990; Pierce andMoore, 1982; Swedlund and Webster, 1999). This observation hasimportant implications for the re-release of adsorbed As under anoxicconditions. Microbial reduction of arsenate can occur even when As isbound to Fe-oxide (Langner and Inskeep, 2000), and reduction ormethylation of sedimentary arsenate under anoxic conditions is the principalmechanism for re-release of As into the water column (Aggett and

122 Chapter 4
Kreigman, 1988; Brannon and Patrick, 1987; Dowdle et al., 1996). Theseasonal variation in total As concentration in the Waikato River (Fig. 6) hasbeen attributed to the seasonal activity of bacteria (McLarenand Kim, 1995), as there is no evidence that seasonal changes in watertemperature affects adsorption onto sediments (Webster-Brown, 2000).
The life-cycle of aquatic plants may also affect the concentrations of Asin the water column (Kuwabara et al., 1990). The uptake of As by aquaticmacrophytes (plants) has been reported in rivers contaminated by geothermalwaters. There is often a significant degree of As enrichment relative to thewater column. Concentration factors of up to 20,000 times, depending on theplant species, have been reported for the Waikato River where the plants areestimated to take up 3-4% of the As available (Aggett and Aspell, 1980;Reay, 1972). Plant uptake of As is generally considered to be due to thechemical and behavioural similarity of arsenate and phosphate ions, the latterbeing an important nutrient for plant growth. High phosphate concentrationscan inhibit As uptake by plants, as well as As adsorption on Fe- oxidesurfaces (Kuwabara et al., 1990; Reuther, 1992).
Finally, As interacts with macrobiota either directly or via the food chain.As well as the issue of toxicity, there is the potential problem of Asaccumulation in animal flesh. Freshwater snails in the Waikato River, forexample, were found to have 20 times the As content of snails in a controlsite (Golding et al., 1997). However, there has been little evidence thatanimals further up the food chain, such as trout, accumulate As from theWaikato River (Robinson et al., 1995).
4.2 Ground waters
Although As-rich ground waters appear to occur with alarming frequency(e.g., Del Razo et al., 1990; Frost et al., 1993; other chapters in this volume)other contributions in this volume), there are relatively few examples wherethe As is clearly related to geothermal activity. Geothermal fluids arethemselves effectively deeply circulating ground waters. The thermallydriven ascension to the surface limits opportunities of lateral spreading ofthese As-rich fluids at depth. Near the surface, however, contamination ofshallow aquifer systems can and does occur.
High As concentrations in ground waters of the upper Missouri Rivercatchment have been attributed to As in the thermal waters of YellowstoneNational Park (Nimick, 1994; Welch et al., 2000). Arsenic-enriched groundwaters of southwest Idaho and in the Intermontane Plateaus province are alsoconsidered to be influenced by thermal waters (Welch et al., 2000).Geothermal contamination of ground water has not yet been reported fromthe major geothermal fields of the Taupo Volcanic Zone, but it has been

4. Geothermal Arsenic 123
observed in a shallow ground water outflow to a wetland area at the southernend of Lake Taupo (Chague-Goff et al., 1999).
Elsewhere As contamination of drinking water wells in Taiwan, and theconsequent toxic effects on the human population (Chen et al., 1994), isconsidered likely to be due to mixing with geothermal fluids. High pHground waters of the Vulcano Porto field on Vulcano Island, near Sicily,have As concentrations ranging 0.6 to (Aiuppa et al., 2000).
Ground water contamination is a concern for geothermal developersbecause there are several potential pathways for aquifer contamination.These include:
i) Unintentional reinjection of spent geothermal waste water into anaquifer. This will normally occur only if the integrity of thecasing around a well is breached.
ii) Seepage from poorly-lined, or unlined, holding ponds for theretention of geothermal fluids and from pipelines, as reportedfrom Los Azufres in Mexico for example (Birkle and Merkel,1998).
iii) Burial of As-rich sludge from an As-removal waste treatmentprocess or scale from drains and pipes (e.g., Peralta et al., 1996).
The speciation and solubility controls on As in ground water are similarto the abiotic processes influencing As behaviour in surface water. Arsenicmay occur as both and with solubility controlled by adsorptiononto sediment surfaces (Welch et al., 2000). Under the higher rock:waterratio present in aquifers, clays and other silicate surfaces, as well as Fe- andMn-oxides, may act to regulate As concentrations through adsorption underappropriate pH conditions (e.g., Goldberg and Glaubig, 1988a; Manning andGoldberg, 1997). It should be noted that high sulfide concentrations mayaccompany As of geothermal origin when it enters a ground water aquifer,and this will limit As solubility through the formation of orpiment.
5. ARSENIC REMOVAL FROM GEOTHERMALFLUIDS
Clearly it is preferable to avoid the release of As from geothermalsystems into surface or ground water systems. In developed geothermalfields, reinjection of waste water into the field is commonly used to avoid

124 Chapter 4
environmental pollution and maintain reservoir pressure. In many countries,including the US, reinjection is required by law. However, where this is notthe case, reinjection is viewed as an expensive option and one which canreduce field productivity if the cooler waters find their way back into thereservoir too quickly (Brown and Bacon, 2000). Effective removal of As,and other contaminants of the “geothermal suite” from waste water prior todischarge, would enable the bore waters to be discharged or re-used withoutenvironmental damage. It may also allow valuable elements or minerals tobe extracted, offsetting the cost of treatment, which may still beeconomically viable when compared to the costs of reinjection (Brown andBacon, 2000).
Various methods for the removal of As from geothermal waste watershave been investigated at theoretical, laboratory, pilot plant and full plantscales. These include adsorption onto Fe-oxide floc and subsequentseparation by dissolved air flotation (De Carlo and Thomas, 1985; Shannonet al., 1982) and co-precipitation with lime to form an As-rich calciumsilicate (Rothbaum and Anderton, 1976). In both cases, effective removalwas achieved only after oxidation of to For Fe-oxide floctreatment, competitive adsorption of silica inhibits As adsorption,particularly that of (Swedlund and Webster, 1999), suggesting that priorremoval of silica would help optimise As removal efficiency. The use of ionselective chelating resins for removal from geothermal waters has alsobeen successfully tried (Egawa et al., 1985).
Arsenic contamination of surface or ground waters is, however, rarely a“point source” event, given the complex plumbing of most geothermalsystems and the variety of opportunities this presents for thermal andambient fluid mixing. While As removal prior to a point source waste waterdischarge will help to minimise impacts on aquatic ecosystems, particularlyAs accumulation in aquatic plants and sediments, it is unlikely to reduce Asconcentrations to a drinking water standard in regions of natural geothermalactivity. Consequently, the ability of conventional water treatment plants toremove As from drinking water supplies continues to be important. Bothalum- and Fe-oxide-based treatment systems effectively remove ifoptimised to favour As adsorption and particulate removal, but alum-basedsystems are less effective in their removal of (Hering et al., 1997;McNeill and Edwards, 1995). Figure 6 shows As removal from the WaikatoRiver using a conventional alum-floc treatment station at Hamilton City,New Zealand (McLaren and Kim, 1995). Effective removal of As isachieved, except during the summer when is also present in the watercolumn. Reverse osmosis and nanofiltration membranes have greaterpotential for efficient removal, as they do not discriminate betweenand (Waypa et al., 1997).

4. Geothermal Arsenic 125
ACKNOWLEDGEMENTS
The authors would like to thank Jim Ball, James Pope, Donald Thomasand Nick Kim for allowing us to use their data, and Kevin Brown and JoeMoore for reading and providing a constructive review of this manuscript.

This page intentionally left blank

Chapter 5
Role of Large Scale Fluid-Flow in Subsurface ArsenicEnrichment
M.B. Goldhaber1, R.C. Lee1, J.R. Hatch1, J.C. Pashin2, J. Treworgy3
1 U.S. Geological Survey, Denver CO2 Geological Survey of Alabama, Tuscaloosa AL3 Earth Science Department, Principia College, Elsayh Il
This chapter deals with the geologic controls on the distribution of arsenic inrocks. Specifically, it focuses on rare but geographically extensivepaleohydrologic events that produced widespread arsenic enrichments in theearth’s crust in the form of elevated contents of arsenic-rich (arsenian) pyrite.We summarize evidence documenting the existence of ancient large-scalehydrothermal fluid migration events in the central and eastern United Statesand discuss impacts on the arsenic content of aquifer rocks through which thefluid migrated. There are two specific geologic settings discussed. One is themidcontinent region, and the other is the Appalachian region (with a focus oncoal in the Appalachian Basin). Evidence for a hydrothermal fluid flow eventin the midcontinent comes largely from studies on the genesis of large zinc-lead deposits (the so-called Mississippi Valley-type or MVT ores) of theregion that are hosted in Paleozoic carbonate rocks. These studies demonstratethat ore-fluids for MVT deposits (brines derived from adjacent sedimentarybasins) were driven towards the craton by gravity flow during a late stage ofthe Ouachita orogeny about 270 million years ago. These warm brinesmigrated laterally for hundreds of kilometers. Arsenian pyrite was depositedalong these fluid pathways. The same aquifers that were pathways for orefluid migration are exploited today as drinking water aquifers, raising thepossibility that given conditions favorable for release of arsenic from arsenianpyrite, drinking water arsenic concentrations might become elevated. Furthereast, Paleozoic sediments of the Appalachian basin were aquifers for westwardmigrating fluids during a late phase of the Appalachian orogeny (also about270 million years ago). Coal beds were particularly favorable sites fordeposition of arsenian pyrite. In marked contrast to the midcontinent flowevent, the fluids involved in the Appalachian region were likely derived fromdeep-seated metamorphic processes and were not as saline as those in themidcontinent. We argue that in the southernmost Appalachians of Alabama,the metamorphic fluids impacting coal were related in time and composition to

128 Chapter 5
metamorphic fluids that formed arsenic-bearing gold deposits in themetamorphic rocks to the east. Pennsylvanian bituminous coals of Alabamalocally contain abundant arsenian pyrite, which also is enriched to a lesserextent in copper, selenium, molybdenum, mercury and antimony. Mining ofAlabama coal has resulted in elevated arsenic content in stream sediments, andin non-potable (saline) waters produced during coalbed methane recovery, butarsenic enrichment in drinking water supplies is apparently localized toindividual water wells. Invasion of metamorphic fluids into coal-bearingPennsylvanian rocks was widespread throughout the Appalachian basin, andarsenian pyrite occurrences are also widespread but sporadic. Large fluid flowsystems are not restricted to the examples described in detail in this chapter,and additional areas impacted by such systems are noted.
1. INTRODUCTION
Environmental impacts of arsenic can arise from either anthropogenic ornaturally occurring enrichments. In either case, the major human healthimpacts from arsenic arise from elevated drinking water (typicallygroundwater) concentrations (Anonymous, 1999). These elevatedgroundwater concentrations in turn are due to mobilization of arsenic fromrocks and sediments into groundwater (Welch et al., 2000). Examples ofsuch groundwater enrichments are numerous, and many are described in thisvolume. Given that release of arsenic from rocks governs human healthimpacts on drinking water, understanding controls on the abundance andform of arsenic in rocks is an important first step in predicting where healthproblems may arise.
The underlying hypothesis of this paper is that large-scale fluid migrationcan lead to widespread and potentially environmentally significant arsenicenrichments in rocks. Recognition that giant fluid-flow systems have existedin the past has come largely from the study of ore deposits. Thehydrothermal fluid-flow systems described below represent the ‘far field’(upstream and downstream) effects of ore-forming processes. Where suchhydrothermal fluids are focused into small areas (and other conditions aremet), ore deposits may form. When the fluids migrate laterally in aquifersfeeding the ore districts, trace amounts of the ore constituents mayprecipitate. If arsenic is one of these ore constituents, it can accumulate inthe aquifer rocks over geographically large areas, on the order of thousandsof square kilometers or more. The processes described in this paper haveproduced elevated background levels of arsenic in rocks. Not all of thearsenic accumulations described are associated with elevated concentrationsin groundwater or human health problems, but they have that potential givenappropriate geochemical conditions for arsenic solubility in the groundwater.

5. Role of Large Scale Fluid-Flow in Subsurface Arsenic Enrichment 129
It is critical to recognize that the same aquifers that functioned astransport paths for the ore fluids in the geologic past, can (and commonlydo) serve as drinking-water aquifers in the modern environment. Animportant example of this coincidence of paleoaquifers with moderndrinking-water aquifers occurs in the U.S. midcontinent (areas 1 and 2 inFig. 1), the focus of the first part of this paper. In this part we describe thesubcontinental-scale brine migration associated with the formation of theMississippi Valley Type (MVT) lead-zinc ores in this region. Some localoccurrences of elevated arsenic in groundwater of the U.S. midcontinent arealmost certainly related to this association. Considerable research effort hasgone into documenting in this region the timing, geographic extent, andimpact of MVT ore formation on enrichments of various elements(Goldhaber et al., 1995; Leach and Rowan, 1986; Leach and Sangster, 1993;Viets and Leach, 1990). We draw on this work to form a conceptual basis ofarsenic enrichment within the context of paleo-fluid migration events.

130 Chapter 5
The second part of the paper addresses arsenic enrichment in coal of theAppalachian Basin and adjacent Appalachian Mountains in the easternUnited States (areas 3 and 4 in Fig. 1). In this regional setting, elevatedcrustal arsenic concentrations in rocks are well documented, but processesassociated with the original introduction of arsenic into coal andmetamorphic rocks have not been systematically studied. However, theAppalachian region is very important because here both natural weatheringand mining can potentially lead to dispersion of arsenic into the localenvironment.
Although we focus primarily on the mid-continental and eastern U.S., itshould be noted that areas that have been affected by tectonically drivenfluid-flow systems are found worldwide. Therefore, many of the conceptsand characteristics of arsenic distribution developed in this paper areextendible to other settings, and examples are given at the end of the chapter.
LARGE-SCALE BRINE MIGRATION IN THEMIDCONTINENT AND EAST-CENTRALREGIONS OF THE U.S.
Introduction
Recent studies to be summarized below have demonstrated that MVTzinc and lead ores of the southern midcontinent region of the U.S (Fig. 2),formed by long-distance migration of brine fluids from adjacent deep basinsonto the continental craton. This fluid migration event is of interest not onlyin the context of ore formation but because, as documented below, tracemineralization deposited along migration paths of the ore fluids can haveelevated arsenic contents. Below, we summarize evidence for the scale ofthis brine migration and describe its impact on arsenic concentrations in bothrocks and waters of the region.
The discussion is divided into two parts: (1) the Ozark region whichincludes the Tri-State district, Southeast Missouri lead belts, NorthernArkansas district, Central Missouri district and (2) the east-central regionwhich includes the Illinois-Kentucky fluorspar district, Upper MississippiValley Zn, Pb District, and central Tennessee Zn district. The reason formaking this distinction is that the Ozark and east-central regions aredifferentiated on the basis of Pb isotope systematics (Goldhaber et al., 1995)and ore paragenesis (Hayes et al., 1997). These distinctions imply distinct orlargely distinct fluid flow paths.
2.
2.1

5. Role of Large Scale Fluid-Flow in Subsurface Arsenic Enrichment 131
The Ozark Region
The sedimentary section of the U.S. southern midcontinent consists inlarge part of Paleozoic platform carbonate rocks interbedded with shale andsubordinate sandstone. As documented below, a large volume of thePaleozoic carbonate rocks in this region is enriched in arsenic, as well aslead, zinc, copper, cobalt, molybdenum, and nickel compared to surroundingcarbonate strata (Erickson et al., 1981; Lee and Goldhaber, 2001). In planview this trace-mineralized area extends over thousands of squarekilometers. The widespread metal enrichment process was related to theformation of much more spatially localized ore districts. These districtsconsist of economic concentrations of the ore elements zinc and lead, and toa lesser extent copper, cobalt, and barium that occur in the platform
2.2

132 Chapter 5
carbonate rocks. Rocks from Late Cambrian through Mississippian age hostthe MVT ore districts several of which are world-class in size (Fig. 2). Forexample, the lead, zinc, (copper, cobalt) ores of the southeast Missouri leadbelts cover an area of approximately 2,000 square kilometers, with totalmetal production exceeding 20 million metric tones (Ohle, 1997).Collectively, the MVT ore deposits of southeast Missouri form the largestknown concentration of lead in the crust of the Earth. Similarly, the Tri-State district of Missouri, Oklahoma, and Kansas covers an area ofapproximately 1,800 square kilometers and was one of the world’s great zincproducing districts.
Despite the extent of ore-grade mineralization and size of MVT districts,the original mineralizing brine fluids are thought to have contained only lowconcentrations of metals--generally in the ppm to at most hundreds of ppmrange (Anderson, 1983; Barnes, 1983). Because the brine fluids containedlow metal contents, the formation of very large MVT ore bodies requires thatenormous volumes of mineralizing fluids passed through the rocks of theregion (Ohle, 1990). This requirement, coupled with the position of manydeposits along the margins of large sedimentary basins, and the compositionsof the ore fluids that are similar to those of sedimentary basin brines, has ledto the conclusion that the elemental enrichments formed from fluids thatwere derived from adjacent sedimentary basins (Hanor, 1997).
It is now established that the genesis of MVT ores in the Ozark regionwas closely related in time (Brannon et al., 1997; Symons et al., 1997). Fig.2 shows the ages of ore formation as determined by a variety of techniques.The ages all fall in the late Paleozoic (range 251-286 Ma), and most span aneven narrower range. Late Paleozoic time represents the terminal phase ofassembly of the supercontinent Pangea (Frazier and Schwimmer, 1987;Scotese et al., 1979). This was a time of massive orogeny that resulted information of the Appalachian and Ouachita mountain belts. The prevailinghypothesis for the origin of MVT ores involves hydrothermal fluids thatwere driven topographically i.e., due to recharge in these growing mountainchains and gravity flow through the adjoining sedimentary basins, and ontothe shallow carbonate platformareas (Bethke, 1986; Bethke and Marshak,1990; Garven et al., 1993; Sverjensky and Garven, 1992).
One of the necessary conditions for evaluating this gravity(topographically)-driven fluid-flow hypothesis is that it is physicallycredible. Computer modeling simulations incorporating the physics of fluid-flow through sedimentary rocks have shown that a large-scale, gravity-driven fluid-flow system is fully capable of transporting the heat and massrequired to form the large MVT ore districts of the midcontinent region(Appold and Garven, 1999; Bethke, 1986; Garven, 1985; Garven et al.,1993). Modeling studies have also demonstratedthat a variety of flow

5. Role of Large Scale Fluid-Flow in Subsurface Arsenic Enrichment 133
directions related to growth of both the Appalachian and Ouachita mountainchains are plausible (Garven et al., 1993).
The computer modeling results are reinforced by petrographic studiesthat demonstrate widespread precipitation of hydrothermal dolomite andsulfide minerals by migrating ore fluids. Hydrothermal vug-filling dolomiteis known to have formed over much of the Ozark region (Gregg and Shelton,1989; Leach et al., 1991; Shelton et al., 1993). Fluid inclusion studies haveshown that this dolomite typically precipitated at temperatures >100°C frombrinefluids whose salinity was very similar to that of fluids that formed theore deposits (Gregg et al., 1992; Rowan and Leach, 1989; Shelton et al.,1993). The hydrothermal dolomite can be paragenetically correlated usingzoning patterns (microstratigraphy) as revealed by cathodoluminescencemicroscopy. This zoning is recognized over most of southern Missouri,northern Arkansas, and parts of Kansas and Oklahoma (He et al., 1997;Rowan, 1986; Voss and Hagni, 1985) and can be traced directly into the oredistricts showing that ore-forming fluids deposited the hydrothermaldolomite (Rowan, 1986). Sites where this distinctive dolomite zoning hasbeen observed are shown on Fig. 3.
The minerals pyrite and to a lesser extent marcasite (both have thecomposition but differ in crystal structure) are typically intergrownwith, and fill vugs in the regionally distributed hydrothermal dolomite.Although much less common, sphalerite (ZnS) and galena (PbS) are alsolocally present as fillings of vuggy porosity in dolomite. An example ofpyrite filling a vug in hydrothermal dolomite is shown in Fig. 4.
The hydrothermal dolomite and associated iron sulfide minerals bothformed from hydrothermal ore fluids. This conclusion is documented bothby the temperature and salinity measurements on the dolomite noted above,and by similarity in the isotope compositions of trace Pb contained in thewidespread epigenetic vug-filling and in the hydrothermal dolomite tothat of ore lead in the MVT ore districts (Goldhaber et al., 1995). Studies onthe gases dissolved in dolomite-hosted fluid inclusions (Leach et al., 1991)combined with computer-based, geochemical reaction-path modeling leadsto the conclusion that the dolomite and paragenetically associated Fe, Zn,and Pb sulfides precipitated due to outgassing of (causing pH toincrease) from low pH brines as these fluids migrated up dip in aquifer rocks(Leach et al., 1991; Plumlee et al., 1994). The same dissolved gas studiesestablish that hydrogen sulfide was a component of the hydrothermal fluidsover much of the Ozark region. This is important because depending uponspecific conditions of pH, temperature, and total sulfide concentration,

134 Chapter 5

5. Role of Large Scale Fluid-Flow in Subsurface Arsenic Enrichment 135
arsenic forms soluble complexes with dissolved sulfide (Spycher and Reed,1989; Webster, 1990), and such complexes could have facilitatedarsenicleaching and transport by the fluids.
Iron sulfide minerals are, on a regional scale, the dominant residence forelevated concentrations of metals such as Pb, Zn, Cu, Co, Ni, Mo, and As inaquifer rocks of the Ozark region. This mineralogical residence has beenestablished by chemically analyzing pyrite separated from midcontinentrocks (Erickson et al., 1981; Goldhaber et al., 1995). The suite of metalsenriched in the iron sulfide phases includes Pb, Zn , As, Cu, Co, Ni, Mo,and Ag. Here we focus on arsenic. Fig. 5 is from a polished section of rockfrom a depth of 225.2 m in core S-35 from Douglas County, Missouri(location shown on Fig. 3). This figure is a “dot map” illustrating therelative abundance of different elements by the density of dots. Note thecovariance of the Fe, S, and As concentrations. The data for core S-35 aretypical of others in the southern midcontinent region for which chemicalanalyses exist (M. Goldhaber, unpublished data).
In contrast to the extensive data collected on trace-mineralized rocksbetween ore districts, less information is available on the arsenic contents ofthe ore deposits. Because iron sulfide minerals are typically gangue phases,they are commonly ignored in trace element studies of ore deposits, whichtend to focus on ore minerals such as sphalerite and galena. Therefore, therehave not been extensive analyses for arsenic in iron sulfides in many of theMVT ore districts or trace-mineralized areas. However, a few studies ontrace element contents in iron sulfides from the Ozark region have beenperformed. Wu et al. (1996) analyzed 80 pyrite and marcasite samplesfrom the Viburnum Trend of the Southeast Missouri Lead District and foundarsenic in concentrations of 2 to 900 ppm. Bhati and Hagni (1980) alsoanalyzed iron sulfide minerals from this area, but did not publish results forarsenic. Hagni (1993) described the relatively rare occurrence of nickel-arsenic-sulfide ores from the Magmont-West ore deposit of the ViburnumTrend. Leach et al. (1995) list arsenic as a trace constituent in ores from theNorthern Arkansas and Southeast Missouri MVT ore districts, but withoutabundances specified.
Stratigraphic and Geographic Distribution OfArsenic In The Ozark Region
Erickson and colleagues (Erickson et al., 1988; Erickson et al., 1991;Erickson et al., 1978) extensively studied the geographic distribution of traceelements within the Ozark portion of the U.S. midcontinent. These studieswere part of a USGS program to evaluate potential for undiscovered mineral
2.3

136 Chapter 5
resources of the Ozark region by identifying MVT ore-fluid pathways(Erickson et al., 1983). The primary approach used in these studies was toisolate and chemically analyze the acid (6N HCl)-insoluble residues ofcarbonate rock samples from boreholes. MVT sulfides, and therefore MVT-related metals, tend to be insoluble in HCl and are thus concentrated in thisrock fraction (Erickson et al., 1981). The rock samples from which the acid-insoluble residues are derived were obtained from boreholes distributedthroughout the Ozarks (Fig. 3). Individual rock samples represent

5. Role of Large Scale Fluid-Flow in Subsurface Arsenic Enrichment 137
composites of 10-foot borehole intervals. Because of the USGS mineralassessment effort, insoluble residue concentrations are extensively availablefor midcontinent rocks, whereas whole rock data are not.
In order to understand the relevance of the insoluble residueconcentrations to the overall arsenic contents in midcontinent rocks, it isuseful to compare data for the insoluble residues and the whole rocks. Anexample of this comparison for a suite of elements including arsenic isshown in Fig. 6. This figure plots depth versus arsenic content in wholerock samples, and arsenic, molybdenum, and lead contents in the acid-insoluble residue fraction of core S35 (see Fig. 3 for sample location). Thedetection limit for arsenic in the whole rock samples was rather high at ~4ppm. Nevertheless, it is evident that several depth intervals, particularlythose within the Ordovician Eminence and Potosi Dolomites aresignificantly enriched in arsenic relative to surrounding intervals. Arsenic isconcentrated in acid-insoluble residues compared to whole rock samples byroughly one order of magnitude. The depth range of elevated arsenic valuesin the insoluble residues and whole rocks are positively correlated. It thusappears from this comparison, and from several others that could bepresented, that geochemical analyses of insoluble residues provide a data setfrom which general trends in rock arsenic distribution can be evaluated.

138 Chapter 5
The distribution of arsenic in insoluble residue samples is shown in mapview in Fig. 7 taken from Lee and Goldhaber (2001). This plot projects datafrom multiple depths and stratigraphic horizons to the surface. Parts ofsouthern Missouri and northern Arkansas have consistently elevated rockarsenic concentrations. Fig. 8 shows the same data as in Fig. 7, butdisplayed in three dimensions. Samples having over 700 ppm arsenic in theinsoluble residue are shown as larger blocks, and samples having less thanthis limit are shown as small blocks. Arsenic is enriched in the lower part ofthe Paleozoic section. Data not presented here show that arsenic abundancetends to correlate geographically and stratigraphically with elevated levels oflead and molybdenum (Lee, 2000). The arsenic enrichment is primarilywithin the Upper Cambrian through Lower Ordovician dolomites of theOzark aquifer, which is the primary source of drinking water in the Ozarkregion (Imes and Emmett, 1994).
East-Central Region and Illinois Basin Region
As in the Ozark region, ore districts at either end of the Illinois Basinformed during the late Paleozoic (see Fig. 2 and associated references)
2.4

5. Role of Large Scale Fluid-Flow in Subsurface Arsenic Enrichment 139
where fluid-flow presumably was gravity driven as well (Bethke, 1986;Rowan and Goldhaber, 1996). Paleohydrologic modeling has shown thathydrothermal ore fluids migrating from south to north through the IllinoisBasin were responsible not only for ore genesis at either end of the basin, butalso partly responsible for the observed patterns of coal maturation (Rowanet al., 2001) and sediment diagenesis (Fishman, 1997; Pitman and Spoeetl,1996). Furthermore, the pattern of fluorine distribution in rocks of theIllinois Basin is indicative of fluorine transport by hydrothermal fluids fromthe area of the Illinois-Kentucky Fluorspar district northward into the IllinoisBasin (Goldhaber et al., 1994; Rowan et al., 1996).
Trace mineralization including sporadic arsenic enrichment is presentwithin the Illinois Basin, particularly in the southern portion and along itswestern edge (Erickson et al., 1987). Follow on studies failed to detectelevated trace-element contents in rocks of the central Illinois Basin(Goldhaber, unpublished data). However, data from further north suggestsenrichment in elements related to MVT deposits including arsenic extendinginto southeast Minnesota, based on chemical analysis of acid insolubleresidues from that area (Lively et al., 1997).
FLUID FOCUSING RESULTING IN MOREINTENSE AREAS OF TRACE ELEMENTLOCALIZATION
The regional fluid-flow described above produced widespread diffusetrace mineralization over large areas of the U.S. Midcontinent. In addition tothis diffuse mineralization, specific paleohydrologic processes can lead tosomewhat more intense element enrichment, ranging from economic oredeposits down to sub-economic but nonetheless significant concentrations ofore and gangue minerals. Because arsenic can accompany MVTmineralization, these more intensely mineralized areas are important toidentify because they may be particularly susceptible to environmentalimpacts.
Paleohydrologic controls resulting in this more intense style ofmineralization were identified during a multi-year cooperative researchprogram (CUSMAP for Conterminous U.S. Mineral Assessment Program)among the USGS, state geological surveys, and universities in the region(Pratt and Goldhaber, 1990). Favorable paleohydrologic settings occurwhere migrating ore fluids are focused into a volume of reactive rock orwhere the juxtaposition of aquifers allows two ore fluids of differentcomposition to mix. Pratt (1990) has summarized these paleohydrologicconditions, which are illustrated schematically in Fig. 9. This figure shows
3.

140 Chapter 5
a stratigraphic section composed of sandstone, shale, limestone, anddolomite beds whose vertical arrangement is roughly patterned after that ofthe U.S. midcontinent. Fluid-flow paths are shown as arrows and resultingareas of ore formation as capital letters. On a regional scale, these flowpaths are predominantly lateral as described above. However, particularcombinations of aquifers and aquitards allow local vertical fluid-flow. Shaleand dense finely crystalline limestone are the major aquitards. Sandstone,vuggy dolomite, and occasionally porous limestone are the principleaquifers.
A specific rock type may be reactive towards migrating MVT brines for avariety of reasons. Chemical disequilibrium with hydrothermal fluids is onecause, by which migrating brines are in chemical equilibrium with dolomitebut may be out of equilibrium with limestone (Plumlee et al., 1995). Thus,limestone reacts with the ore fluids resulting in geochemical changes such asa pH increase that promote ore and gangue mineral deposition. Likewise,coal is also a reactive rock type capable of fixing MVT ore and gangueminerals as it potentially contains a reservoir of reactive reduced sulfurcapable of precipitating metals (Hatch et al., 1976; Whelan et al., 1988).
Regions where migrating brines rise and intersect a reactive rock type ormix with geochemically dissimilar fluids are favorable sites formineralization. Geologic features favorable for vertical fluid-flow are: (1)faults (2) shale ‘windows’ and (3) aquifer pinchouts. Faults having a largevertical extent are major conduits for MVT ore fluids. This is illustrated inFig. 9 by a fault rising from the basement through the section.Mineralization is shown as occurring in area ‘A’ where the rising fluids passthrough a limestone bed; faults penetrating coal beds would also bemineralized in this model. Shale windows are areas where shale aquitardspinch out or are absent due to facies changes or erosional unconformities. Inthe absence of such aquitards, fluids might rise towards reactive sites. Astriking example of a shale window is the world-class Tri-State miningdistrict (Fig. 2) that formed in a shale window of large geographic extent(Pratt et al., 1993). Aquifer pinchouts such as the onlap of the lowermostsandstone against a basement high (leading to ore area ‘C’) or the transitionof the upper sandstone to shale leading to ore area ‘C'’ (Fig. 9) result influids being forced upwards, potentially into a reactive rock type such aslimestone, or into a fluid mixing zone (area C). A substantial amount ofmineralization in the southeast Missouri lead belt was associated withpinchouts of the basal sandstone (Lamotte Sandstone) against basementhighs (Ohle, 1990), and was located where these rising fluids entered amixing zone (Goldhaber et al., 1995).

5.Role of Large Scale Fluid-Flow in Subsurface Arsenic Enrichment 141

142 Chapter 5
We have chosen to illustrate arsenic enrichment resulting from a subsetof these paleohydrologic conditions using geochemical data from coal bedsof the Illinois Basin and adjacent portions of the western region of theinterior coal province in Iowa and Missouri. These examples also serve tointroduce coal as an important lithologic residence of arsenic, a subject thatis pursued further in a subsequent section of this paper.
Figure 10 shows the distribution of zinc and arsenic in coal samples ofthe Illinois basin. The data are shown as circles whose size is proportional tothe element’s content on a whole coal basis. The data shown were compiledfrom Gluskoter (1977), Oman et al. (1992) and Bragg et al. (1991) and arelisted in Affolter and Hatch (2002). Zinc in Illinois Basin coal ranges up to10,000 ppm and arsenic up to 950 ppm. In addition to zinc and arsenic, datafrom the sources listed above shows that the elements lead, barium,cadmium, cobalt, copper, molybdenum, and nickel are also significantlyenriched over average values for U.S. coal.
Major faults of the Illinois Basin area are shown in Fig. 10. Thesouthern portion of the basin is intensely faulted; northeast-trending faults insoutheast Illinois and northwest Kentucky are associated with the Illinois-Kentucky Fluorspar district. A number of these faults in Mississippianlimestone beds are mineralized with the ore minerals fluoritesphalerite, and galena, and with gangue minerals such as calcite and pyrite

5. Role of Large Scale Fluid-Flow in Subsurface Arsenic Enrichment 143
(Heyl, 1983). Anomalously high zinc and arsenic contents in overlyingPennsylvanian coal beds also occur in the highly faulted area. These zinc andarsenic enrichments in the southern part of the Illinois Basin represent anexample of fluid migration from deeper in the stratigraphic column intomore shallowly buried coal beds (e.g. analogous to area ‘A’ in Fig. 9).
Sporadic high zinc and arsenic contents are localized towards thenorthwest limit of the coalfield in western Illinois. Detailed studies inwestern Illinois (Cobb, 1979; Hatch et al., 1976) show that zinc occurs as themineral sphalerite and is hosted by cleats (vertical fractures) in the coal. Thesphalerite is accompanied by pyrite kaolinite, quartz and calcite. Analysis ofa sample of a mineralized cleat containing both pyrite and sphaleritesupplied by Jim Cobb showed that arsenic was localized in the pyriticportion and not the sphalerite (M. Goldhaber, unpublished data). Becausecleats only form after significant burial, the trace mineralization isconsidered to be epigenetic in origin (Cobb, 1979). Fluid inclusion studieson the sphalerite (Coveney et al., 1987) indicate that it formed attemperatures significantly above those expected for its present burial depth,from fluids with very high salinities similar to those of MVT ore fluids.Hatch et al. (1976) and Whelan et al. (1991) concluded that migratinghydrothermal fluids associated with MVT ore formation deposited the tracemineralization in coal.
Figure 11 shows a geologic cross section oriented roughly northwestsoutheast through the western shelf area of the Illinois basin. Coal beds arefound in Pennsylvanian rocks. In the region of the zinc and arsenic anomaly,Mississippian strata are truncated beneath a sub-Pennsylvanian unconformity(labeled the sub-Absaroka unconformity in the figure) north of that area.This pinchout of the Mississippian section is of importance to understandingthe incorporation of trace elements into the overlying Pennsylvanian coalbeds. The Mississippian Burlington-Keokuk Limestone, in contrast to manyother limestone units, likely had substantial permeability and could havetransmitted hydrothermal fluids because the Burlington-Keokuk is known tocontain trace mineralization within the Illinois Basin (Erickson et al., 1987)and host ore deposits (Heyl, 1983). Trace sphalerite in fact occurs in theBurlington-Keokuk Limestone near its pinchout (Erickson et al., 1987). It isthus likely that fluids were forced upwards into the overlying Pennsylvaniansection, precipitating epigenetic minerals in coal cleats.
The effect of a shale window on the arsenic content of coal can beillustrated with data from the interior coal province (Fig. 12). Hatch (1983)pointed out that Pennsylvanian coal seams in southern Iowa and adjacentparts of Missouri, contain sphalerite. The mode of occurrence of thissphalerite is similar to that described in Illinois. Data in the USGS coaldatabase (Bragg et al., 1997) documents the fact that these sphalerite-bearing

144 Chapter 5

5. Role of Large Scale Fluid-Flow in Subsurface Arsenic Enrichment 145
coal beds also may also be enriched in arsenic. The abundance of arsenic incoal samples from southern Iowa is shown together with lithologicinformation relevant to understanding the paleohydrologic controls on MVTfluid introduction into the coal beds. The coals having elevated arsenic(between 61-200 ppm) overlie, i.e. are up stratigraphic section from awindow in the Ordovician Maquoketa shale (the non-shaded portion of thefigure) (Pratt, 1992) or are adjacent to it.
The arsenian pyrite underlying the Fox River Valley (Schreiber et al., thisvolume) most likely represents another MVT type of deposit that is thesource of arsenic-rich ground water.
ARSENIC IN COAL OF THE APPALACHIANREGION
Arsenic is locally enriched to concentrations of one to two orders ofmagnitude above typical background concentrations in coal of theAppalachian Basin. We hypothesize that these enrichments result frominteractions of coal with hydrothermal fluids mobilized by metamorphicprocesses during the late Paleozoic Alleghanian orogeny. Our interpretation(developed more fully below) is that these fluids represent the distal(western) part of a large metamorphic fluid-flow system that also wasresponsible for formation of gold deposits and gold occurrences further eastin metamorphic rocks of northern Alabama and perhaps elsewhere in theAppalachian Piedmont. If true, the timing of the metamorphic hydrothermalsystem is similar to the topographically driven, basin brine derived systemdiscussed above, which was also of late Paleozoic age. The responsible fluidflow system also may ultimately be tied to the same overall tectonic event,the assembly of the supercontinent Pangea during the late PaleozoicAppalachian and Ouachita orogenic events. However, the fluid source wasat least in part metamorphic devolatilization reactions leading to low salinityfluids and not basin brines as in the midcontinent. The suite of elementsenriched in the Appalachian basin sediments differs from that in themidcontinent, implying that the chemistry of the hydrothermal fluids mayhave been different, in part reflecting this difference in fluid source. Thismetamorphic fluid-flow event represents a second example of a fluid-flowsystem that is both of enormous extent and has profound implications forarsenic distributions in the crust of the United States.
We first present results from northern Alabama, where detailed studieshave been conducted during the course of a joint USGS-Alabama GeologicalSurvey project. The focus is than expanded to a larger portion of theAppalachian Basin.
4.

4.1
146
Arsenic in Alabama Coal
Chapter 5
The highest arsenic contents in U.S. coal are found in coal of the Warrior,Cahaba, and Coosa coalfields in Alabama (Goldhaber et al., 2000). Thearithmetic mean content of arsenic in coal samples from the entire U.S. is 24ppm with a standard deviation of ± 60 (n=7676) (Kolker and Finkelman,1998). For comparison, the mean value for Alabama bituminous coalsamples is 75 ppm. The striking enrichment in arsenic in Alabama coal canbe seen in Fig. 13, which is a histogram contrasting arsenic abundance inWarrior (and Cahaba) basin coal samples with that in Illinois and Wyomingcoals. The Alabama data has a long tail to elevated values with somesamples exceeding 500 ppm on a whole coal basis.

5. Role of Large Scale Fluid-Flow in Subsurface Arsenic Enrichment 147
Geologic Background
The Warrior basin, a foreland basin at the south end of the AppalachianPlateau constitutes a major structural element in northern Alabama. Otherstructural elements in this region are the unexposed Ouachita fold-thrust beltand central uplift southwest of the Warrior basin, and a succession of thrustbelts in the southern Appalachians east of the basin that make up the Valleyand Ridge province and Northern Piedmont terrains (Fig. 14). The Warriorbasin formed by convergence of the Ouachita and Appalachian thrust belts.It has been described (Thomas, 1989) as a southwest-dipping regionalhomocline, consisting of a cratonal cover sequence that dips gently under thetwo orogenic fronts. The youngest rocks filling the basin are sandstones,mudstones and coal of the Pennsylvanian Pottsville Formation, whichrepresents a clastic wedge of materials that was shed principally from theadjacent Ouachita orogenic high.
Directly east of the Warrior basin is the fold-thrust belt of the Valley andRidge Province. The two tectonic blocks are in contact across the OpossumValley thrust fault (and other faults along that strike zone), the westernmostof numerous thrust splays off the master Alleghanian decollement that reachthe surface. The province is characterized by alternating fold ridges andvalleys in a stratigraphic sequence spanning Cambrian to Pennsylvaniantime. The Cahaba and Coosa coalfields occur in Pennsylvanian rocks of thePottsville Formation within this province.
4.1.1

148 Chapter 5
4.1.2 Distribution of Arsenic in Alabama Coal
The geographic distribution of arsenic within the Warrior and Cahabafield coal beds is plotted in Fig. 15, which is a plan view map of arsenicconcentrations. Coal beds occur over a range of depths in the PottsvilleFormation and Fig. 15 combines data from all of these beds. This display ofthe data overemphasizes high values because lower concentration samplesfrom the same geographic area or even the same coal-face may be obscuredby overlying samples with higher concentrations. Nonetheless, it is evidentthat there are significant areas of the Warrior and Cahaba basins where thecoal has been enriched in arsenic. These high arsenic areas tend to coincidewith higher sulfur coal (Winston, 1990). The three dimensional distributionof arsenic in the Warrior basin is depicted in Fig. 16, which showscontoured values for major coal-producing groups (see Pashin et al., 1995for a discussion of these groups) recognized in the basin. Elevated arseniccontents are particularly noticeable in northern Tuscaloosa and easternFayette Counties. Arsenic is nowhere present throughout the vertical extentof the coal-bearing section, but in places it is nearly so. The areas havingelevated arsenic are accompanied by significant but less-strikingenrichments (compared to average U. S. coal) in Mo, Sb, Se, Cu, and Hg(Goldhaber et al., 2000) and Au (see below).
4.1.3 Residence of Arsenic in Alabama Coal
As in the midcontinent, arsenic in Alabama coal resides in the mineralpyrite (Kolker and Finkelman, 1998). This is demonstrated in Fig. 17 andFig. 18, which document arsenic localization in pyrite. A wavelength-dispersive elemental map obtained using an electron microprobe (Fig. 17)shows arsenic zonation within a mass of pyrite that contains a series ofarsenic zones. The pyrite occurs along a microfracture in coal. Individualspot analyses indicate that the bright areas in this map (red-yellow) have upto 4.5-weight percent arsenic, and the dull areas (blue) have a few tenths of aweight percent. Figure 18 shows a group of early diagenetic pyriteframboids in filled by later pyrite cement. Elevated arsenic concentrationsare found only in the cement. Spot analyses of As-bearing pyrite (termedarsenian pyrite) from a number of Alabama coal samples using a LaserAblation- Inductively Coupled Plasma, Mass Spectrometer confirm thatpyrite is also the residence of the elevated contents of Mo, Sb, Se, Hg andAu (M. Goldhaber and I. Ridley, unpublished data). Gold contents up tonearly 200 ppb were measured in pyrite nodules (ash basis) (Goldhaber andHatch; unpublished data). Because high sulfur coal is avoided duringmining and coarse pyrite is removed from coal by a cleaning process prior to

5. Role of Large Scale Fluid-Flow in Subsurface Arsenic Enrichment 149

150 Chapter 5

5. Role of Large Scale Fluid-Flow in Subsurface Arsenic Enrichment 151
its utilization, coal combusted in power plants will have considerably lessarsenic than the whole coal concentrations documented here. On the otherhand, the waste products from the cleaning process may be enriched inarsenic.
4.1.4 Timing of Arsenic Introduction into Coal
Observations on the mode of occurrence of arsenic in coal samples, suchas those shown in Figs. 17 and 18 support a late diagenetic or epigeneticorigin for the arsenic. This conclusion is reinforced by our fieldobservations. We have found that pyrite recovered from fault zones iscommonly arsenian, whereas pyrite from unfaulted beds at distances of tensof meters may not be. For example, a pyrite nodule from a faulted coal bedin the abandoned Kellerman coal mine (Pashin et al., 1999) in southeasternTuscaloosa County contains 2200 ppm arsenic. Pyrite samples collectedfrom coal within about 5.0 m from the faults were likewise arsenic enriched.Coal samples collected further from the fault contained only backgroundlevels of arsenic. Arsenic was observed associated with pyrite near smallfault zones in at least two other mines. We have also recognized arsenianpyrite on cleats (vertical fractures) in coal. This observation supports anepigenetic origin as cleat formation requires that coalification proceed to apoint where fracturing occurs. This requires considerable burial (Pashin etal., 1999).
Also supporting a post-depositional origin for arsenic are geochemicaldata on shales and sandstones adjacent to As-rich coal beds (J. Hatch and M.Goldhaber, unpublished data). These rocks are low in arsenic and associatedelements. The mean arsenic content of sandstones adjacent to the coal bedsis 9 ppm (n=20) and the median 5.5 ppm. The mean arsenic content foradjacent non-coaly shales is 20 ppm (n=29), and the median arsenic contentis 12 ppm. For comparison, the average arsenic content of sandstones is 1ppm and shales is 13 ppm (Turekian and Wedepohl, 1961). If as is typicalarsenic is transported to the depositional site adsorbed on particle surfaces, itis likely that the adjacent rocks (particularly shales) would be enriched,reflecting the sedimentary erosional source of the arsenic.
In contrast to the evidence for a late diagenetic timing of arsenic addition,one observation may indicate relatively early introduction of arsenic in thedepositional history of the coal beds. As illustrated in Fig. 17 arsenianpyrite locally fills cell lumens (the cavities bounded by the cell wall) ofcoalified plant debris. These cell lumens, if unfilled, are crushed duringburial. Therefore, unless the arsenian (>~0.1 wt. % arsenic) pyrite is areplacement of earlier mineral phase, the presence of arsenian pyrite inuncrushed lumens argues for a relatively early formation.

152
4.1.5 Arsenic in Gold Occurrences and Ore Deposits
Chapter 5
In order test for possible genetic linkage between processes introducingarsenic into coal and gold deposits, it is first necessary to present somebackground on the latter. Gold occurrences and deposits in northernAlabama are restricted to metamorphic rocks east of the Valley and RidgeProvince (Fig. 19). The eastern boundary of this province is the Talladegafault, which forms the leading edge of the overthrust metamorphic complexthat makes up the northern Piedmont of Alabama. The Piedmont terrain isseparated into two units by the Hollins Line fault, the Talladega slate belt tothe northwest and the Ashland-Weedowee belt to the southeast. A majorAlleghanian strike-slip fault, the Brevard zone marks the southeastern limitof the northern Piedmont. The terms Blue Ridge and northern Piedmont areequivalent in this region.
Gold occurrences and deposits are known from both the Talladega slatebelt and the Ashland-Weedowee belt, occurring in 11 separate districts(Guthrie and Lesher, 1989). In addition, gold occurrences are found alongthe Brevard fault zone (Guthrie and Lesher, 1989). The gold in all of thedistricts is associated with quartz-sulfide veins of slightly varyingmineralogy. Some quartz veins contain only pyrite, but in most districtsother sulfides such as pyrrhotite, chalcopyrite, and arsenopyrite arevolumetrically significant. At all of the gold deposits, gold is closelyassociated with the sulfide minerals that are in structural loci related to latemetamorphic and deformational features. Such observations have led recentinvestigators (Guthrie and Lesher, 1989; Stowell et al., 1989; Stowell et al.,1996) to conclude that the present configuration and distribution of the golddeposits reflect of fluid movement during metamorphism and deformationassociated with the late Paleozoic Alleghanian orogeny.
The Alabama gold deposits are classified as ‘mesothermal’, or ‘orogenic’(Groves et al., 1998). The term orogenic will be used here. This class ofdeposits is closely associated with the formation of metamorphic terrinesranging in all from Archean to Recent (Goldfarb et al., 2001; Kerrich andCassidy, 1994). They are universally associated with orogeny. Groves et al.(1998) concluded that orogenic gold deposits form by regional hydrothermalfluid migration inherent to tectonism along convergent margins. Theyargued that deposits associated with orogenesis represent a continuum fromgold-arsenic ores formed at great depth in metamorphic zone such as theAlabama deposits (Stowell et al., 1996), to the distal and shallow end of suchsystems that are characterized by low-temperature, mercury-rich deposits.
The timing of ore genesis for orogenic gold deposits relative to orogenicevents is of relevance here. It is increasingly recognized that fluid migrationoccurred during a change in plate motion from dominantly compressive to

5. Role of Large Scale Fluid-Flow in Subsurface Arsenic Enrichment 153
strike-slip that reactivated--and thus increased permeability in earlier-formedstructures in the orogenic zone (Miller et al., 1994). Goldfarb et al. (2001)argue that a modern analog occurs along the San Andreas fault, where hotsprings that discharge deep crustal fluids (White, 1967) and form mercuryvein systems (Rytuba, 1995) represent the shallow facies of a deepmetamorphic hydrothermal system.
4.1.6 Evidence Supporting A Genetic Link Between MetamorphicFluid And Arsenic Enrichment In Alabama Coal
Evidence presented above suggests that the arsenic and relatedelements present in Alabama coal were added to the coal after depositionand subsequent burial. Additional evidence that supports a relationshipbetween the observed anomalous arsenic contents in coal and metamorphicfluids related to Alleghanian tectonism include (1) geochemical similarity ofthe elemental suite in nearby coal and ore deposits, (2) geographicdistribution of As-rich coal, (3) evidence for thermal alteration of coal bymigrating fluids (4) independent evidence for alteration of rocks of the foldand thrust belt during the Alleghanian orogeny, (5) permissive timing

154 Chapter 5
constraints and (6) availability of fluid-flow pathways from the east to westinto the coal-bearing sequence.
The element suite (As, Cu, Mo, Sb, Hg, and Au) that is enriched inboth coal and gold occurrences and deposits is similar with arsenicprominent in both. Arsenic distribution in the coal was discussed above. Inthe gold districts, the only known residence of arsenic is the mineralarsenopyrite Guthrie and Lesher (Guthrie and Lesher, 1989) listarsenopyrite as occurring in gold-bearing quartz veins in five of the elevenAlabama gold districts. Mines in two other districts may have high arsenicvalues (up to 1000 ppm) in chemical analyses of grab samples (Lesher et al.,1989). Gold prospects along the Brevard fault zone contain up to fiveweight percent arsenopyrite, and soil samples near the prospects may containover 1000 ppm arsenic (Cook and Thomson, 1995). In the quartz-sulfideveins, arsenopyrite is dominantly associated with pyrrhotite and pyrite, plusvarying but lesser percentages of chalcopyrite and, in somedeposits, nickel-antimony sulfide. Elevated mercury and to a lesser extentmolybdenum contents are reported in grab samples from a number of minesin the Alabama Piedmont (Lesher et al., 1989), and mercury ± antimonymineralization is characteristic of the distal (low temperature and shallowdepth) ends of orogenic gold-forming systems (Groves et al., 1998). Thesignificance of this similarity in element enrichment is that it may reflectsimilar compositions of the introduced fluids. For orogenic gold deposits,these fluids have been characterized by fluid inclusion studies as having arenear-neutral pH, low to moderate salinity, and compositions,(Cartwright and Oliver, 2000), which transported gold as a reduced sulfurcomplex (Seward, 1991).
The presence of elevated gold contents in the arsenian pyrite in coal inamounts up to 200 ppb (ash basis) is consistent with deposition from anepigenetic hydrothermal fluid that likewise contained reduced sulfur. Infact, the suite of elements concentrated in Alabama coal, is one that tends toform mobile complexes in the presence of aqueous sulfide species.Conversely, the lack of significant enrichment in base metals such as zincand lead in Alabama coal is an indication that the arsenic-bearing fluid hadonly moderate levels of chloride, because high-chloride fluids are capable ofleaching, complexing, and transporting base metals (Goldfarb et al., 2001;Kerrich and Cassidy, 1994). In the Illinois Basin coal described earlier (Fig.10), zinc is the dominant trace element added, and the hydrothermal fluidwas brine with chloride as the dominant anion. However, some orogenicgold deposits were formed by saline ore fluids. These differ from the gold-only type in being enriched in base metals including copper (Goldfarb et al.,2001). The presence of significant amounts of copper (in the mineralchalcopyrite) in many of the gold occurrences in Alabama, and a minor

5. Role of Large Scale Fluid-Flow in Subsurface Arsenic Enrichment 155
enrichment in copper in arsenian pyrite from coal beds (Goldhaber et al.,2000), may indicate at least some chloride enrichment in the fluidsassociated with introduction of arsenic.
The distribution of elevated arsenic concentrations in Alabama coalbasins bears on the transport path of the arsenic. If arsenic was carried inmetamorphic fluids that were driven westward by tectonic forces, then thefold belt, which lies between the Warrior basin and the presumed source ofthe fluids in metamorphic rocks should have been along this flow path.Significantly, chemical analyses of coal from the Cahaba coalfield, which islocated in the fold belt, confirm high arsenic concentrations in these coalbeds (Fig. 15).
A compelling line of evidence that coal in the Warrior basin has beenaffected by westward-migrating fluids is the variation of vitrinite reflectancein the coal. Vitrinite reflectance of the Mary Lee coal is shown in Fig. 15.An area having elevated vitrinite reflectance (higher coal rank) occurs in anelliptical pattern along the eastern edge of the coal basin. Typically, anincrease in vitrinite reflectance is attributed to increased temperatureassociated with increased burial depth. That isn’t the case in the WarriorBasin. There is little relationship between the structure, both regional andlocal and the observed vitrinite reflection pattern (Pashin et al., 1999). Thesedimentary section thickens systematically toward the southwest away fromthe anomaly. This relationship is particularly striking in the elliptical high-rank area, Winston (1994) and Carroll et al. (1995) hypothesized that thevitrinite reflectance anomaly records advective heat transport fromwestward-migrating fluids that entered the Warrior basin along faults.
Available timing constraints are consistent with the large-scale fluidflow model presented here. These constraints are shown schematically inFig. 20, a plot of temperature versus time, upon which are superimposedsome benchmarks. One benchmark is a tentative time-temperature path forthe thermal evolution of the Inner Piedmont area of Alabama during theAlleghanian orogeny (Steltenpohl et al., 1995). This path is based on‘cooling ages’ of hornblende, muscovite, and apatite as determined by Ar-Argeochronology and fission track analyses. These cooling ages record thetime at which the first two minerals passed through a temperature at whichthey retained argon, and at which apatite retained fission tracks produced byradioactive decay. The age of the Pottsville Formation is also a keybenchmark because introduction of the arsenic must postdate Pottsvillesedimentation. Alleghanian tectonism was active during Pottsvilledeposition. Pashin has presented evidence for synsedimentary growth of theSequatchie anticline within the Warrior basin (Pashin, 1994, 1998).Furthermore, despite fossil evidence for contemporaneous deposition of coalbeds in the Warrior and Cahaba fields, individual coal groups cannot be

156 Chapter 5
correlated across the Birmingham anticlinorium (Pashin et al., 1995). Thisobservation suggests that folding involving this structure became activeduring upper Pottsville deposition.
The timing of gold mineralization is shown Fig. 20 as a box thatencompasses the range of measured ages of ore formation and theirtemperatures as determined by radiometric dating and fluid inclusion studies(Stowell et al., 1996). Ore genesis evidently spanned the period from peakmetamorphism to somewhat past the peak. Pottsville deposition occurredduring the initial phase of gold mineralization. However, Pottsvilledeposition predates the earliest alteration (illitization) of Ordovicianbentonite beds in the fold-thrust belt. Potassium-argon age dating has shownthat hydrothermal fluids altered these beds in the late Paleozoic (Elliott andAronson, 1987), during a fluid-flow event in a crustal block (the fold-thrust

5. Role of Large Scale Fluid-Flow in Subsurface Arsenic Enrichment 157
belt) known to contain arsenic-rich coal (see Fig. 15). Similarly,paleomagnetic studies demonstrate that Ordovician and Mississippian rocksin the fold-thrust belt of Alabama, and immediately adjacent portions ofTennessee in the same crustal block were remagnitized by migrating fluidsin the late Paleozoic (Miller and Kent, 1988). In addition, timing of thetransition from compression-related folding and thrusting, to ‘transpression’(i.e. initiation of right-lateral motion on the Brevard fault zone has beendated (Goldberg and Steltenpohl, 1990; Steltenpohl et al., 1995). Thistransition to a component of strike-slip motion is important because, as notedabove, a change in plate motion is considered to be linked to orogenic goldmineralization elsewhere (Miller et al., 1994).
The timing data presented in Fig. 20 indicate that fluid migrationthrough the fold-thrust belt (as documented by Ar-Ar ages andpaleomagnetic studies) overlaps both the timing of right-lateral shear on theBrevard fault zone, and at least a portion of the gold mineralization stage.All of these events probably occurred prior to the time of maximum burial ofthe Pottsville Formation. The relations illustrated in Fig. 20 are bestreconciled by a model involving the introduction of arsenic-bearing fluidsinto the coal beds some 10-15 million years after initial deposition of thePottsville Formation (at which time the Pottsville would have been buried todepths of 600-1200 meters, continuing (most likely episodically) for sometime thereafter, and ceasing before the Pottsville reached its maximum burialdepth of between 3,000 and 3700 meters (see Carroll et al. 1995 for burialhistory curves).
4.2 Mechanisms of Fluid Generation and Transport
The fluid flow system we hypothesize is in accord with evidenceworldwide that high water fluxes take place through metamorphic belts(Manning and Ingebritsen, 1999; Rumble III, 1994). The driving force formetamorphic fluid flow is discussed in Manning and Ingebritsen (1999) andconsists of the difference between the hydrostatic and lithostatic pressuregradients. More general information on fluid evolution duringmetamorphism may be found in Yardley (1997) and references therein.
The hypothesized fluid-flow pathways are along major faults. Orogenicgold deposits are nearly always localized within large faults or fault zones(Kerrich and Cassidy, 1994), and those in Alabama are no exception (Lesheret al., 1989). Some potential fault-related fluid pathways are shown in aschematic cross section (Fig. 21). Major fault zones exist that could haveprovided ingress of westward migrating fluids from deeper and hotter partsof the section into the Warrior basin. The sedimentary rocks and thrust faultsof the Valley and Ridge dip as a wedge to an unknown distance, but at least

158 Chapter 5
several kilometers eastward beneath the overriding thrust complex of theBlue Ridge (Hatcher et al., 1989). This juxtaposition of metamorphic andfold belt terrains provides a potential fault connection for fluid transportbetween metamorphic fluid sources in the Blue Ridge to the east and Cahabaand Warrior basins to the west. Channelized fluid-flow along major faultzones in regional metamorphic terrains at scales greater than a kilometer iswell established (Oliver, 1996).
In summary, the evidence presented above is best interpreted asindicating that the arsenic enrichments found in Alabama bituminous coalwas introduced following deposition and some (perhaps considerable) burialby the distal portion of a regional westward-directed metamorphic fluid-flowsystem.
4.3 Arsenic in Coal of the Central and SouthernAppalachian Basin
4.3.1 Occurrence of Arsenic in Appalachian Basin Coal
There are a number of anomalously high arsenic contents (>100 ppm)elsewhere in the Appalachian Basin. Figure 22 is a plot of arsenic content inall Appalachian Basin coal samples from all horizons from the USGS coalquality database (Bragg et al., 1997). Sporadic high arsenic contents arepresent in Kentucky, West Virginia, Ohio, and Pennsylvania. This plot canbe misleading because it visually overemphasizes high values due to the size

5. Role of Large Scale Fluid-Flow in Subsurface Arsenic Enrichment 159
of the largest dots, which may obscure underlying smaller ones. Nonetheless,it does document the presence of anomalous arsenic levels in the central andnorthern Appalachian coalfields.
An alternative depiction of the distribution of arsenic in Appalachian coalis shown in Fig. 23, which is a series of histograms of arsenic contents incoal by state. The high arsenic ‘tails’ for Appalachian basin coals ofPennsylvania, Ohio, West Virginia, and Kentucky are not as prominent asthose for the Warrior basin of Alabama. But it is evident that a significantnumber of arsenic analyses are greater than 100 ppm outside of Alabama.
Evidence exists that the mode of occurrence of arsenic in centralAppalachian coal beds is similar to that described above for Alabama.Hower et al. (1995) reported local concentrations of arsenic in pyriticsamples from Kentucky. Arsenic contents measured using an electronmicroprobe were 1.9 wt% in epigenetic pyrite and marcasite. They alsodocumented arsenian pyrite filling cell lumens with 3.5 wt% As. Fieldexamination of pyrite accumulations in the eastern Kentucky coalfield usinga portable X-ray fluorescence spectrometer showed arsenic present at levelsin the 30-500 ppm range, and one sample with 1800 ppm (M. Goldhaber, M.Tuttle and J. Ruppert, unpublished data). In the mines we visited, thismacroscopic pyrite was relatively rare. Wiese et al. (1990) report arsenicconcentrated in pyrite and marcasite in Ohio coal, though they did notquantify the amounts. These mineralogical associations and arsenicconcentrations are similar to those reported in Alabama.

160 Chapter 5
4.3.2 Evidence for Alleghanian Fluid-flow In The Central AndSouthern Appalachians
The same lines of evidence cited above for fluid migration in the fold-thrust belt and Warrior basin of Alabama are valid for the southern andcentral Appalachians. This evidence is reviewed in several references(Evans and Battles, 1999; Montanez, 1994; Schedl et al., 1992), and issummarized briefly here.
Vitrinite reflectance anomalies, occurring as ‘tongues’ of elevated valuesextending from the leading edge of the Valley and Ridge province into theAppalachian Plateau (analogous to that shown in Fig. 15, are known fromKentucky, West Virginia, and Pennsylvania (Evans and Battles, 1999; Zhangand Davis, 1993). These authors concluded that burial alone cannot explainthe vitrinite reflectance anomalies, and suggested that additional heating

5. Role of Large Scale Fluid-Flow in Subsurface Arsenic Enrichment 161
provided by hydrothermal fluids is required. Lewis and Hower (1978)concluded that warm fluids introduced during tectonic events might haveplayed at least as important a role as that of stratigraphic and tectonic burial,in producing vitrinite reflectance trends in coal beds of the Valley and Ridgeprovince in Virginia. Hower et al. (1990) summarized data on thedevelopment of high grade (anthracite) coal in the Appalachian region, manyof which occur in the eastern portion of the fold-thrust belt. They concludedthat circulation of hydrothermal fluids was involved in maturation of thecoal, and was responsible for precipitating minerals including sulfides alongcoal cleats.
Diagenetic remagnetization of Paleozoic sedimentary rocks in the Valleyand Ridge province is a widespread phenomenon (Lu et al., 1990; McCabeet al., 1989). McCabe et al. were able to link this event to Alleghaniandeformation by showing through fold tests that the remagnetization wascoeval with Alleghanian folding in some cases. Alleghanian K-Ar and Ar-Ar age dates in Ordovician bentonite beds are widespread throughout theAppalachian fold and thrust belt (Elliott and Aronson, 1987; Hay et al.,1988) and similar ages are recognized in authigenic K-feldspar (Hearn et al.,1987; Hearn and Sutter, 1985). In rocks of the Lower Ordovician KnoxGroup of Tennessee, authigenic magnetite responsible for theremagnetization and authigenic K-feldspar are in fact cogenetic (Suk et al.,1990). Similarly, late diagenetic dolomite in upper Knox Group rocks hasbeen linked to late Alleghanian fluid-flow, having formed at approximatelythe same time as authigenic K-feldspar (Montanez, 1994).
Evans and Battles (1994) evaluated the nature of fluids that migratedthrough the Valley and Ridge Province. This region lies in the criticalposition between the presumed source of metamorphic fluids to the east andAppalachian Basin to the west. They studied fluid inclusions in tectonically-formed carbonate and quartz veins within Ordovician through Mississippianrocks of the Valley and Ridge Province in West Virginia. Their studyidentified a stratigraphically controlled series of fluid-flow systems ofAlleghanian age, and recognized a three component mixture of fluids: (1) asaline in situ fluid (basinal brine) with high salinities generally > 20 wt%equivalent NaCl at temperatures of 70 to 120 °C, (2) Migrating meteoricwater having temperatures similar to those of the basinal brine but lowersalinities and (3) a warm migrating fluid with temperatures of 150-220 °Cand salinities dominantly in the range of 5-15 wt% equivalent NaCl. Thestudy by Evans and Battles (1994)is particularly important because itdocuments the passage of warm migrating fluids through the Valley andRidge Province during the Alleghanian orogeny. Their study demonstratessignificant compositional variability in migrating fluids, and suggestsmultiple sources for the fluids. It is possible that fluids similar to both MVT

162 Chapter 5
ore fluids and metamorphic fluids passed through the system at various timesand/or at differing stratigraphic intervals.
4.3.3 Orogenic Gold Deposits In The Central And SouthernAppalachians
Orogenic gold deposits and occurrences analogous to those in Alabamaoccur elsewhere in the central and southern Appalachian Mountains. Someof these deposits such as those in the Carolina Slate belt formed prior to theAlleghanian orogeny (Stein et al., 1997), but others are likely to be latePaleozoic in age. For example, the Dahlonega belt in Georgia, is alongstrike from the Alabama deposits (German, 1989), and may have formed in asimilar fashion. Thus, conditions favorable for transport and deposition ofgold may have occurred elsewhere during active tectonism along theAppalachian chain.
5. ENVIRONMENTAL IMPACT OF ARSENIC INCOAL AND METAMORPHIC ROCKS.
Given the local enrichments of arsenic locally present in pyrite ofAppalachian Basin coal, environmental impacts are possible. Dispersal ofarsenic from coal to stream sediments and soils may occur by both naturalweathering and mining disturbance. Because arsenic in coal is commonlyassociated with iron sulfide minerals, much of the arsenic will be avoided bymining practices that favor selection of low sulfur (low pyrite) coal or thatremove pyrite from the coal during coal preparation. In addition, disposal ofthe resulting coal or wash waste could present some concern because arsenicmay be concentrated in these materials.
Some dispersion of arsenic into the local environment from historic coalmining areas can be demonstrated. Arsenic concentrations in streamsediments of the Warrior coalfield of Alabama are significantly elevatedcompared to areas outside the coal-mining area, and to typical U.S. streams(Goldhaber et al., 2001). The highest stream sediment arsenic contentsmeasured in Alabama of (180 ppm) occur immediately adjacent to wastepiles from old abandoned coal mines (Goldhaber et al., 2001). Surfaceoxidized portions of these waste piles likewise contain elevated values ofrock arsenic ranging up to 470 ppm. Taken together, these data implicateold abandoned coal mines as a source of arsenic in stream sediments. Thereis presently no evidence that above-background arsenic concentrations instream sediments and coal mine waste piles are impacting the surroundingecosystems. In contrast to the abandoned mines, we have not detected

5. Role of Large Scale Fluid-Flow in Subsurface Arsenic Enrichment 163
release of arsenic to stream sediments from operating strip mines (Goldhaberunpublished data).
Concentrations of arsenic in stream waters of the Warrior coalfieldtypically are not commonly above the drinking water standard of 50(ppb) arsenic (O'Neil et al., 1993). Data from the USGS Storet databaseprovided by Brian Astor of the USGS Water Resources Division recordsthirty values greater or equal to 10 ppb arsenic in a dataset of over 2000analyses. The highest contents are 90 ppb (3 samples). Our studies ofstreams with elevated arsenic in sediments likewise have not detected streamwater arsenic contents above 2 ppb (Goldhaber et al., 2001), although withinthis narrow range of 0-2 ppb, the highest values do occur in acidified reachesof streams. Astor (1999) compared stream water chemistry in unmined andstrip-mined drainages in the Warrior basin. He found significant differencesin major ion chemistry between mined and unmined drainages and alsofound that on average the trace elements arsenic, copper and molybdenumwere slightly elevated in locations with active mines. But even in mineddrainages the concentrations of arsenic were low More generally,however, high arsenic contents in the range of 100 to 10,000 ppb are knownto occur in waters draining a variety of types of hard rock mines (Williams,2001)
In contrast to stream water, groundwater in the Warrior coalfield mayhave elevated arsenic concentrations. Waters produced during methanerecovery from coal (n=28) were found to have a mean arsenic content of 25ppb with a maximum of 475 ppb (O'Neil et al., 1993). These productionwaters are typically saline and not potable. However, the presence ofelevated arsenic in the deep groundwater samples indicates that arsenic maybe mobilized from the coal into solution. Shallow drinking-water wells inthe Warrior coalfield are lower in arsenic than the production waters, havinga mean of 2 ppb and a maximum of 44 ppb (n=35)(O'Neil et al., 1993). Thehighest of these arsenic contents exceed the present drinking water standardand indicate the potential for at least isolated arsenic contamination.
6. ADDITIONAL EXAMPLES OF LARGE FLUIDFLOW SYSTEMS
Although we have focused on two specific large fluid-flow systems inthis paper, there are other examples. The world class Silesia-Cracow zinc-lead MVT district of southern Poland formed in a structural settinganalogous to the ores of the U.S. midcontinent, and likely formed by a largescale gravity-driven fluid flow system (Leach et al., 1997). Interestingly,

164 Chapter 5
high concentrations of arsenic in the Polish ores (up to 2000 ppm) occur insphalerite (Leach et al., 1997).
The Carlin-type gold (arsenic, antimony, mercury) deposits in the Basinand Range Province of the southwestern United States contain abundantarsenian pyrite as well as lesser amounts of the arsenic sulfides orpiment
and realgar (AsS) (Hofstra and Cline, 2000; Stenger et al., 1998).The mineralization in northern Nevada is associated with significantenrichment of arsenic in stream sediments of the region (Kotlyar et al.,1998), and groundwater (Welch et al., 1988: Welch and Lico, 1998). Thedeposits may form from metamorphic fluids with a subordinate input ofmagmatic fluid (Hofstra and Cline, 2000), or alternatively, by large-scalecirculation of meteoric fluids over distances of hundreds of kilometers(Berger et al., 1998; Ilchik and Barton, 1997). In either case, the potentialexists for large blocks of the crust to have been enriched in arsenic by orefluids.
Another example is to be found in the South Wales coalfield of theBritish Isles. This coalfield is in a foreland basin, and thus occupies thesame structural-tectonic setting as the Appalachian Basin. There are otheranalogies to the Appalachian Basin as well. There is good evidence that hotfluids migrated through this coalfield leading to thermal alteration of the coal(Gayer et al., 1991). Furthermore, the hydrothermal alteration has resultedin enrichment in gold (Gayer, 1994) and arsenic (Gayer et al., 1999).Additional examples of coal alternation by hydrothermal fluids leading tosubstantially increased arsenic contents are to be found in Bulgaria(Eskenazy, 1995), Turkey (Karayigit et al., 2000), and China (Belkin andAnonymous, 1998). Gold-arsenic mineralizing fluids have alteredintramontaine coalfields in the Massif Central, France (Copard et al., 2000).
ACKNOWLEDGEMENTS
We would like to dedicate this paper to Terry Offield who providedsignificant insights into the geology of Alabama, but who passed awayduring an early stage of the study. We would like to thank John Slack, HalGluskoter, and Elizebeth Rowan for reviewing an earlier version of themanuscript. Greg Meeker assisted with electron microprobe studies, andSharon Fay Diehl and Isabelle Brownfield assisted with scanning electronmicroscope studies.

Chapter 6
Arsenic in ground water used for drinking water inthe United States
Sarah J. RykerU.S. Geological SurveyPresent address: Carnegie Mellon University
The U.S. Environmental Protection Agency recently established a newmaximum contaminant level of 10 micrograms per liter for arsenic indrinking water in the United States. Ground water is the primary source ofdrinking water for half the population of the United States. Several nationalassessments have found that high arsenic concentrations (above 10micrograms per liter) are widespread in drinking-water aquifers in thewestern United States, the Great Lakes region, and New England. Moderateto high concentrations were identified in ground water in parts of the centraland southern United States. This chapter summarizes national trends in theuse of ground water as drinking water, and national estimates of arsenicoccurrence in potable ground water. The chapter also briefly describesseveral studies on arsenic in specific settings and water-use scenarios; thesestudies illustrate by example the potential power of a regional approach tounderstanding and managing arsenic in drinking water.
1. INTRODUCTION
Arsenic above 10 micrograms per liter is found in potable ground-waterresources in many parts of the world (Nriagu, 1994; WHO, 1993). In theUnited States, widespread high concentrations of arsenic in ground water
have been documented in drinking-water aquifers in the West,the Great Lakes region, and New England. Moderate to high concentrationshave been found in parts of the central and southern United States. Incontrast, widespread high concentrations of arsenic are relatively uncommonin surface water (Federal Register, 2001; Lockwood et al., 2001; Welch etal., 2000). A few notable exceptions occur where ground water makes asignificant contribution to surface-water flow; where surface water has anunusually high pH; or in drainages from geothermal areas (Welch et al.,

166 Chapter 6
2000). While somewhat unusual, these situations can have implications fordrinking-water quality, particularly in the western United States (Frey andEdwards, 1997; Lockwood et al., 2001). However, this chapter focuses onarsenic in potable ground water as the area of greatest concern for most ofthe United States.
2. GROUND WATER AS DRINKING WATER
Half the population of the United States relies on ground water fordrinking water (Figure 1). In 2000, more than 100 million people (over 35percent of the population) were served by public water supply systems usingground water, and more than 40 million people (over 15 percent of thepopulation) used self-supplied ground water, predominantly from privatedomestic wells (Solley et al., 1998; U.S. Environmental Protection Agency,2001).
Many large public water supply systems use substantial amounts ofsurface water, while smaller or intermittent-use public systems and domesticsystems are generally much more dependent on ground water. Public watersystems serving at least 25 people are divided into three main classes.Community water systems (CWS) provide water to the same populationyear-round. As of 2000, over 80 percent of CWS rely on ground water;thirty-three percent of the total population served by CWS receives waterfrom these ground-water-dependent systems. Non-transient non-communitywater systems (NTNCWS; e.g. schools, factories, office buildings, andhospitals) provide water to the same population for at least six months peryear; 87 percent of this population relies on ground water. Transient non-community water systems (TNCWS; e.g. gas stations and campgrounds)provide water to transient populations; 98 percent of the water provided bythese systems comes from ground water (U.S. Environmental ProtectionAgency, 2001). About 99 percent of the rural population drink self-suppliedground water, generally from private domestic wells serving individualhouseholds or clusters of up to 10 homes (Carlson, 1999; Solley et al., 1998).
Water-use estimates from several different sources indicate that groundwater is increasingly important for drinking water in the United States.Many areas of population growth are increasingly making use of groundwater for drinking water (Carlson, 1999; Perry and Mackun, 2001; Solley etal., 1988; Solley et al., 1998; U.S. Bureau of the Census, 1999). In 1950,twenty-six percent of water withdrawals for public supply came from ground(Dziegielewski et al., 2002; Solley et al., 1988; Solley et al., 1998). Some of

6. Arsenic in ground water used for drinking water in the UnitedStates
167
this change corresponds with population shifts toward the southern andwestern United States, areas already dependent on water. By 1995, thirty-seven percent of water withdrawals for public supply came from groundwater ground water; from 1960 to 1995, the greatest increases in public

168 Chapter 6
supply withdrawals were in Nevada, Arizona, Florida, Georgia, California,and Texas (Dziegielewski et al., 2002). Some of the increase in publiclysupplied ground water may also be explained by the expansion of rural watersystems; the rate of conversions from private wells to piped water increasedmore than threefold during the 1980s and 1990s (Carlson, 1999;Dziegielewski et al., 2002; U.S. Bureau of the Census, 1999).Geographic patterns have also been observed in use of self-supplied groundwater. In 1995, over half of all ground water withdrawn by domestic wellscame from 13 states: Florida, Michigan, Pennsylvania, North Carolina, NewYork, Ohio, Texas, Illinois, Washington, Virginia, California, Indiana, andGeorgia (Dziegielewski et al., 2002; Solley et al., 1998). In denselypopulated regions such as New England, population growthappears to belargely in rural areas and outlying suburbs, with a corresponding increase indomestic use of ground water (Solley et al., 1988; Solley et al., 1998; U.S.Bureau of the Census, 1999). Nationally, between 1970 and 1990 thenumber of people supplied by private wells increased by 36 percent (U.S.Bureau of the Census, 1999), and during the 1990s alone, domestic welldrilling increased by about 35 percent (Carlson, 1999). Carlson (1999) hasalso noted an apparent increase in small water systems serving clusters of 3-10 households; these systems are too small to be regulated as communitywater systems and so may be considered private domestic wells.
3. NATIONAL ESTIMATES OF ARSENICOCCURRENCE IN DRINKING WATER
Arsenic is found in all types of ground-water supplies. Several recentestimates have been made of the number of public supply systems likely toexceed various concentrations of arsenic. Four primary national-, state-, andmulti-state-scale datasets have been used as a basis for these estimates. TheUSEPA maintains the federal Safe Drinking Water Information System(SDWIS), which in 1999 included 44,087 ground-water public supplysystems in fifty states. In addition, the USEPA has compiled a dataset ofcompliance monitoring samples of finished water from both ground-waterand surface-water public supply systems in 25 states. These samples aregenerally of finished water, which may have been treated for a variety ofcontaminants before delivery to the consumer (Federal Register, 2001),although Frey and Edwards (1997) found that as of 1995, 65 percent ofground-water public supply systems had implemented no treatment expectedto reduce arsenic. In 1984, the National Inorganics and RadionuclidesSurvey (NIRS) analyzed finished water from 270 public water supply wellsin 49 states (all but Hawaii) and Puerto Rico (Longtin, 1988). In 1995, the

6. Arsenic in ground water used for drinking water in the United States
169
National Arsenic Occurrence Survey (NAOS) sampled raw water fromapproximately 270 public supply wells in all 50 states, and predicted arsenicconcentrations in finished water based on known treatments implemented bythe systems (Frey and Edwards, 1997). Frey and Edwards (1997) alsoprovided national estimates based on reexamining the NIRS data and adataset of finished water from 60 large systems (serving >10,000 people)sampled by the Metropolitan Water District of Southern California (Davis etal., 1994). In 1973 to 1997, the USGS analyzed for arsenic in 18,850 raw-water samples from wells in 49 states (all but Hawaii) and Puerto Rico; thisdataset included 2,262 samples from public supply wells (Focazio et al.,2000). Several older national surveys of arsenic have been described indocuments prepared for the USEPA (ISSI Consulting Group et al., 2000).
The most common approach to creating national estimates has been tosummarize or model percentiles of arsenic concentration found in theseexisting datasets. The resultant rates of exceedance are then applied either toall ground-water public supply systems in the areas and aquifers representedin the dataset (Focazio et al., 2000), or to the entire population of publicsupply systems in the United States (Federal Register, 2001). Lockwood etal. (2001), Zhang et al. (2001), Gurian et al. (2001a), and others developedregression models based on additional explanatory variables and accountingfor intra-source and intra-system variability. Several of the datasets used inthese various efforts, and the resultant national estimates, are summarized inTable 1.
Also described in Table 1 and Figure 2 is a dataset of over 31,000ambient (raw) samples collected from individual ground-water sources bythe USGS and by state agencies. These raw-water samples provide aconsistent national overview of where widespread high arsenicconcentrations have been identified in ground water, but do not necessarilyrepresent exactly what the population is drinking in any given region.Ninety-nine percent of self-supplied drinking water comes from individualdomestic wells (Solley et al., 1998). At a national scale, therefore, raw-water samples are generally representative of the water consumed bydomestic well owners. Interpreting raw-water data is more complicated forpublic water supply systems, which may take water from a single source(e.g. an individual well or surface-water intake), or may blend water frommultiple sources. Multiple-source systems may include both surface waterand ground water sources, and may change their sources over time—bothseasonally, in response to short-term climate fluctuations, and over periodsof years, in response to evolving demand for water. Based on the makeup ofthe raw-water dataset and on comparisons between USGS public-supplydata, USGS data from all types of wells, and NAOS public-supply data(Focazio et al., 2000), the raw-water samples appear to be representative of

170 Chapter 6
arsenic concentrations in institutional supply wells, and in the untreatedground water used by public supply systems in many settings. For largerpublic supply systems, raw-water samples may serve primarily to highlightregions where blending or treatment of existing water sources, and carefulsiting of future water sources, may be indicated.
The national-scale analyses summarized in Table 1 were based ondisparate datasets and approaches, but produced generally similar estimatesof arsenic concentration. Many of the differences between the estimatesmay result from differences in the sampling and measurement techniquesrepresented by the underlying datasets. For example, the NIRS samples andthe compliance monitoring samples compiled by the USEPA were notfiltered, while the NAOS, USGS, and state environmental monitoringsamples were generally filtered through a pore-size filter. Inaddition, laboratory measurements of arsenic tend to have relatively highanalytical variability. For ambient ground-water samples analyzed byGF/AA methods, the USGS has observed analytical variability up to ±14%

6. Arsenic in ground water used for drinking water in the United States
171

172 Chapter 6
in analysis of identical spike samples; variability appears lower for ICP/MSmethods (Garbarino, 1999; Hinkle and Polette, 1999; Long and Farrar,1995). The current arsenic rule (Federal Register, 2001) permits a numberof analytical techniques for compliance monitoring samples, and establishes±30% as acceptable for future compliance monitoring data. The ambientground-water samples collected by the USGS were quantified down to
while the ambient ground-water samples collected by state agencieswere quantified down to between and approximately 35percent of the ambient data are reported only as less than some reportinglimit. Similarly, the NAOS samples were analyzed by ICP/MS;approximately 36 percent of the NAOS data were reported asThe state compliance-monitoring samples compiled by the USEPA wereanalyzed by a variety of techniques authorized under 40 CFR 141.23, withreporting limits typically between and In the NIRS data, thereporting limit is
Other fundamental differences affect the estimates in Table 1. Theexceedance rates estimated by the USEPA (Federal Register, 2001) and byLockwood et al. (2001) are for whole public-supply systems, which mayinclude multiple sources of water. All other estimates in Table 1 areexceedance rates for individual ground-water sources. In a model of blendedwater from four states’ compliance monitoring data, Zhang et al. (2001)demonstrated that system-based exceedance estimates are likely to beslightly lower than source-based exceedance estimates. Furthercomplicating comparisons, only the estimates by Lockwood et al. (2001),Gurian et al. (2001b), and an earlier analysis performed for the USEPA(Federal Register, 2001), incorporated intra-well and intra-systemvariability. The final USEPA estimates are based on the mean concentrationfor all sources within each system, while all other estimates in Table 1 usedthe single most recent value available for each well.
3.1 Regional variations
These national summaries provide a general overview of where arsenicmay be an issue in drinking water. However, national analysis can beconfounded by regional variations in explanatory factors including water-usepatterns, well construction, aquifer characteristics and local geochemistry,and temporal variability. Such discrepancies can make national estimatesdifficult to apply locally. Estimates on a regional or state-by-state basis havebeen published by the USEPA (Federal Register, 2001), Focazio et al.(2000), Frey and Edwards (1997), and Lockwood et al. (2001). These moredetailed analyses, along with additional information on local aquifer systemsand water sources (e.g. specific aquifers), provide more refined descriptionsof arsenic concentrations in drinking water.

6. Arsenic in ground water used for drinking water in the UnitedStates
173
3.2 Variation by type and size of water supply
Several of the national analyses described in Table 1 are also available bypublic-supply system size (population served); these system-size-basedestimates have been important in cost-benefit analysis for the new arsenicrule (Federal Register, 2001). However, consistent relationships betweensystem size and raw-water arsenic concentration are not well established ona national basis. The USEPA (Federal Register, 2001) found no consistentdifferences in mean arsenic concentration by system size, while Frey andEdwards (1997) found higher arsenic concentrations in public supplysystems serving over 10,000 people than in systems serving 1,000 to 10,000people. Lockwood et al. (2001) examined both absolute population-servedestimates and categories of system size, and found that size-baseddifferences in concentration were not nationally consistent but were greatestamong large systems in the western United States.
System size may represent a combination of factors such as well capacity(pumping rate), ground-water contributing area, usage patterns, well drillingand maintenance practices, and the system’s resources in selecting andtreating water sources. Such factors have been shown to influencevulnerability to anthropogenic contaminants, but the relationships betweenthese factors and natural contaminants are highly dependent on localconditions (Franke et al., 1997; Hinkle and Polette, 1999). For example,Bruce and Oelsner (2001) report that in the Ogallala aquifer of the centralUnited States, larger-diameter, higher-pumpage wells tend to take in waterfrom a larger contributing area, resulting in higher concentrations ofanthropogenic contaminants; but that increased pumping does not appear toaffect concentrations of natural contaminants such as arsenic. In parts ofMinnesota, Wisconsin, and Ohio, however, larger-diameter public supplywells appear to alter geochemical conditions in the vicinity of the well,creating pockets of more highly oxygenated water with correspondinglylower concentrations of iron, manganese, and arsenic (Minnesota PollutionControl Agency, 1998; Ohio Environmental Protection Agency, 2001b;Riewe et al., 2000).
3.3 Variation by aquifer
In eastern New England, analysis of arsenic occurrence by aquifer typefinds that arsenic concentrations are typically lower in glacial aquifers thanin bedrock aquifers (Ayotte et al., 1999). Arsenic concentrations are alsogenerally lower in public supply wells than in domestic wells, and lower inhigher-pumpage wells than in smaller systems. However, Ayotte et al.

174 Chapter 6
(1999) do not conclude that large public supply wells are inherently lesslikely to take in high-arsenic ground water. Ayotte et al. (1999) examinedwater use patterns by aquifer and found that aquifer type was the dominantfactor, rather than well type. In eastern New England most public supplywells draw water from higher-yielding, lower-arsenic sand-and-gravelglacial materials, while domestic wells are typically cased through theglacial materials and draw their water from low-yielding, high-arsenicbedrock aquifers. A small but growing number of public supply wells(particularly in small systems) do tap bedrock aquifers; in terms of arsenicconcentration, these bedrock public supply wells are more similar to bedrockdomestic wells than to glacial-deposit public supply wells (Ayotte,Montgomery, et al., in draft, 2002; Ayotte et al., 1999). In this type ofsetting, arsenic occurrence estimates based on a mixture of data fromdifferent aquifers may overestimate the amount of arsenic in wells tappingglacial aquifers, and underestimate the amount of arsenic in wells tappingbedrock aquifers.
Water system types and sources are similarly differentiated in parts of thewestern United States. On a percentage basis, for example, both Oregon andNevada are highly urbanized, with at least 70 percent of each state'spopulation concentrated in urban centers that rely primarily on surface water(Bevans et al., 1998; Wentz et al., 1998). However, in terms of absolutenumbers of people, both states have substantial rural populations that relyalmost entirely on ground water. In Oregon, a total of 1.4 million peoplerely on ground water for their drinking water; rural domestic wells accountfor over 70 percent of this ground-water usage (Solley et al., 1998). Highconcentrations of arsenic (up to 2,000 ug/L) are found in wells in areas ofOregon where bedrock is exposed or near the land surface, and where wellstap several areally extensive volcanic formations (Hinkle and Polette, 1999).
Ground water in parts of Nevada contains some of the highest knownarsenic concentrations in natural ground-water systems in the United States(Welch, 1994; Welch et al., 1997; Welch et al., 1988). In the past, arsenic indrinking water was of greatest concern in small communities where ruraldomestic wells tapped high-arsenic aquifers. However, since 1990 Nevadahas seen greater population growth than any other state (Perry and Mackun,2001). Accompanying this growth, Nevada communities have greatlyincreased ground-water withdrawals for both public water supply and ruraldomestic supply (Dziegielewski et al., 2002; Solley et al., 1988; Solley et al.,1998). Thus, arsenic may become a concern for larger population centers.
In parts of Minnesota, Illinois and Ohio, in contrast, domestic and public-supply wells commonly tap the same aquifer systems. In these states,arsenic is typically higher in the heavily used glacial aquifers than inbedrock aquifers. More than 70 percent of Minnesotans rely on groundwater for drinking water, primarily from glacial aquifers in western and

6. Arsenic in ground water used for drinking water in the UnitedStates
175
central Minnesota and from bedrock sources in southeastern Minnesota andthe Twin Cities metropolitan area (Minnesota Pollution Control Agency,1998). Within the Lower Illinois River Basin, close to 75 percent of thepopulation relies on glacial deposits for drinking water (nearly half thepopulation via ground-water community water systems, and an additional 25percent via domestic wells) (Warner, 1998). In Ohio, close to half thepopulation relies on ground water for drinking water (30 percent from publicsupplies, and 20 percent from domestic wells) (Ohio EnvironmentalProtection Agency, 2001b; Solley et al., 1998). Glacial deposits of sand andgravel are used for public supply in metropolitan areas of southwestern Ohio(e.g. Dayton, Columbus, and Cincinnati). Within Illinois and Ohio’s glacialaquifers, arsenic is especially high at greater depths; near buried valleydeposits; and east of the Illinois River (Ohio Environmental ProtectionAgency, 2000, 2001a; Slattery et al., 2000; Warner, 1998, 2001). In all threestates, arsenic concentration appears to depend on a combination of welltype and construction, the aquifer tapped, and the position of the well withinthe aquifer.
3.4 Variation over time
Temporal variability can complicate comparisons of data from differentregions and time periods. The geochemistry of the ground water passingthrough the aquifer, and the mineralogic composition of the surroundingaquifer materials, play important roles in determining concentrations ofarsenic in ground water (Hem, 1985; Rogers, 1989). In general thechemistry of ground-water systems is slow to change; over time periods ofweeks to decades, natural processes alone are unlikely to cause significant,widespread upward or downward trends in arsenic in ground water.(Exceptions occur near the surface of the water table where water levels canfluctuate seasonally or even daily, or in regions where seasonal variations indischarge strongly affect the water table.) Supporting this, several regionalstudies in North America have found that arsenic concentrations in groundwater are relatively stable over periods of weeks to years (Alberta Healthand Wellness, 2000; Ayotte et al., 2001; Focazio et al., 2000; Grantham andJones, 1977; Hinkle and Polette, 1999; Karagas et al., 2001; Ryan et al.,2000). However, human influences result in significant exceptions in someregions of the United States.
Anthropogenic influences over arsenic in ground water may act at avariety of scales. As discussed above, the construction and usage patterns ofa well may have a highly localized effect on arsenic concentrations in thevicinity of the well. This well-scale influence is highly dependent on localmineralogy and water chemistry, and can be obscured by pumping patterns

176 Chapter 6
that may or may not relate to the region’s seasonal hydrologic cycle (Chen,2001). For example, irrigation wells and vacation-home domestic wells maygo unused for months at a time, while public supply systems may increaseground-water pumping when reservoirs are low.
Similar mechanisms may act at a regional scale—widespread humanalteration of the natural ground-water system may alter ground-watergeochemistry across a large area. For example, in several arid agriculturalregions of the western United States, decades of intensive irrigation haveeither raised (Bauer and Vaccaro, 1990; Welch, 1998) or lowered (Cordy etal., 1998; Dennehy et al., 2002) the regional water table. A similar potentialinfluence is the increasing use of ground water in many areas of populationgrowth (see figure 1).
Wisconsin’s use of ground water has increased steadily since 1950;between 1985 and 1995, the state’s population grew by 24 percent whileground-water withdrawals for public supply doubled (Solley et al., 1988;Solley et al., 1998). Approximately 70 percent of Wisconsin residents nowrely on ground water; this figure includes about 800,000 domestic wells(Wisconsin Department of Natural Resources, 1999). Two major aquifers,the St. Peter Sandstone and the overlying Platteville/Galena Dolomite,supply most domestic wells and many public supply systems in the state’smore densely populated areas (Burkel and Stoll, 1999). Use of theseaquifers is expected to increase through the year 2015; about 1,000 newwells are drilled every year in Winnebago and Outagamie Counties(Wisconsin Department of Natural Resources, 1997). These areas’ increasedconsumption of ground water has decreased recharge to the underlyingdrinking-water aquifers (Axness et al., 2002; Steuer and Hunt, 2001;Wisconsin Department of Natural Resources, 1997). Recent studies indicatethat the falling water table may have oxidized shallow aquifer materials,mobilizing arsenic from sulfide minerals into ground water (Burkel andStoll, 1999; Riewe et al., 2000). Some arsenic is also found in water fromdeeper Cambrian sandstone aquifers, which are commonly used by publicsupply systems but are less impacted by changing water-use patterns (Burkeland Stoll, 1999; Riewe et al., 2000).
Anthropogenic influences over arsenic concentration may also act at alocal scale, affecting an area larger than a well’s immediate contributing areabut smaller than the regional ground-water flow system. These localinfluences may provide an anthropogenic source of arsenic, or may alterlocal geochemistry to mobilize arsenic from aquifer sediments into groundwater. In agricultural areas, historical use of arsenical pesticides anddefoliants may have increased arsenic concentrations in soils (Aurelius,1988; Chormann, 1985; D'Angelo et al., 1996; Frost et al., 1993; Peryea,1998). Studies in the central United States have not documented effects onarsenic concentrations in ground water; it may be that this arsenic remains

6. Arsenic in ground water used for drinking water in the UnitedStates
177
bound up in surficial soils (Welch et al., 2000). In other settings, agriculturalpractices such as the application of phosphate fertilizers may mobilizearsenic from soils into shallow ground water (Barringer et al., 2001; Peryeaand Kammereck, 1997). However, there is little evidence that suchmechanisms commonly influence water quality beyond the field scale(Welch et al., 2000).
Other local influences may include point sources such as Superfund sites,which in parts of the northeast appear to both provide an anthropogenicsource of arsenic, and also mobilize naturally occurring arsenic into groundwater (Welch et al., 2000). Mining operations and geothermal influencesmay similarly mobilize arsenic into ground water and create high variabilityin concentration within a small area (Mok et al., 1988; Paschke et al., 2001).Fortunately, such sites are not commonly used as drinking-water sources.
4. FURTHER RESEARCH
National-scale summaries of existing arsenic data have been useful inidentifying areas with widespread high arsenic in drinking water, and incost-benefit analysis for the new maximum contaminant levels for arsenic(Federal Register, 2001). In some areas of the United States, additionalregional- and local-scale research has helped develop practical guidance onavoiding or reducing arsenic in ground water. For example, in Minnesotaand Wisconsin regional studies have identified areas with high-arsenicground water and high usage of ground water as drinking water, whilegeochemical studies have provided more detailed understandings of localsources of arsenic and mechanisms of release of arsenic into ground water(Burkel and Stoll, 1999; Cannon et al., 1998; Kanivetsky, 2000; MinnesotaDepartment of Natural Resources, 2000; Minnesota Pollution ControlAgency, 1998; Pelczar, 1996; Riewe et al., 2000; Schreiber et al., 2000;Wisconsin Department of Natural Resources, 1997), In 1996 the WisconsinDepartment of Natural Resources designated an Arsenic Advisory Area inparts of two counties near the Lower Fox River Valley. Within the AdvisoryArea, although most wells yield low-arsenic water, extremely highconcentrations (up to have been detected in domestic wells,monitoring wells, and public supply wells. While it is not possible to predictexactly which wells in the region will yield high-arsenic water, the state hasestablished guidelines for well construction within the Advisory Area, basedon what is understood about the distribution of natural sources of arsenic andmechanisms of release into ground water (Burkel and Stoll, 1999; Schreiberet al., 2000).

178 Chapter 6
Regional studies also seem indicated in addressing arsenic in privatedomestic wells. Domestic wells are typically owned by individualhouseholds, and are not regulated or monitored under the Safe DrinkingWater Act (U.S. Environmental Protection Agency, 2002). However,domestic water quality is an increasingly important issue in the UnitedStates. In 1995, ninety-nine percent of rural drinking water came from self-supplied ground water (Solley et al., 1998; U.S. Bureau of the Census,1999), and this type of domestic ground-water use is increasing; about366,000 new domestic wells are drilled each year (Carlson, 1999). Inaddition, the population served by private wells may be more vulnerable towater contamination than the population served by public water supplies.Many private well owners are unaware of contamination issues, or areunable to finance either treatment of an existing water source or new drillingto replace a source. The lack of national regulation means that there is nocomplete national database of domestic water quality data. The raw-waterdataset compiled by the USGS (see Table 1) is large, but does not providecomprehensive coverage for all parts of the United States. Local efforts,incorporating information from state and local agencies, are critical to assessarsenic exposure in rural populations, and to identify areas of low-arsenicground water for future use.
5. DATA SOURCES
Maine Department of HealthMassachusetts Department of Environmental ProtectionMinnesota Pollution Control Agency, 1998, Ground Water Monitoringand Assessment Program,
http://wwww.pca.state.mn.us/water/groundwater/gwmap/gwbaseline.htmlNew Hampshire Department of Environmental ServicesRhode Island Department of HealthTexas Water Development Board,
http://www.twdb.state.tx.us/data/waterwells/well info.htmlU.S. Geological Survey, National Water Information System,
http://water.usgs.gov/nwis/U.S. Environmental Protection Agency, Safe Drinking Water InformationSystem (federal version),
http://www.epa.gov/safewater/sdwisfed/sdwis.htmWisconsin Department of Natural Resources, Drinking Water System,
http://www.dnr.state.wi.us/org/water/dwg/DWS.htm

Chapter 7
Arsenic in groundwater – south and east Asia
Pauline L SmedleyBritish Geological Survey, Maclean Building, Wallingford, Oxfordshire, OX10 8BB, UK
Naturally-occurring high arsenic concentrations are a recognised problem ingroundwater from many regions of eastern Asia, including parts ofBangladesh, West Bengal (India), China, Vietnam, Taiwan, Thailand andNepal. A small number of tubewells with high arsenic concentrations havealso been found in Pakistan, Myanmar and Cambodia, although sampling inthese areas is so far limited and the scale of potential problems is uncertain.Chronic arsenic-related health problems are recognised in some, though notall, of these regions. The high-As groundwaters in eastern Asia typically occurunder strongly reducing conditions in young, Quaternary, aquifers in alluvialand deltaic sediments. Under such conditions, arsenic is commonlyaccompanied by high concentrations of iron, manganese and ammonium andlow concentrations of nitrate and sulphate. Arsenic speciation is variable butthe element occurs principally as arsenite. High alkalinity values andphosphorus concentrations are also often a feature of the high-Asgroundwaters. Although high concentrations of dissolved humic matter arealso found in some groundwaters from Inner Mongolia (China) and Taiwan,they are not observed in all regions. A notable exception to these conditions isthat of the Ron Phibun area of Thailand. Here, localised arsenic contaminationof surface and shallow groundwaters is due to the oxidation of arsenopyrite inan area impacted by former tin mining operations. These groundwaters tend tobe more oxidising with relatively low iron concentrations, higher sulphate andwith arsenic present more typically as arsenate, although high manganeseconcentrations occur in some. High concentrations of aluminium, cadmiumand zinc are also observed in the worst-affected waters from the area. Muchhas been learned about the scale, distribution and causes of arseniccontamination in Asian aquifers over the last few years. However, still manyuncertainties remain over the areas affected and the precise mechanismsinvolved. Doubtless, other areas with contaminated groundwater will bediscovered in future, but an appreciation of the aquifers most at risk and thecommon indicators of likely arsenic contamination should help to identify newareas more quickly and promote more rigorous water testing during wellinstallation programmes.

180
INTRODUCTION
Chapter 7
1.
The recent revelation of the serious incidence of chronic arsenicpoisoning in Bangladesh and West Bengal from the long-term use ofgroundwater bearing naturally high arsenic concentrations has come as ashock to water providers, users and scientists alike. However, investigationsparticularly over the last few years have shown that the Bengal Basin is notunique. Many documented cases of arsenic problems in aquifers have nowbeen identified in various parts of the world. A large number of these are inAsia and certainly Asia has the worst cases of arsenic-related healthproblems known in terms of patients affected and populations exposed.Despite this concentration of cases, the occurrences of high-arsenicgroundwaters are constrained to a restricted range of geological,hydrogeological and geochemical conditions in aquifers, rather than being a‘general’ problem. Recent investigations of a number of affected aquifers inAsia have led to a better understanding of the controlling conditions underwhich As problems occur. However, much remains unknown about both thescale and precise causes of the groundwater contamination. Much of theavailable information for Asian aquifers is found within unpublished reportsby various agencies and hence is difficult to access and is typically notreviewed. This chapter provides a summary of the information currentlyavailable on recognised problem areas in Asia and an overview of currentunderstanding of the principal hydrogeochemical controls on arsenicmobilisation. It is likely that other areas with high groundwater-arsenicconcentrations will be discovered in the coming years. These are likely to beon a smaller scale than those already identified because of the lessonslearned from recognised areas. However, uncertainties still remain in someremote or politically unstable regions where lack of access makesassessments of potential problems difficult. For most areas, targetedscreening of ‘at risk’ aquifers, together with health surveillance given animproved knowledge of the symptoms of chronic arsenic poisoning, willboth aid in the rapid identification of new areas.
The chapter discusses the incidence of As contamination in majoraquifers in Asia that are typically used for potable supply by large numbersof people. Although As contamination is also documented in areas affectedby sulphide mining or mineralisation (e.g. Malaysia, Breward and Williams,1994; Korea, Woo and Choi, 2001), geothermal areas (e.g. Japan, Yokoyamaet al., 1993) and occasionally as a result of industrial contamination (Japan,Tsuda et al., 1992), these tend not to be used directly for potable supply orare of localised extent and have not such a major and widespread impact onhuman health. They are therefore not discussed in this chapter. The RonPhibun case of southern Thailand is a notable, though local, exception.

7. Arsenic in groundwater – Eastern Asia 181
The World Health Organisation (WHO) guideline value for arsenic indrinking water was reduced provisionally to in 1993 and otherwestern countries have made moves to reduce national standards similarly.Despite this, national standards for As in most Asian countries (exceptJapan) remain at the pre-1993 WHO guideline value of This isborne partly out of analytical constraints, partly out of confusion over theappropriate value to use, and in some countries out of difficulties withcompliance. ‘High-arsenic’ groundwaters discussed in this chapter aredefined as those with arsenic concentrations greater than the value(Fig. 1; Table 1).

182 Chapter 7
2. DOCUMENTED PROBLEM AREAS
2.1 Bangladesh
Of the regions of the world with groundwater arsenic problems,Bangladesh is by far the worst case identified, with some 35 million peoplethought to be drinking groundwater containing As at concentrations greaterthan (Table 1) and some 57 millions drinking water with more than
(Gaus et al., 2001). The large scale of the problem reflects the largearea of affected aquifers, the high dependence of Bangladeshis ongroundwater for potable supply and the large population accumulated in thefertile lowlands of the Bengal Basin.
The affected aquifers are Quaternary alluvial and deltaic sedimentsassociated with the Ganges-Brahmaputra-Meghna river system which covera major part of Bangladesh. Groundwater from these aquifers contains As atconcentrations up to around (Smedley et al., 2001b). Several

1837. Arsenic in groundwater – Eastern Asia
surveys of the groundwater have shown a highly variable distribution of As,both laterally and with depth, although highest concentrations are generallyfound in the south-east of the country (Fig. 2) and concentrations appearhighest in shallow tubewells with depths in the range 15–30m (seeKinniburgh et al., this volume, for a summary of the British GeologicalSurvey and Department of Public Health Engineering, BGS and DPHE,2001 groundwater survey of Bangladesh). Although often not detected ingroundwater surveys with the density of that carried out by the BGS andDPHE survey, some areas with low overall As concentrations have localised‘hotspots’with high As concentrations. That of the Chapai Nawabganj areaof western Bangladesh is a notable example (Fig. 2), where the medianconcentration in groundwater from Holocene sediments was found to be
but with extremes up to concentrated in a small area ofaround 5 x 3 km. Table 2 shows the frequency distribution of Asconcentrations in sampled groundwaters from the three study areas shown inFigure 2.
Groundwater from aquifers in older (Pleistocene) sediments such as thoseof the Barind and Madhupur Tracts (north-central Bangladesh) generallyhave low As concentrations often significantly less). Lowconcentrations are also generally found in groundwaters from the coarsersediments of the Tista Fan of northern Bangladesh and the large majority ofanalysed groundwaters from deep aquifers (>150 m) which are exploited innorth-east Bangladesh (Sylhet) and the southern coastal area (Kinniburgh etal., this volume).
Summary statistics for groundwater chemical compositions from thethree study areas of Chapai Nawabganj, Faridpur and Lakshmipur are givenin Table 3. Groundwaters from the Quaternary (mainly Holocene)alluvial/deltaic sediments are predominantly strongly reducing. Groundwaterfrom the three study areas has typically high concentrations of Fe (up to amaximum of percentile Mn (up to
percentile and (up to percentile

184 Chapter 7
and with low concentrations of and (each commonlyDissolved oxygen is generally not detected, while dissolved
organic carbon concentrations reach up to ( percentile up toTable 3). Dissolved As occurs dominantly as As(III) (Smedley et
al., 2001b). Concentrations of and P are also characteristically high,analysed samples having maxima of and respectively.Halcrow and DHV (1995) found groundwater conditions to be generally lessreducing in the aquifers of northern Bangladesh where sediment grain size ispredominantly coarser. This is likely to be a contributory factor indetermining the distributions of As in the groundwaters nationally.
Available data for As in sediments from Bangladesh, including thosebearing high-As groundwaters, show the concentrations of As to be similarto, or even less than, those for average sediments which are typically in therange (Smedley and Kinniburgh, 2002). Pearce et al. (2001)found concentrations in the range (median ) for21 sediment samples from the three study areas given in Figure 2 (ChapaiNawabganj, Faridpur, Lakshmipur). Foster et al. (2000) found Asconcentrations in the range in a sediment profile fromBrahmanbaria in north-east Bangladesh, although a concentration of
was found in an iron-rich clay layer. Datta and Subramanian(1997) also reported As concentrations in the range inmodern river sediments from the Ganges, Brahmaputra and Meghna riversystems. The concentration ranges suggest that it is the geochemicalconditions in the aquifers that maintain the high dissolved As concentrationsrather than the presence of high-As source rocks.
Several Bengali workers have proposed that the As contamination ofgroundwater in Bangladesh is due to the oxidation of pyrite in the aquifers,brought about by overabstraction of groundwater over the last few decadesas a result of increased irrigation demands (e.g. Das et al., 1996; Mandal etal., 1996). While this is a plausible mechanism for As release, the stronglyreducing groundwater chemistry with low dissolved concentrations andthe lack of evidence for significant seasonal groundwater drawdown in theworst-affected areas of Bangladesh make the pyrite oxidation hypothesisunconvincing. Although sulphide minerals have been identified, albeitrarely, in some alluvial sediments from Bangladesh, this does not provideevidence for pyrite oxidation as an important mechanism of As release.Indeed, sulphide minerals are an expected product of sulphate reductionunder the strongly reducing conditions. Alternative mechanisms, includingreductive dissolution of iron oxides (Nickson et al., 1998) and coupledreduction and desorption of As from iron oxides (BGS and DPHE, 2001)have been proposed as the dominant mechanisms driving the Asmobilisation under the reducing aquiferconditions in Bangladesh.Phyllosilicate minerals (notably chlorite, biotite and A1 hydroxide) have

7. Arsenic in groundwater – Eastern Asia
been suggested to play an additional role in the cycling of As in theBangladesh aquifers (Breit et al., 2001).
185
186 Chapter 7
One issue of considerable uncertainty is the variation in groundwater Asconcentrations with time. Temporal variations on all scales, from hours todecades, can cause problems with compliance, require monitoring and canaffect the overall long-term viability of groundwater use nationally.Variations can be particularly critical for wells close to the accepted standardfor drinking water in Bangladesh). It is a common perception thatthe problems encountered in the Bengal Basin have become progressivelyworse with time. This is partly borne out of the hypothesis thatoverabstraction of groundwater is responsible but may also be related to theincreased testing of wells in recent years (and hence increased numbers ofwells found exceeding as well as to increased numbers ofidentified patients. Few data have so far been produced to analyse reliablythe temporal trends in As concentration in Bangladesh. Data given by(Smedley et al., 2001a) for a period up to 1 year showed minor variations butno convincing seasonal trends in As concentrations in given wells. Clearly,more well testing is needed to assess the temporal variations and the futureprognosis of groundwater quality.
West Bengal, India2.2
Endemic arsenic problems were first recognised in West Bengal in 1983(Chakraborty and Saha, 1987) though were not appreciated internationallyuntil the mid 1990s. Today, it is estimated that more than 5 million people inWest Bengal are drinking water with arsenic concentrations greater than
(Table 1).Holocene alluvial and deltaic sediments similar to those of large parts of
Bangladesh occur in the eastern part of West Bengal. Here, they form thewestern margins of the Bengal Basin. High As concentrations have beenidentified in groundwaters from some tubewells in up to eight districts ofWest Bengal, the five worst-affected being Malda, Murshidabad, Nadia, 24North Parganas and 24 South Parganas (Fig. 3). These cover around
to the east of the Bhagirathi-Hoogli river system. Arsenicconcentrations have been found in the range (Table 1;CGWB, 1999). Groundwaters from the laterite upland in the western part ofWest Bengal, as well as the Barind and Ilambazar Formations, the valleymargin fan west of the Bhagirathi river and the lower delta plain and deltafront are reported to have low groundwater As concentrations (PHED,1991).

7. Arsenic in groundwater – Eastern Asia 187

Chapter 7188
The Quaternary sediment sequence is a complex mix of unconsolidatedsands, silts and clays and the sediments contain variable amounts of organicmatter, with peat fragments being a common occurrence (CGWB, 1999).Sediment thickness generally increases southwards. Sedimentation patternsvary significantly laterally, but sands generally predominate to a depth of150–200 m in Nadia and Murshidabad while the proportion of clay increasesprogressively southwards into 24 North and South Parganas, as does thethickness of surface clay (Ray, 1997). The regional variations in sedimentlithology have a strong influence on groundwater hydrogeology as theaquifers from the northern districts (Malda, Murshidabad, Nadia and part of24 North Parganas) appear to be largely unconfined, whilst those from mostof 24 North and South Parganas are confined (Ray, 1997).
The three-dimensional configuration of the aquifers is complex. Ashallow ‘first aquifer’ has been described at 12–15 m depth, with anintermediate ‘second aquifer’ at 35–46 m and a deep ‘third aquifer’ ataround 70–90 m depth (PHED, 1991). High arsenic concentrations are notedto be restricted to groundwater from the intermediate ‘second aquifer’.Shallowest groundwaters (‘first aquifer’) appear to have low concentrations,presumably because many of the sources abstracting from this depth areopen dug wells and are likely to contain groundwater which has oxidised byexposure to the atmosphere. Groundwaters from the deep aquifer are alsoreported to have low As concentrations, except where only a thin clay layerseparates it from the overlying aquifer, such that a degree of hydraulicconnection exists between them. CGWB (1999) noted that the depths of As-rich groundwaters vary in the different districts but that where high-Asgroundwaters exist, they are generally in the depth range of 10–80 m.
As with Bangladesh, the distribution of As concentrations in thegroundwaters is known to be highly variable. Some particularly highconcentrations have been found in groundwaters from 24 SouthParganas, along the international border of 24 North Parganas and in easternMurshidabad (Acharyya, 1997; CSME, 1997).
As with many of the high-As groundwaters from Bangladesh, thegroundwaters of eastern West Bengal are strongly reducing withcharacteristically high concentrations of Fe (up to and lowconcentrations of and (each , High alkalinity values
up to commonly and low F arealso reported (CGWB, 1999; PHED, 1991). pH values are near-neutral toslightly alkaline. Salinity increases further south in the near-coastal parts ofthe aquifers as a result of saline intrusion (Adyalkar et al., 1981).

1897. Arsenic in groundwater – Eastern Asia

190 Chapter 7
Arsenic speciation studies have revealed a large range in the relativeproportions of dissolved arsenate and arsenite (e.g. Acharyya, 1997; Das etal., 1995), although arsenite typically dominates. Nag et al. (1996) found apredominance of arsenate over arsenite, but this was in Burdwan districtwhich is known not to be so badly affected by arsenic contamination andmay not be representative of the worst-affected areas.
Few time-series data are documented for the groundwaters of WestBengal and, as with Bangladesh, there remains uncertainty over whethersignificant temporal variations in As concentration occur. CGWB (1999)concluded that groundwater As concentrations vary seasonally, with minimaduring the post-monsoon period, considered to be due to dilution ofgroundwater by monsoon recharge. However, the conclusion is apparentlybased on small sample sets (4–6 samples at any given location) collectedover a short time interval (less than one year). Chatterjee et al. (1995) noteda variation of around 30% in time-series data from monitoring ofgroundwaters over the period of a year in their study of parts of 24 ParganasNorth and South, but detected no significant seasonal changes in thevariation.
Monitoring of groundwater from deep tubewells has apparently shownsome once low-As waters have experienced an increase in As concentrationwith time (e.g. Mandal et al., 1996). Few data are accessible to assess thisassertion. Changes in As concentration with time in the deep aquifer may befor a number of reasons, including vertical leakage from the shallow aquiferabove via inadequately sealed tubewells or by multiple screening in bothshallow and deep sand horizons. If such increases are occurring in somedeep tubewells, drawdown of contaminated shallow groundwater throughthin or slightly permeable clay horizons between the aquifers may also be afactor.
The sediments of West Bengal appear to contain As in similarconcentrations to those found in Bangladesh. Ghosh and De (1995) found Asin the range (median ) in sediments from 24North Parganas. PHED (1991) found sediment concentrations of <0.1–
although most were at the lower end of this range (medianEach of these studies showed the highest concentrations to be
in fine-grained sediments (clays). Thin Fe- and As-rich coatings wereobserved on sand grains in some sediments (PHED, 1991). Although themineral concerned was not identified, the coatings are likely to be ironoxide. Grains of pyrite have been found in some sediments from WestBengal, although it has not been observed as a common mineral. Aninvestigation of sediments by CSME (1997) revealed no separate As mineralphases.

7. Arsenic in groundwater – Eastern Asia 191
As with Bangladesh, the source of the As in the West Bengalgroundwaters has been disputed for some time. Many workers (e.g. Das etal., 1995; Mandal et al., 1996) claim that oxidation of pyrite or arsenopyriteis responsible through recent overabstraction of groundwater. Althoughseasonal fluctuation in groundwater levels is of the order of 2–4 m in most ofthe five worst-affected districts of West Bengal, water-level monitoringsince the early 1970s apparently shows little evidence for significant long-term changes in water level (CGWB, 1999). Groundwater abstraction isestimated to be typically less than 65% (up to 80% in a few blocks) of theannual renewable resource (CGWB, 1999; Ray, 1997) and groundwater istherefore not overexploited. Alternatively, release from iron oxides understrongly reducing conditions has been proposed as the dominant mechanismfor the As release (Bhattacharya et al., 1997). Given the redox conditions inthe aquifers of West Bengal and the many similarities with the Bangladeshaquifers, the iron-oxide reduction hypothesis appears more plausible as thedominant mechanism for As release, although the precise mechanisms of Asmobilisation in the reducing groundwater environment are still poorlyunderstood (Smedley and Kinniburgh, 2002).
2.3 Taiwan
Health problems experienced in Taiwan have been the subject of muchresearch since their initial discovery in the early 1960s and have formed thebasis of many epidemiological risk assessments over the last 30 years.Taiwan is the classic area for the identification of black-foot disease (e.g.Chen et al., 1985; Tseng et al., 1968) and other peripheral vascular disordersbut cardiovascular disease, neurological problems, diabetes and internalcancers have also been described from the area. A clear dose-responserelationship has been found for many of the disorders, including blackfootdisease and bladder cancer (e.g. Chen et al., 1985).
High-arsenic groundwaters have been recognised in two areas of Taiwan:the south-west coastal region (Kuo, 1968; Tseng et al., 1968) and the north-east coastal region (Hsu et al., 1997). Kuo (1968) observed Asconcentrations in groundwater samples from south-west Taiwan rangingbetween and (mean n=126) with half thesamples analysed havingconcentrations of An investigationby the Taiwan Provincial Institute of Environmental Sanitation found that119 townships in the affected area had As concentrations in groundwater of
with 58 townships having (Lo et al., 1977). In north-eastern Taiwan, Hsu et al. (1997) reported an average As concentration of
for 377 groundwater samples.

2.4 China
192 Chapter 7
In the south-west, the high As concentrations are found in deep (100–280 m) artesian well waters. The sediments from which these are abstractedare poorly documented, but appear to include deposits of black shale (Tsenget al., 1968). The groundwaters are likely to be strongly reducing as the As isfound to be present largely as As(III) (Chen et al., 1994) and some of thegroundwaters contain methane (Tseng et al., 1968) as well as humicsubstances. Groundwaters abstracted in north-eastern Taiwan are alsoreported to be artesian but more typically shallow, with a depth range of 16–40m (Hsu et al., 1997). As found in Bangladesh and West Bengal,groundwater from shallow dug wells in Taiwan has low arsenicconcentrations (Guo et al., 1994). This is probably a reflection of relativelyoxidising conditions in the shallow parts of the aquifer immediately aroundthe open wells.
The presence of endemic arsenicosis has been recognised in China sincethe 1980s and today the scale of the problem is known to be large. Arsenicproblems related to drinking water have been identified in the Provinces ofXinjiang and Shanxi as well as in parts of Inner Mongolia (Fig. 1).Concentrations of arsenic up to have been found in groundwaterfrom these affected areas. More recently, high-arsenic drinking water hasalso been identified in parts of Liaoning, Jilin and Ningxia Provinces innorth-central and north-east China (Sun, pers. comm., 2001). However, theextent of these occurrences and the health consequences are not currentlywell-defined. As in many other countries, the Chinese standard for arsenic indrinking water is The population exposed to drinking water withconcentrations in excess of this has been estimated as around 5.6 millions(Table 1) and the number of diagnosed arsenicosis patients currently around20,000 (Sun et al., 2001). Today, the populations of Xinjiang Province aresupplied with alternative low-As sources of drinking water. In other areashowever, populations continue to rely on high-arsenic groundwater forpotable supply. The majority of the affected patients are the rural poor.
2.4.1 Xinjiang Province
The first cases of arsenic-related health problems due to drinking waterwere recognised in Xinjiang Province of north-west China (Fig. 1). Artesiangroundwater has been used for drinking in the region since the 1960s (Wangand Huang, 1994). Wang (1984) found As concentrations up toin groundwaters from the province. Wang and Huang (1994) reported Asconcentrations of between and in deep artesian

7. Arsenic in groundwater – Eastern Asia 193
groundwater from the Dzungaria Basin on the north side of the TianshanMountains (from Aibi Lake in the west to Mamas River in the east, a stretchof ca. 250 km). Artesian groundwater from deep boreholes (up to 660 m)was found to have increasing As concentrations with increasing boreholedepth. Shallow (non-artesian) groundwaters had observed As concentrationsbetween and That in the saline Aibi Lake was reportedas while local rivers had concentrations between and
Wang et al. (1997) reported As concentrations up to fromtubewells from the Kuitan area of Xinjiang. A 1982 survey of 619 wellsshowed 102 with concentrations of As High fluorideconcentrations were also noted in the groundwaters (up to
2.4.2 Inner Mongolia
In Inner Mongolia, concentrations of As in excess of have beenidentified in groundwaters from aquifers in the Ba Men region and TumetPlain which includes the Huhhot Basin (Figure 1, Luo et al., 1997; Ma et al.,1999). These areas border the Yellow River Plain and include the towns ofBoutou and Togto. In the region as a whole, around 300,000 residents arebelieved to be drinking water containing (Ma et al., 1999).Arsenic-related health problems from the use of groundwater for drinkingwere first recognised in the region in 1990 (Luo et al., 1997). The mostcommon manifestations of disease are skin lesions (melanosis and keratosis)but an increased prevalence of cancer has also been noted. Ma et al. (1999)reported that 543 villages in Ba Men region and 81 villages in Tumet hadtubewells with As concentrations Around 1500 cases of arsenicdisease had been identified in the area by 1995.
The area of Ba Men with high-As groundwater appears to be around300 x 20 km in extent and the sediments are Quaternary lacustrine deposits.Wells were mostly installed in the late 1970s and well depths are typically10–35 m. Arsenic concentrations have been found in the range 50–
(Ma et al., 1999) and around 30% of wells sampled had Asconcentrations The groundwaters are reducing with As beingdominantly present as As(III) (Table 4). Some contain high F concentrations(average Ma et al., 1999).
The Huhhot Basin (area around 80 x 60 km) lies to the east of Ba Menarea. The basin is surrounded on three sides by high mountains of the DaQing and Man Han ranges and is itself infilled with a thick sequence (up to1500m) of poorly consolidated sediments, largely of Quaternary age(Smedley et al., in press). The Holocene sediments at the top of the sequenceconsist of arenaceous and often conglomeratic alluvial fan deposits along thebasin margins and fine-grained lacustrine deposits in the central part of thebasin.

194 Chapter 7
Groundwater has been used for several decades for domestic supply andagriculture. Traditional sources of water were shallow hand-dug wells whichwere typically 10 m or less deep and tapped the shallowest groundwater.These have now generally been abandoned in favour of tubewells whichabstract at shallow levels (typically <30 m) by hand pumps or in some casesby motorised pumps. Groundwater is also present within a distinct, deeperaquifer (typically >100 m depth). Tubewells tapping this deeper aquifer areoften artesian in the central parts of the basin.

7. Arsenic in groundwater – Eastern Asia 195
The groundwaters display a strong redox change along the groundwaterflow line from the basin margins to the central low-lying area. This reflectsin part the changing lithology of shallow sediments from relatively coarsemarginal alluvial facies to finer lacustrine facies in the central part of thebasin. The change leads to the development of increasingly confinedaquiferconditions downgradient. Both shallow and deeper groundwaters are aerobic(dissolved oxygen up to along the basin margins but becomeanaerobic along the flow line. The aerobic groundwaters contain (upto percentile (up topercentile and small but detectable concentrations of Se (up to
percentile These each diminish to below detectionlimits in the anaerobic sections of the aquifers. Detectable redox-sensitiveelements in the anaerobic groundwaters include in particular, Fe (up to
percentile Mn (up to percentileand (up to percentile Table 4).
In addition, concentrations of P and are high in many of thegroundwaters, particularly in central parts of the basin. Maximum observedconcentrations were and respectively. As with the BaMen region, many of the Huhhot groundwaters also have highconcentrations of F (up to The F does not show any correlationwith As however.
A feature worthy of special note in the Huhhot groundwaters is therelatively high concentrations of dissolved organic carbon (DOC). Thisreaches up to in sampled groundwaters from the shallow aquiferbut is especially high in groundwaters from the deep aquifer, up toDOC (Smedley et al., in press). These deep groundwaters are often brown asa result of the abundance of humic acid. Whether or not the DOC has acritical influence on arsenic mobilisation is unclear. Nonetheless, the highconcentration of dissolved organic matter in many of the groundwaters isbelieved to have been an important control on the generation of stronglyreducing conditions in the low-lying parts of the aquifers and will haveplayed a role at least indirectly. Although high concentrations of dissolvedorganic matter are not universally recognised in high-arsenic groundwatersacross the world, they have been observed in groundwaters from Taiwan(Chen et al., 1995) and elsewhere. Indeed, they have been claimed to be acritical factor in the development of blackfoot disease in the populations ofTaiwan (Lu et al., 1990).
Arsenic concentrations in the Huhhot Basin groundwaters range between<1 and in the shallow aquifer and between <1 and
in the deep aquifer (>100m). Of a total of 73 samples,summarised by Smedley et al. (2001c), 25% of shallow sources and 57% ofdeep sources have As concentrations in excess of (Table 5). Theregional distributions of As in the groundwaters from the shallow and deep

196 Chapter 7
aquifers are shown in Figure 4. Concentrations in the aerobic groundwatersfrom the basin margins are universally low. High concentrations aregenerally restricted to the low-lying part of the basin where groundwatersare strongly reducing and where sulphate reduction has occurred (Smedley etal., in press). The As is present predominantly as As(III) which typicallyconstitutes some 60–90% of the total As. The redox characteristics of theHuhhot Basin groundwaters have many similarities with those ofBangladesh and it is logical to conclude that the main geochemical processescontrolling arsenic mobilisation are similar in the two areas.
Of a limited number of samples of dug-well water investigated, some areobserved to have As concentrations in excess of (Smedley et al.,2001c). The affected wells are from the part of the aquifer with highconcentrations in tubewell waters. This observation contrasts with thesituation observed in other reducing groundwater environments such asTaiwan (Guo et al., 1994) and the Bengal Basin (Smedley et al., 2001b). Thedug well waters of the Huhhot Basin appear to be reducing with dissolved Feand Mn present, arsenic dominantly as As(III) and with lowconcentrations. They also have high DOC concentrations (up toand this may be a reason for the maintained reducing conditions and thestabilisation of arsenic in solution (Smedley et al., 2001c). Highconcentrations of sulphur in the dug well waters (measured up to
may be due to inputs from surface pollution, oxidation ofsulphide minerals or evaporation. A smell of hydrogen sulphide in wellscontaining water with high As concentrations suggests that the sulphurpresent is dominantly in reduced form rather than as sulphate.
Few data are available for sediments in the Huhhot Basin. Concentrationsfrom 12 analysed samples are reported in the range with amedian of (Smedley et al., in press). These concentrations aretypical of average values for sediments and are comparable to valuesobserved in high-As aquifers from the Bengal Basin and elsewhere.

7. Arsenic in groundwater – Eastern Asia 197
2.5 Vietnam
Arsenic concentrations in the range (averageBerg et al., 2001) have been found in groundwater from the city of Hanoi

198 Chapter 7
and surrounding rural areas. Recent suggestions are that arsenic-relatedhealth problems are beginning to be identified among the exposedpopulations of Vietnam, although this is as yet unsubstantiated. In asurveyed area of some around Hanoi, Berg et al. (2001) found thatthe As concentrations were spatially variable, but generally higher to thesouth of the city on the southern margins of the Red River. Concentrationswere high in groundwaters from both the shallow and deeper aquifers, butthe extremely high values were found in the shallow groundwater fromprivate tubewells. Groundwater from deeper tubewells had Asconcentrations up to The causes of the variations are not fullyclear, but differences in sediment thickness, sediment age and hydraulicconnection between layers are believed to be factors.
The groundwaters in the urban area are shown to be anaerobic with highconcentrations of Fe (up to and Mn (up to andgenerally low concentrations of NO3-N (typically but up to
In the southern area worst affected by As, highconcentrations, up to are also observed (Trafford et al., 1996).
Alkalinity values are high in some groundwater samples from theshallow aquifer in the Hanoi urban area (up to but are typicallylower (ca. in the deeper aquifer. Concentrations of aretypically in both the shallow and deeper aquifers, thoughoccasional high values occur. Concentrations of dissolved P are alsooccasionally high, reaching up to (as P; Trafford et al., 1996).
Sediments from the area have As concentrations in the range 0.6–in brown-black clay horizons, in
grey clay and in grey sand; Berg et al., 2001). Associationsbetween sediment As and sediment Fe concentrations suggest that ironminerals are the dominant sources, though organic matter may contributeadditional As to the groundwater. Since groundwater drawdown close toHanoi city is pronounced, the source of the groundwater As contamination inthe Red River aquifers is unclear. The presence of strongly reducingconditions in the parts of the aquifer with high dissolved As concentrationssuggests that As release by iron-oxide reduction and desorption reactions(Kinniburgh et al., this volume) is most likely. However, partial oxidation ofsulphide minerals during groundwater drawdown could be a contributoryfactor. Total sulphur concentrations of <0.1% in the Vietnamese sedimentswere suggested to be pointers that sulphide minerals are not a significantsource of the groundwater As (Berg et al., 2001). Unfortunately, Trafford etal. (1996) did not measure As and Berg et al. (2001) did not measureHence, the relationship between the two, and the mechanisms involved in Asrelease are not defined.
Monitoring of selected wells up to three times in the affected areaindicated significant changes in As concentrations with time, with maxima

7. Arsenic in groundwater – Eastern Asia 199
typically occurring during September and December (dry season) and lowervalues during May (early monsoon period; Berg et al., 2001). Extremevariations (e.g. between and were observed in somewells. If such temporal variations are typical each year, connectivity of theaquifers with the Red River may be a significant factor impacting theseasonal trends, with dilution by river water during monsoon intervals.
To date, high As concentrations have not been observed in thegroundwaters from the Mekong Basin of southern Vietnam. This may be areflection of the fact that the Vietnamese part of the Mekong Basin is thedelta region with groundwater use being limited due to the presence of salinegroundwater in the aquifer. Limited sampling for As is also a likely factor.
2.6 Nepal
Groundwater is abundant in the Quaternary alluvial sediments of thelowland Terai region of southern Nepal and is an important resource fordomestic and agricultural use. The region is estimated to have around200,000 tubewells which supply groundwater for some 11 million people(Chitrakar and Neku, 2001). Both shallow and deep aquifers occurthroughout most of the Terai region. The shallow aquifer appears to bemostly unconfined and well-developed, although it is thin or absent in someareas (Upadhyay, 1993). The deep aquifer (precise depth uncertain) isartesian. Quaternary alluvium also infills several intermontaine basins inNepal, most notably that of the Kathmandu Valley of central Nepal (ca.
where sediment thickness reaches in excess of 300 m (Khadka,1993).
A number of surveys of groundwater quality in the Terai region haverevealed the presence of arsenic at high concentrations in a number ofsamples from shallow tubewells (<50m depth), though most analysedappear to have The Nepal Department of Water Supply andSewerage (DWSS) has recently carried out a survey of some 4000 tubewellsfrom the 20 Terai districts, mostly analysed by field test kits but withlaboratory replication of some analyses (Chitrakar and Neku, 2001). Resultsfrom the survey indicated that 3% of the samples had As concentrations of
(Table 6). The worst-affected districts were found to be Rautahat,Nawalparasi, Parsa and Bara in the central area of the Terai. The highestobserved concentration was (Parsa District). From testing in 17 ofthe 20 Terai districts, the Nepal Red Cross Society (NRCS), also found 3%of groundwater sources sampled having concentrations above thehighest observed concentration being The spatial distribution ofthe worst-affected areas was found to be similar to that reported by Chitrakarand Neku (2001). A Finnida survey found 12% of analysed samples

200 Chapter 7
exceeding while a survey by Tandukar found 9% of samplesexceeding this value (Table 6). The highest arsenic concentrations observedby Tandukar (2001) were around most of the high-arsenicsamples being from the River Bagmati area. The high As concentrationsoccur in anaerobic groundwaters and are often associated with highconcentrations of dissolved Fe (Tandukar, 2001). The number of sampleswith exceedances above are generally small, but are nonethelesscause for further testing and remedial action.
Although the amount of As data so far reported is limited, preliminarysurveying appears to indicate that deeper tubewells in the Terai have lowerAs concentrations Data so far available from the KathmanduValley have also revealed no arsenic problems there, although more analysisis required to verify the groundwater quality in the region. At the time ofwriting, no arsenic-related health problems are known to have beenidentified in Nepal.
2.7 Thailand
In terms of documented health problems from drinking water, the worstidentified case of As poisoning related to mining activity is that of RonPhibun District in Nakhon Si Thammarat Province in peninsular Thailand(Fig. 1). Arsenic-related health problems were first recognised in the area in1987. Over 1000 people have been diagnosed with As-related skin disorders,particularly in and close to Ron Phibun town (Williams, 1997). At the timeof first recognition of the problems, some 15,000 people are thought to havebeen drinking water with (Fordyce et al., 1995). The affected arealies within the South-East Asian Tin Belt which is related to theemplacement of Triassic granitoid intrusions. Primary Sn-W-Asmineralisation and alluvial placer tin deposits have been mined in the districtfor over 100 years, although mining activities have now ceased. Arsenic iscontained principally in arsenopyrite and its reaction products. Legacies ofthe mine operations include arsenopyrite-rich waste piles, waste from oredressing plants and disseminated waste from small-scale panning by localvillagers. Remediation measures includetransportation of waste to locallandfill.

2017. Arsenic in groundwater – Eastern Asia
Waste piles from former bedrock mining in the area are found to containup to 30% As, the majority in secondary arsenate minerals, particularlyscorodite (Williams et al., 1996). Alluvial soils also contain up to
As. In these, Fordyce et al. (1995) concluded that some 20%of the As was present in crystalline iron oxides, with the remainder assumedto be in sulphate mineral phases or other oxidised products.
High As concentrations found in both surface and shallow groundwatersfrom the area around the mining activity are thought to be caused byoxidation of arsenopyrite, exacerbated by the former mining activities andsubsequent mobilisation in groundwater during post-mining groundwaterrebound (Williams, 1997).
Surface waters draining the bedrock and alluvial mining areas arecommonly acidic (pH<6) with as the dominant anion (up toand with high concentrations of some trace metals, including Al (up to
Cd (up to and Zn (up to Williams etal., 1996). Strong positive correlations are observed between and Cd,Al, Be, Zn and Cu, and correlates negatively with pH (Fordyce et al.,1995). Concentrations of these trace metals diminish downstream of themining area as a result of increased pH from buffering reactions withcarbonate minerals. However, highest As concentrations (up towere found some 2–7 km downstream of the bedrock mining area (Fig. 5).As(V) is the dominant dissolved As species in the surface water samples(Williams et al., 1996).
A summary of groundwater quality in shallow and deep aquifers from thearea is given in Table 7. Shallow groundwaters (<15 m) are from alluvialand colluvial deposits and deeper (>15 m) groundwaters are from an oldercarbonate aquifer. The shallow aquifer shows the greatest degree ofcontamination with As (Fig. 5), with concentrations reaching up to
percentile In the shallow aquifer, 39% ofsamples (collected randomly) had As concentrations while in thedeeper aquifer, 15% exceeded (Table 8; Williams et al. 1996).
Conditions in the shallow aquifer are generally oxidising, with redoxpotentials being typically around 400 mV, up topercentile low Fe concentrations and dissolved Aspresent dominantly as As(V), although Mn concentrations are relatively highin some samples (up to percentile Table 7).Groundwaters from the deeper aquifer are typically more reducing withdissolved Fe concentrations up to percentile Mnup to percentile and with lowconcentrations (mostly Table 7).

202 Chapter 7
The high-As groundwaters of the Ron Phibun area clearly differ inchemical composition from many other high-As groundwater provinces inAsia. In the worst-affected (shallow) aquifer, conditions are more oxidisingthan those prevalent in the worst-affected areas of the Bengal Basin forinstance. The sample with the highest As concentration has a
concentration of This value is much greater than those foundin typical Bengal delta high-As groundwaters. In these, concentrationsare typically and the groundwaters show evidence ofreduction (Smedley et al., 2001b). The concentrations in the Ron Phibungroundwaters are not as high as in many waters impacted by oxidation ofsulphide minerals (e.g. Nordstrom et al., 2000; Schreiber et al., 2000), butthis is not inconsistent with the generation of by sulphide oxidation,since observed high dissolved As concentrations can be generated byoxidation of very small amounts of arsenopyrite. The groundwaters of theshallow aquifer also differ from those of the Bengal Basin and other high-AsAsian aquifers by having much lower concentrationsand being more acidic (pH 6.0–7.4). One feature worthy of note however, isthe relatively high concentrations of dissolved P in many of the Ron Phibungroundwaters (up to in the shallow groundwater and up to
in the deeper samples). In the groundwaters from the deeperaquifer, conditions appear more similar to those from other high-As aquifersin Asia and the retention of As in solution appears to be more of a function

2037. Arsenic in groundwater – Eastern Asia
of the presence of reducing conditions, although leakage of high-As waterfrom the overlying shallow aquifer is also a possibility.

Other surveyed areas
204
2.8
2.8.1 Pakistan
Chapter 7
Quaternary sediments, mainly of alluvial and deltaic origin, occur overlarge parts of the Indus Plain of Pakistan. The sediments comprise severalhundred metres of mainly fine-medium sand, silt and clay, although coarsersands and gravels occur in parts, especially on the margins of the plainabutting upland areas (WAPDA/EUAD, 1989). Aeolian sand deposits occurto the east of the Indus Plain (Thar and Cholistan desert areas) as well asover large parts of the Baluchistan Basin of western Pakistan. As a result ofthe arid climate of large parts of Pakistan, groundwater availability isseverely limited in many areas and poses a major problem for water supply.
Of the aquifers of Pakistan, those of the Indus Plain (predominantly inPunjab and Sindh Provinces) are potentially most vulnerable to Ascontamination. The Indus sediments have some similarities with the As-affected aquifers of Bangladesh and West Bengal, being Quaternary alluvial-deltaic sediments derived from Himalayan source rocks. However, theregion differs in having a more arid climate, greater prevalence of olderQuaternary (Pleistocene) deposits and dominance of unconfined and aerobicaquifer conditions, with greater apparent connectivity between the riversystems and the aquifers. Aerobic conditions are demonstrated by thepresence of relatively high nitrate concentrations in many Indusgroundwaters (Mahmood et al., 1998; Tasneem, 1999). Cook (1987) alsofound dissolved oxygen in a number of groundwater samples from the lowerIndus Plain (Sindh Province). Hence, the aquifers appear to have differentredox characteristics from those of the lower parts of the Bengal Basin.Under more aerobic conditions (at the near-neutral pH of the Indusgroundwaters), As mobilisation in groundwater should be less favourable.
Additional contrasts between the groundwater characteristics of the IndusPlain and those of the Bengal Basin are found in the concentration ranges of
and P. Although few data are available for groundwater inPakistan, values obtained for both fresh and saline groundwater samplesfrom the lower Indus of Sindh were in the range (Cook1987). In the saline groundwaters which predominate in Pakistan, Cl is oftenthe dominant anion. From the limited amount of data available for P in theIndus groundwaters, concentrations appear to be generally low, althoughRahim (1998) found up to (as P) in groundwater fromRawalpindi area.
To date, only a limited amount of groundwater testing for As has beencarried out in Pakistan. However, the Provincial Government of Punjabtogether with UNICEF began a testing programme in northern Punjab in2000. Districts to be tested were selected on the basis of geology and

2057. Arsenic in groundwater – Eastern Asia
available water-quality information. These included areas affected by coalmining and geothermal springs (Jhelum and Chakwal Districts), areasdraining crystalline rock (Attock and Rawalpindi), areas with high-irongroundwaters (Sargodha) and one district from the main Indus alluvialaquifer (Gujrat). A total of 364 samples were analysed. The majority (90%)of samples had As concentrations less than although 6 samples(2%) had concentrations above (Table 9; Iqbal, 2001). Further welltesting for As is on-going. No confirmed cases of arsenic-related diseasehave been found in Pakistan, although epidemiological investigations arealso being undertaken in some areas. From the available data, the scale ofarsenic contamination of Indus groundwaters appears to be relatively smallalthough further results are needed to verify the scale of contamination.Under the arid conditions in Pakistan, high fluoride concentrations appear tobe a more widespread water-related health problem.
2.8.2 Myanmar
As elsewhere in Asia, traditional sources of water for domestic supply inMyanmar were dug wells, ponds, springs and rivers. However in theQuaternary aquifer of the Irrawaddy delta, many of these have beensuperseded since 1990 by the development of shallow tubewells. Littletesting for As in groundwater has been carried out in tubewells from thealluvial aquifer. However a few reconnaissance surveys have beenundertaken and As has been found in excess of in some. Save TheChildren reported from analysis of 145 shallow tubewells in Thabaung,Laymyethna and Henthada townships (Ayeyarwaddy Division) that 35% ofsamples exceeded (WRUD, 2001). The Water ResourcesUtilisation Department carried out a survey of groundwater in SittwayTownship in the western coastal area, as well as Hinthada and KyaungkoneTownships close to the south coast (delta region) of Myanmar (WRUD,2001). In Sittway Township, salinity problems occur in some groundwaters

206 Chapter 7
and surface waters and most tubewells are <15 m deep as a result. Merckfield-test kits were used for the analysis of As. In Hinthada and KyaunkoneTownships, well depths are typically around 30–50 m deep, although somedeeper tubewells (55–70 m) were also sampled. In the southern Townshipsof the delta area, high Fe concentrations are noted. The distribution of Asconcentrations in the sampled areas is given in Table 10, although it must beemphasised that this distribution is crudely defined due to the limitedresolution and accuracy of the field kits. Exceedances above inshallow tubewells from Sittway, Hinthada and Kyaunkone Townships werearound 10–13% (Table 10). One sample from the depth interval 56–70 malso exceeded As with a number of other affected aquifers, dugwells generally had As concentrations of (WRUD, 2001).
2.8.3 Cambodia
The Mekong River system has a substantial proportion of its lengthwithin Cambodia and tubewells provide a significant source of potablesupply in the country. Little water testing for As has been carried out so farin Cambodia. However, an initial reconnaissance screening of around 100tubewells from 13 provinces has been carried out with analysis including As,F, some trace metals and some pesticides. Approximately 9% of the samplesanalysed had As concentrations with observed concentrations inthe range Exceedances above were found in 5 out ofthe 13 provinces investigated. The highest concentrations observed to dateare from Kandal Province, close to Phnom Penh. Several districts in thisprovince have a high percentage of wells with water containing As in excessof the WHO guideline value for As (Feldman and Rosenboom, 2000). Sincethis initial screening for As, field testing using portable kits has identifiedgroundwater sources with concentrations above in two additional

2077. Arsenic in groundwater – Eastern Asia
provinces. High Fe and Mn concentrations and low Eh values are also acommon feature of the groundwaters throughout the lowland areas ofCambodia.
UNICEF and other organisations continue to support and carry out fieldtesting using portable kits. However, there is a need for a systematic surveyof As in groundwater across the Mekong Valley to determine the true scaleof the problem in Cambodia. As the Mekong Valley also covers parts ofLaos and Thailand, arsenic problems are also possible in the alluvial anddeltaic parts of these countries. However, few data are so far available fromthese regions.
3. DISCUSSION AND CONCLUSIONS
In terms of the populations at risk from As exposure and the percentageof wells with high As concentrations, Bangladesh is clearly the worstaffected region identified. However, serious problems are also recognised inparts of China as well as West Bengal (India) and a number of othercountries have problems severe enough to require further testing andmitigation. The geochemistry of the aquifers is complex and many featuresof the processes involved in As mobilisation remain unclear. However, somecommon features exist between the recognised provinces. Excepting thespecial cases (such as Ron Phibun, Thailand) linked to arsenic contaminationdue to past mining activity, those incidences listed in this account are locatedin delta areas and alluvial plains where the aquifers are composed of poorlyconsolidated and geologically young (Quaternary) sediments. Many affectedaquifers appear to be of Holocene age, i.e. just a few thousand years old. It isperhaps not a coincidence that many of the world’s arsenic-affected aquifersare concentrated within Asia. This is a region of major recent orogenicactivity and weathering rates of rock material in the Himalayan region arehigh. Thus, geologically young alluvial and deltaic plains are a relativelycommon feature of many of the lowland areas of Asia. This, together withthe fact that large populations concentrate in lowland deltaic and riverfloodplains because of fertile soils and relative abundance and accessibilityof water supplies has led to a loading of groundwater-arsenic problems in theAsian continent.
A common feature of arsenic-affected aquifers is the presence ofgenerally slow-flowing groundwater. This may be for a number of reasons,such as low recharge under arid climatic conditions (e.g. Inner Mongolia),small hydraulic gradients (e.g. Bangladesh) or the presence of low-permeability strata. Slowly moving groundwater may be critical in thegeneration of high-arsenic groundwaters as the element can be mobilised

208 Chapter 7
(dissolved, desorbed) from fresh, reactive minerals in the sediments and nothave been flushed from the aquifer by large volumes of flowing groundwater(Smedley and Kinniburgh, 2002). From available data for sediments inaffected aquifers, the generation of high-arsenic groundwaters appears byand large not to be a function of unusually high concentrations in the hostsediments. Indeed, the sediments typically have close to world-average Asconcentrations. Rather, the distribution of high-As groundwaters appears tobe a function of the local (or regional) hydrogeological and geochemicalenvironment. In the Asian aquifers at least, this is overwhelmingly related tothe occurrence of strongly reducing conditions.
Reducing conditions are manifested by regionally high Fe and Mn andoften high (Table 11), though these rarely correlate well withdissolved As concentrations, except on very local scale. Other featurescommon to high-arsenic groundwater are high alkalinity as
and high P concentrations Derivation of these is likelyto be largely by decomposition of fresh organic matter in the young alluvialand deltaic aquifers, although P may also be desorbed from iron oxides in asimilar way to As (Kinniburgh et al., this volume). High concentrations ofdissolved and P may also enhance As mobilisation by competing foravailable surface sorption sites on iron and other oxides (Manning andGoldberg, 1996). High concentrations of dissolved organic matter are alsocommonly observed in high-arsenic groundwaters, though they appear not tobe a prerequisite for As mobilisation.
Additional problems of high F occur in some groundwaters from aridareas (notably northern China, Pakistan). This creates potential additionalhealth problems from dental and skeletal fluorosis. However, the presence ofone of these elements in the Asian aquifers is not necessarily an indication ofthe presence of the other since As is dependent on the presence of stronglyreducing conditions, whilst F occurs where groundwatersdominate and where Ca concentrations are comparatively low.

7. Arsenic in groundwater – Eastern Asia 209
There is now broad agreement amongst scientists working in WestBengal and Bangladesh about the composition of the arsenic-affectedgroundwaters, their depth distribution and to some extent, about theirevolution. The strongly reducing nature of the affected groundwaters is a keyfeature and many scientists now consider that a mechanism involvingreduction of iron oxides has played a key role in creating the As problem.The ‘pyrite oxidation’ hypothesis favoured by some West Bengal scientistsis no longer widely supported. However, many uncertainties remain over theprecise mechanisms of As release from sediments, and the diageneticchanges that take place on sediment burial. Considerable uncertainties alsoremain about the extent to which the arsenic concentrations may change orhave changed with time and more investigations are needed to establishwhether temporal variations in As concentration in a given aquifer aresignificant. If so, this has serious implications for long-term mitigationstrategies and groundwater management.
It is possible that other problem areas in Asia remain to be identified.Other deltas and alluvial plains are particularly at risk but probably onlyunder strongly reducing conditions. In As-affected aquifers from someinland basins from other parts of the world, especially those containingrecent volcanogenic material, high As concentrations have been found underoxidising conditions where high pH values occur (e.g. Robertson,1989; Smedley et al., 2002). Such conditionshave not been found in aquifersin Asia. However, it is possible that some so-far unsurveyed Asian aquiferscould have increased As concentrations under such high-pH conditions.Quaternary arid inland basins such as occur in parts of Pakistan and northernChina are possible areas. Random screening of tubewell water in unsurveyedhigh-risk areas is therefore a priority.
4. ACKNOWLEDGEMENTS
Acknowledgements are given to collaborators in various projects onarsenic carried out over the last few years, including David Kinniburgh forinvestigations in Bangladesh and West Bengal, Matin Ahmed and IhtishamulHuq for work in Bangladesh and Luo Zhen-dong, Zhang Ge-you and ZhangMei-yun for work in Inner Mongolia. Fiona Fordyce also kindly provideddata for water samples from the Ron Phibun area. The manuscript hasbenefited from reviews by Alan Welch, Yan Zheng and Fiona Fordyce.Support has been provided for the various projects by the UK DepartmentFor International Development (DFID), WaterAid and UNICEF. Thischapter is published with the permission of the Director, British GeologicalSurvey.

This page intentionally left blank

Chapter 8
The scale and causes of the groundwater arsenicproblem in Bangladesh
David G. Kinniburgh*, Pauline L. Smedley*, Jeff Davies*, Chris J. Milne*,Irina Gaus*, Janice M. Trafford*, Simon Burden**, S. M. Ihtishamul Huq+,Nasiruddin Ahmad+, Kazi Matin Ahmed$* British Geological Survey, Wallingford** British Geological Survey, Keyworth+ Department of Public Health Engineering, Dhaka$ Department of Geology, University of Dhaka, Dhaka
Groundwater is now extensively used for drinking water in Bangladesh andpresent estimates indicate that there are some 6–11 million tubewells inBangladesh. It is now apparent that approximately ¼ of these wells containarsenic at concentrations exceeding the Bangladesh drinking water standard
As many as 35 million people may be drinking arsenic-affectedgroundwater. We discuss a national survey of groundwater quality inBangladesh that attempted to map the distribution and nature of affected wells.Other solutes measured included Na, K, Ca, Mg, Fe, Mn, P and Theworst-affected part of Bangladesh lies in the south-east of the country wherethe sediments are of Holocene age and where concentrations of arsenicfrequently exceeded Where sampled, deep groundwaters (>150 m)were only rarely affected as were shallower groundwaters from oldersediments including the aquifers underlying the Barind and Madhupur Tracts.Seven groundwater samples from the capital city of Dhaka also suggest thatthe city is not affected. The arsenic is undoubtedly of natural origin and theproblem arises even though the sediments do not contain abnormal quantitiesof total arsenic. There is no evidence to suggest that the dissolved arsenic isderived from the oxidation of pyrite as some have suggested. Rather it appearsthat the high concentrations reflect a combination of factors: (i) youngsediments undergoing rapid change from an oxidizing to a reducingenvironment following sediment burial; (ii) the release of arsenic by one ormore mechanisms which are poorly understood at present but which probablyinvolve the desorption and dissolution of arsenic from iron oxides which arequite abundant in many of the worst-affected sediments; (iii) the very lowhydraulic gradients throughout much of Bangladesh mean that groundwaterflow is very slow which, combined with the ‘young’ age of many of thesediments, means that the natural flushing of the shallow aquifer will be slow
Before 1960, most of the drinking water in Bangladesh was derived fromsurface water, often from numerous ponds, as well as from dug wells.However, as a result of poor bacteriological quality of the pond water andthe fear of cholera and typhoid epidemics, new sources of safe drinkingwater were sought. Groundwater was seen as the obvious answer as it didnot suffer from the microbiological contamination of surface water and thedeltaic environment of most of Bangladesh was ideal for its exploitation bothin terms of groundwater availability and the ease by which tubewells couldbe installed. The changeover to groundwater gathered pace in the 1980’s inpart driven by the UN International Decade for Water Supply and Sanitation.This change in the source of drinking water is believed to have been partlyresponsible for the reduction in infant mortality in Bangladesh since 1980.
At the same time, the introduction of high-yielding varieties of rice andthe rapid increase in the use of groundwater for irrigation enabledBangladesh to increase yields of rice. Irrigation enabled increasedproduction during the latter part of the dry season (February–April). The useof groundwater for irrigation varies regionally but is greatest in the drierparts of north-western Bangladesh.
Groundwater is now the major source of both drinking water andirrigation water and 97% of the rural population derives its drinking waterfrom tubewells. There has been no accurate country-wide survey of thedistribution of tubewells but there are believed to be somewhere in theregion of 6–11 million hand-pump tubewells, mostly privately owned.
This success in providing what was believed to be safe drinking waterand irrigation water is now in jeopardy because of the finding that many ofthe tubewells supply water containing excessive arsenic. While the principalconcern is the arsenic in drinking water because of its direct influence onhuman health, there is also concern about the use of arsenic-richgroundwater for irrigation and its consequent effect on the crop uptake ofarsenic and its impact in the food chain. There is also concern about thelong-term impact of arsenic from irrigation water on the soil quality and onthe possible further release of arsenic to groundwater as a result of redoxchanges induced by paddy cultivation or as a result of displacement ofarsenic by phosphate fertilizers.
There have been a number of surveys of arsenic in groundwater inBangladesh. Most of the data have been collected by government
Background1.1
Chapter 8212
allowing any released arsenic to accumulate. The rapid rate of deposition ofsediments in Bangladesh and the Bengal Basin means that the chance of a wellintercepting arsenic-rich water is likely to be relatively high compared withsmaller deltas and other alluvial environments where the sedimentation rate ismuch lower.

departments, particularly the Department of Public Health Engineering(DPHE) and the Bangladesh Water Development Board (BWDB), but therehave also been a number of studies carried out by consultancies in support ofnumerous drinking water supply and irrigation projects. There have alsobeen a number of detailed surveys by universities (e.g. Burgess et al., 2000).Each of these surveys has had different objectives, regional coverages,sample densities and analytical suites.
Following reports of Bangladeshi patients visiting Calcutta, West Bengalfor ‘treatment’, the DPHE began their arsenic investigations. The firstdetection of arsenic-rich groundwater in Bangladesh is usually attributed toDPHE in 1993. They observed high concentrations of arsenic at Nawabganjdistrict, close to the West Bengal border. At that time, extensive areas ofhigh-As groundwater were being investigated in West Bengal by theGovernment of West Bengal. Arsenic problems in groundwater elsewherewere usually associated with areas of mining activity or naturalmineralization (often involving sulfide minerals) and with areas ofhydrothermal activity. Few detailed geochemical studies of arsenic in majoraquifers had been carried out at that time.
Most surveys of Bangladesh groundwater have not included accurategeo-referencing of sampling points making computerised mapping difficult.Nonetheless, the early surveys gave a broad indication of the major elementgroundwater quality in Bangladesh. The major cause of concern in theseearly water quality surveys concentrated on the often high iron content ofmany of the groundwaters and high salinity in the coastal zone. There wasalso concern about the poor bacteriological quality of drinking water fromsome hand-pumped tubewells.
After 1995, surveys for arsenic in groundwater in Bangladesh increasedrapidly. However, most of these surveys were not sufficientlycomprehensive in terms of the range of water quality parameters measuredor in terms of sample density or coverage to give a reliable picture ofgroundwater quality on a national scale. The first survey to achieve anational coverage for arsenic was carried out by DPHE with UNICEFassistance in 1997 using field-test kits.
This chapter gives an account of the results from the DPHE/BritishGeological Survey (BGS) National Hydrochemical Survey (NHS) carriedout during the dry seasons(March–June) of 1998 and 1999. This survey wasbased on laboratory measurements of arsenic and included a range of otherelements which taken together broadly define the geochemical environmentof the high-As groundwaters.
8. The scale of the groundwater arsenic problem in Bangladesh 213

214 Chapter 8
The Bengal Basin in Bangladesh contains a sequence of Cretaceous toRecent sediments which is up to 15 km thick and which occupies some
of lowland floodplain and delta. The combined deltas of theGanges, Brahmaputra and Meghna (GBM) river systems lie withinBangladesh. The GBM system carries the greatest total sediment load of any
1.2 Sedimentology, geology and hydrogeology

8. The scale of the groundwater arsenic problem in Bangladesh 215
river system in the world. The contribution to the overall sediment load isgreatest from the Brahmaputra, followed respectively by the Ganges(Padma) and the Meghna. The surface geology is shown in the map by Alamet al. (1990) and is described in the accompanying text. It has also beenreviewed in DPHE/BGS/MML (1999) and Davies (2001). A simplifieddescription of the geology is given in Fig. 1. The present coastline appears tohave remained largely unchanged for the last 3 ka BP (Goodbred and Kuehl,2000).
Apart from the Pleistocene Tracts, the Chittagong Hill Tracts and theextreme north-west, most of Bangladesh lies no higher than 10 m abovemean sea level. The depth to the water table varies seasonally from 1–3 m orless (extensive flooding) in the south to between 5–15 m in the north.Regional hydraulic gradients are therefore very low, typically aboutLocally hydraulic gradients tend to be greatest near rivers.
The geomorphology of the GBM system has developed in response to aseries of glacio-eustatic sea-level cycles and long-term tectonic activity.Most of the surface sediments are of late Quaternary age but raised areas ofPleistocene sediments are exposed in the Barind Tract to the north-west andthe Madhupur Tract in north-central Bangladesh (Fig. 1). The lateQuaternary sediments have been deposited in two geomorphologicallydistinct environments, one to the north of the Ganges and lower Meghnarivers and the other to the south. The northerly sediments are fluviatiledeposits in mountain front fan deltas and in the floodplains of major rivers.The southerly sediments have principally been deposited in an estuarinedelta environment. At the time of the last glacial maximum some 20–18 kaBP, sea level was up to 130 m below the present-day level. This led to theweathering of exposed sediments and erosion created deeply-incised valleyswhich as a consequence of the later rise in sea level became filled with avariety of sediments ranging from coarse sands and gravels to fine silts.
The sandy, unconsolidated Pleistocene to Holocene fluvial and deltaicsediments that underlie much of Bangladesh form prolific aquifers. Welldepths are up to 350 m but most of the wells for domestic water supply arein the depth range 15–70 m with the well screen usually placed in horizonsof medium to fine sand. The exact ages of the shallow Holocene sediments,which provide the bulk of the water, are not known in detail but the available
dates point to an age range of 3–10 ka BP (Umitsu, 1993). Across largeparts of the southern coastal region, the shallow aquifer is saline and adeeper aquifer, normally found deeper than 150 m below ground level, isused for water supply. The deep aquifer is separated from the shallowaquifer by extensive silts and clays which form a confining layer. Furthernorth, the nature of the deep aquifer has not been extensively explored and inplaces either may not exist or may not be effectively separated from theshallow aquifer.

Davies (1994) reported groundwater quality in the Dhamrai area of north-central Bangladesh and included the Holocene aquifer in parts of the Jamunavalley and further east as well as the Dupi Tila aquifer of the MadhupurTract. Differences were identified between groundwaters from the twoaquifers, with higher Mn, Ca, Mg, K concentrations and some high Pconcentrations in the Jamuna valley. Arsenic was not measured in thissurvey.
Halcrow and DHV (1995) carried out a survey of baseline groundwaterquality across Bangladesh, concentrating particularly on heavily-croppedareas of the country and the effects of pesticide and fertilizer use. Halcrowand DHV (1995) identified high concentrations of iron and ammonium inmany samples, high phosphorus in some and uniformly low fluorideconcentrations Arsenic was not measured in thissurvey.
NRECA (1997) surveyed around 570 tubewells for As and Fe(II) as wellas a subset for other determinands including dissolved oxygen, phosphate,sulfate and chloride. Sample sites were in clusters spaced about 25–50 kmapart and spread around the country. This survey identified the highestaverage arsenic concentrations at Chandpur, Faridpur and Feni. Arsenic wasalso identified in isolated pockets west of Rajshahi and innorthern Bangladesh. Redox potentials were found to be highest (mostoxidizing) in northern Bangladesh, especially in the Madhupur and BarindTracts and the Tista Fan area. The distribution of iron was spatially veryvariable but salinity indicators and phosphate were generally higher in thecoastal area. NRECA concluded that in general, high arsenic concentrationscorrelated with low redox potential, electrical conductivity greater than
low dissolved oxygen, total Fe greater thanphosphate greater than and Cl greater thanThey found low concentrations (typically or less) ingroundwater from almost all areas.
In 1997, the Bangladesh University of Engineering and Technology(BUET) analysed around 1200 samples from irrigation wells in north-eastern
1.3 Early groundwater-quality surveys
216 Chapter 8
The sediments of the Dupi Tila aquifer, which underlie the Pleistoceneterraces and are also believed to underlie many of the younger sediments inother parts of the floodplain, are of Lower Pleistocene age. All sedimentsolder than 21 ka BP will have undergone at least one cycle of sea-levelchange, and perhaps many. The large hydraulic gradients that existed atthese times of low sea level (glacial maxima) and the different climaticconditions then existing are likely to have induced significantly greatergroundwater flow through the aquifers.
(typically ).

In view of the patchiness of pre-1997 analyses of arsenic and otherelements, the lack of accurate geo-referencing and the known limitations offield-test kit surveys, a national survey of arsenic and a range of otherdiagnostic elements in the groundwaters was carried out. The main aims ofthe survey were: (i) to establish the regional distribution of arsenic and otherelements in the groundwaters based on existing wells, and (ii) to provideestimates of the percentage of wells exceeding various limits for arsenic andother elements.
It was not feasible to measure the normal set of field parameters (pH,redox potential, dissolved oxygen, temperature etc) at each of the sampledwells. Instead more detailed hydrochemical studies were undertaken in threeSpecial Study Areas – the sadar upazilas* of Nawabganj, Fardipur andLakshmipur districts (Fig. 1). Additional measurements in these areasincluded the above field parameters as well as a broad range of traceelement, isotope and sediment analyses and a limited amount of time seriessampling. In this Chapter we concentrate on the results of the national surveybut include selected data from these three Special Study Areas whereappropriate. The full set of data and maps for all of these surveys can befound in BGS and DPHE (2001).
* An upazila, formerly known as a thana, is an administrative area smaller than a district andlarger than a union.
Bangladesh for arsenic. They found about 33% of the wells exceeded theBangladesh standard for arsenic and 60% exceeded the WHOguideline value (GV) of The worst-affected districts were foundto be Moulvibazar and Sunamganj. This was the first indication that therewas a significant problem in northern Bangladesh.
From 1997 onwards, numerous surveys have been undertaken includingin February 1997 a detailed survey by BGS and DPHE of the geochemistryof well waters from the arsenic ‘hot spot’ of Chapai Nawabganj. Planningfor a more extensive survey began in mid-1997 and led to the DPHE/BGSNational Hydrochemical Survey (NHS) reported here. While we concentrateon arsenic, we also discuss other elements and properties of Bangladeshgroundwaters since these provide the necessary background forunderstanding the evolution of the arsenic-rich groundwaters.
8. The scale of the groundwater arsenic problem in Bangladesh 217
1.4
1.4.1 Aims
The DPHE/BGS National Hydrochemical Survey

Details of the planning and organization of the sampling are described byDPHE/BGS/MML (1999). The survey covered the whole of Bangladeshapart from the three districts of the Chittagong Hill Tracts (CHT).
The intention was to adopt a stratified random sampling scheme asclosely as possible with the stratification being designed to get a reasonablyuniform density of coverage. Accordingly well selection was made using thefollowing strategy: (i) a 3 × 3 grid was pencilled on the upazila map todivide the upazila into approximately nine equal-area cells; (ii) at least onewell was selected from each cell ensuring that there was at least 2 kmbetween adjacent sampled wells – normally about 10–12 wells were initiallyselected by the DPHE field staff in this way; (iii) the final selection of thewells – where possible one per cell – was made by the sampling team leaderwhile in the field. Preference was given to DPHE-constructed wells sincedetails of their construction were better recorded than for the private wells.This was not believed to introduce any bias into the sampling. Most sampledwells were shallow tubewells but where possible, deep tubewells (>150m)were also sampled in order to provide information about possible depthrelationships.
Most of the wells sampled were fitted with a standard Bangladeshnumber 6 hand pump. Each well was purged prior to sampling by pumpingapproximately one stroke per foot of well depth. The water sample wasfiltered through a membrane filter into a plastic 30 ml bottle andacidified to 1% with concentrated Analytical Grade nitric acid.
The samples were analysed for total arsenic by hydride generation-atomic fluorescence spectrometry (HG-AFS) in the BGS laboratories in theUK. The detection limit was generally 0.25 or Additionalelements were measured by ICP-AES and in a few cases by ICP-MS. Thesamples were periodically interspersed with standard reference samples. Theanalytical data were combined with the site details and entered into adatabase.
218 Chapter 8
Organization1.4.2
1.4.3 Location and characteristics of the sampled wells
1.4.3.1 Distribution of sampled wellsA total of 3534 wells were sampled, amounting to a sample density of
approximately one per or an average site-to-site separation of about6 km. The areas of low sample density are those where access wasparticularly difficult, for example the Sundarbans region in the south-west,the flooded haor regions around the Sylhet Basin to the north-east andaround the Atrai Basin in the west. These regions have very low populationdensities for the same reasons. Sixty one of the sixty four districts of

A map of the sampled wells and their depth distribution (Fig. 2) showsthat there is a distinct geographical distribution in well depths. This reflectsthe minimum depth needed to obtain water of acceptable yield and perceivedquality (i.e. salinity). The wells in the southern coastal region either need tobe very deep (>150 m) as in the Barisal-Patuakhali region (west of theMeghna) or very shallow, as in the Lakshmipur-Noakhali region (east of theMeghna), in order to avoid salinity problems.
Relatively deep wells are also found in the Sunamganj-Sylhet region innorth-eastern Bangladesh where shallow aquifers are poor-yielding or non-existent. Very shallow wells are also found in north-western Bangladeshwhere there is little or no overlying silt or clay layer, so there is no necessityto go deeper. The cluster of deeper wells shown in central Bangladesh werethose sampled in the city of Dhaka where extensive groundwater drawdownhas occurred due to heavy abstraction. These tubewells abstract from adeeper pre-Holocene aquifer typically from depths of about 100 m.
In percentage terms, the distribution of well depths was: <15 m, 8%; 15–30 m, 33%; 30–60 m, 36%; 60–90 m, 9%; 90–150 m, 5%; 150–200, 1% and>200m, 8%. The majority of wells were therefore ‘shallow’. The mediandepth was 35 m; only 14% of wells were in the depth interval 60-150 m and9% exceeded 150 m. In the following discussion, we have chosen 150 m asthe cut-off between ‘shallow’ and ‘deep’ wells since this often serves toseparate wells from the shallow and deep aquifers, where present.
Depth of sampled wells
8. The scale of the groundwater arsenic problem in Bangladesh 219
Bangladesh were sampled, the remaining districts being in the CHTs. Onaverage, there were 58 samples per district. Of the 496 upazilas inBangladesh, 433 were sampled, giving an average of about 8 samples perupazila. A total of 327 samples were taken from deep tubewells (>150 m).
1.4.3.2
1.4.3.3 Age of sampled wellsThere has been considerable growth in the number of installed tubewells
in recent years. The survey showed that the date of installation of thesampled wells was: before 1970, 1.9%; 1970–74, 2.5%; 1975–79, 6.0%;1980–84, 8.1%; 1985–89, 13%; 1990–94, 27% and 1995 or later, 42%.Hence two-thirds of the sampled wells had been installed since 1990. Thereare regional variations in the age distribution with the greatest percentage of‘old’ (pre-1980) wells sampled in the Khulna area and the smallestpercentage in the Rajshahi area.

The distribution of sampled wells and the arsenic concentration in thegroundwaters can be seen from the point-source map (Fig. 3). Class limitswere based on rounded quartile values. A very large range of arsenicconcentrations was found. The minimum concentration was less than
while the maximum was a range of four orders ofmagnitude. Only two samples (0.06%) exceeded and 850samples (24%) fell below the detection limit. The median concentration was
42% of all samples exceeded the WHO guidelinevalue for drinking water and 25% exceeded the Bangladesh standard,
If only shallow wells (<150m depth) are considered, theexceedances increase to 46% and 27%, respectively. 9% of the completesample set exceeded and 5.6% exceeded The averageconcentration was approximately (calculated assuming valuesbelow the detection limit were half the detection limit). 249 or 58% of the433 sampled upazilas contained at least one well exceeding the Bangladeshstandard.
There is a distinct geographical distribution of high arsenic groundwaterconcentrations with the highest concentrations in the south and south-eastand the lowest concentrations in the north and north-west. These regionaltrends are more clearly seen in the smoothed map produced by disjunctivekriging (Gaus et al., 2001) based on a 5 km grid (Fig. 4).
The district with the greatest percentage of wells exceeding theBangladesh standard was found to be Chandpur in the south-east where 90%of the sampled wells exceeded this standard. The average arsenicconcentration in Chandpur was The remaining 11 most-contaminated districts (Madaripur, Munshiganj, Gopalganj, Lakshmipur,Noakhali, Bagerhat, Shariatpur, Comilla, Faridpur, Satkhira and Meherpur)all had 60% or more of their sampled wells exceeding the Bangladeshstandard and also had average As concentrations exceeding
These high-As districts contrast sharply with other districts where mostof the wells contained However, in only one of the 61 sampleddistricts, Thakurgaon in the extreme north-west of Bangladesh, were thereno sampled wells exceeding the WHO guideline value of Eightdistricts had no sampled wells exceeding the Bangladesh standard(Thakurgaon, Natore, Barguna, Jaipurhat, Lalmonirhat, Nilphamari,Panchagarh and Patuakhali). These were either southern coastal districtswhich are dominated by deep wells or north-western districts wherecontamination is regionally lower. Perhaps more significant is the contrast in
220 Chapter 8
1.4.4
1.4.4.1
Overview of the distribution of arsenic
Regional pattern

8. The scale of the groundwater arsenic problem in Bangladesh 221

222 Chapter 8
average arsenic concentration which exceeds in the worst-affected districts and is just a few in the least-affected districts.
Neither the raw data nor the smoothed maps show the complete picture.For example, a number of arsenic ‘hot spots’ have been detected in northernBangladesh initially by identification of arsenic-affected patients followedby more detailed field testing. The arsenic maps give little indication of suchareas since the areasare too small to be reliably identified at the sampledensity employed in the NHS. These hot spots include some of the worst-

One of the most important distinctions in arsenic concentrations found inthe survey is between ‘shallow’ and ‘deep wells’ (Table 1 and compare Fig.2 and Fig. 4). Wells deeper than 150–200 m show a sharp reduction inaverage As concentration, and in the percentage of wells that exceed theBangladesh standard for arsenic (Table 1). The ‘cut-off’ depth is likely todepend on the nature of the aquifer and on the presence of intermediate claylayers and is therefore likely to vary with location. Relatively few wells inthe depth range 90–150 m were sampled (most were from the Sylhet region)but it appears that many of these contained high concentrations of arsenic.Therefore, wells in this region may need to exceed 150m before low-Aswater is encountered. Only 3 (1%) of the deep wells ( greater than 150 m)exceeded A more detailed investigation of both the deep aquiferand the deeper part of the shallow aquifer is needed across Bangladesh. Thisshould be linked to the geology and sedimentology as well as to details ofthe construction of the tubewells.
The average As concentration appears to fit a ‘bell-shaped’ depthdistribution with the maximum concentration being found in the 15–30 mdepth range. A broadly similar bell-shaped depth trend has been recognisedin West Bengal where the aquifer has traditionally been divided into threeunits with the middle unit, Unit 2, being described as the ‘arseniferous’ unit(Bhattacharya et al., 1997; Chowdhury et al., 1999; PHED, 1991). Thegeographical distribution of shallow and deep wells in this survey is far fromuniform (Fig. 2). Many of the wells deeper than 200 m were from thesouthern coastal region. Very few deep wells were found or sampled in therest of Bangladesh. It is therefore not possible to extrapolate the results fromthe relatively few deep wells sampled to the other parts of Bangladesh whichare not well represented in the NHS coverage.
8. The scale of the groundwater arsenic problem in Bangladesh 223
1.4.4.2 Variation of arsenic with well depth
affected villages in Bangladesh, for example, Chapai Nawabganj(Nawabganj district) and Char Ruppur (Pabna district).

Chapter 8224
Of the few deep wells investigated in Faridpur as part of more detailedinvestigations (Smedley et al., 2001), two wells contained arsenicconcentrations exceeding This is in an area which does not have athick, confining clay layer at intermediate depths. Moreover, there is reasonto believe that in the worst of these cases, the borehole may have also beenscreened in the shallow aquifer. Occasional relatively high As concentrationshave been found in groundwaters from ‘deep’ tubewells recently installed byDPHE in the As-affected areas. Of 170 ‘deep’ tubewells recently drilled byDPHE to assess the water quality in the deep aquifer in various parts ofBangladesh, 95% were below the Bangladesh arsenic standard (unpublisheddata).
1.4.4.3 Variation of arsenic with surface geologyDepth is an important variable, but is just one of many – the geology and
hydrogeology of the aquifers are also important. Each of the sampled wellswas assigned to a geological unit based on the Geological Survey ofBangladesh (GSB) classification as given on the geological map ofBangladesh (Alam et al., 1990). This geological classification is only basedon the surface geology, and in that respect can only be expected to have adirect influence on the behaviour of the underlying aquifer where there is aclose relationship between surface geology and subsurface geology. As thedepth of the well increases, this relationship is likely to become weaker.Nevertheless, with this caveat, it usefully distinguishes between regionshaving major geological differences.
Classification of sample sites by surface geological unit (Table 2) showsthat the highest arsenic concentrations were found in the groundwaters fromrecent deltaic and alluvial deposits with more than half of the well watershaving As in each of the Estuarine deposits, Chandina alluvium,deltaic silt and deltaic sand units. These are also amongst the most abundantdeposits. 30.5% of the shallow wells in recent alluvial and deltaic unitscontained As
On the other hand, the lowest As concentrations were consistently foundbeneath the older deposits including the Tertiary and Quaternary depositsand the Pleistocene Barind and Madhupur Clay. There were very few wellsexceeding associated with these deposits. Wells in the ‘oldgravelly sand’ unit, and to a lesser extent the ‘young gravelly sand’ unit, alsogave low As concentrations. These units form part of the Tista Fan in north-western Bangladesh where the sediments tend to be young, coarse, with lowiron oxide concentrations and often lacking in a thick overlying layer ofsilt/clay.

8. The scale of the groundwater arsenic problem in Bangladesh 225
Groundwater from the Chandina alluvium has amongst the highest Asconcentrations. There are two major areas mapped as Chandina alluvium andthese may differ in age and diagenetic history. The larger area is nearComilla in the south-east while there is a smaller area near Mymensinghnorth-east of the Madhupur Tract (Fig. 1). The chemical compositions of thewell waters from these two areas are quite distinct – the southerly blockcontained high concentrations of arsenicwhile, with one exception, the northerly Chandina alluvium gave very lowgroundwater As concentrations Thegroundwaters from the northerly area also contained relatively littledissolved Fe by Bangladesh standards It is thereforelikely that the wells in the northern part of the Chandina alluvium derive

The variation in arsenic and sulfate concentrations between June 1999and March 2000 in the piezometers and the adjacent deep tubewell atLakshmipur is shown in Fig. 6. There is some variation with time but inmost cases there is no convincing trend. There are indications of adecreasing trend in arsenic with time at 30 m and 50 m, and of sulfate at40 m but the reasons for these are not clear. They may reflect a recoveryperiod following drilling. The 50 m piezometer gave a low yield which maymake the results for this depth unrepresentative. The variation with depth is
1.4.5.2 Piezometer and deep tubewell water quality
Chapter 8226
their water from the older underlying sediments of the Madhupur Tract. Thisillustrates one of the limitations of using surface geology alone to classifythe wells.
Overall, the most significant observation is that high arsenicconcentrations are confined to the groundwaters from the most recent(Holocene) alluvial and deltaic sediments – conversely, groundwaters fromthe older sediments are normally essentially ‘arsenic-free’.
1.4.5
1.4.5.1
Variation of groundwater arsenic concentrations with timeand depth
Piezometer monitoringThere is a paucity of systematic information about the variation of
arsenic concentration with time or with depth for a given well. Five separateshallow piezometers (10 m, 20 m, 30 m, 40 m and 50 m depth) and one deeppiezometer (150 m) were therefore installed in each of the three SpecialStudy Areas. Water levels were monitored and water samples collected fromthese piezometers at approximately two-weekly intervals for ten months.The variation of water levels in the Lakshmipur piezometers is shown in Fig.5.
The water table is shallow and varies systematically between 1–3 mbelow ground level (Fig. 5). It is nearest the surface during the monsoonseason (July–October). This high water table and limited seasonalfluctuation is typical of southern Bangladesh. The five shallow piezometershave a common piezometric head and therefore appear to be in hydrauliccontinuity with one another. However, the deep (150 m) well has a differenthead indicating that the shallow and deep aquifers are either separated by aclay layer of low permeability or that pumping from the deep aquifer isresulting in a vertical hydraulic gradient. The borehole log shows that thelithology of the top 60 m is dominated by grey silts with occasional bands offine to medium sand but there is a layer of clay at 75–80 m which could actat as a confining layer. The most productive aquifers are found between100–130 m but these contain saline groundwaters.

8. The scale of the groundwater arsenic problem in Bangladesh 227
Historically hand-dug wells have provided drinking water in those partsof Bangladesh where other sources of water have been unreliable. This isparticularly true in the drier north-east region. Three dug wells in the ChapaiNawabganj Special Study Area were monitored at approximately fortnightlyintervals for a year. These gave consistently low As concentrations (usually
even though this was an area where the shallow tubewells
much more distinct. Arsenic increases rapidly from at 10 mto at 20 m. Thereafter there are no clear trends with depthdown to 50 m but there is a large decrease to between 50 and 150m. A nearby deep hand-pump tubewell (275 m depth) was also monitoredand this also gave consistently low As concentrations. It is not clear exactlywhere in the interval 50–150 m the decline in concentration takes place.
The sulfate concentrations are in most cases between 10–50 mand at 275 m but the concentration is considerably greater at 150 m. Thisfollows the well-established observation that water at intermediate depths inthe southern coastal region is saline and is why there are few wells in thisdepth interval in this region. The water at 150 m is strongly saline (Cl =
and the high sulfate concentration represents residualseawater sulfate that has not been reduced. Approximately half of theseawater sulfate remains. The water at 275 m is fresh (Cl concentrationapproximately and has a low sulfate concentration.
1.4.5.3 Dug wells

228 Chapter 8
1.4.5.4 Variation in arsenic concentration in groundwater with theage of the well
The data for the shallow wells (<150m) were divided into six classeswith respect to arsenic concentrations. Deep wells were excluded becausemost of their arsenic concentrations were very low. The percentage ofsampled wells in each class is shown in Table 3. Many of the high-As wellshave been constructed since 1990.
There is a trend for water from the oldest wells to contain larger Asconcentrations than water from the younger wells. It is however not possible
contained large concentrations of As (Smedley et al., 2001). It is believedthat this is because the open conditions characteristic of a dug well lead tothe shallow groundwater being not so strongly reducing as in an adjacenttubewell which in turn (for whatever reason) favors sorption of As to theiron oxides in the sediment. The shallowest horizons are also likely to be themost actively recharged with fresh rainwater which would also lead tosomewhat lower As concentrations. Therefore our limited data indicates thatdug wells can provide low-As water in areas where the tubewells containexcessive concentrations of arsenic.

8. The scale of the groundwater arsenic problem in Bangladesh 229
to deduce from this that the shallow wells have become more contaminatedwith time. There could be other correlated variables that may account for thetrend. For example, proportionately more sampled wells have been drilled inrecent years in the Rajshahi Division than further south and this is agenerally low-arsenic area. Long-term monitoring of individual wells isrequired to establish reliable time trends.
1.4.5.5 Spatial statistics for arsenicThe spatial dependence of the arsenic data for the shallow tubewells was
analysed using both classical and geostatistical methods (Gaus et al., 2001).An analysis of variance (ANOVA) using log-transformed arsenic data andstratified by districts demonstrated that the between-district variance wasmore than 40 times greater than the within-district variance, confirming thedistinct regional patterns shown by the map. More detailed spatial analysiswas undertaken by computing the variogram for arsenic (Fig.7). It wassuspected that the variogram for high-As areas (districts with a mean arseniccontamination exceeding might be different from the less-contaminated districts. However, this was found not to be the case (Gaus etal., 2001). A single variogram could therefore be applied to the wholecountry.

230 Chapter 8
The data fitted a spherical model with the following parameters:
where is the semi-variance for a separation of h (in km), c =0.724 and a = 48.1 km. The semi-variances including and c have units of
The variogram is smooth and has a range in excess of 125 km.This reflects the scale of variation of the major geological features. The‘nugget’ variance, is large and accounts for about 40% of the totalvariance in log terms. This nugget variance represents the variation thatoccurs at separations of less than about 2 km, the minimum intersampledistance, and includes sampling and analytical errors. The sampling errorsinclude short-term fluctuations in well water chemistry. These resultsdemonstrate the importance of arsenic variation at the village scale. Thedensity of sampling in the NHS was insufficient to provide any informationabout the nature of the variation in arsenic concentrations at the village scale.
Additional geostatistical analysis, particularly disjunctive kriging, wasundertaken in order to calculate the probability that particular wells wouldexceed given concentrations of arsenic and other solutes. This analysis wasalso used to calculate the smoothed maps shown in Fig. 4 and is discussed inmore detail in Gaus et al. (2001).
Using the 1991 Bangladesh census statistics, the population exposed toin its drinking water was estimated at either 28 million people or
35 million people depending on the method of overlaying the arsenic and

8. The scale of the groundwater arsenic problem in Bangladesh 231
population maps (by upazila or by disjunctive kriging to a 5 km grid,respectively). The corresponding figures for the WHO guidelinevalue were 46 million and 57 million, respectively.
Other water-quality parameters1.4.6
A broad range of parameters (mostly metals) was measured in the watersamples. These are of interest not only in terms of potential health impacts(e.g. Mn) and acceptability (e.g. Fe) but also in providing a betterunderstanding of the chemical evolution of the groundwaters and thereforepossible reasons for the arsenic concentrations. A summary of the averageconcentrations of a range of solutes in the shallow wells, subdividedaccording to major geological groupings is given in Table 4. ‘Deltaicdeposits’, for example, includes the deltaic sand (dsd), deltaic silt (dsl),estuarine deposits (de), tidal deltaic deposits (dt) and tidal muds (tm) units(the codes in parentheses refer to the codes used in the GSB map of Alam etal. (1990) and given in Table 2).
There are few strong inter-element correlations within these data. Thehighest correlations for the shallow groundwaters were between Na and B
and amongst the alkaline earth metals up to0.71). Arsenic was not strongly correlated with any of the solutes given inTable 4 – the highest correlation was between arsenic and the alkaline earthmetals and with phosphate but these were weak in all cases
1.4.6.1 IronThe concentrations of iron and manganese were high in most of the
groundwaters (Fig. 4). This reflects the prevalence of reducing conditions inthe aquifers. The distribution of Fe shows some similarity to that of As, e.g.both elements tend to be higher in the younger (Holocene) sediments than inthe older sediments, but the overall correlation is weakThe median Fe concentration in all sampled wells was and themaximum was The median concentration of Fe in high-As
shallow groundwaters was In common with As, theNHS highlights the large difference in Fe concentrations between theshallow tubewells (median Fe concentration, and the deeptubewells (median Fe concentration,
Particularly high Fe concentrations are found in the Jamuna valley and innorth-eastern Bangladesh. The broad north-south band of high-Fegroundwaters through central Bangladesh appears to follow the course of thepalaeo-Brahmaputra valley (Davies, 2001). High-Fe groundwaters are alsofound along the present Meghna valley but interestingly not along the courseof the Ganges. The lowest overall Fe concentrations are found ingroundwaters from the Barind and Madhupur Tracts and in the coarse
(linear data,

232 Chapter 8

8. The scale of the groundwater arsenic problem in Bangladesh 233
sediments from Tista Fan in the north-west. The Dupi Tila aquifers of theBarind and Madhupur Tracts occur in older (Plio-Pleistocene) sedimentswith longer histories of groundwater flow and sediment diagenesis. Thesediments of the Barind and the Madhupur Tracts are commonly brown oryellowish brown (Alam et al., 1990) and reflect past episodes of oxidativeweathering. The iron oxides in these sediments may therefore be less readilyreduced (being more crystalline) than those associated with the younger andpredominantly grey Holocene deposits. A band of relatively low-iron watersalso follows the north-south trending Gorai-Bhairab feature in south-westernBangladesh
The highest As concentrations are found in well waters with Feconcentrations in the range (Fig. 8) rather than in those with thehighest Fe concentrations. This is because some of the areas with relativelyFe-rich groundwaters have groundwaters with low concentrations of As, e.g.the Jamuna valley and north-eastern Bangladesh. It would be misleading toattempt to predict high As groundwaters on the basis of their iron contentsalone. On the other hand, low-Fe waters tend to have lowAs concentrations. Therefore the presence of a high Fe concentration is adefinite risk factor indicating a possible high-As groundwater but is not initself sufficient to make reliable predictions about the As concentration of agiven well. On the regional scale at least, there are other factors involved.
Iron is released by iron oxide reduction and from the weathering of otherFe-containing minerals such as biotite and chlorite. Some Fe-reducing

Like iron, manganese is also released microbiologically by the reductivedissolution of metal oxides, in this case manganese(IV) oxides. Manganeseconcentrations in Bangladesh groundwaters are generally high (Fig. 4),particularly along the line of the present-day Jamuna valley and its southernextension. They are lower in Sylhet to the north-east where ironconcentrations are notably high. The differences between iron andmanganese distributions are interesting and probably related in part to theirdifferent positions in the redox sequence – as the redox potential is lowered(the environment becomes more reducing), oxygen and nitrate will bereduced and then Mn(IV) followed by Fe(III) and At the near-neutralpHs of most Bangladesh groundwaters, Mn(II) is much more slowlyoxidized and precipitated than Fe(II). The largest manganese concentrationsmight therefore be expected to be found in groundwaters that are lessstrongly reducing than those with high iron and arsenic concentrations.These redox differences, especially after repeated redox cycles and themovement of water, can also lead to a separation in the abundance ofsecondary iron and manganese oxides in the sediments and may laterinfluence the scale of any re-dissolution.
Therefore the higher groundwater manganese concentrations in theJamuna valley may reflect the redox status of these groundwaters. These arebelieved to be less reducing those found in the more distal parts of the delta.However, the high concentrations may also reflect a higher source term –intrinsically larger sediment manganese oxide concentrations.
The Bangladesh standard for manganese in drinking water, based on itshealth effects, is Some 74% of groundwater samples collected inthe NHS exceeded this value and 35% exceeded the provisional WHOguideline value of
234 Chapter 8
1.4.6.2 Manganese
bacteria can use Fe(III) oxides directly to oxidize organic matter (withoutusing as the terminal electron acceptor). Bangladesh sedimentscontain up to 25% by weight of micaceous minerals and biotite frequentlymakes up a major component of this (Khan et al., 1998). The dissolution ofiron oxides is a microbiologically-mediated reaction and the bioavailabilityof iron oxides depends to some extent on their structure and crystallinity.Relatively freshly precipitated iron oxides, especially of the very fine-grained hydrous ferric oxide (HFO) type, tend to be the most readilybioavailable and are probably responsible for the very high Feconcentrations found in many Bangladesh groundwaters. HFO is particularlyabundant in soils and sediments that are, or have been, subject to changingredox conditions. All other things being equal, dissolved Fe concentrationscan be expected to be greatest in young sediments.

8. The scale of the groundwater arsenic problem in Bangladesh 235

Arsenic and manganese are the two elements for which the health-relatedwater quality standards are most commonly exceeded in Bangladesh. Somegroundwaters exceed both of these standards while others pass one standardbut fail the other (Fig. 9). The correlation is important for assessing theoverall distribution of perceived risk posed by these two constituents. TheNHS survey has shown that many groundwaters from north-western Bangla-desh in particular have low arsenic but high manganese concentrations.Overall, the survey found that 8% of samples exceeded both of Asand of Mn, while 48% of samples were below both of thesecriteria. Groundwaters from the Barind and Madhupur Tracts (includingDhaka), from the deep aquifer in the southern coastal region and Sylhet andfrom the shallow but coarser sediments of north-western Bangladesh alltended to comply on both counts.
As was found with iron, there is a significant difference between thenumber of exceedances for Mn in shallow and deep wells. 39% of shallowwells exceeded the WHO guideline value for Mn and 67% exceeded one orother of the As and Mn WHO guideline values. The figures for the deepwells (>150 m) are 2% and 7%, respectively. The magnitude of the WHOguideline value exceedances for As was greater than for Mn: of the shallowwells exceeding the respective WHO guideline values, the ratio of averagewell water concentration to guideline value was 13 for As and 2.5 for Mn.This is important when considering the possible health impacts of theexceedances.
The sampled groundwaters had relatively high P concentrations. Amedian P concentration of was observed for the shallowgroundwaters and for the deep groundwaters. The maximum Pconcentration in the shallow groundwaters was and in deepgroundwaters was The median concentration of P in high-As
shallow groundwaters was The highest Pconcentrations were found in groundwaters from south and easternBangladesh and especially from along the Chittagong coast (Fig. 10). Thesehigh P concentrations are often associated with saline conditions whichaccount for their prevalence near the coast and in areas recently (in thegeological sense) inundated by seawater. The high median P concentration inthe deep groundwaters reflects the generally high concentrations found in thesouthern coastal area. This contrasts with that of arsenic where the deepgroundwaters sampled had almost invariably low arsenic concentrations. Inother parts of the country and for shallow groundwaters, the P map showssome similarity to the As map (Fig. 3) although the overall correlation ispoor (linear data, n=3204).
236 Chapter 8
Phosphorus1.4.6.3

Sulfate concentrations in groundwaters in Bangladesh are normally verylow (for analytical reasons, the ‘sulfate’ referred to in this section is actually‘total sulphur’, expressed as sulfate). Concentrations from the NHS rangebetween and in the shallow groundwaters andbetween and in the deep groundwaters. Although themaximum values are high, the median values in both the shallow and deepgroundwaters are below which is low for groundwaters and reflectsthe reducing nature of most groundwaters in Bangladesh.
The concentrations of sulfate were generally lowest in the south-westernand southern parts of Bangladesh as well as in the Sylhet region in the north-east. Low concentrations of sulfate can be found under strongly reducingconditions as a result of sulfate reduction. The deep groundwaters from thesouthern coastal region had mostly low sulfate concentrations
The low sulfate concentrations found in Bangladesh, even where Naconcentrations were high, suggest that some bacterial sulfate reduction hasoccurred. Sediments from Bangladesh are generally Fe-rich which providesthe Fe necessary for iron sulfide formation. Such sulfate reduction issupported by limited isotopic data from the Special Study Areas and thelow ratios relative to seawater in the more saline groundwaters ofLakshmipur upazila, indicating sulfate loss from solution (Smedley et al.,2001). Sulfate reduction appears to have been an important process in boththe shallow and deep aquifers. Authigenic pyrite including framboidal pyrite,although rare, has been observed by SEM in some sediments fromBangladesh (Pearce et al., 2001).
Sulfate concentrations were typically higher in the north,particularly in groundwaters from the Tista Fan, the Jamuna valley and theRajshahi–Pabna area (Ganges and Atrai Floodplains) and from parts of theBarind Tract (although Madhupur Tract groundwaters appear to have lowsulfate concentrations, typically Relatively high sulfateconcentrations can also occur in areas affected by residual seawater (south-eastern Bangladesh and the Sylhet Basin; Kinniburgh, 2001). Thegroundwaters of northern Bangladesh are thought to be more oxidizing thanthose from the more southerly parts of the delta, a conclusion supported bymeasurements of redox potential (NRECA, 1997; Smedley et al., 2001).High sulfate concentrations may be derived from residual seawater, fromsurface pollution (many of the groundwaters from the Jamuna valley inparticular are abstracted from shallow depths) or from the oxidation ofsulfide minerals (e.g. pyrite) in the zone of water table fluctuation. Theseprocesses are difficult to distinguish given the available geochemical data. Ifthe relatively high sulfate concentrations are derived by oxidation of pyrite,then this does not appear to be a mechanism for the release of arsenic sincethe high-sulfate groundwaters typically contain low As concentrations.
1.4.6.4 Sulfate
8. The scale of the groundwater arsenic problem in Bangladesh 237

As noted above, the groundwater chemistry can provide additionalinformation about the likely composition of the aquifer sediments. This isparticularly true for the alkaline earth elements (Mg, Ca and Sr in particular)since their concentrations are often controlled by the dissolution andprecipitation of carbonate minerals.
The regional distribution of ‘hardness’ (i.e. Ca plus Mg) is shown in Fig.4. This probably reflects the distribution of free carbonates in the sedimentswith areas of hard water reflecting their presence and low hardness areasreflecting their absence. The most probable carbonate minerals are calcite
and dolomite The absence of pH and bicarbonatedata from the National Hydrochemical Survey dataset means that saturationindices for these minerals could not be calculated. However, data from thethree Special Study Areas (Smedley et al., 2001) suggest that there is bothcalcite and dolomite saturation, even slight supersaturation.
Barium correlates only weakly with these cations. and readilysubstitute for in calcite whereas does so much less readily becauseof its substantially larger ionic radius. It appears from the NHS that theHolocene sediments derived from the River Ganges (south-western andsouth-central Bangladesh) probably contain free calcium-magnesiumcarbonates. Soils developed from the sediments in this region are alsodefined as carbonate-rich (Brammer and Brinkman, 1977). In contrast, theHolocene sediments of the Tista Fan (north-west) and the north-east haorregion of the Sylhet Basin, as well as the older Quaternary and Tertiarysediments of the Chittagong area, probably do not contain free carbonates.Concentrations of Ca in these latter groundwaters are less thanThis is also true for the deep groundwaters from the southern coastal region.
These alkaline earth elements are also derived from other minerals,including aluminosilicates, which reduces the overall correlations. Wherethere has been a substantial inundation of seawater in the past, some Mg mayremain from this source: for every of Na that is derived fromresidual seawater, there will be Mg along with small amounts of Ca
Sr and Ba The effects of ion exchangecan alter these simple relationships.
238 Chapter 8
1.4.6.5 Magnesium, calcium, strontium and barium
1.4.6.6 Other elementsSodium, potassium and boron are indicators of groundwater salinity and
reflect relict seawater influences either by marine inundation of low-lyingareas or saline intrusion of near-coastal aquifers. Potassium can also bederived from mineral reactions (weathering of clays, ion exchange) and soalthough the distribution of K bears some similarity to that of Na and B,differences also occur (Kinniburgh and Smedley, 2001). Concentrations ofNa, K and B are in general greater in the deep groundwaters sampled in the

NHS. This reflects the large proportion of deep groundwaters sampled fromthe southern coastal region and the Sylhet Basin.
In addition to the major and minor elements discussed above, a selectionof trace elements was also measured by ICP-MS in 16–18 samples from theNational Hydrochemical Survey. The samples were selected on the basis oftheir high Fe and Mn concentrations determined previously by ICP-AES.The data are therefore biased in terms of metal-rich groundwaters, but givean indication of water quality in these groundwaters. Statistical summariesare given in Table 5. The results indicate that even in these samples,concentrations of most analysed trace metals are below recommended WHOguideline values for drinking water. Exceptions were most commonly foundfor U for which the provisional WHO guideline value is The lowconcentrations of ‘heavy metal’ elements such as Cu and Pb probably reflectcontrol by active sulfide mineral precipitation.
8. The scale of the groundwater arsenic problem in Bangladesh 239
1.5 Other extensive national hydrochemical surveys
Two other large-scale surveys for arsenic have been undertaken sincearsenic became an issue in Bangladesh. Starting in 1993 and particularlysince 1997, DPHE has undertaken a large number of arsenic analyses usingboth field-test kits and laboratory analyses. The results of these, as of 1998,were summarised in DPHE/BGS/MML (1999). The 1997 DPHE/UNICEFsurvey based on nearly 23,000 samples analysed with field-test kits was themost extensive, and was the first to show the regional pattern for the wholeof Bangladesh. Since the survey only tested whether there was detectablearsenic or not (so-called ‘yes/no’ results), it could only show the percentageof tested wells in which As was detected, not the magnitude of thecontamination (the detection limit of the early field-test kits was probably inthe range Nevertheless the patterns revealed werebroadly similar to those shown by the NHS. The greatest difference arisesfrom the fact that the field-test kits were rather insensitive at thelevel and so the DPHE/UNICEF survey did not provide reliable resolutionfor areas in which most wells contained As in the range. Thisincluded extensive areas of alluvial sediments in northern Bangladeshespecially along the Jamuna valley.
The School of Environmental Sciences, Jadavpur University, Calcuttaand Dhaka Community Hospital (SOES/DCH) have also carried out, and arecontinuing to carry out, extensive surveys of arsenic in wells acrossBangladesh (e.g. DCH, 1997; SOES/DCH, 2000). Their surveys haveidentified severe arsenic contamination in many areas, including northernBangladesh, and have so far reported contamination in 43 outof 64 districts in Bangladesh. The affected populations were estimated to be51 million drinking water with and 25 million drinking water

with As, slightly lower than our estimates from the NHS. Theyhave found that 12% of the ‘deep’ (100–300 m) tubewells from areasoverlain by ‘Flood Plain and Deltaic’ sediments had arsenic concentrationsexceeding Tubewells greater than 300 m depth mostly had Asconcentrations of less than but 22% contained arsenic between 10and Tubewells less than 300 m deep from the ‘Flood Plain andDeltaic Plain (including coastal region)’ (n = 371) were mostly (except forfour wells) below but about 22% of tubewells had arsenicconcentrations in the range While we have not seen a map ofthe arsenic distribution from these surveys, it is believed to be broadlysimilar to that shown by the NHS.
240 Chapter 8
Dhaka deep tubewells1.6
Dhaka is a city of some nine million people and derives its water supplyfrom more than 200 tubewells with depths of approximately 100 m.Groundwater samples were collected from seven public supply wells withinDhaka city.

Sediments from Bangladesh vary in texture from coarse sands and gravels toclays and are frequently found as a series of upwardly-fining sequences. Insome places, the texture can vary on a centimetre depth scale. The sands andsilts are dominated by iron-coated quartz particles, feldspars, micas andlithic fragments with small amounts of calcite and heavy minerals (Khan etal., 1998; Pearce et al., 2001; Rahman and Hossain, 1999). The clays aredominated by a smectite-illite-chlorite clay mineral assemblage with minoramounts of kaolinite and contain variable amounts of fine-grained calcite.The sediments contain variable amounts of organic matter, often less than0.5% (Pearce et al., 2001), although concentrations are sometimes muchgreater and occasionally include peat horizons.
Early work by the Public Health Engineering Department, Governmentof West Bengal (PHED, 1991) reported that ‘arsenic is present as adsorbedions on clay particles/quartz particles and also as primary arsenicmineral(s)’. X-ray diffraction of the ‘arseniferous horizons’ was reported tohave shown traces of arsenopyrite. The reported As contents of sedimentsfrom Kochua, West Bengal were extremely low, in all cases,and below the detection limit (probably about in the sandyhorizons.
More recent studies have identified pyrite in the sediments (but notarsenopyrite). Chowdhury et al. (1997) found selected grains having Asconcentrations in excess of However, these studies do notreflect overall sediment concentrations and these high As concentrationswere for sediments from depths exceeding 100 m where As concentrations inthe groundwater are generally low.
Other studies have commented on the paucity of pyrite. For example,Khan et al. (1998) noted the ‘lack of any significant of pyrite/arsenopyrite’
These wells derive their water from the Plio-Pleistocene Dupi Tila aquiferwhich lies beneath the Madhupur Clay. The screened interval of the wells isunknown. The chemical analyses (Table 6) indicate that the groundwater isof low salinity B (data not shown); 0.6–
Concentrations of most trace elements are low to very low. Inparticular, As concentrations are all and P concentrations are lessthan or equal to (data not shown). The low As concentrations arebelieved to have been confirmed by other more extensive, but unpublished,surveys of Dhaka city water. Dissolved iron concentrations are also low
Of the measured elements which have WHO health-basedguideline values, only Mn has any exceedances: one sample had a Mn con-centration of which just exceeds the provisional Guidelinevalue of
2418. The scale of the groundwater arsenic problem in Bangladesh
1.7 Mineralogy and sediment chemistry

242 Chapter 8

8. The scale of the groundwater arsenic problem in Bangladesh 243

Chapter 8244
in sediments from a high-As region of Bangladesh but did note theabundance of iron-rich coatings on many of the sand particles. Ourobservations (DPHE/BGS/MML, 1999; Pearce et al., 2001) are thatauthigenic pyrite can be found in the sediments but that it is rare. We foundthat the total As content of a selection of sediments from high-Asgroundwater areas ranged from 0.4 to 10.3 mg As (n = 21) and tendedto be greatest in the clay-rich horizons even at depth. This is in the normalrange for sediments (Smedley and Kinniburgh, 2002)
Selective dissolution of the sediments with acid ammonium oxalate, areagent that is efficient at dissolving ‘amorphous’ iron oxides of the HFO-type as well as magnetite and probably other reduced iron oxides, extractedby dissolution and desorption up to nearly of arsenic, i.e.,approximately half of the arsenic present. There was a strong correlationbetween the amount of Fe dissolved and the As extracted but there were alsostrong correlations between the extracted Fe and many other elementsincluding Mg, Al and P. Oxalate extracts of sandy sediments from 13 sitesacross Bangladesh showed that there was a strong correlation between theaverage amounts of and extracted (Fig. 11). Multiple linearregression of the oxalate extract data, retaining the top two predictors, gave
where the oxalate-extractable As and Mg concentrations are in units of mgand is in percent by weight. is believed to be related to the
clay content of the sediments. This suggests that iron oxides and clays arethe principal sources of extractable As with about ¾ of the As being derivedfrom iron oxides. Furthermore all of the sediments from areas with low-Asgroundwaters (including sediments from the Dupi Tila aquifer) containedless than 0.15% and less than
It appears from this indirect evidence that high As groundwater areas inBangladesh tend to have sandy sediments with a relatively highconcentration of oxalate-extractable arsenic and that this may in turn berelated to the relatively high concentration of oxalate-extractable iron oxidesand clays. The nature of the iron oxides in sediments from Bangladesh isuncertain. Many of the sandy sediments in the arsenic-affected aquifers aregrey, not brown, and it is likely that the oxides in these sediments are at leastpartially-reduced Fe(II)-Fe(III) oxides, possibly with a green rust structure.
Recent studies of sediments from Ramrail, Brahmanbaria in easternBangladesh by USGS/GSB (Foster et al., 2000) found 24 m of grey, reducedHolocene sediments overlying brown, oxidized sediments probably ofPleistocene age. The total As contents of the sediments were in the range 1–
A 5–10 cm thick Fe-rich layer had an As content ofand XANES spectra confirmed that most of this As was present as As(V). In

8. The scale of the groundwater arsenic problem in Bangladesh 245
the grey reduced sediments, most of the solid-phase As was present asAs(III) and was associated with clays, micas or Al oxyhydroxides. In thebrown sediments, most of the solid phase As was present as As(V) and wasassociated with iron oxides. The concentration of As in the groundwater wasgreater in the Holocene sediments than in the Pleistocene sediments but thehighest concentration occurred close to the redox boundary.
There is much speculation about the reasons for the high arsenicconcentrations in groundwaters in Bangladesh and elsewhere. It is useful inthese discussions to consider three aspects of the problem: the source of thearsenic, its mobilization and the extent of its present and past transport ormovement in the groundwater flow.
The total amount of arsenic present in sediments from Bangladesh,typically appears to be in the normal range for alluvial anddeltaic sediments (Smedley and Kinniburgh, 2002). Therefore on a globalscale, total concentrations of arsenic in sediments do not appear to be a goodguide to the likelihood of their associated groundwaters developing high-Asconcentrations – there are many sediments with As in this concentrationrange that do not host high-As groundwaters. Drinking water guidelines for
1.8
1.8.1
Causes of the groundwater arsenic problem
Processes involved

Chapter 8246
arsenic are also very small in relation to the amount of arsenic present intypical sediments. The dissolution or desorption of just 1 mg As from anaquifer sediment to groundwater is sufficient to give an As concentration inthe groundwater of some and so would exceed the WHO guidelinevalue by more than two orders of magnitude. Groundwater is therefore verysensitive to any disturbance to the solid-solution equilibria controllingdissolved arsenic concentrations.
Given this, and since trace amounts of arsenic are associated with manyminerals and organic matter, it is difficult to rule out any particular sources,even apparently minor sources, at the outset. A good quantitativeunderstanding of the processes involved is required and at present, this is notavailable. Plausible sources of arsenic that have been suggested include:arsenopyrite, pyrite, iron oxides, biotite, chlorite, organic matter and evenphosphate fertilizers. The possible sources and mechanisms of release can bereduced by considering ancillary ‘evidence’ including the concentrations ofother solutes, both major and minor, and the nature of the sediments and thesediment-water interactions.
Hydrological factors and time are also likely to play a key role and theseleave relatively little trace in present-day groundwater. For example, it isnow apparent that high As-groundwaters are often associated with sedimentsin which groundwater flow is small and in which the cumulative flushingsince burial has been minimal. The necessary low hydraulic gradients arefound in flat, low-lying areas such as deltas, in closed inland basins and indeep ‘dead end’ aquifers. Younger sediments like those in Bangladesh aretherefore particularly ‘at risk’ since the cumulative flushing that has takenplace through them will be less than for similar, older sediments. Thiscombination of geologically young sediments with hydrologically oldgroundwater appears to be an important factor in the development of manyAs-rich groundwaters.
1.8.2 The source of arsenic
Historically, high-As groundwaters have mostly been associated withmining and mineralized areas, and the affected areas have been quitelocalized Areas of geothermal activity are also often associatedwith As-rich groundwaters and this can affect quite large areas (Smedley andKinniburgh, 2002).
It is not surprising therefore that when high-As groundwaters were firstdiscovered in West Bengal, and later in Bangladesh, there was a search for apossible As-rich source. For example, there has been speculation of high-Assource minerals being derived from the Rajmahal Traps and the RajmahalBasin of eastern Bihar (Acharyya et al., 1999; Khan, 1995). This persistentspeculation delayed the realization that high-As groundwaters are possible
(a few ).

8. The scale of the groundwater arsenic problem in Bangladesh 247
without invoking unusual primary sources. High-As groundwaters are nowbeing recognised in alluvial sediments and deltas around the world and evenin lake and ocean sediments (Smedley and Kinniburgh, 2002). This points toa single source of widespread occurrence, or of many different sources. Theevidence from Bangladesh is that it is primarily young (Holocene) sedimentsthat are affected. In the Bengal Basin, where the rate of sedimentation hasbeen very rapid and the volume of Holocene sediments is correspondinglylarge, many wells are developed (screened) in these young sediments withtheir potentially As-rich groundwaters. This may explain why the mostextensive groundwater arsenic problem so far in deltaic environments isassociated with the largest delta in the world.
Given this background, it is only possible at present to pose hypothesesand to test them against the available data. The two main hypothesesregarding the source and mobilization of As that have emerged are: (i) thepyrite oxidation hypothesis, and (ii) the iron oxide reduction hypothesis. Anumber of other hypotheses have also been proposed but so far, at least, withless widespread support. We discuss these below. A more detaileddiscussion is given in Kinniburgh (2001).
1.8.3 Pyrite oxidation hypothesis
This hypothesis was strongly advocated by West Bengal scientists in1995 (Chatterjee et al., 1995; Chowdhury et al., 1997). It is based on the ideathat arsenopyrite, or later As-rich pyrite, was initially present in thesediments and has been at least partially oxidized as a result of the recentseasonal lowering of the water table. This lowering has been attributed to theuse of groundwater for irrigation and, by some, to the construction of theFarakka barrage (a controversial dam that was completed in 1975 across theRiver Ganges in West Bengal close to the West Bengal-Bangladesh borderand which diverts River Ganges water to the Bhagirati-Hoogly River andultimately to Calcutta). This hypothesis therefore supports the notion that therelease of arsenic to the groundwater is a recent phenomenon induced byman’s activities.
Certainly such a hypothesis is a possibility and needs to be considered.However, proponents of the hypothesis have offered little scientific evidencein support of it other than demonstrating the presence of pyrite in thesediments. On the contrary, the evidence is strongly against such ahypothesis for the following reasons:
The presence of pyrite in at least some of the sediments is not in doubt,although the amounts are usually small and can be difficult to observeand to quantify. Arsenopyrite, if present, is certainly rare. Given thestrongly reducing nature of the groundwaters in much of Bangladesh and,in many cases, their recent evolution from saline water containing

abundant sulfate, pyrite formation by sulfate reduction is expected. Pyriteneoformation therefore seems more likely than pyrite dissolution. Limitedsulphur isotopic data (Smedley et al., 2001) are consistent with sulfatereduction in the reducing sediments rather than oxidation. Themorphology of the pyrite observed in the sediments also confirms this – itdoes not show signs of the corrosion that would be expected if oxidationwere taking place. The formation of pyrite is more likely to scavengearsenic from the porewater rather than to release it. However, theextensive areas of Bangladesh with high concentrations of arsenic ingroundwater suggest that this process does not remove sufficient arsenicto generate low dissolved concentrations.
Extensive oxidation of pyrite releases large amounts of sulfate and yet theevidence from the NHS and many other studies is that sulfateconcentrations in high-As groundwaters in Bangladesh are usually low,often Where high sulfate concentrations are found, these arenot correlated with high As concentrations. There is no convincingevidence for the formation of secondary sulfate minerals and indeed thisis unlikely given the low sulfate concentrations found in most Bangladeshgroundwaters.
The groundwater As problem is greatest in the south-east of Bangladeshwhere the water table is highest and where there is only a smallunsaturated zone (1–3 m at Lakshmipur). There is a much thickerunsaturated zone and a greater seasonal fluctuation of the water table innorth-western Bangladesh, although the groundwater arsenicconcentrations there are generally low. The greater depth to the watertable and the greater zone of fluctuation in the north-west reflectshydrologic factors as well as the greater use of groundwater for irrigation.The pyrite oxidation hypothesis would predict high-As groundwaters inthis area, not the low concentrations observed. The severely As-affectedareas in south-east Bangladesh are too far away from the Farakka barrageto be significantly influenced by it. Many are part of the Meghnacatchment, not the Ganges catchment.
The pyrite oxidation hypothesis would predict that arsenic concentrationswould be greatest in the shallowest groundwaters close to the water tablesince this is where the influence of oxidation would be greatest. The NHSresults indicate that this is not the case: the Lakshmipur piezometers showthat arsenic concentrations increase sharply between 10 and 20 m ratherthan decrease. This is also supported by the NHS data which shows thatthe very shallowest wells (<15 m) tend to have lower As concentrationsthan the deeper wells. Dug wells would also be expected to be the sourceof high As concentrations whereas the evidence is precisely the opposite.
248 Chapter 8

8. The scale of the groundwater arsenic problem in Bangladesh 249
The hypothesis does not account for the high phosphate concentrationsfound in many of the As-affected groundwaters. While arsenic andphosphate may not be directly related, there is considerable evidence thatthere is at least some relationship between the two. Fertilizers have beensuggested as this link but high phosphate concentrations arefrequently found at considerable depths (>50 m) and do not show thepattern with depth expected if phosphate fertilizer was the principalsource. Quite high phosphate concentrations were alsofound in our piezometers in Chapai Nawabganj town. These are locatedfar from an obvious fertilizer source.
The situation in Bangladesh has some similarities with conditions at a sitein the Atlantic Ocean shelf off the Amazon Basin, where in the absenceof an unsaturated zone, the observed high pore water As concentrationscannot be related to pyrite oxidation (Sullivan and Aller, 1996).
1.8.4 The iron oxide reduction hypothesis
The iron oxide reduction hypothesis was used to explain the high Asconcentrations in some groundwaters from Ohio, USA by Matisoff et al.(1982) and later more generally by Korte (1991). It has been applied to theWest Bengal and Bangladesh situations by Bhattacharya et al. (1997),Nickson et al. (1998) and DPHE/BGS/MML (1999).
Despite a common title, the hypothesis has many variations and subtletiesand various authors have interpreted it in significantly different ways. Forexample, there is much confusion between the processes of ‘dissolution’ and‘desorption’. These are distinctly different processes although they mayoccur simultaneously in the same way that adsorption processes can beresponsible for metal uptake during coprecipitation – ‘reductivecodissolution’ is perhaps an appropriate description of the proposed releasemechanism. Also, the role of organic matter and of competitive desorptionby ions such as phosphate and bicarbonate are stressed to varying degrees.
The following factors lend support to some kind of iron oxide reductionhypothesis:
Iron oxides have long been known to be efficient scavengers of arsenic –a property widely used for arsenic removal in water treatment plants.They are present to a varying extent in Bangladesh sediments and there isusually a good correlation between the arsenic and iron concentrations ofsediments.
There is strong circumstantial evidence that the release of arsenic isassociated with the imposition of strongly reducing conditions, i.e. wheresulfate reduction is taking place, both from the maps of arsenic andsulfate and from the relationships.

Reductive dissolution of iron oxides is a well-established process bywhich iron oxides can be dissolved. However, the detailed mechanism bywhich trace constituents are released is poorly understood. While the As–Fe correlation in Bangladesh groundwaters is often significant in thestatistical sense, it is usually far from perfect and there is an example inChapai Nawabganj (DPHE/BGS/MML, 1999), where more than 1 mg As
was found in a groundwater with This implies eitherthat some of the iron has been reprecipitated or adsorbed (perhaps duringtransport) or that the arsenic was released without a congruent release ofiron, i.e. that desorption was important. This is more widely supported bythe relatively high As/Fe molar ratios in groundwater compared with thatfound in the sediments.
Experimental results and model calculations show that reduction ofstrongly bound As(V) to As(III) is a plausible mechanism for the releaseof As from iron (and other) oxides under reducing conditions (Zobrist etal., 2000). As(III) is known to be the dominant species in most of thehigh-As groundwaters in Bangladesh (Smedley et al., 2001) and has beenshown experimentally to be present in reduced Bangladesh sediments(Foster et al., 2000). The rate of this reductive desorption is unknown butis likely to be rapid on a geological timescale (here meaning ‘thousandsof years’). Recent results from the USGS/GSB study in Ramrail haveshown that the dominant mechanism of arsenic sorption changes fromiron oxide-As(V) in the oxidized sediment to clay-As(III) in the reducedsediments pointing to the lesser importance of iron oxides in the reducedsediments – a feature that is consistent with our interpretation of the ironoxide reduction hypothesis. The extent of reductive desorption is poorlyunderstood quantitatively, particularly in the presence of highconcentrations of other strongly bound anions such as phosphate andbicarbonate (Kinniburgh, 2001).
Simultaneous release of phosphate and arsenic from a common sourceprovides at least a partial explanation for the high phosphateconcentrations found in many Bangladesh groundwaters and for thespatial correlation between As and P that is sometimes observed (Fig. 3and Fig. 10). Gavrieli et al. (2000) came to a similar conclusion;
Little is known about the diagenetic changes that iron(III) oxides undergowhen they are buried, especially under strongly reducing conditions, butit is likely that some changes in mineral structure take place. This isindicated, for example, by the red/brown to tan/grey colour change that isobserved across redox boundaries and observed in Bangladesh sediments.Any changes in bulk or surface coordination or in specific surface areawould be likely to alter the overall adsorption isotherm of the bulksediment (Kinniburgh, 2001).
250 Chapter 8

Suggestions that the use of arsenic wood preservatives was in some wayresponsible for the groundwater arsenic problem were discounted byscientists early on (NRECA, 1997) although such arguments continued toappear in the Bangladesh press for some time. As the enormous scale of theproblem became apparent, such local sources became increasingly lessplausible.
The same can be said for the hypothesis that points to the leaching ofphosphate fertilizers as the primary source of high P groundwaters andindirectly to As-rich groundwaters through the competitive desorption ofarsenic, especially As(V), from the sediments. Such competitive reactionsmust be occurring given the known groundwater chemistry but there is noevidence that they are the primary driving force behind the As release. Forexample, there are As-rich groundwaters that are not P-rich (and vice versa),and as mentioned above, at a detailed level, the spatial pattern of high-P andhigh-As waters does not match that expected from a predominantly fertilizersource. This makes fertilizers an unlikely cause of the present-day arsenicproblem although future phosphate leaching could exacerbate the problem inthe shallowest groundwaters. Finally, as discussed below, the inferred timingof arsenic release does not implicate fertilizer leaching as a primary drivingforce for the As release.
8. The scale of the groundwater arsenic problem in Bangladesh 251
Changes in the nature of the overall adsorption isotherm for As (or of oneof its competitors), for whatever reason, could lead to the release ofarsenic to groundwater. We know that even small changes can be highlysignificant in view of the sensitivity of groundwater to small changes inadsorbed amounts.
Other hypotheses1.8.5
1.8.6 The timing of the arsenic release and temporal changes ingroundwater arsenic concentrations
Since arsenic was not detected in groundwater in Bangladesh untilrelatively recently, there is no direct information on when the arsenic wasinitially released to the groundwater. This is presently the source ofconsiderable discussion amongst scientists and has implications for how thearsenic concentrations might change with time. It also has implications forthe scope and likely efficacy of possible mitigation measures. The relativelyrecent appearance of arsenic-affected patients has been assumed by some topoint to the recent release of arsenic (Acharyya et al., 2000; Chowdhury etal., 1997). However, the timing of the appearance of arsenic patients is onlyrelated to the timing of the arsenic release in so far as it confirms that thearsenic has been present in the groundwater for sufficiently long to have

caused chronic health problems, i.e. more than six or so years. The recentrapid expansion in the use of tubewells for drinking water in Bangladeshmeans that, not surprisingly, the increase in the detection of the number ofarsenic patients is also recent. Dug wells have a longer history of use thantubewells in Bangladesh but as we have indicated above (Section 1.4.5.3),these tend to have low As concentrations and are unlikely to have led tochronic arsenicosis.
The issue of changes in arsenic concentration with time is complex andthere are many factors involved. First, there is the issue of when the arsenicwas first mobilized, that is released from some non-labile mineral or organicphase in the sediment to a labile form such as dissolved or exchangeablearsenic. Secondly, there are questions about the subsequent movement of Asin the aquifer both as a result of the movement of water under naturalhydraulic gradients (‘aquifer flushing’) and as a result of gradients inducedby pumping. This redistribution within the aquifer will lead to changes in Asconcentration at a particular well with time. Such chromatographicmovement of As involves the continual sorption-desorption of theexchangeable arsenic and so it is in principle possible to have water andarsenic of different ‘ages’.
There are two schools of thought about the time of the initial Asmobilization: either (i) it is recent and has been induced by man’s activities[there are proponents of this who support both the pyrite oxidationhypothesis and the iron oxide reduction hypothesis (Acharyya et al., 2000)],or (ii) it occurred much earlier and is therefore dominantly a ‘natural’process. While we believe that an early release date, (ii) above, is the morelikely, this is not to imply that man’s recent activities have not had, or willnot have, any impact on the extent of the groundwater arsenic problem. Forexample, recent changes in land use such as irrigation will not only alter thegroundwater flow patterns but could also affect the boundary conditions foroxygen diffusion into the aquifer and so could also affect its redox status(Bhattacharya et al., 1997).
The most direct evidence concerning the age of the arsenic mobilizationand release is probably from isotopic measurements. For example, in theLakshmipur Special Study Area in SE Bangladesh, there are high-Asgroundwaters which contain essentially no tritium (Smedley et al., 2001).This points to a dominantly pre-1952 ‘age’ for the groundwater and so doesnot support the concept that it was the introduction of recent oxygenatedwater into the aquifer as a result of water table lowering that led to theformation of high-As groundwaters. On the other hand, high-Asgroundwaters have been found in other parts of Bangladesh (e.g. ChapaiNawabganj in north-west Bangladesh) which contain significant tritiumconcentrations and point to a component of recent (post-1952) recharge.
Chapter 8252
Radiocarbon measurements for a small number of shallow groundwatersfrom our Special Studies Areas gave a enrichment generally in the rangeof 65-95% modern carbon, suggesting that the water contains a largecomponent that is ‘modern’ (probably less than 1000 years old; Smedley etal., 2001). Radiocarbon activities in the few deeper (> 150 m) groundwatersmeasured indicated enrichments of 18-51% modern carbon with modelledgroundwater ages in the range 2000–12,000 years. These deep groundwatersall contained low As concentrations.
These results indicate that the shallow groundwaters are predominantlymodern in the sense but are not necessarily modern in the tritium sense,i.e. they are likely to be in the range 50–1000 years old. As indicated above,the initial As release must be older than this. Not surprisingly, the isotopicresults from the three Special Study Areas suggest that the youngest watersare most likely to be found where the annual water table fluctuation isgreatest, i.e. in the north west of Bangladesh rather than the south east. It isuncertain how many pore volumes of recharge water have passed throughthe sediments since the As was first mobilized but early calculations basedon field and laboratory evidence suggest a sediment/water partitioncoefficient for the affected Bangladesh sediments on the order of 2–6 L(Smedley and Kinniburgh, 2002). This indicates a low retardation coefficientfor the As, probably of less than two. Studies of the variation of sedimentand porewater chemistry over the scale of metres and tens of metres areneeded to establish the nature of the sediment/water interactions and theextent of mixing.
It is clear that given the extremely heterogeneous nature of the sediments,groundwater flow may induce variations in arsenic concentration at thetubewell as a function of time. In general, the greater the volume of pumpedgroundwater, the greater the extent of mixing in the aquifer is likely to be.Therefore initially at least, present-day low-As wells may increase in Asconcentration and high-As wells may decrease. The evolution of Asconcentration for a particular tubewell will depend on many factorsincluding the distribution of labile As in the aquifer in relation to thescreened interval and the groundwater flow. The labile arsenic in the aquiferwill gradually be removed in the pumped groundwater or discharged to therivers and the sea. However this is unlikely to occur on a human timescale,or even for thousands of years.
Changes in the extent of contamination of deep wells are an importantissue. While West Bengal scientists, e.g. CGWB (1999) have claimed thatthe results of repeat testing of boreholes, even deep tubewells, show atendency for the arsenic concentration in individual tubewells to increasewith time, the detailed data demonstrating that have not been published in anaccessible form. From our experience, in at least one of the deep wells wherethis occurred, this appears to be due to downhole leakage from the shallow
8. The scale of the groundwater arsenic problem in Bangladesh 253

About one quarter of the tubewells sampled in the NationalHydrochemical Survey of Bangladesh groundwaters gave groundwaterexceeding the Bangladesh standard for arsenic and 42%exceeded the WHO guideline value. High arsenic concentrations are almostentirely restricted to groundwaters from shallow aquifers (<150m) inalluvial and deltaic sediments largely of Holocene age. The maximumconcentration found exceeded and 5.6% of shallow wells (<150m) sampled exceeded a concentration where the lifetimeprobability of dying from various forms of cancer are likely to exceed 1:100and may be 10 times greater than that (Smith et al., 2000). Aquifers in older(Plio-Pleistocene) aquifers including those from the Barind and MadhupurTracts and from greater depths (>150 m) are usually not affected andfrequently contain groundwater with As Most of the deepaquifers sampled were from the southern coastal region and this observationmay not apply to the deep aquifer everywhere in Bangladesh. The deep wellsin Sylhet appear to contain more As than those from the southern coastalregions, possibly as a result of multiple depth screening of Sylhet tubewells.Water from dug wells and to a lesser extent from the shallowest tubewells(<10 m) have relatively low As concentrations, perhaps as a result of slightlymore oxidizing conditions and the greater degree of flushing and dilutionwith recent recharge.
aquifer (RGAG & RGACG, 2000) and this may account for other cases too(BGS and DPHE, 2001). Deep wells in the southern coastal region ofBangladesh have been operating for more than a decade without beingcontaminated with saline water from the shallow aquifer. This suggests that,in this region at least, vertical leakage to the deep aquifer is minimal. Thesituation may be different in other parts of Bangladesh where there may notbe such an extensive clay layer separating the aquifers.
The results of the relatively short-term monitoring, as described above,do not provide convincing evidence of any systematic changes within theaquifer over a 10-month period. Modelling of possible time trends in Asconcentrations in Bangladesh aquifers (Burgess et al., 2000) suggests thatmany shallow wells presently free of As will eventually becomecontaminated. However, such calculations depend critically on the nature ofgroundwater flow, the distribution of As in the aquifer sediments and thenature of the sediment/water interactions. A longer-term monitoringprogramme needs to be instigated at a few representative places. Thismonitoring should include all major solutes as well as arsenic and shouldconsider all of the temporal scales involved (minutes to years and longer). Itshould also cover a range of pumping rates.
Chapter 8254
1.9 Conclusions

Groundwater As concentrations show distinctive spatial trends, with thehighest average concentrations in the south and south-east of the country. Inthe worst-affected district, Chandpur, 90% of the sampled wells werecontaminated with As Apart from the occasional ‘hot spot’ inthe north, concentrations there are considerably lower and are frequently, butnot always, Relatively high concentrations arefound in the low-lying areas in the north-east and beneath the Holocenesediments of the Brahmaputra valley. Some high concentrations are alsofound in groundwaters from the Holocene sediments of the Jamuna valley.Of the shallow groundwaters from Holocene sediments, the north-westregion (Tista Fan) has the most consistently low As concentrations.
The affected groundwaters are invariably reducing, usually with lowsulfate concentrations, and often are relatively hard, having high Ca and Mgconcentrations. They also tend to have a high concentration of phosphate anddissolved iron Many groundwaters contain high manganeseconcentrations although the distribution does not match that of arsenicclosely. Groundwater from coastal areas is impacted by saline intrusion andsuffers from high boron concentrations. Deep wells tend to have betterquality, not only in terms of arsenic, but also in terms of manganese andiron. However, boron concentrations are commonly high in the deep coastalaquifer.
Analysis of seven deep public supply wells from Dhaka city showed thatthey all contained As. These wells also had low concentrationsof most other analysed trace elements. Concentrations of Cd, Cr, Pb, Ni, Sband U were substantially below WHO health-based Guideline values. One ofthe Dhaka wells exceeded the WHO guideline value for Mn.
The spatial pattern of As concentrations in the Holocene aquifer isbelieved to reflect a complex interrelationship between the lithology of theaquifer, its redox characteristics and the history of groundwater flow withinthe aquifer. High As concentrations in the south and south-east reflect thestrongly reducing conditions in the aquifers in this area, poor permeability ofoverlying sediments, higher proportions of finer-grained material and ironoxides and slow rates of groundwater movement resulting in low rates ofaquifer flushing.
In the north-central Jamuna valley, many groundwaters have very highconcentrations of Fe (often exceeding and Mnrelative to most of Bangladesh, and many have high concentrationscompared to the high-As groundwaters further south. The young sedimentsof the Jamuna valley are thought to be undergoing active reduction but havenot achieved such strongly reducing conditions overall as in the high-Asareas of southern Bangladesh. This may be for a number of reasons for this:less fine-grained sediment at the surface and hence less restriction ofrecharge and dissolved oxygen to the aquifers, shallow well depths and a
8. The scale of the groundwater arsenic problem in Bangladesh 255
(up to )

relatively thick unsaturated zone compared to further south, and perhapsmore active groundwater flow. Some of the higher concentrations maybe related to the lack of sulfate reduction or even to in situ sulfide oxidation.However, if sulfide oxidation has occurred, it apparently has not resulted insubstantial As mobilization as As concentrations are relatively low in the
groundwaters. In contrast, the high-As groundwatersfrom the Jamuna valley have very low concentrations, typically 1 mg
or less, and indicate that these are more strongly reducing. This associationof high As with low as elsewhere in Bangladesh, precludes sulfideoxidation as the dominant cause of arsenic mobilization, althoughgroundwaters from some tubewells may have been affected by this process.
Low As concentrations in groundwaters from the Tista Fan deposits ofnorthern Bangladesh occur in generally more oxidizing conditions with lowoverall Fe concentrations. These redox characteristics probably reflect thecoarser grain size of the Tista Fan sediments and lack of impermeablesediment cover, as well as more active flushing of the aquifer in this region.
The regional distributions of Fe and Mn in the groundwaters alsostrongly reflect redox controls. Nationally, the Fe distribution shows a weakcorrelation with that of As. Despite the strong redox control of Fe and Mn,these two elements have differing regional distributions which probablyreflect differing redox potentials at which the respective reactions take place.Many groundwaters exceeded the health-based provisional WHO guidelinevalue for manganese.
Distributions of Na, B and K largely reflect seawater influences, with thegreatest contributions from old seawater in southern Bangladesh (shallowand deep aquifers), the Sylhet Basin and the Atrai Floodplain north of theRiver Ganges. Potassium is also derived from mineral weathering reactions.Distributions of Ca, Mg, Sr and to some extent Ba, reflect the distributionsof free carbonates in the aquifer sediments and soils. Concentrations aregenerally highest in south-west Bangladesh. Of the elements considered, Asrepresents by far the worst recognized inorganic problem in Bangladeshgroundwaters.
We thank all those who helped in the collection and analysis of thesamples discussed in this Chapter. In particular, we thank Peter Ravenscroftfor coordinating the Bangladesh input to the NHS Phase I, AshfiquzzamanAktar, Khairul Amin, Khairul Bashar, Abdul Malek, Abdul Noor, Md RabiulIslam, Shahidul Islam, Md Ibrahim Khalil, Md Taibur Rahman, AbdusSalam and DPHE district staff for sampling and Linda Ault, SallyBourliakas, Simon Burden, Jenny Cook, Kerry Dodd, Suzan Gordon and
256 Chapter 8
ACKNOWLEDGEMENTS

2578. The scale of the groundwater arsenic problem in Bangladesh
John Thorns for chemical analyses, Balt Verhagen for the tritium analyses,Azharul Huq for access to the Dhaka wells and the people of Bangladesh,particularly from Mandari, for allowing us access to their wells. We alsothank John Talbot for GIS support, Richard Webster for help with thegeostatistical analyses, Willy Burgess and Ian Gale for constructive reviewsand the UK Department for International Development (DFID) for fundingand support. This Chapter is published with the permission of the Director ofthe British Geological Survey (NERC).

This page intentionally left blank

Chapter 9
Mechanisms of Arsenic Release to Ground Waterfrom Naturally Occurring Sources, Eastern Wisconsin
ME Schreiber1, MB Gotkowitz2, JA Simo3, and PG Freiberg4
1Department of Geological Sciences,Virginia Tech, BlacksburgVA2Wisconsin Geological and Natural History Survey, Madison WI3Department of Geology and Geophysics, University of Wisconsin-Madison, Madison WI4Redwood National Park, Orick CA
Arsenic concentrations up to have been measured in ground waterfrom a sandstone aquifer in the Fox River valley in eastern Wisconsin, USA.In addition to a sulfide-bearing secondary cement horizon (SCH), which is
present at the top of the aquifer, sulfide mineralization is also presentthroughout the aquifer. Within the SCH, arsenic occurs in pyrite andmarcasite, and in iron hydroxides, but not as a separate arsenopyrite phase.Geologic, hydrogeologic, and geochemical data were used to characterize thearsenic source and the predominant geochemical process that controls itsrelease to ground water. Several lines of evidence suggest that oxidation ofsulfides is the cause of high concentrations of arsenic in groundwater, including 1) the presence of the arsenic-bearing sulfides in the aquifer;2) water chemistry data that show a positive correlation between arsenic, iron,
and sulfate and negative correlation between arsenic and pH; and 3) similarsulfur isotopic signatures in sulfides of the SCH and dissolved sulfate inground water. We propose that atmospheric oxygen, introduced to the SCH
through well boreholes, provides an oxidant to the system. This hypothesis is
supported by the occurrence of high arsenic concentrations where water levelswithin the well intersect the SCH. However, the data do not unequivocally
show sulfide oxidation to be the cause of the moderate and lowarsenic concentrations measured in ground water in the study area.
The variability in thickness of the SCH and the concentration of arsenic withinthe sulfides, as well as the local availability of oxygen to the SCH, likely
contribute to the spatial variability of ground water arsenic concentrations.

260 Chapter 9
1. INTRODUCTION
Arsenic contamination of ground water has been attributed to severalgeochemical processes, including oxidation of arsenic-bearing sulfides,desorption of arsenic from oxides and hydroxides, reductive dissolution ofarsenic-bearing oxides and hydroxides, release of arsenic from geothermalwaters, and evaporative concentration (Welch et al., 2000), as well asleaching of arsenic from sulfides by carbonate (Kim et al., 2000). Due to thecomplexities of these processes and the potential occurrence of simultaneousprocesses, identification of mechanisms responsible for a particular case ofarsenic contamination is often difficult. For example, there has beenconsiderable controversy over the cause of arsenic contamination of groundwater in Bangladesh. Some researchers have proposed sulfide oxidation asthe predominant mechanism for arsenic release (Bagla and Kaiser, 1996;Dipankar et al., 1994; Mandal et al., 1996) while others contend thatreduction of iron hydroxides is the cause of high dissolved arsenicconcentrations in ground water (Bhattacharya et al., 1997; McArthur et al.,2001; Nickson et al., 2000).
Multiple lines of evidence are needed to distinguish mechanisms thatrelease arsenic to ground water in a particular setting. To fully document theprocess of arsenic release, the lines-of-evidence approach should incorporatedata on the: (1) geologic setting, to constrain the petrologic, stratigraphicand/or structural controls on the occurrence of arsenic-bearing units; (2) sitemineralogy, to determine the mineralogic hosts of arsenic; (3) hydrogeologicsetting, to delineate ground water flowpaths and to understand local water-rock interactions; (4) water chemistry, to examine the relationship betweenarsenic and key chemical parameters; (5) isotopes, to infer mechanism ofrelease; and (6) subsurface microbiology, to evaluate the role of bacteria inthe geochemical processes that control arsenic release. Accurate assessmentof the mechanism of arsenic release will help to identify safe drinking waterresources and to evaluate treatment methods for contaminated waters.
The lines-of-evidence approach was used to determine causes of elevatedarsenic concentrations in the Fox River valley (FRV) of eastern Wisconsin.As part of this study, geologic and water level mapping were conducted toevaluate the regional source of the arsenic and the relationship of the sourceto the regional and local water levels. Quarry outcrops and rock cores wereexamined to determine the distribution of arsenic-bearing minerals and toobserve stratigraphic control on mineralization. Ground water chemistrydata were used to assess correlations between arsenic and other chemicalparameters. The results of these analyses were then used to evaluatehypotheses of arsenic release to ground water.

9. Mechanisms of Arsenic Release to Ground Water from NaturallyOccurring Sources, Eastern Wisconsin
261
1.1 Arsenic release via sulfide oxidation
Oxidation of arsenic-bearing sulfides has been implicated as the cause ofarsenic contamination of ground water in regions of active and historicmining in many regions worldwide (e.g. Armienta et al., 1997; Ball andNordstrom, 1985; Bottomley, 1984; Moore, 1994; Nicolli et al., 1989; Priorand Williams, 1996; Smedley et al., 1996). Sulfide oxidation has also beenidentified as the source of arsenic in ground water of non-mined areas (e.g.Gotkowitz et al., 2000; Peters et al., 1999). The rates of, and conditionsleading to, sulfide oxidation have been extensively reviewed (e.g. Bierens deHaan, 1991; Goldhaber, 1983; Lowson, 1982; McKibben and Barnes, 1986;Moses et al., 1987; Nicholson et al., 1988; Nordstrom, 1982; Toran, 1987;Wiersma and Rimstidt, 1984). Pyrite oxidation can follow several reactionpathways. The first is the chemical oxidation of pyrite by oxygen:
A second possible pathway is the oxidation of pyrite by nitrate:
Pyrite can also be oxidized by Fe(III):
Fe(III) is regenerated by oxidation of Fe(II):
Under abiotic conditions, reaction (4) is slow (Singer and Stumm, 1970).However, under low pH conditions, acidophillic iron-oxidizing bacteria,including Thiobacillus and Leptospirillum spp., mediate the oxidation ofFe(II) to Fe(III) (reaction (4)), allowing for reaction (3) to proceed severalorders of magnitude more rapidly than under abiotic conditions (e.g.Nordstrom and Southam, 1997; Schrenk et al., 1998). It is important to notethat at the near-neutral pH and low dissolved organic carbon (DOC)concentrations typically observed in drinking water aquifers, dissolvedFe(III) is controlled by the precipitation of iron hydroxides. Thus, in watershaving near-neutral pH, the majority of Fe(III) will be in the solid orcolloidal phase, which is important for arsenic release and transport for tworeasons. First, at near-neutral pH, dissolved Fe(III) will not be present athigh concentrations unless it is complexed to DOC and will consequently bea less important oxidant than dissolved oxygen (DO) or nitrate. Second,arsenic adsorbs strongly to iron hydroxides (e.g Dzombak and Morel, 1990;Fuller et al., 1993; Korte, 1991; Pierce and Moore, 1982). Thus, if ironhydroxides are present as coatings on aquifer materials, arsenic transport

may be retarded via adsorption. However, if colloidal-size iron hydroxidesare present, arsenic may undergo colloidal transport.
Because sulfide oxidation can occur via multiple pathways and canproceed under both biotic and/or abiotic conditions, a step-wise approach isuseful for documenting its occurrence. A primary piece of evidence is thepresence of arsenic-bearing sulfides. The second requirement of sulfideoxidation is the presence of an oxidant. Dissolved oxygen (reaction (1)) isthe most ubiquitous oxidant of reduced compounds in the unsaturated zoneand in shallow ground water. In areas where nitrogen has impacted groundwater supplies, nitrate (reaction (2)) may act as a sulfide oxidant (e.g.Postma et al., 1991). At lower pH or in the presence of DOC, dissolvedFe(III) can be a significant oxidant, particularly in the presence of iron-oxidizing bacteria (reactions (3) and (4)).
The reaction by-products of sulfide oxidation are distinct; thus, evidenceof sulfide oxidation can be found in the chemical signatures of ground water.In aquifers where sulfide oxidation occurs, ground water chemistry shouldshow a positive correlation of arsenic with sulfate, iron, and trace metalscontained in the sulfide minerals. Increases in total dissolved solids andspecific conductance also result from sulfide oxidation, due to an increase ofdissolved ions in the impacted waters. Ground water impacted by sulfideoxidation may reveal a negative correlation of arsenic with pH, provided thatthere is minimal buffering capacity provided by the host rocks.
The sulfur isotopic signature in sulfide minerals and in sulfate in groundwater may also be used to evaluate the occurrence of sulfide oxidation.Although fractionation of sulfur isotopes can occur due to biological andredox cycling (e.g. Kaplan and Rittenberg, 1964), in most cases of sulfideoxidation, minimal fractionation between sulfide and sulfate is observed(Toran and Harris, 1989). This suggests that similar sulfur isotopicsignatures in sulfide minerals found within the aquifer and in sulfate fromground water are indicative of sulfide oxidation.
Microbiological evidence can also be used to infer the occurrence ofsulfide oxidation. The presence of acidophillic bacteria, such asThiobacillus or Leptospirillum, in ground water or attached to aquifersurfaces strongly suggests bacterial involvement in sulfide oxidationreactions. More commonly found in ground water and boreholeenvironments are Gallionella, Siderocapsa, and Crenothrix, neutrophilliciron-oxidizing bacteria. These bacteria may influence sulfide oxidation bymediating oxidation of Fe(II) to Fe(III) within the borehole (reaction (4)).
262 Chapter 9

9. Mechanisms of Arsenic Release to Ground Water from Naturally 263Occurring Sources, Eastern Wisconsin
2. CASE STUDY: FOX RIVER VALLEY,NORTHEASTERN WISCONSIN
In the Fox River valley (FRV), which extends from Lake Winnebagoto Green Bay in eastern Wisconsin, USA (Fig. 1a), high concentrations ofarsenic (up to several mg/1 ) have been measured in drinking water wellscompleted in the Ordovician Sinnipee Group, St. Peter Sandstone, andPrairie du Chien Group (Burkel and Stoll, 1999; Gotkowitz et al., 2000;Pelczar, 1996; Simo et al., 1996). These formations provide a significantportion of the drinking water in eastern Wisconsin.
Arsenic contamination is of concern in the region due to the highconcentrations and widespread occurrence of the problem (Fig. 2).According to data collected by the Wisconsin Department of NaturalResources (WDNR), approximately 21% of private water supply wells inOutagamie and Winnebago counties exceed about 4% of the wells

264 Chapter 9
exceed Elevated arsenic has also been observed in localized regionsof Brown County. Within these broad areas, there is significant variability inarsenic concentrations. Wells located near each other with similar casingdepths, static water levels and total depths, show vastly different levels ofcontamination. For example, in Algoma township (Fig. 1a), four similarlyconstructed wells located within a distance of 350 m had arsenicconcentrations of 2, 36, 765 and respectively.
2.1
2.1.1 Geologic Setting
Conditions in the Study Area
A simplified stratigraphic section through the study area is presented inFig. 1b. In the study area, Precambrian rocks are overlain by a thicksuccession of Cambrian sandstones. The sandstones are in turn overlain bythe Ordovician Prairie du Chien Group, the St. Peter Sandstone, and theSinnipee Group (Fig. 1b). The Prairie du Chien Group consists ofdolomitized oolitic limestones, muddy facies, and stromatolites, with cyclicinterbedded thin sandstones and shales. A majorunconformity (Tippecanoe

9. Mechanisms of Arsenic Release to Ground Water from NaturallyOccurring Sources, Eastern Wisconsin
265
unconformity; Sloss (1963) separates the Prairie du Chien Group from theSt. Peter Sandstone and the Sinnipee Group. This break is reflected by apaleokarstic topography (Mai and Dott, 1985). The St. Peter Sandstone,which fills the karst topography and pinches out against Prairie du Chienhighs, contains a lower eolian unit and an upper marine unit. The overlyingSinnipee Group, consisting of dolostone with minor shales, represents theprogressive marine flooding of the craton and drowning of the siliciclasticsource in the Middle Ordovician (Choi, 1998). Typically, the SinnipeeGroup rests upon the St. Peter Sandstone; in areas of karstic highs where theSt. Peter is absent, it rests upon the Prairie du Chien. Quaternary glaciallyderived sediments overlie the Ordovician strata. These unlithified depositsare predominantly fine-grained till, a mixture of silty or sandy clay withsome gravel. In the FRV, the thickness of glacial deposits ranges from 15 to30 m (Batten and Bradbury, 1996).
Fig. 1b illustrates the stratigraphic position of a concentrated zone ofsulfide mineralization, referred to as the sulfide cement horizon (SCH)(Simo et al., 1996). The SCH is laterally extensive across the study area andis present at the base of the Sinnipee Group and the top of the St. PeterSandstone. In regions where the St. Peter Sandstone is absent, the SCH isfound at the top of the Prairie du Chien. In addition to the SCH, sulfidemineralization occurs throughout the St. Peter as bands and nodules.
2.1.2 Hydrogeologic Setting
There are three primary aquifers in the Fox River valley (Fig. 3); an upperunlithified aquifer, a middle sandstone aquifer (herein called the St. Peteraquifer), and a deep sandstone aquifer (Conlon, 1998; Krohelski, 1986). Theupper aquifer is unconfined and is made up of glacial sediments andweathered dolomite of the Sinnipee Group. The unweathered portion of theSinnipee Group separates the upper aquifer from the St. Peter aquifer and isgenerally considered a confining unit. The St. Peter aquifer consists of thePrairie du Chien Group and the St. Peter Formation. The St. Lawrence-Tunnel City confining unit separates the St. Peter aquifer from the deepsandstone aquifer (Batten and Bradbury, 1996; Conlon, 1998; Krohelski,1986). Residential and other low-volume supply wells are generally open tothe Sinnipee and the upper portion of the St. Peter aquifer. Wells servingmunicipalities and large industries in the FRV are typically open to the St.Peter and the deep sandstone aquifers. Due to high rates of groundwaterwithdrawal, the potentiometric surface of the St. Peter and deep sandstoneaquifers is declining at a rate of approximately 0.6 m/yr (Conlon, 1998).

266 Chapter 9
The St. Peter aquifer is regionally unconfined in the western portion of theFRV where the Sinnipee Group is absent, and is regionally confined in theeastern portions where the Sinnipee is present (Fig. 3). The general directionof ground water flow in the St. Peter and deep sandstone aquifers is from theregional ground water divide toward the regional discharge area (LakeMichigan) and pumping centers near the Fox River. Both the St. Peter andthe deep sandstone aquifers receive recharge from an area between theerosional edge of the Sinnipee Group and the regional ground water divide.
Because residential wells are often open to both the St. Peter aquifer andthe overlying confining unit, water levels do not provide an accuratemeasurement of hydraulic head in the aquifer. Therefore, the water levelsmeasured in residential wells are termed “static water levels”. This isdistinguished from the “potentiometric surface”, defined by water levels inwells open only to the confined St. Peter and deep sandstone aquifers.
3. METHODS
3.1 Rock and mineral analysis
Whole rock analysis was performed on 32 samples of the SCH todetermine the concentration of arsenic and other elements. Samples werecollected from the SCH at quarry locations within the study area and fromone drill core from just outside the study area. All samples were crushed andpulverized prior to analysis. Measurement of 34 elements was performed byneutron activation, inductively coupled plasma spectrometry, or titrimetric

9. Mechanisms of Arsenic Release to Ground Water from NaturallyOccurring Sources, Eastern Wisconsin
267
methods by Bondar-Clegg, Inc. Mineral phases and elemental compositionsof the SCH were determined by X-ray diffraction (XRD) and electronmicroprobe analysis (EMPA) using energy dispersive spectrometry (EDS).Transmission electron microscopy (TEM) was used to examine spatialvariations in arsenic concentrations within individual crystals.
3.2 Groundwater chemistry
Geochemical data from wells in the Fox River valley region wereprovided by WDNR. All ground water samples were collected by WDNRpersonnel, and thus, field sampling procedures are assumed to largelyconform to WDNR protocol (Lindorf et al., 1987). Procedures for samplingfrom water supply wells include sample collection from a cold-water tapsituated prior to in-line treatment systems. Taps are flushed for 3 to 5minutes in order to purge standing water in the pipes. Samples for cation andmetals analysis are preserved with nitric acid. In all cases, arsenic wasanalyzed using ICP-AES or ICP-MS at laboratories certified by the State ofWisconsin. Detection limits ranged from 0.6 to 3 µg/l. Analyses of otherwater quality parameters also followed standard procedures and wereconducted at certified laboratories. Because samples were typically collectedfor assessment of drinking water quality, samples were not filtered.Therefore, the metals concentrations reported represent total, rather thandissolved phase, constituents. Redox data are not routinely collected byWDNR. Thus, information on redox conditions of regional ground waterwas compiled from other sources (Batten and Bradbury, 1996; Pelczar,1996; Saad, 1996; Siegel, 1989; Weaver and Bahr, 1991).
3.3 Other analyses
WDNR scientists collected one sample of the SCH and a groundwatersample from a highly impacted well for sulfur isotope analysis (J. Pelczar,personal communication, 1996). Sulfurisotope analysis was performed atthe University of Waterloo Environmental Isotope Laboratory (UWEIL,1994). Isotope data are reported as permil differences from the CanyonDiablo troilite.
One water sample, collected from the same highly impacted well, wasanalyzed by the Wisconsin State Laboratory of Hygiene for iron- and sulfur-oxidizing bacteria.

268 Chapter 9
4. RESULTS AND DISCUSSION
4.1 Characterization of Sulfide Cementation
Pyrite and marcasite are the major minerals forming the sulfide cement, asidentified by XRD and optical microscopy. These sulfides occur as bothwell-formed cubes and anhedral masses. Arsenic-rich areas (up to 1% byweight as estimated by EDS) occur in the pyrite and marcasite crystals aswell as in iron hydroxides, but no separate arsenopyrite phase has beenidentified. Colloidal size (10-20 nm) iron hydroxide phases were identifiedusing TEM. TEM-EDS analysis showed qualitative differences in arsenic,nickel, and zinc in the iron hydroxides on a nanometer scale.
The SCH contains four styles of mineralization, as shown in Fig. 4a: (1) alayer <0.5 to 30 cm thick, fairly continuous, consisting of sulfide-cementedquartz sandstone (uppermost St. Peter Sandstone, and lowest sandy-dolostone of the Sinnipee Group) (Fig. 4b); (2) a zone up to 3 m thick, in theSt. Peter Sandstone (or the Prairie du Chien Group, if the St. Peter Sandstoneis absent) with sparse to common sulfide nodules; (3) a zone 0.2-0.6 m thickconsisting of thin (1-10 mm) bands of sulfide cement with sharp or diffuseboundaries that reflect mineralization across or within sedimentarystructures; and (4) a zone of nodules filling moldic porosity (up to 8 cm indiameter) in the lowest 3 m of the Sinnipee Group and within the uppermost1.5 m of the Prairie du Chien Group if the St. Peter is absent. The style ofmineralization is variable at the scale of the study area as well as at smaller(e.g., quarry) scales.
In addition to the concentrated horizon, sulfide mineralization occursthroughout the St. Peter sandstone in bands and nodules. Fig. 5 illustrates
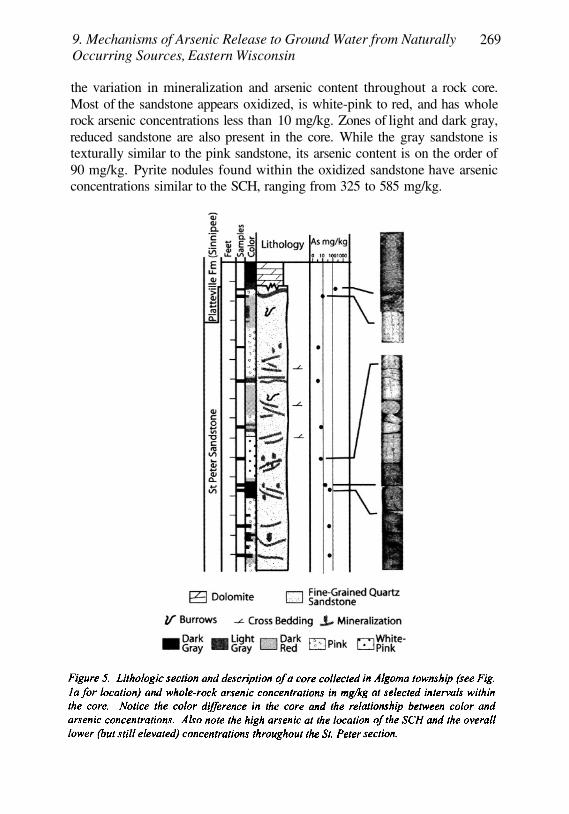
9. Mechanisms of Arsenic Release to Ground Water from NaturallyOccurring Sources, Eastern Wisconsin
269
the variation in mineralization and arsenic content throughout a rock core.Most of the sandstone appears oxidized, is white-pink to red, and has wholerock arsenic concentrations less than 10 mg/kg. Zones of light and dark gray,reduced sandstone are also present in the core. While the gray sandstone istexturally similar to the pink sandstone, its arsenic content is on the order of90 mg/kg. Pyrite nodules found within the oxidized sandstone have arsenicconcentrations similar to the SCH, ranging from 325 to 585 mg/kg.

270 Chapter 9
4.2 Ground water quality
Ground water samples were collected by WDNR for a variety of purposes(e.g., routine monitoring, studies designed to assess arsenic impacts, andstudies focusing on other water quality issues). Thus, each well was notanalysed for the same constituents. In addition, because some wells are opento more than one hydrogeologic unit, the results may reflect differencesbetween aquifers, rather than between waters affected by reactions with theSCH. However, comparison of the data to studies of regional water qualityaids in evaluating the water chemistry of arsenic-impacted wells with respectto background ground water.
For this study, we consider four types of water: non-impacted (arsenicbelow detection limit), low (greater than the detection limit and less than 10
moderate and high (greater thanTypical of water quality data, the data set is censored and as such, theconcentrations reported for most constituents are not normally distributed(Gibbons, 1994). Because of this limitation, box plots (Fig. 6) are used toevaluate and compare the water quality results. The distributions ofconcentrations were compared for iron, sulfate, pH, alkalinity, nickel, zinc,manganese and specific conductance (SC). The box plots should be viewedwith consideration of sample size, which is indicated on Fig. 6.
The data set for non-impacted ground water in this study (Fig. 6, Type A)is generally in agreement with studies of regional ground water quality(Saad, 1996; Siegel, 1989; Weaver and Bahr, 1991). The notable exceptionto this is the elevated sulfate, which on the basis of the 73 wells included inthe WDNR database, has an average concentration of 169 mg/l and rangesup to 1100 mg/l. Further examination of the data set shows that a majorityof wells with elevated sulfate concentrations are municipal supply wellsopen to both the St. Peter and the deep sandstone aquifer. An area ofrelatively saline groundwater is present in the vicinity of Lake Winnebago(Ryling, 1961) and is a likely source of the elevated sulfate levels in thesewells. The few shallow wells that exhibit elevated sulfate levels and nodetectable arsenic are located in the eastern portion of Brown County, wherethe source of sulfate may be gypsum dissolution from the overlying shaleconfining unit (Saad, 1996; Weaver and Bahr, 1991).
4.2.1 Chemistry of arsenic-impacted ground water
As illustrated in Fig. 6, ground water with low concentrationsof arsenic (Type B) has similar chemistry to non-impacted ground water,with pH ranging from 7 to 8, iron concentrations less than 10 mg/l, andsulfate concentrations below 200 mg/l. Althoughalkalinity concentrations

9. Mechanisms of Arsenic Release to Ground Water from NaturallyOccurring Sources, Eastern Wisconsin
271
have a similar range as the non-impacted water, the low-arsenic wellsdisplay a higher median concentration. The box plots of manganese, zinc,and to a lesser extent, nickel, show higher maximum concentrations for thelow arsenic wells than for the non-impacted wells. However, values for bothdata sets are within the same order of magnitude.
In wells with moderate arsenic concentrations (Type C),iron, pH, alkalinity, as well as nickel, manganese and zinc, appear elevatedabove background. Although moderate-arsenic wells show different waterquality from non-impacted wells, sulfate concentrations are within the rangeobserved for non-impacted water.

272 Chapter 9
In contrast, ground water with high arsenic concentrations(Type D) exhibits a distinctly different chemical signature than non-impacted water. Sulfate is notably higher, reaching concentrations over3000 mg/l. Iron concentrations, which range up to 1000 mg/l, aresignificantly higher than those measured in moderate, low, or non-impactedwater. The box plots also illustrate the low pH associated with the highlevels of arsenic, with values dropping to a minimum of 2.1. Levels ofnickel, manganese and zinc in the high-arsenic wells are orders of magnitudegreater than non-impacted wells. The increase in concentrations of ionsincreases the SC; values of SC range from 1000 toAlkalinity levels are similar to those in the low- and moderate-arsenic wells.
As illustrated in reactions (1) and (2), oxidation of pyrite by dissolvedoxygen (DO) or nitrate releases sulfate and iron in a molar ratio of 2. Groundwater samples with high arsenic exhibit a strong positive correlation betweensulfate and iron; the slope of the trendline, which represents the molar ratioof sulfate to iron, is approximately 2 (Fig. 7b; Table 1). These data stronglysupport sulfide oxidation. In contrast, ground water samples with low andmoderate arsenic do not exhibit a strong correlation (Fig. 7a; Table 1).
Sulfur isotope data provide additional evidence that sulfide oxidation isoccurring in the aquifer. The sulfur isotopic signature of pyrite fromthe SCH sample was -6.05 (-6.25 replicate) permil. This can be comparedto the of sulfate (-6.48 permil) in ground water to infer origin of the

9. Mechanisms of Arsenic Release to Ground Water from NaturallyOccurring Sources, Eastern Wisconsin
273
sulfate. The similar values of for sulfide and sulfate indicate a lack offractionation of sulfur isotopes between sulfide and sulfate, and aresuggestive of sulfide oxidation. Because the ground water sample wascollected from a well with an arsenic concentration above thisinference can only be made to the highly impacted wells and cannot beextended to all arsenic-impacted ground water in the region.
Iron-oxidizing bacteria, including Siderocapsa spp. and Crenothrix spp.,were measured in elevated concentrations (> 500 per mL) in a highlyimpacted well arsenic, pH 3.8). Although not a direct measure oftheir role in mediating and/or accelerating sulfide oxidation, the presence ofthese bacteria provides a potential for production of Fe(III), which can act asan oxidant of sulfides under low pH. Thus, in highly impacted wells, iron-oxidizing bacteria may accelerate sulfide oxidation.
4.3 Correlation of the SCH to elevated arsenic
Several types of information were used to assess stratigraphic constraintson arsenic concentrations in well water. Water level and well constructiondata were obtained from well records. Regional correlations of stratigraphicunits were inferred from field mapping and drill core.
The relationship of wells to stratigraphic unit and arsenic concentrationswas investigated by grouping wells according to the stratigraphic intervalover which they are open (Cambrian sandstones, Prairie du Chien Group, St.Peter Sandstone, Quaternary deposits). The maximum arsenic concentrationwithin each well group was noted, along with the percentage of wells in thegroup that had low, moderate, and high arsenic concentrations (Simo et al.,1996). This analysis did not demonstrate any obvious correlations betweenarsenic concentrations and stratigraphy. Arsenic concentrations range frombelow detection to in wells that are open to the SCH. Whilemost of the arsenic contamination in the FRV occurs in wells that are opento the SCH, arsenic is also present in wells that are cased through the SCH.
The relationship between the SCH and arsenic concentrations is clarified,however, if the static water levels in wells are considered. Fig. 8 shows thecorrelation between arsenic concentrations in well water, the relativelocation of the SCH, and the static water level measured in the individualwells. The highest arsenic concentrations (greater than occur inwells where the air-water interface in the well is within 15 m of the SCH,while lower concentrations (less than are found in wells with avariety of SCH-SWL configurations. It should be noted that not all wells thathave a static water level near the SCH have a high concentration of arsenic.

274 Chapter 9
This may be due to heterogeneity observed at local and regional scales of thethickness of the SCH and the associated mass of sulfides.
4.4 Possible causes of sulfide oxidation
In addition to recognizing sulfide oxidation as the process by whicharsenic is released to ground water, identification of the mechanism thatcauses sulfide oxidation is necessary to understand the controls on arsenic inwell water. Two issues of concern in the Fox River valley case are thenature of the oxidant and its source.
As previously discussed, DO, nitrate, and Fe(III) can each serve as anoxidant of sulfides. In the St. Peter aquifer in the study area, nitrate isgenerally present at concentrations less than 0.5 mg/l as N (Saad, 1996) andthe near-neutral pH and low DOC content of ground water precludes thepossibility of significant concentrations of dissolved Fe(III) on a regionalbasis. On a local basis, some wells exhibit low pH, and in these wells Fe(III)may be an important oxidant. Given that DO is the most ubiquitous oxidantin the near-surface, it is likely the most significant oxidant of the SCH.
In studies of oxidation of sulfides in surface or near-surface environments,the source of oxygen, the atmosphere, is obvious. However, in a partiallyconfined aquifer, DO is not necessarily present in significant concentrations.As illustrated in Fig. 9, several hypotheses have been posed regarding thesource of DO to the SCH: (1) oxygen-rich water infiltrates to the SCH in the

9. Mechanisms of Arsenic Release to Ground Water from NaturallyOccurring Sources, Eastern Wisconsin
275
recharge area; (2) vertical leakage of oxygen-rich water through theSinnipee confining unit initiates a regional oxidation of sulfides in the SCH;(3) partial dewatering of the St. Peter aquifer due to extensive ground waterwithdrawal exposes the SCH to oxygen; and (4) boreholes provide a directconduit for atmospheric oxygen to reach the SCH in areas where the staticwater level is coincident with, or below, the SCH.
4.4.1 Regional Recharge
As oxygenated water recharges the St. Peter, it flows past, and cantherefore interact with and oxidize, the SCH (Fig. 9a). Many wells impactedby arsenic occur within the recharge area (Fig. 2), where DO concentrationsof up to 2.5 mg/l are measured in ground water.
However, DO-enriched recharge water is not the sole source of oxidant tothe SCH across the FRV region. Between the erosional edge of the SinnipeeGroup (the confining unit) and the Fox River, where the St. Peter aquifer isregionally confined, DO concentrationsare less than 0.5 mg/l (Pelczar, 1996;Saad, 1996). Yet, high arsenic, in combination with high sulfate, iron,metals, and depressed pH, have been measured in ground water in this partof the study area. If DO in recharge water was the sole source of oxidant tothe SCH in the FRV, arsenic concentrations should be independent of staticwater levels. As shown in Fig. 8, low and moderate arsenic concentrationsare not correlated with the static water level, but high arsenic concentrationsare. This suggests that recharge may supply DO to the SCH in theunconfined portion of the St. Peter, causing low- and moderate arsenic

276 Chapter 9
impacts in this area, while another source of oxidant causes high arsenicconcentrations. This additional source appears to be related to the positionof static water levels with respect to the SCH.
4.4.2 Vertical Leakage
Where the St. Peter aquifer is confined by the Sinnipee Group, hydraulic-head measurements indicate downward flow though the Sinnipee (Battenand Bradbury, 1996; Conlon, 1998). This flow may induce vertical leakageof DO from the upper unconfined aquifer through the Sinnipee and into theSt. Peter aquifer (Fig. 9b).
This hypothesis can be qualitatively evaluated by examining patterns ofarsenic contamination. Again, the finding that high arsenic levels correlatewith the intersection of the static water level and the SCH (Fig. 8) negatesthe possibility that vertical leakage is the primary source of DO for thesehigh concentrations, but it may contribute to the low and moderate impacts.Furthermore, most wells in the area where the St. Peter is confined, eventhose open to the SCH, do not appear to have significant arseniccontamination problems (Fig. 2), unless the static water level intersects theSCH (Fig. 8). Thus, although vertical leakage of oxygen-rich water maycontribute to some limited oxidation, it is not a dominant source of DO forregional sulfide oxidation and high arsenic concentrations.
4.4.3 Dewatering
Dewatering of aquifers due to heavy ground water extraction can promoteoxidation of sulfides. (Kinniburgh et al., 1994) report that local oxidation ofsulfides within a confined sand aquifer was caused by aquifer dewateringand associated introduction of air at the well borehole. In some areas nearthe Fox River, municipal well pumping has caused the regionalpotentiometric surface of the St. Peter and deep sandstone aquifer to declinebelow the base of the Sinnipee confining unit (Fig. 9c). Thus, the loweringof heads into the St. Peter aquifer may expose the SCH to oxygen in this partof the study area.
4.4.4 Borehole
In areas where static water levels are at or below the SCH, the boreholeprovides a direct conduit for atmospheric oxygen to interact with water andthe SCH (Fig. 9d). The spatial correlation of high arsenic concentrationswith the intersection of the SCH and the static water level also supports thishypothesis as the cause of the more severe arsenic contamination. In wells

open to both the Sinnipee and the St. Peter, the static water level is generallyat the contact of the two units, because the Sinnipee Group has low hydraulicconductivity and is slowly draining to the more conductive St. Peter aquifer.With the exception of areas affected by significant ground water withdrawal,both the confining unit and the aquifer surrounding the wells are fullysaturated. Thus, the borehole provides the only location where air, water, andsulfides can interact.
In this “borehole model” of SCH oxidation, the source of arsenic is local.Ground water from the aquifer formation that has not been in contact withoxygen at the borehole should not show the chemical signature of sulfideoxidation. Pelczar (1996) collected a ground water sample from a privatewell in Hobart (see Fig. 1a for location) prior to purging. The sample had apH of 3.1 and an arsenic concentration of After several hours ofpumping, the pH increased to 6.3 and the arsenic concentration decreased to
The lower pH and higher arsenic concentrations in the standingwater suggest that much of the sulfide oxidation occurs in close proximity tothe well. As the well is pumped, fresh formation water, which is not ascontaminated, enters the well.
Dissolved oxygen levels measured in well purge water also indicate thatthe borehole is a conduit for oxygen. Pelczar (1996) purged three nestedmonitoring wells installed in the confined portion of the St. Peter aquifer.DO concentrations in standing water in the boreholes rangedfrom 3 mg/l to10 mg/l. During purging, DO concentrations decreased, stabilizing in eachwell at concentrations less than 0.1 mg/l. These results confirm that wherethe St. Peter aquifer is confined, borehole water contains significantly moreDO than formation water.
In several wells, a lag time has occurred between well construction andinitiation of sulfide oxidation, which further supports the hypothesis that theborehole provides an oxidant to the system. For example, a monitoring welllocated within the regional recharge area had an arsenic concentration of 34
and near-neutral pH (7.2) upon installation in 1992 (Batten andBradbury, 1996). The well was sampled again in 2000, at which time arsenicwas measured at with a pH of 4.1 (Rick Stoll, WDNR, writtencommunication, 2000). Although the recent sampling was conductedwithout purging, these results suggest that severe sulfide oxidation occurredsubsequent to the installation of the well. If the source of DO was regionalrecharge or vertical leakage, the degree of oxidation should remain constantover time, independent of well installation and water levels.
Carbonate mineral dissolution may also play a role in the observed lagtime between well installation and the initiation of sulfide oxidation. Sulfideoxidation in carbonate-hosted sulfide deposits may not produce low pH and
9. Mechanisms of Arsenic Release to Ground Water from NaturallyOccurring Sources, Eastern Wisconsin
277

Ground water chemical and sulfur isotope data indicate that oxidation ofsulfides in the SCH is the primary cause of the high arsenic concentrations inthe St. Peter aquifer. These high concentrations are negatively correlatedwith pH and positively correlated with metals contained in the SCH (iron,nickel, cobalt, zinc, and manganese). The molar ratio of sulfate to iron of 2in the high arsenic samples (Table 1) is indicative of sulfide oxidation.Similarity in the sulfur isotope signature of sulfate in groundwater to that ofpyrite in the SCH suggests that the sulfate originated from the sulfide. Inaddition, the presence of iron oxyhydroxides in the SCH provides someevidence of in-situ weathering of sulfides.
The source of the oxidant in the severely impacted wells is most likely theborehole. The strong correlation between high arsenic and the interface ofthe SCH with the static water level in the well, in both confined andunconfined areas if the St. Peter aquifer, indicates that this interaction exertssignificant control on arsenic release. Under confined conditions, the air-water-sulfide interface only occurs within the well. Field data also show thatin the confined portion of the aquifer, the DO concentration in boreholewater is significantly higher than in formation water. The borehole appearsto promote oxidation of sulfides in the SCH in wells where the static waterlevel is approximately coincident with the SCH.
Water chemistry patterns in high arsenic wells are not consistent withother geochemical mechanisms of arsenic release. The positive correlation ofhigh arsenic to sulfate and trace metals, and the negative correlation to pH,are not suggestive of desorption or dissolution of iron hydroxides.
278 Chapter 9
high metals concentrations due to pH buffering from carbonate dissolution(Nicholson et al., 1988; Toran, 1987). In the FRV, the buffering capacity ofbicarbonate in ground water may contribute to the observed lag periodbetween installation of a well open to the SCH and development of low pHand/or high metals concentrations.
4.5 Conclusions: Hydrogeochemical Framework ofArsenic Contamination
Understanding the release of arsenic to ground water requires knowledgeof the source of arsenic and the dominant geochemical processes that affectits fate. The Fox River valley provides a unique example of arsenic releasewithin a confined aquifer system. Here, we use a lines-of-evidence approachto summarize the geologic, mineralogical, hydrogeologic and geochemicaldata used for evaluating mechanisms of arsenic release.
4.5.1 High arsenic concentrations
Moderate and low arsenic concentrations are found in numerous wells inthe FRV, irrespective of the presence of the SCH in the open interval of thewell. These levels of arsenic in ground water do not correlate to theintersection of the SCH with the static water level (Fig. 8), indicating that thesulfide oxidation initiated by oxygen introduced at the borehole does notcause all arsenic occurrences. There is no single stratigraphic unit thatcontrols the low to moderate concentrations; wells with open intervals in theSinnipee Group, the St. Peter Sandstone, the Prairie du Chien Group or theCambrian sandstones are all affected.
Although some data support sulfide oxidation as a cause of some of thelow to moderate arsenic concentrations, the evidence for this is notconclusive. Many wells with these levels of arsenic are located within therecharge area, where DO concentrations of several mg/1 are present inground water. Ground water chemistry data for low and moderate impactsshow slight differences in iron and nickel with respect to background groundwater but do not show elevated sulfate or manganese. Water chemistry datawere examined for evidence of other mechanisms of arsenic release.Reductive dissolution is expected to occur only under reducing conditionsand thus, would not be likely in the recharge area. However, in areas wherethe St. Peter is regionally confined and DO is depleted, reduction of ironhydroxides may release arsenic to groundwater. This process would result inelevated iron and arsenic levels. Low arsenic wells do not show a strongcorrelation between iron and arsenic, but iron is elevated with respect tobackground in wells with moderate arsenic. These higher iron concentrationsare not correlated with elevated sulfate or depressed pH, suggesting thatanother process may be controlling arsenic release for the moderate impacts.
Reductive dissolution of iron hydroxides is expected to be associated withincreases in alkalinity as microorganisms couple the reduction of the solid
9. Mechanisms of Arsenic Release to Ground Water from NaturallyOccurring Sources, Eastern Wisconsin
279
Desorption of arsenic is often initiated by higher pH or the presence ofcompeting anions. Higher pH was not measured in wells with high arsenic(Fig. 6). In addition, the concentrations of competing anions, such asphosphate, are low in the ground water (WDNR, 2001, unpublished).Carbonate leaching of arsenic from sulfides has been proposed to cause higharsenic concentrations in the Marshall Sandstone of Michigan (Kim et al.,2000). The data from the FRV do not show a positive correlation betweenhigh arsenic and alkalinity, indicating that carbonate leaching does not causethe most severe arsenic contamination in the FRV.
4.5.2 Moderate and low arsenicconcentrations

phase iron with the oxidation of organic carbon. As shown in Fig. 6, groundwater with moderate concentrations of arsenic does have higher alkalinitythan the low arsenic or non-detect water. Although these data support thepossibility of reductive dissolution as a mechanism for arsenic release, theevidence is not definitive.
Desorption of arsenic from iron hydroxides is another potential cause ofarsenic release, although the data do not indicate that it plays a significantrole in the region. However, pH is slightly elevated in wells with low andmoderate arsenic as compared with background ground water. Furtherresearch is needed to evaluate desorption as a potential mechanism forarsenic release.
Similarly, more extensive data are needed to fully evaluate carbonateleaching as a potential cause of the low and moderate arsenic concentrations.While alkalinity appears elevated above background in low and moderatearsenic wells, this is not sufficient evidence to suggest carbonate leaching isthe process controlling the release of arsenic. In the FRV, multiple lines ofevidence suggest sulfide oxidation as the cause of high levels of arsenic inwell water, however the available data do not conclusively identify a singleprocess that controls the low to moderate arsenic concentrations foundacross the region.
ACKNOWLEDGMENTS
280 Chapter 9
This research was supported by funding (# A349432) from theUniversity of Wisconsin Water Resources Center and the WisconsinDepartment of Natural Resources (WDNR) through the WisconsinGroundwater Coordinating Council. The authors would like to thank theWDNR Lake Michigan District and Central Offices, including A.Weissbach, J. Pelczar, R. Stoll, M. Hronek, E. Heinen, K. O’Connor, and D.Johnson, for providing information, data, maps, and advice. Also thanked areK. Freiberg for helpful discussions and field assistance, J. Banfield forconducting the TEM analyses, and M. Diman and S. Hunt for help withdrafting of figures. The authors would also like to thank A. Kolker and D.Krabbenhoft for their constructive comments on the manuscript.

Chapter 10
Arsenic levels exceeding are present in hundreds of private supplywells distributed over ten counties in eastern and southeastern Michigan. Mostof these wells are completed in the Mississippian Marshall Sandstone, theprincipal bedrock aquifer in the region, or in Pleistocene glacial orPennsylvanian bedrock aquifers. About 70% of ground water samples takenfrom more than 100 wells, have arsenic contents with a maximumvalue of Water samples and continuous cores were taken from twotest wells. Arsenic content of core samples ranges from <5 to more than 300ppm, with the highest values found for pyritic black shales. Authigeniccements in the Marshall Sandstone include patchy authigenic pyrite thatlocally contains arsenic-rich (up to 8.5 wt. % As) domains. Bulk arseniccontents of pyrite-bearing intervals, sampled in well cuttings, are as high as1020 ppm. Arsenic-rich pyrite is likely the ultimate source of arsenic in easternand southeastern Michigan ground water, but evidence for pyrite oxidation atdepth in bedrock aquifers is generally lacking. Pyrite oxidation may occur orhave occurred in tills derived from the Marshall Sandstone and ColdwaterShale, which were found to contain arsenic-rich (up to at least 0.7 wt. % As)iron oxyhydroxides. Plausible mechanisms for widespread arsenicmobilization in eastern and southeastern Michigan ground water includeweathering of pyrite in tills, reductive dissolution of iron oxyhydroxides intills, and potentially, pyrite oxidation in bedrock aquifers, due to drawdown inwells or lowering of water-table levels in response to Pleistocene glaciation.
Arsenic in southeastern MichiganAllan Kolker1, S. K. Haack2, W. F. Cannon1, D. B. Westjohn2, M.-J. Kim3*,Jerome Nriagu3, and L. G. Woodruff4
1U.S. Geological Survey, Reston, VA2U.S. Geological Survey, Lansing, MI3University of Michigan, School of Public Health, Ann Arbor, MI,4U.S. Geological Survey, Mounds View, MN.*present address: Korea Institute of Science and Technology, Seoul, South Korea

282
1. INTRODUCTION
Chapter 10
Naturally occurring arsenic in water supplies is one of the mostwidespread environmental/public health problems we face as a society. Ineastern and southeastern Michigan, unpublished surveys of supply wellsshow maximum arsenic contents in excess of Arsenic levelsexceeding the proposed U.S. drinking water standard of andapproaching or exceeding the longtime standard of are present innumerous supply wells. To investigate the problem, the U.S. GeologicalSurvey (USGS), in collaboration with the University of Michigan, sampledmore than 100 wells and examined aquifer materials for possible sources ofarsenic. The study area covers 10 counties, having a combined population ofmore 2 million people (Fig. 1).

10. Arsenic in southeastern Michigan 283
Arsenic concentrations in about 70% of the water samples exceed 10including a few public wells. No public wells sampled exceed
(Haack and Rachol, 2000d; Haack and Trecanni, 2000; Kim, 1999). Most ofthe wells exceeding are completed in the Mississippian MarshallSandstone or its upper and lower confining units, the Michigan Formationand the Coldwater Shale, respectively. Some wells in glacial orPennsylvanian bedrock aquifers also have elevated arsenic levels, but noglacial water sampled exceeds The distribution of wells withelevated arsenic contents shows considerable local variation, based on ourresults, and compilation of over 3,000 records by the State of Michigan andCounty health departments. Within the study area, median arsenic contentsrange from in Washtenaw County (77.9% of wells to
in Genesee County (36.2% of wells Aichelle et al.,1999; Haack and Rachol, 2000a; Haack and Rachol, 2000b; Haack andRachol, 2000c, d; Haack and Rachol, 2000e, f; Haack and Rachol, 2000g;Haack and Rachol, 2000h).
1.1 Hydrogeology of the study area
The Michigan Basin is a concentric structural depression containingsedimentary rocks ranging in age from Precambrian to Jurassic. Arcuatesubcrop belts are present within the study area, at the eastern andsoutheastern margins of the basin (Fig. 1). Listed from southeast tonorthwest, these units are the Coldwater Shale, Marshall Sandstone,Michigan Formation (all Missisippian), and the Saginaw Formation(Pennsylvanian). The Marshall Sandstone is a significant bedrock aquifer,whereas the underlying Coldwater Shale and the overlying MichiganFormation are confining units for the Marshall. The Saginaw Formationconsists of a lower confining unit and mid-to-upper units that are aquifersandstones extending primarily over the central part of the Michigan Basin(Westjohn and Weaver, 1998).
Pleistocene glacial deposits in the study area consist primarily of coarse-textured tills, outwash deposits formed at the front of retreating ice lobes,and glacial lacustrine deposits (Westjohn and Weaver, 1998). Glacialdeposits are thinnest or absent in the extreme northeastern and southeasternportions of the study area, and thicken progressively to the northwest. Tillsand lacustrine deposits are generally viewed as confining units forglaciofluvial sands and gravels, but the confining units are highlydiscontinuous. Tills contain large amounts of Mississippian andPennsylvanian rock fragments, in zones that are oxidized or unoxidized.
The distribution of wells having elevated arsenic levels generallycorresponds to the eastern and southeastern parts of the Marshall Sandstone

284 Chapter 10
subcrop belt (Fig. 1). In this area, the Marshall Sandstone is in directhydrologic contact with permeable Pleistocene glacial deposits that overliemuch of the study region. Water quality in the Marshall Sandstonedeteriorates downdip towards the center of the basin, where saline waters,and ultimately, brines are present at depth (Westjohn and Weaver, 1995,1998). The majority of wells sampled in the present study are completed inthe Marshall Sandstone, the Saginaw Formation, and Pleistoceneglaciofluvial deposits. Together, these units constitute the major aquifers inthe region.
1.2 Methods
To investigate the possible relation between the composition of hostrocks and the arsenic content of ground water, well sampling was conductedin conjunction with sampling of aquifer materials in test cores and availablewell cuttings (Haack and Trecanni, 2000). Wells were selected to providesamples from a range of depths, in locations with both near-normal andelevated arsenic contents.
Water sample collection procedures used in this study are outlined byKoterba et al. (1995). Field measurements included temperature, dissolvedoxygen, pH, specific conductance, redox potential, alkalinity, and field testsfor total and ferrous iron, nitrate, ammonia, sulfate, sulfide, turbidity, andphosphate (Haack and Trecanni, 2000). Samples collected for trace-elementanalysis were filtered to pass Samples for arsenic analysis includedsub-samples for total and filtered arsenic, arsenate, and arsenite (Kim, 1999).
Two test wells, H-15D and LP-1, were drilled in areas known to containother wells having high arsenic levels (Fig. 1, 2). To minimize possiblecontamination from drilling mud, city water (H-15D) or ground water from anearby well (LP-1), was used to circulate rock cuttings. Water samples werecollected at 15.7 m intervals using a pump and packer system, with selectedzones of interest sampled in packed 1.37 m or 5.33 m intervals, using asimilar protocol.
Arsenic contents in filtered and whole-water sub-samples weredetermined by atomic absorption hydride generation (AAH), having adetection limit of (Haack and Trecanni, 2000). Concentrations ofmost other metals were determined by ICP-MS, with detection limits,except for iron, having a detection limit of Sulfate concentrationswere determined by ion chromatography, with a detection limit of 0.1 mg/L.Arsenic speciation was determined at the University of Michigan using ionexchange methods modified and adapted by Kim (1999). Arsenicconcentrations of speciated samples were determined by graphite-furnaceatomic absorption spectrophotometry (Kim, 1999).

10. Arsenic in southeastern Michigan 285
For test wells H-15D and LP-1, retrieved core sections were inserted intoplastic bags, flushed with nitrogen gas, and refrigerated until the sampleswere processed. Core samples were split, logged, and prepared for bulkanalysis in intervals of approximately 1.2 m. Cuttings from 3 recently drilledwells penetrating the Marshall Sandstone in northeastern Tuscola County(Fig. 1), were also analyzed. For the H-15D core, arsenic concentrationswere determined by ICP-MS, with detection limit of 4 ppm. For the LP-1core and the Tuscola County well cuttings, multi-element analyses wereobtained by ICP-AES, with a detection limit for arsenic of 10 ppm.Additional results for arsenic were determined for intervals of shale and sandseparated from the LP-1 core at levels below 100.5 m. These results wereobtained from a commercial laboratory, using semi-quantitative atomicabsorption spectrophotometry (detection limit 5 ppm).

286 Chapter 10
A fully-automated, 5 spectrometer electron microprobe (JEOL JXA8900R Superprobe) was used to determine major- and minor-elementconcentrations in pyrite and iron oxyhydroxides, by the wavelength-dispersive method. Instrument conditions include a beam current of
amps, an accelerating voltage of 20 KeV, and a fully focussedbeam, giving an actual working diameter of about 2-3 micrometers. Arsenicconcentrations were determined for arsenic using a TAP analyzingcrystal, and a ZAF correction procedure. A minimum detection limit ofabout 100 ppm was attained using a peak counting time of 60 seconds and30 seconds for upper and lower backgrounds. Wavelength-dispersive arsenic
elemental maps utilize a fully focussed beam, a beam current ofamps, and an accelerating voltage of 20 KeV. Other map
parameters, such as dwell time, pixel size, and number of pixels, werechosen to best accommodate each of the grains studied.
2. RESULTS
2.1 Water Chemistry
A total of 114 private, public, and monitoring wells were sampled,including test wells H-15D and LP-1 (Haack and Trecanni, 2000; Kim,1999). For nearly all of these samples, pH is circum-neutral (7.0 to 7.5) anddissolved oxygen is low (0.0 to 0.5 mg/L). We found several high-arsenic
wells completed in the Marshall Sandstone, but wells withsimilarly high levels of arsenic were identified in each of the major bedrockaquifers in the region. The highest arsenic concentration we determined is
for a private well in Huron County (Haack and Trecanni, 2000).Two test wells intersecting the Marshall Sandstone show a gradual
decrease in arsenic contents with depth (Fig. 3). Arsenite (As III) is thedominant species, ranging from 70 to 95 % of total arsenic in wellsthroughout the study area having at least arsenic. In the H-15D well,arsenite makes up 88–100% of total arsenic, and there are no distinctchanges in oxidation state with depth. Redox conditions measured for H-15Dwaters are essentially uniform with depth. On an Eh-pH diagram, watersfrom H-15D and 12 other wells sampled plot slightly above the stability fieldfor pyrite, but much below the Eh conditions at which sulfide oxidation hasbeen found to occur in natural samples (Fig. 4; Sato, 1960). Sampling foraqueous arsenic at 15.7 m intervals agrees well with results taken at smallerintervals, with the exception of three samples near the bottom of H-15D,

showing higher arsenic contents in the 1.37 m sample intervals than in the15.7 m intervals (Fig. 3B).
In the test wells and throughout the study area, aqueous arsenic shows nocorrelation with iron or sulfate (see Haack and Trecanni, 2000). This lack ofcorrelation is unlike the case of the Fox River Valley in east centralWisconsin, where oxidation of a sulfide cement horizon is demonstratedlocally by extreme arsenic contents and correlation of arsenic with iron,sulfate, and pH (Schreiber et al., this volume; Schreiber et al., 2000). Morecommonly, where the sulfide cement horizon does not intersect static wellwater levels, or is less prominent or less arsenic-rich, wells in the Fox RiverValley show a scattered distribution of more moderate arsenic levels andevidence for pyrite oxidation is lacking (Gotkowitz et al., 2001). Theseresults are similar to our findings in eastern and southeastern Michigan.
10. Arsenic in southeastern Michigan 287

288 Chapter 10
2.2 Aquifer Materials
2.2.1 Bedrock Well Cuttings
Initial characterization of aquifer materials from the study area consistedof a suite of cuttings from 3 recently drilled wells in northeastern TuscolaCounty, in an area with high levels of arsenic in ground water (Fig. 1).Petrography of this material shows that pyrite is present locally as a cementfor framework sand grains in the Marshall Sandstone (Fig. 5). Electronmicroprobe analyses and wavelength-dispersive elemental mapping showhighly arsenic-enriched domains in this pyrite (Kolker et al., 1998). Thesedomains occur as overgrowths on framboids having much lower arsenic

10. Arsenic in southeastern Michigan 289
contents. The framboids and their arsenic-rich overgrowths are incorporatedinto pyrite having low arsenic contents (Fig. 5). The overall compositionalrange for pyrite in electron microprobe spot analyses of well cuttings is<0.01 to 7.8 weight percent arsenic, more than enough to account for highlevels of arsenic in that area, should this pyrite undergo decomposition(Table 1).
Bulk analyses of the Tuscola County well cuttings also show high arseniccontents (up to 1020 ppm) and good correlations between iron contents andconcentrations of other chalcophile elements (Co, Ni, Cu, Zn, Cd, and Pb;Table 2). The high contents of these elements are clearly attributable topyrite. For arsenic, the maximum value in the cuttings is roughly 3 times thatof the most arsenic-enriched black (pyritic) shale determined in the test cores(see following section).
2.2.2 Bedrock Core Samples
The H-15D core penetrates the Michigan Formation, Marshall Sandstone,and Coldwater Shale (Fig. 2). The Marshall portion of the core includes asection of medium-coarse sand near its top (23.8 to 35.7 m depth), and alarger section below of interbedded sandstone, siltstone, and shale, includingminor sections of black shale. The LP-1 core contains a thicker sand-dominated sequence of Marshall Sandstone (43.3 to 103.6 m depth), andbelow that, in the lower portion of the core, consists of interbedded sand, siltand clays, that includes the contact with Coldwater Shale (Fig. 2). The cores

290 Chapter 10
are largely unoxidized and contain fresh pyrite. A few oxidized (reddish)horizons are present locally in each core.
Arsenic-rich pyrite was found in each of the two test cores. Together withwell cuttings from northeastern Tuscola County, arsenic-rich pyrite ispresent in at least 3 adjoining counties that make up a large portion of thestudy area (Fig. 1). In the H-15D core, arsenic-rich pyrite is present in boththe Marshall Sandstone and in the Michigan Formation, where arseniccontents in pyrite up to about 2 weight percent were determined (Table 1).As in the well cuttings, the most arsenic-rich pyrite occurs as framboidovergrowths. In the LP-1 core, framboid overgrowths with spot arsenicconcentrations as high as 8.5 weight percent were found to replace fossilfragments (Fig. 6; Kolker et al., 1999). For comparison, reconnaissancestudy of Marshall Sandstone in cores from Calhoun County, a control area insouth-central Michigan where arsenic in wells is not widely problematic,shows that pyrite there is less abundant, and has lower arsenic contents1.2 weight percent) (Kolker et al., 1998).

10. Arsenic in southeastern Michigan 291

292 Chapter 10
Bulk rock arsenic contents of the cores are plotted in Figure 3, based onsampling at intervals of approximately 1.2 m. For the H-15D core, arsenicranges from <4 to 310 ppm, with the highest arsenic contents in black shalesthat constitute a small portion of the section. A similar range in arseniccontents was obtained for the LP-1 core (<10 to 283 ppm). The arseniccontent of aquifer sands is generally less than 10 ppm, but pyrite-bearingintervals have arsenic contents in the 20-50 ppm range. There is no apparentcorrelation between levels of arsenic in the cores and aqueous arsenic (Fig.3).
Analysis of sand and shale separates from the lower part of the LP-1 core(Fig. 3C) shows that shale intervals have consistently higher As contentsthan interbedded sandstones, but aqueous arsenic contents are no different inshale-hosted intervals than in aquifer sands. The lack of correlation betweenarsenic contents in water and cores, the unaltered character of pyrite withinthe cores, and the suboxic nature of the water, all suggest that pyriteoxidation is not occurring at depth in the test wells.
2.2.3 Till Samples
In order to determine the role of pyrite oxidation in glacial aquifers, weinvestigated several samples of till containing fragments of oxidizedMarshall Sandstone. Electron microprobe analysis of iron oxyhydroxides intill samples shows arsenic contents up to about 0.7 weight percent (Fig. 7). Ifarsenic-rich iron oxyhydroxides are derived from weathering of arsenic-richpyrite, the analysis indicates that a portion of the arsenic is retained duringthe weathering/oxidation process. Alternatively, arsenic may be concentratedon oxide surfaces by adsorption of aqueous arsenic. Therefore, depending onredox conditions, iron oxyhydroxides provide a potential source of arsenic inground water, or a sink for aqueous arsenic.
3. DISCUSSION
If pyrite is the source of arsenic in the Marshall Sandstone aquifer, itsoxidation must have occurred at surface or near-surface conditions.Weathering of detrital Marshall Sandstone and Michigan Formation shale intills could explain the presence of arsenic-rich wells in glacial aquifers.However, high levels of arsenic are more common in the bedrock aquiferthan in glacial aquifers, and in both aquifers, the distribution of such wells isscattered. Bedrock samples show the distribution of authigenic pyrite to bevery patchy, and not all of the pyrite is arsenic-rich. Therefore, even in thecase of pyrite oxidation at depth in a bedrock aquifer, we would expect local

10. Arsenic in southeastern Michigan 293
variations in aqueous arsenic contents. In the absence of pyrite oxidation atdepth, arsenic mobility could be the result of oxidation of MarshallSandstone in tills, and/or reduction of arsenic-bearing iron oxyhydroxides intills or weathered bedrock, by anoxic or suboxic ground water.
Although evidence for present-day pyrite oxidation is lacking, groundwater levels following the last glaciation are inferred to be tens of meterslower than today, perhaps allowing paleo-oxidation of pyrite to haveoccurred in the Marshall Sandstone aquifer. This scenario is based primarilyon the large difference in the levels of modern lakes such as Lake Huron, vs.their glacial precursors, which were as much as 120 meters lower (Flint,1957).
Present-day drawdown in the vicinity of heavily used wells could alsoresult in pyrite oxidation, on a scale corresponding to the extent of thedrawdown. Because of the extreme arsenic contents of some MarshallSandstone pyrite, even small amounts of oxidation could contribute arsenicto bedrock aquifers.
Insight into the oxidation process is given by Kim (1999) and Kim et al.(2000), who conducted leaching studies of H-15D core samples and foundthe amount of arsenic leached increases with the molar

294 Chapter 10
concentration of aqueous solutions. Kim et al. (2000) suggest that oxidationof arsenic-rich pyrite at shallow levels of the bedrock aquifer is enhanced byproduction of an arsenic-carbonate complex, or an iron bicarbonate complexas an intermediate. The concentrations used in these experimentsrange from about 7 to 120 times the average molar bicarbonate concentrationin the Michigan ground water sampled. Arsenic dissolution by bicarbonatetherefore seems possible in some natural water, but the extent to which thisprocess might occur in the study area is unclear. There is not an apparentcorrelation between bicarbonate and arsenic contents in the wells sampled.
4. CONCLUSIONS
Two widespread natural sources of arsenic, arsenic-rich pyrite andarsenic-rich iron oxyhydroxides, have been identified in the study area,based on examination of bedrock samples and till derived from bedrock inthe region. The irregular distribution of high arsenic values may beexplained by the uneven distribution of these natural sources. Redoxconditions of water in test wells, and comparison of arsenic contents in waterand aquifer materials at the same depths in these wells, suggest that pyriteoxidation is very limited in the bedrock. However, we cannot rule out paleo-oxidation of pyrite in the bedrock aquifer, resulting from lower water tablelevels that existed following the last glaciation. Likewise, present-dayoxidation may occur in some wells as a result of drawdown. Because thereare multiple sources of arsenic, in glacial and bedrock aquifers that are inhydrologic continuity, no single process may explain the overall distributionof arsenic in eastern and southeastern Michigan wells.
ACKNOWLEDGEMENTS
The authors benefited from discussions with Alan Welch, KirkNordstom, Madeline Schreiber, Madeline Gotkowitz, Dave Johnson, HarveyBelkin, and Robert Finkelman. Reviews by Alan Welch, Robert Finkelmanand Daniel Hayba helped improve the manuscript. We also acknowledge therespective contributions of Sandra Trecanni, Michael Sweat, Steve Aichelle,and Jason C. Willett to portions of this study. This study was conducted aspart of the USGS Drinking Water Initiative, in cooperation with theMichigan Department of Environmental Quality, the Michigan Departmentof Community Health, and the Michigan counties in the study area.

Chapter 11
Occurrence of arsenic in ground water of the MiddleRio Grande Basin, central New Mexico
Laura M. Bexfield and L. Niel PlummerU.S. Geological Survey
Chemical data from more than 400 ground-water sites in the Middle RioGrande Basin of central New Mexico indicate that arsenic concentrationsexceed the U.S. Environmental Protection Agency drinking-water standard of10 micrograms per liter across broad areas of the Santa Fe Group aquifersystem, which is currently the almost exclusive source of drinking-watersupply for residents of the basin. Identification of sources of arsenic to groundwater of the basin is complicated by multiple sources of ground-water rechargethat differ substantially in chemical composition. Establishment of a clearhydrologic framework for the basin was useful in interpreting the significanceof patterns in arsenic concentration. This investigation indicates that there aretwo main sources of high-arsenic water to the Middle Rio Grande Basin. Oneprimary source is related to silicic volcanism in the Jemez Mountains to thenorth, where dilute recharge water likely flows through rocks that have beenaltered by contact with geothermal fluids. The other primary source ismineralized water of deep origin that mixes with shallower ground water inseveral locations around the basin, particularly along major structural features.Ground water that has not been affected by either of these two high-arsenicsources generally has low arsenic concentrations. In some areas of the basin,values of pH exceeding about 8.5 appear to contribute to elevated arsenicconcentrations through desorption of arsenic from metal oxides.
1. INTRODUCTION
The more than 700,000 residents of the Middle Rio Grande Basin(MRGB), otherwise known as the Albuquerque Basin, of central NewMexico rely almost exclusively on ground water from the Santa Fe Groupaquifer system for drinking-water supplies. Arsenic concentrations in ground

296 Chapter 11
water underlying the basin have been detected in excess of andconcentrations exceeding are present across large areas. The City ofAlbuquerque, which served more than 450,000 basin residents with itsdrinking-water supply wells in 1999 (City of Albuquerque, 2000), will beaffected severely by the U.S. Environmental Protection Agency (USEPA)standard of for As in drinking water (Federal Register, 2001). Justover half of the 92 City of Albuquerque wells currently in service meet thatstandard (City of Albuquerque, 2000); capital expenses for compliance withthe new standard for the City of Albuquerque alone have been estimated at150 million dollars (Soussan, 2001).
This investigation of the occurrence and behavior of As dissolved inground water of the MRGB is based largely on ground-water sampling of288 wells and springs between 1996 and 1998 as a part of the U.S.Geological Survey (USGS) MRGB study, the boundaries of whichcorrespond to the boundaries of the basin (Fig. 1). The chemical and isotopicdata collected as a part of the MRGB study are being used to bettercharacterize the ground-water flow system of the basin (Plummer et al.,2001; Plummer et al., in press; Plummer et al., 1997). Samples werecollected for analysis of a wide variety of constituents, including major- andminor-element chemistry, isotopic composition, and dissolved-gas content.Supplementary chemical data were obtained for the same study frommonthly sampling at 14 surface-water sites. In order to fully characterize Asdistribution and possible factors affecting its occurrence in the basin,supplemental historical data for As and selected other constituents in groundand surface water were obtained from the USGS National Water InformationSystem (NWIS) data base, and from a data base maintained by the City ofAlbuquerque on ground-water quality from its water-supply wells.
1.1 Previous Investigations
The presence of As in water and sediments of the MRGB has been longrecognized as a problem relative to drinking-water standards (CH2M Hill,1990, 1991; Chapin and Dunbar,1994; Stanton et al., 2001a). Based on thespatial distribution of As and correlations between As and other water-quality parameters, As appears to originate from deep sources in most of thebasin, and the volcanic center in the Jemez Mountains north of the basin alsois a source of As-rich water (CH2M Hill, 1990, 1991). Proposed sources ofAs to ground water and surface water also include volcanic and potassiummetasomatised rocks, and regional ground-water inflow to surface water(Chapin and Dunbar, 1994). Sorption of As onto sediments (particularly Fe,Mn, and Al oxides) is a likely method of removal of As from surface water(Chapin and Dunbar, 1994; Stanton et al., 2001a; Stanton et al., 2001b)

11. Occurrence of arsenic in ground water of the Middle Rio GrandeBasin, central New Mexico
297
examined sediment and rock samples from drill cores at three differentlocations in the MRGB for content and potential mobility of As. Theyconcluded that most As was associated with acid-extractable amorphous andcrystalline Fe oxides. For a study through the University of Houston, Asspeciation was performed on ground water from 87 City of Albuquerque

298 Chapter 11
wells; the study showed that samples from most wells contained only As(V), although some wells contained appreciable As (III) (Bill Lindberg, Cityof Albuquerque, written commun., 2000).
2.
2.1
METHODS
MRGB Study of Ground-Water Chemistry
At wells sampled for this study, field parameters (pH, specificconductance, temperature, and dissolved-oxygen concentration) weredetermined and samples were passed through a 0.45-micron capsule filter forlaboratory analysis of selected major and minor elements. At least threecasing volumes of water were purged and field parameters were allowed tostabilize before sample collection. Minor-element samples were preservedwith Ultrex nitric acid in the field. At nine ground-water sites, samples forminor elements were collected using a range of filter sizes. Differencesamong analytical results for samples filtered using 0.45-micron capsulefilters, tangential filtration at 0.1 microns, and tangential filtration at 30,000Daltons were negligible; As concentrations using the three methods differedby no more than and typically were identical within the analyticalprecision of +/- 5 percent.
In addition to ground-water samples, multiple surface-water samples alsowere collected for the study. Samples were collected as frequently asmonthly at up to 14 surface-water sites, including sites on the Rio Grandeand associated drains and irrigation canals, the Jemez River, the Rio Puerco,and Tijeras Arroyo (Fig. 1), between January 1997 and April 1999. Sampleswere dipped from streams rather than integrated across their widths anddepths. Surface-water samples were filtered and preserved in the samemanner as ground-water samples.
Analysis of major and minor elements for the MRGB study of ground-water chemistry was performed in the USGS Water Chemistry Laboratory inReston, Virginia. Analysis of major cations and silica was performed using amulti-element direct-current plasma spectrometer; analysis of major anionswas performed using ion chromatography. The analysis of minor elementswas performed according to USEPA Method 200.8 (USEPA, 1994) using aninductively coupled plasma-mass spectrometer. The As detection limit was
Further details of the analytical methods are given in Busenberg etal. (2000) and (Plummer et al., in press).

11. Occurrence of arsenic in ground water of the Middle Rio GrandeBasin, central New Mexico
299
2.2 Additional Data Sources
Data available for ground-water samples in the NWIS and City ofAlbuquerque data bases were used for sites that had not been sampled as partof the MRGB study (Fig. 1). Surface-water samples having dissolved Asdata also were retrieved from the NWIS data base for selected sites toevaluate the presence of As in potential sources of recharge to the ground-water system. Chemical analysis of most samples from NWIS wasperformed at a USGS laboratory; methods of analysis vary because the datesof sample collection encompass the years 1972-97. All minor-elementsamples are believed to have been passed through 0.45-micron filters andacidified in the field. Bexfield et al. (1999) describe the data base compiledby the City of Albuquerque for its drinking-water supply wells (generallydeep wells with long screened intervals) since 1988, including methods ofsampling and analysis. Specifically, minor-element samples were unfilteredand were acidified on the day of collection. The median constituentconcentrations presented by Bexfield et al. (1999) for each of 93 drinking-water supply wells were included in the data set used for this investigation,along with data for one additional well. City of Albuquerque data wereretained instead of historical NWIS data, when present for the same site,because they were believed to better represent “typical” chemicalcompositions.
2.3 Acknowledgments
The successful completion of this study required the contributions ofmany people. The authors thank the numerous landowners, governmentagencies, and companies who provided access to their wells, in addition tothose people who helped obtain sampling permission from wellowners/operators. The authors also thank Bill Lindberg with the City ofAlbuquerque Water Utility Division, who provided access to chemical datafor City of Albuquerque water-supply wells. Particular thanks go to themany individuals in the Reston, Virginia office of the USGS who performedmost of the sampling and analysis that made this study possible. Thesepeople include Eurybiades Busenberg, Jerry Casile, Mike Doughten, WardSanford, Andrew Stack, Julian Wayland, and Peggy Widman. Finally, thestudy benefited greatly from the advice of Scott Anderholm and Blair Jonesof the USGS, Fred Phillips and Rob Bowman of New Mexico Tech, andNelia Dunbar of the New Mexico Bureau of Mines and Mineral Resources.The manuscript was improved by technical reviews from Scott Anderholmand Alan Welch of the USGS.

300 Chapter 11
3. HYDROGEOLOGY OF THE MRGB
The MRGB extends between Cochiti Lake and San Acacia in the Basinand Range physiographic province of central New Mexico (Fig. 1). Thebasin, which contains basin-fill deposits up to about 14,000 feet thick (Thornet al., 1993), is among a series of several alluvial basins located in the RioGrande rift typified by high heat flow, young faulting, and recent volcanism(Lozinsky, 1988). The boundaries of the basin have been defined by theextent of Cenozoic deposits. The basin is surrounded partly by mountainranges (Fig. 1); lower topographic relief occurs along the west side of thebasin, which is bounded by the Lucero and Nacimiento uplifts and the RioPuerco fault zone. Within the basin, the piedmont slopes from the easternmountain fronts toward the main drainage, the Rio Grande, which is inset ina terraced valley with a flood plain up to about 4.5 miles wide. Most land inthe MRGB is rangeland (Thorn et al., 1993), although agriculture ispracticed in the Rio Grande flood plain, where depth to water generally isless than about 25 feet (Bexfield and Anderholm, 1997). Urban areas includethe City of Albuquerque, which is the most populous city in New Mexico.The climate of the MRGB generally is categorized as semiarid, although theclimate in surrounding mountainous areas ranges to humid continental(Thorn et al., 1993).
3.1 Geology
The primary aquifer underlying the MRGB consists of the generallyunconsolidated to moderately consolidated basin-fill sediments of the SantaFe Group. The overall aquifer system includes both the Santa Fe Groupdeposits, which are of Oligocene to middle Pleistocene age, and the morerecent (post-Santa Fe Group) flood-plain, channel, and basin-fill deposits ofPleistocene to Holocene age that are up to about 130 feet thick and are inhydraulic connection with the Santa Fe Group deposits (Thorn et al., 1993).Hawley and Haase (1992) divided the deposits of the Santa Fe Group intothree main hydrostratigraphic units representing various depositionalenvironments, lithologic characteristics, and periods of deposition. Mostground-water samples for this study were collected from wells completed inthe relatively permeable sediments of the upper Santa Fe Group (up to 1,500feet thick), which consists primarily of piedmont-slope and fluvial basin-floor deposits, or in post-Santa Fe Group sediments. Several of the sampledwells were completed in the less permeable Middle Santa Fe Group.
Hawley and Haase (1992) found that the bulk composition of basin fill inthe Albuquerque area was approximately 60 percent granitic-metamorphic

11. Occurrence of arsenic in ground water of the Middle Rio GrandeBasin, central New Mexico
301
detritus of Precambrian derivation, 30 percent volcanic detritus of middleTertiary derivation, and less than 10 percent sedimentary detritus ofPaleozoic or Mesozoic derivation. Below the northeast part of Albuquerque,sediments at depths from about 200 to 3,200 feet were described as volcanic-rich; the volcanic material was thought to be derived from the JemezMountains (a major center of young, silicic volcanism) and other sourcesfarther to the north. Clay minerals present in fine-grained deposits of thebasin were smectite, illite, kaolinite, and interlayered illite/smectite.
As defined, the MRGB consists of the Santo Domingo, Calabacillas, andBelen Subbasins (Grauch et al., 1999). Recent studies indicate the presenceof structural highs between these subbasins, where the thickness of Santa FeGroup basin fill is small (less than 3,000 feet) compared to the thicknesswithin the subbasins (up to 12,000 feet) (Grauch et al., 1999; Grauch et al.,2001). Numerous faults of widely varying offset bound and extend throughparts of the MRGB with a general north-south strike. The potential of someof these faults to facilitate upward flow of deep water into relatively shallowparts of the aquifer has not been well characterized.
3.2 Hydrology
The Rio Grande extends the entire length of the MRGB (Fig. 1). Asystem of canals and drains in the flood plain carry irrigation water from theriver to agricultural fields and intercept seepage from the river and irrigatedfields. The mean annual discharge of the Rio Grande at Albuquerque wasabout 1,450 cubic feet per second for water years1 1974-98 (Ortiz et al.,1999). Although the Rio Grande is the only perennial stream in the MRGB,at least ten ephemeral streams can contribute substantial flow to the RioGrande, and possibly contribute substantial quantities of recharge to theunderlying aquifer.
The ground-water-flow system of the MRGB is quite complex, largelybecause of multiple sources of recharge to the basin, which manyinvestigators have attempted to identify and quantify (Kernodle et al., 1995).These sources include mountain-front recharge, subsurface ground-waterinflow from adjacent basins, and seepage from the Rio Grande andephemeral streams. Ground water discharges from the MRGB to the SocorroBasin near San Acacia (Fig. 1). Ground-water discharge also occurs withinthe MRGB through evapotranspiration (particularly in the Rio Grande flood
1 The water year is the 12-month period from October 1 through September 30. The wateryear is designated by the calendar year in which it ends and which includes 9 of the 12months.

302 Chapter 11
plain), ground-water pumpage, and discharge of ground water into drainsand some reaches of the Rio Grande.
Predevelopment water-level maps (Bexfield and Anderholm, 2000; Titus,1961) show that ground-water flow through the central part of the basinhistorically has been oriented primarily north to south, whereas flow near thebasin margins historically has been oriented toward the central part of thebasin (Fig. 1). In the vicinity of Albuquerque, a steady increase in ground-water pumping since about the mid-1940’s has resulted in substantialdeclines in water levels and alterations in patterns of ground-water flow.
4. HYDROCHEMICAL FRAMEWORK OF THEMRGB
Chemical and isotopic characterization of ground water in the MRGBpermits delineation of 13 separate water-quality zones (Fig. 2) (Plummer etal., in press). Generally, each zone has uniform characteristics of major-element chemistry that change little as water moves through the basin. Thesezones, which have been grouped by general location in the basin in Table 1,represent 12 source areas of ground-water recharge to the basin and one areaof ground-water discharge. Two water-quality zones receive recharge fromthe northwest (Fig. 2 and Table 1). The compositions of most ground-watersamples from the Northwestern zone indicate that the primary source ofwater is recharge from relatively low elevations along the western base ofthe Jemez Mountains (which consist largely of Tertiary volcanic rocks),although a few samples indicate small, localized areas of mixing withinfiltration from the Jemez River. Ground water of the West-Central zoneappears to extend most of the length of the MRGB and is present at depthunder the Northwestern zone and probably parts of adjacent zones to theeast. The compositions of most ground-water samples from the West-Centralzone indicate that the water probably recharged in the Jemez Mountains. Thelight stable isotopes and old ages of ground water from the West-Centralzone indicate that recharge to the zone occurs farther north (at higherelevations that likely exceed 8,000 feet) than recharge to the overlyingNorthwestern zone.
Three distinct water-quality zones are present along the western marginof the MRGB (Fig. 2 and Table 1). Ground water of the Western Boundaryzone probably is a mixture of Na-Cl brine leaking into the basin fromPaleozoic rocks (typically limestone, sandstone, and shale) along the westernmargin and infiltrating precipitation/arroyo flow within the basin. Groundwater of the Rio Puerco zone likely is a mixture of water from the WesternBoundary zone with surface water that infiltrates through the Rio Puerco

30311. Occurrence of arsenic in ground water of the Middle Rio GrandeBasin, central New Mexico

304 Chapter 11

11. Occurrence of arsenic in ground water of the Middle Rio GrandeBasin, central New Mexico
305

306 Chapter 11

11. Occurrence of arsenic in ground water of the Middle Rio GrandeBasin, central New Mexico
307
308 Chapter 11
and/or ground water that seeps into the basin from Mesozoic rocks (typicallyCretaceous sandstone and shale with local Jurassic gypsum and clastic units)along the northwestern boundary. Ground water of the SouthwesternMountain Front zone, delineated on the basis of only two samples, has muchlower constituent concentrations than water from the Western Boundary andRio Puerco zones and probably represents mountain-front recharge along theLadron Mountains, which consist mainly of Precambrian granitic andmetamorphic rocks.
Of the water-quality zones in the east and central areas of the basin, fiveare relatively large and receive recharge from either basin margins or surfacewater (Fig. 2 and Table 1). The major-element compositions of most samplesfrom the Northern Mountain Front zone indicate that the primary source ofrecharge is mountain-front recharge along the eastern part of the JemezMountains. The major-constituent compositions of most ground-watersamples from the Eastern Mountain Front zone are consistent with amountain-front recharge source along the Sandia, Manzanita, and ManzanoMountains, which consist primarily of Precambrian metamorphic andigneous rocks that are overlain by Paleozoic limestone and sandstone(Anderholm, 1988; Hawley and Haase, 1992). Water compositions frommuch of the Abo Arroyo zone appear to be consistent with a primaryrecharge source being infiltration along the arroyo, which drains mostlyPaleozoic sedimentary rocks and some crystalline Precambrian rocks(Anderholm, 2001). Ground water of the Northeastern zone appears to bederived from more than one primary source, including mountain-frontrecharge water, arroyo infiltration, and/or ground-water inflow fromgypsum-containing rocks outside the basin. Finally, ground water of theCentral zone, which extends parallel to the Rio Grande along much of thelength of the basin, has a composition (including isotopic composition)generally consistent with a primary source from the Rio Grande.
Two additional water-quality zones (Tijeras Fault Zone and TijerasArroyo) that receive ground-water recharge along the eastern boundary ofthe basin are limited in areal extent (Fig. 2 and Table 1). Both the TijerasFault Zone and Tijeras Arroyo zones receive dilute, mountain-front recharge.However, ground water of the Tijeras Fault Zone zone appears also tocontain a fraction of high-Cl water, such as from deep fracture systems in thePrecambrian granitic rocks and Pennsylvanian limestone of the area,whereas ground water of the Tijeras Arroyo zone appears to contain afraction of infiltration through Tijeras Arroyo, which drains primarilyPaleozoic and Precambrian rocks.
The Discharge zone (Fig. 2 and Table 1) is located at the southern end ofthe MRGB. Ground water in this zone typically is relatively old andprobably contains fractions of both ground water observed in adjacent water-

30911. Occurrence of arsenic in ground water of the Middle Rio GrandeBasin, central New Mexico
quality zones and deep, high-Cl ground water that is moving upward as aresult of the decrease in thickness and width of basin-fill deposits at thesouthern end of the basin.
5.
The Rio Grande and several ephemeral streams contribute recharge to theSanta Fe Group aquifer system. Therefore, data on the As concentrations inthese streams (Table 2) can be used to characterize their potential tocontribute As to the aquifer system. Although recharge from the Jemez River(Fig. 1) is very localized, this river is of particular interest with respect to Asconcentrations because it is fed partially by ground-water discharge in itsupper reaches, including discharge from geothermal springs known to haveAs concentrations exceeding 1 mg/L (Shevenell et al., 1987; Trainer, 1974)and it flows into the Rio Grande. For the Jemez River below Jemez CanyonDam (Fig. 1, at the downstream end of the Jemez Canyon Reservoir), thedischarge-weighted average As concentration determined from NWIS data is
the median As concentration for 12 samples collected as part of theMRGB study is (Plummer et al., in press). Arsenic concentrations inthe Rio Grande, which is believed to be the primary source of recharge to theCentral zone, typically are lower at sites located above the inflow of theJemez River than at sites located south of the inflow from the river. For theRio Grande at San Felipe (above the Jemez River inflow) (Fig. 1), thedischarge-weighted average As concentration from NWIS is forthe Rio Grande at Albuquerque, the discharge-weighted average Asconcentration is Samples collected for the MRGB study at a site onthe Rio Grande at the north end of Albuquerque have a median Asconcentration of
Some As data are available for other streams in the MRGB, although thedata sets are relatively small (Table 2). NWIS and MRGB samples for siteson the Rio Puerco, Abo Arroyo, and Tijeras Arroyo indicate that Asconcentrations typically are about or less. However, samplescollected for the MRGB study show that As concentrations in the Rio Puercocan range up to under certain conditions.
ARSENIC IN SURFACE WATER
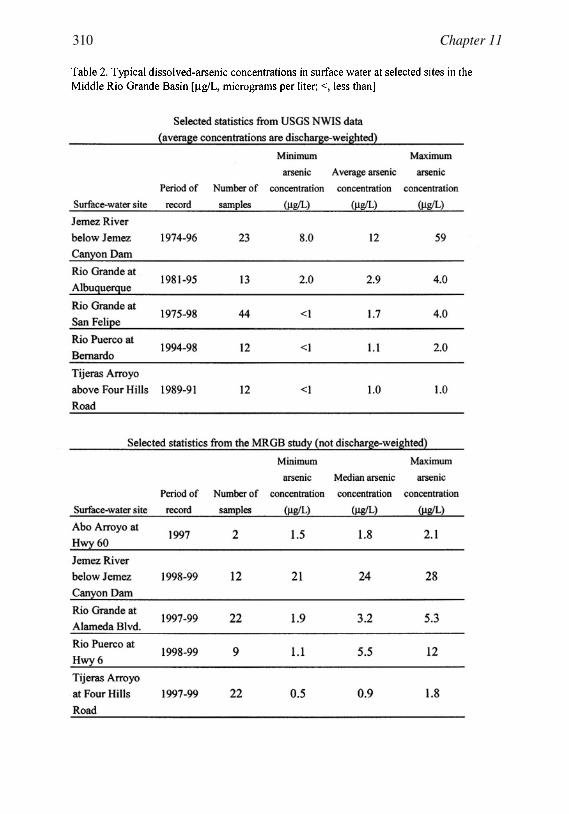
310 Chapter 11

11. Occurrence of arsenic in ground water of the Middle Rio GrandeBasin, central New Mexico
311
6. ARSENIC CONCENTRATIONS IN GROUNDWATER
6.1 Areal variations
Concentrations of As in ground water sampled in the MRGB range fromless than to more than The median As concentration for allground-water samples compiled for this investigation within the MRGB is
This median value probably is not representative of ground waterthroughout all locations and depths of the entire MRGB because the densityof sample sites was larger in the Albuquerque area than across the rest of thebasin, and most samples were obtained from wells completed in about theupper 600 feet of the aquifer. However, because most of the wells sampledwere completed in parts of the aquifer used for drinking-water supplies, themedian value of probably is representative of the median Asconcentration in that part of the ground-water resource that is currently used.
Arsenic concentrations tend to be higher in the northwestern and centralparts of the MRGB than along most basin margins (Fig. 3). Arsenicconcentrations are consistently low percentile of less than inzones grouped into the west and Tijeras areas of Table 1, which all havemedian As concentrations of or less. Zones of the east and centralareas include both high and low As concentrations; As concentrationstypically range from about near basin margins to more thanArsenic concentrations consistently are high percentile of greater than 3
in the northwest-area zones and the Discharge zone. These three zonesall have median As concentrations greater than the West-Centralzone has the highest median As concentration of any zone. Noobvious or consistent trends in the areal patterns in As concentration (eitherincreasing or decreasing) are seen with ground-water flow direction in thebasin.
6.2 Variations with depth
For illustrative purposes, graphs of variability in As concentrations withdepth (Fig. 4) were divided into two groups based on piezometer location.The amount of variability observed in As concentrations with depth rangeswidely, from about across 1,200 feet of aquifer to aboutacross 550 feet of aquifer (Fig. 4). Arsenic concentrations consistentlyincrease by at least 5 micrograms per liter with depth in 11 piezometer nests(numbers 2, 4, 5, 7, 13, and 15-20). Arsenic concentrations show little

312 Chapter 11

11. Occurrence of arsenic in ground water of the Middle Rio GrandeBasin, central New Mexico
313

314 Chapter 11
change with depth in six piezometer nests (numbers 1, 9, 10, 11, 12, and 14),which produce mostly water of the Central or Eastern Mountain Front zone.In piezometer nests numbered 3, 6, and 8, completed entirely in water of theWest-Central zone, the As concentration of the deepest piezometer issubstantially smaller than the As concentration in at least one shallowerpiezometer. Only six piezometer nests produced ground water with an Asconcentration of or less from all completions.
7. POSSIBLE FACTORS AFFECTING ARSENICCONCENTRATIONS IN GROUND WATER
Because As concentrations greater than are present across broadareas of the MRGB, which consists primarily of rangeland, natural processesrather than anthropogenic activities are most likely to affect As occurrence.Large-scale processes that can affect As concentrations in ground waterinclude mineral dissolution and precipitation, adsorption and desorptionprocesses, and the presence of water associated with thermal sources.Characteristics that are useful in determining the most important processes inselected water-quality zones of the MRGB are summarized in Tables 1 and3.
7.1 Mineral dissolution
Various previous studies have suggested that the dissolution of As-bearing sulfide minerals or Fe oxides can be the primary source of As inground water. For example, sulfide minerals have been proposed as thelikely source of As to ground water in parts of the northeastern United States(Welch et al., 2000). Oxidation of As-containing pyrite as a result ofincreasingly oxidizing conditions over time has been proposed as a source ofAs to ground water in Wisconsin (Burkel and Stoll, 1999). Reductivedissolution of Fe oxides has been proposed as an important source of As toground water in Bangladesh and West Bengal (Chowdhury et al., 1999;Nickson et al., 2000), and has been shown to release As from metalcontaminated soils (Masscheleyn et al., 1991).
In the MRGB, the dissolution of As-bearing iron oxides appears unlikelyto be a major source of dissolved As to ground water. The presence ofdissolved oxygen and nitrate indicates oxidizing conditions throughout theaquifer at the depths sampled, except at relatively shallow depths in the RioGrande inner valley (Fig. 1). The predominance of oxidizing conditionsacross large areas of the aquifer is supported by data for City of Albuquerquedrinking-water supply wells (Bill Lindberg, City of Albuquerque, written

31511. Occurrence of arsenic in ground water of the Middle Rio GrandeBasin, central New Mexico
commun., 2000), which show that more than 90 percent of the As present inground water from 76 of 87 wells was in the form of As (V). Therefore,although Fe oxides are known to be present in sediments of the Santa FeGroup aquifer system (Stanton et al., 2001a; Stanton et al., 2001b), thereducing conditions that would favor Fe (III) reduction and dissolution of

316 Chapter 11
ferric oxide minerals generally are not present. Dissolution of sulfideminerals also is not a likely source of As because sulfide minerals are notcommon in sediments of the Santa Fe Group aquifer system (Hawley andHaase, 1992; Stanton et al., 1998; Stanton et al., 2001a; Stanton et al.,2001b). Furthermore, sulfur isotope data (Plummer et al., in press), indicatethat most present in ground water of the MRGB is derived fromdissolution of evaporite deposits present along some basin margins ratherthan from dissolution of sulfide minerals. Also, Stanton et al. (2001a;Stanton et al., 2001b) found that 10 percent or less of As present in a coreobtained from the western part of Albuquerque was associated with thesulfide/organic fraction of the core. Pearson correlation coefficients (alsocommonly known as r values) calculated for water-quality zones withsubstantial concentrations of As do not show the strong positive correlationsbetween As and and negative correlations between As and pH thatwould be expected if As concentrations were increasing as a result of sulfidedissolution (Table 3).
7.2 Adsorption processes
Arsenate ions in the pH range of about 6.8 to 11.6 andin the pH range of about 2.2 to 6.8), which likely are the predominant formof As in ground water of the MRGB, can be strongly sorbed onto metaloxides, particularly oxides of Fe and Al. Previous investigations have shownthat arsenate ions are less strongly associated with metal oxides at pH valueshigher than about 7.0 to 8.0 than at lower pH values, probably because ofcompetition from hydroxide ions for sorption sites (Boyle et al., 1998; Smithet al., 1998; Welch et al, 1988; Welch et al., 2000). A study by Robertson(1989) indicated that adsorption of arsenate ions on smectite or ferricoxyhydroxide was the major control on As in ground water of at least threealluvial basins in Arizona. The variation in pH values across the MRGB,which range from 6.4 to 9.8, could contribute to variation in theconcentration of As in ground water of the basin. Stanton et al. (2001a) andStanton et al. (2001b) showed that the most likely source of soluble As froma core obtained from the western part of Albuquerque is the “anion-exchangeable” fraction associated with clay and secondary Fe oxide surfacesthat could be mobilized by ground water with high pH and/or low Eh values.
The West-Central zone (Table 3), where the core studied by Stanton et al.(2001a) and Stanton et al. (2001b) was obtained is the only water-qualityzone with a statistically significant correlation between As and pH at the0.05 level and a Pearson correlation coefficient greater than 0.3. Thecorrelation coefficient for the West-Central zone is 0.46, and a graph of Asversus pH (Fig. 5) for the zone shows that nearly all samples with As

31711. Occurrence of arsenic in ground water of the Middle Rio GrandeBasin, central New Mexico
concentrations less than have pH values of less than 8.5, whereasmost samples with As concentrations exceeding have pH values of8.5 or greater. The observation that the largest As concentrations in theWest-Central zone generally appear to be associated with pH values greaterthan about 8.5 may explain the lack of a strong overall relation between Asand pH in other water-quality zones, where pH values generally do notexceed 8.5. It is nevertheless possible that desorption increases Asconcentrations in localized areas of elevated pH in other zones where“anion-exchangeable” As is available. Although adsorption/desorption of Asassociated with metal oxides appears likely to regulate dissolved-Asconcentrations in the West-Central zone, this process does not provide a fullexplanation for the source of As to the ground water and sediments of thezone.

318 Chapter 11
7.3 Water source
Median values and ranges of As concentration vary substantially amongwater-quality zones (Figs. 2 and 3), which indicates that water sources to thebasin could be a primary factor affecting As concentrations. An associationof As with source water would be consistent with observations of previousinvestigators indicating that thermal water and water from areas of intenseevaporation commonly have high As concentrations (Welch et al., 2000).Ground water in zones grouped in the west and Tijeras areas of Table 1 hasconsistently small As concentrations. Therefore, in these zones, the watersource is apparently low in As concentration; in particular, the generally lowAs concentrations in surface water of the Rio Puerco and Tijeras Arroyo areconsistent with the generally low As concentrations in zones that receiverecharge from these sources.
Ground water of zones in the east and central areas (Table 1) includesboth high and low As concentrations. Within these zones, concentrations ofAs near basin margins, where much of the recharge occurs, are low(generally less than indicating that mountain-front rechargeprobably does not contain high As concentrations. Surface water in the RioGrande and Abo Arroyo, which are important local sources of ground-waterrecharge, have low As concentrations (typically less than Therefore,surface-water recharge also does not appear to contribute to elevated Asconcentrations in ground water of the east and central areas. Previousinvestigators (Anderholm, 1988; Bexfield and Anderholm, 2002; Trainer etal., 2000) have proposed that deep (thousands of feet) and presumably oldmineralized water with high Cl concentrations upwells in particular areas tomix with shallower ground water (Fig. 3). In some parts of the east andcentral areas, high As concentrations in ground water have been shown tocoincide closely with these areas of elevated Cl concentration (Bexfield andAnderholm, 2002; Trainer et al., 2000). Upwelling may occur as leakagealong faults or as the result of the movement of ground water over structuralhighs between subbasins, as indicated by the clustering of high Cl and Asconcentrations along these features (Fig. 6). Mixing with deep water havinghigh Cl and As concentrations could explain the occurrence of elevated Asconcentrations in zones where the primary source water (surface waterand/or mountain-front recharge) appears to have low As concentrations.Unfortunately, the exact origin and composition of deep ground water withelevated Cl and As (Table 4) is not clear. The observed decrease of both Asand Cl concentrations with distance downgradient of these affected areaswould be consistent with declining As concentrations as a result of dilutionrather than adsorption.

31911. Occurrence of arsenic in ground water of the Middle Rio GrandeBasin, central New Mexico

320 Chapter 11

11. Occurrence of arsenic in ground water of the Middle Rio GrandeBasin, central New Mexico
321
Areas of high As concentration appear to coincide closely with areas ofhigh Cl concentration in the Northern Mountain Front, Eastern MountainFront, and Central zones (Fig. 6). Statistical tests for correlation (Table 3)appear to support the conclusion that most of the higher As concentrations inthese areas are associated with older, more mineralized water.Concentrations of As in the Northern Mountain Front zone are stronglyassociated with concentrations of Na, B, Cl (Fig. 7), and Li, and withspecific conductance and temperature. Anderholm (1988) and Trainer et al.(2000) describe high-Cl water near the southern end of this zone as conduitflow that may originate as geothermal fluid in the Valles Caldera of theJemez Mountains. Chloride, Na, As, B, and Li are all found at highconcentrations (greater than 1500 milligrams per kilogram for Cl and Na and2.7 milligrams per kilogram for As, B, and Li) in geothermal water of thecaldera (Goff et al., 1988). Similarly, in the Eastern Mountain Front zone, Asis strongly correlated with carbon-14 (negative coefficient) and Mo, B,temperature, Na, V, Cl, and K (all positive coefficients). The inverse relationof As with carbon-14 in percent modem carbon (Fig. 8) indicates that As ispositively correlated with ground-water age. In the eastern part of theCentral zone (approximately east of the dashed line of Fig. 2), where nearlyall ground-water samples with As concentrations greater than arecoincident with areas of high Cl concentrations, As is not strongly correlatedwith Cl concentrations or specific conductance values, but is stronglynegatively correlated (-0.72) with carbon-14 content (Fig. 8). Otherconstituents with correlation coefficients greater than or equal to 0.60 withAs concentration in the area are Ca (negative coefficient) and F, B, Na, Li,and Mo (all positive coefficients), which would be consistent with a sourceof deep, old water with elevated concentrations of Na and minorconstituents.
Elevated As concentrations in western parts of the Central zone also maybe associated with high-Cl upwelling (Figs. 3 and 6), but investigation ofthis possibility is complicated by the likely presence of As-rich ground water(median concentration of of the West-Central zone at depth belowthe western part of the Central zone. Analysis of samples from piezometernests in the western part of the Central zone show a shift toward a moretypical West-Central zone composition (higher pH, lower concentrations ofCa, Mg, and Sr, and higher concentrations of Na, V, F, and As; Table 1) withdepth. Therefore, in western parts of the Central zone where low Clconcentrations indicate little or no effect from deep, mineralized water,elevated As concentrations probably are the result of mixing between theCentral-zone water originating at the Rio Grande and the deeper West-Central zone water. Arsenic in this area shows strong negative correlations
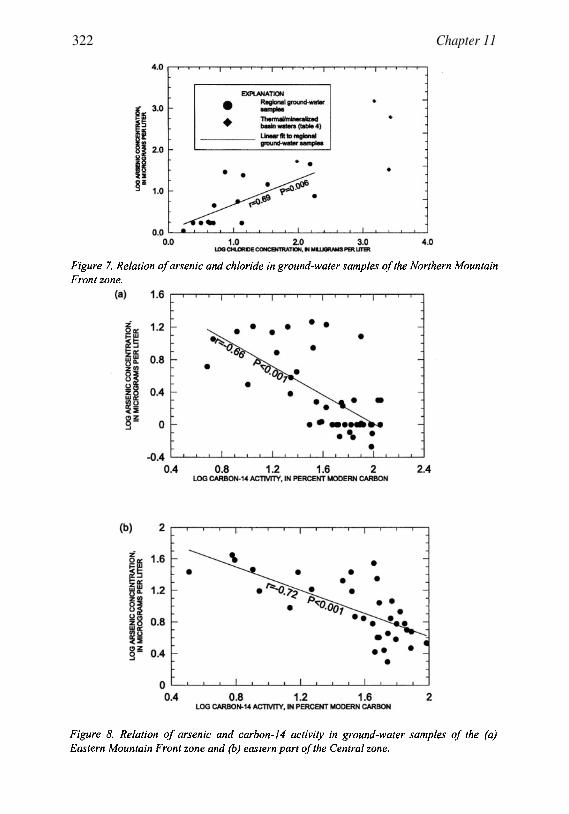
322 Chapter 11
11. Occurrence of arsenic in ground water of the Middle Rio GrandeBasin, central New Mexico
323
with carbon-14 content and concentrations of Ca, Mg, and Sr and positivecorrelations with concentrations of V and F (Table 3), which appearsconsistent with this conclusion.
Additional observations appear to lend support to the conclusion thatelevated As concentrations in parts of the east and central areas areassociated with the upwelling of deep, mineralized water. Chloride, As, Na,and B concentrations tend to increase with depth in piezometer nests locatedin high-Cl areas of Albuquerque (Figs. 4 and 6). Also, As(III) constitutesabout 10 to 50 percent of As in oxic ground water in the high-Cl northeastarea of Albuquerque (Bill Lindberg, City of Albuquerque, written commun.,2000), suggesting a deep As source. Water from a deeper, more reducingzone, where As (III) predominates, apparently mixes with more shallow,oxic water. At the far southern end of the Eastern Mountain Front zone (Fig.2), one ground-water sample with a temperature of 53.8 °C and a sampleslightly downgradient with a specific conductance of (with Asconcentrations of 52 and respectively) suggest that deep, thermalwater is upwelling in this area. Finally, the well that produces water with thehighest As concentration in the Northeastern zone is near anintersection of major faults and has a relatively high Cl concentration (66.1mg/L), indicating that upward movement of mineralized water along faultsof the area could be the primary As source.
In the Abo Arroyo zone, the two ground-water samples with Asconcentrations greater than have relatively high pH values andand K concentrations relative to the other two samples; Cl concentrations forthese two samples are the lowest. It appears possible, although not certain,that a silicate reaction may have increased pH enough to allow some As todesorb from aquifer materials.
In contrast to zones with extensive areas of small As concentrations,nearly all ground-water samples from the northwest area (Table 1) have Asconcentrations greater than or equal to As discussed earlier,adsorption/desorption processes likely affect the As concentrations in groundwater of the West-Central zone and could particularly increase Asconcentrations in areas where pH exceeds 8.5. However, the process doesnot provide a full explanation for the ultimate source of As to ground waterand basin-fill deposits of the northwest area, particularly near the basinmargins. Elevated As concentrations near basin margins indicate that thesource water to these zones has relatively high As concentrations. Thepresence of silicic volcanic rocks and high-As geothermal waters in theJemez Mountains, believed to be the primary recharge area to these zones, isconsistent with this observation. However, the occurrence of elevated As inground water near basin margins in these zones contrasts with the apparent

324 Chapter 11
lack of As in ground water near the recharge area of the Northern MountainFront zone, in the eastern Jemez Mountains (Fig. 3). The near-surfacegeology of the eastern and western parts of the Jemez Mountains generally isquite similar, consisting mainly of Tertiary and Quaternary volcanic rocks.Therefore, some other feature must differ between these areas in order for Asconcentrations to be higher in recharge water from one area compared to theother.
The distribution of geothermal water from the Valles Caldera potentiallycould account for the difference in As concentrations observed near rechargeareas for the Northern Mountain Front zone as opposed to the northwest-areazones. Previous investigations (Goff et al., 1988; Trainer, 1975, 1984;Trainer et al., 2000) have shown that mineralized water from the calderaprobably flows primarily south and west, where it contributes to thermalsprings, and probably does not leak from the caldera to the east. Mixing ofmountain-front recharge water with small quantities of this geothermalwater, typically with As concentrations higher than 1 mg/L, could increaseAs concentrations in the non-thermal recharge water.
A plot of As relative to Cl was used to examine the possibility that themixing of geothermal water with mountain-front recharge water results inthe As concentrations observed in ground water of the northwest-area zones(Fig. 9 and Table 4). Ground-water samples from these zones (Northwesternand West-Central) generally do not fall along the line representingconservative mixing between dilute mountain-front recharge water ofmodern age and water derived from Soda Dam Spring, a thermal springlocated southwest of the Valles Caldera. Water from Soda Dam Spring hasbeen shown to have an As-Cl ratio very similar to that found in geothermalwater inside the Valles Caldera (Goff et al., 1988). This plot supports theconclusion that As concentrations in the northwest zones are controlledprimarily by a process (or processes) other than mixing with geothermalwater from the caldera.
Flow of mountain-front recharge water through rocks altered by contactwith geothermal water is a possible source of As and other trace elements toground water near the recharge area that appears consistent with theobserved chemistry. Dunbar and Chapin (1994) state that local hydrothermalsystems often lead to intense alteration of rocks and sediments, particularlythose of volcanic origin; contact with geothermal water typically enrichesthe rocks in trace elements but not Cl (Nelia Dunbar, New Mexico Bureau ofMines and Mineral Resources, oral commun., 2000). Hydrothermally alteredrocks have been observed both inside and south of the Valles Caldera(Charles et al., 1986; Goff and Gallaher, 2001). Therefore, local rechargewater in the western part of the Jemez Mountains may acquire As bydesorption or dissolution from volcanic rocks and sediments that have had

32511. Occurrence of arsenic in ground water of the Middle Rio GrandeBasin, central New Mexico
contact with geothermal water, and then transport the As into the MRGB.Subsequently, adsorption/desorption processes involving Fe oxides in thebasin-fill deposits affect the concentration at any particular location alongthe flow path.
Similar to zones of the northwest area, ground water of the Dischargezone has As concentrations, in general, greater than or equal to Therelatively high As concentrations in the Discharge zone are not surprisinggiven that this area represents the drain for the ground-water system for theentire basin. Ground water in this zone typically is quite old with highspecific conductance values, indicating long flow paths and travel times.Interestingly, the lowest As concentrations are found in ground-watersamples with the highest specific conductance values and Cl concentrations.These samples probably represent ground water with a substantial fraction ofwater from the Western Boundary zone, where the source of Cl and isdissolution of Permian sedimentary rocks (Plummer et al., 2001; Plummer etal., in press).

326 Chapter 11
8. IMPLICATIONS FOR DRINKING-WATERSUPPLIES
This investigation indicates that the quantity of potable ground water(total dissolved solids less than about 500 mg/L) in the Middle Rio GrandeBasin that will meet the USEPA drinking-water standard of for Asis limited. Most wells known to produce water meeting these criteria arelocated in the vicinity of Albuquerque between the Rio Grande inner valleyand the eastern mountain front and south of Albuquerque near the easternmountain front (Fig. 3). Other clusters of sampled wells that meet the criteriaare in the far northern part of the basin and at the northern end of the SandiaMountains. However, even within these broad areas of generally low Asconcentrations, samples from some wells have As concentrations higher than
Within Albuquerque in particular, many wells east of the RioGrande that are located in areas of apparent mixing with deep, mineralizedwater or with water from the West-Central water-quality zone have Asconcentrations higher than In addition to Albuquerque, themunicipalities of Rio Rancho, which is located largely over water of theWest-Central and Northwestern zones, and Bernalillo, which is locatedlargely over an area affected by the presence of mineralized water that mayoriginate in the Valles Caldera, anticipate difficulty meeting the new USEPAstandard for As. Arsenic concentrations exceed across large areasnear both of these municipalities (Fig. 3).
Although most of the wells sampled for this investigation werecompleted in the upper 1,750 feet of the Santa Fe Group aquifer, indicationsfrom deep piezometer nests are that As concentrations typically increasewith depth. Also, unpublished data from two oil wells near the center of thebasin at depths of 2,600 to 6,600 feet below land surface indicate Asconcentrations exceeding 50 to (Scott Anderholm, USGS, writtencommun., 2001). Therefore, it is doubtful that wells completed at greaterdepths would yield water with lower As concentrations for drinking-watersupply in those municipalities that anticipate difficulty meeting the newUSEPA standard.
9. SUMMARY
Drinking-water supplies for residents of the Middle Rio Grande Basin,and particularly the City of Albuquerque, will be affected severely by thenew U.S. Environmental Protection Agency (USEPA) of for As indrinking water (Federal Register, 2001). Previous investigations and recentdata collected at 288 sites as part of the USGS MRGB study indicate that As

32711. Occurrence of arsenic in ground water of the Middle Rio GrandeBasin, central New Mexico
concentrations exceed in ground water in the Santa Fe Groupaquifer system (the almost exclusive source of drinking-water supply) acrossbroad areas of the basin. Because the multiple sources of recharge to theaquifer system differ substantially in chemical composition, the basin wasdivided into 13 separate water-quality zones for analysis of As occurrenceand sources.
This investigation of the distribution of As in ground water demonstratesthat there are two main categories of high-As source water for the MRGB.One source is mineralized water of deep origin. Geologic structure appearsto control the geographic distribution of this mineralized water, whichupwells along faults or as the result of ground-water movement overstructural highs. Mixing with such water elevates the As concentrations ofground water at shallower depths of the aquifer in parts of the central andeast areas of the basin. The exact composition of this deep, mineralizedwater is not necessarily consistent throughout the basin, and its exact originis unknown, although the water may be of thermal origin in some areas. Theother high-As source affects ground water in the northwest part of the basinand is associated with silicic volcanism in the Jemez Mountains to the north.Upon entering the basin, the generally oxic, high-pH recharge water from thewestern portion of the Jemez Mountains contains substantial dissolved Asthat does not appear to have resulted primarily from mixing with geothermalfluids. Recharge of water through rocks that have been altered by contactwith geothermal fluids could account for the occurrence of high As inground water that originates in the western part of the Jemez Mountains, incontrast to low As in ground water that originates in the eastern part; moreresearch is necessary to support this conclusion. Ground water that has notbeen affected by either of these two high-As sources, including waterthroughout most of the west and east areas of the basin, generally has low Asconcentrations.
Adsorption/desorption processes also appear to affect As concentrationsalong flow paths in the West-Central zone of the northwest part of the basin,where the highest As concentrations typically occur for samples with pHvalues of 8.5 or higher. Increasing As concentrations at higher pH values isconsistent with data from a core studied by Stanton et al. (2001a and b),which indicate that “anion-exchangeable” As is present on Fe oxides in thearea.

This page intentionally left blank

Chapter 12
Arsenic Contamination in the Water Supply ofMilltown, Montana
Johnnie N. Moore and William W. WoessnerDepartment of Geology, University of Montana, Missoula, MT 59812
In 1981, four community supply wells in Milltown, Montana were found tocontain arsenic levels ranging from 220 to The wells producedwater from an unconfined aquifer composed of coarse sand, gravel and
boulders, underlain by bedrock, adjacent to a small hydroelectric reservoir.Historical assessment showed that the contamination was long term. Thereservoir sediments, that originated partially from large scale mining and
milling operations up stream, were identified as the source of aquifercontamination. Reservoir water flowing through contaminated sediment
produces arsenic-rich pore water that migrates vertically into the underlyinghighly conductive pre-dam alluvial floodplain sediments. This sulphur-
limited, anoxic environment results in ground water arsenic concentrations upto ca. at the base of the fine-grained reservoir sediments. Arsenicis released at a rate of 1.6 MT/y from a study section covering ofthe reservoir. The groundwater flowing north from beneath this section, and
into the adjacent aquifer, contains arsenic at a median concentration of 740and discharges arsenic at approximately 24.6 MT/y. Pre-dam floodplain
groundwater originating from beneath other portions of the reservoir issuggested as one source of the additional arsenic flux. Ground water transport
into the adjacent Milltown area results in a reduction of arsenicconcentrations with distance. Based on relationships with chloride andsodium, mechanical dispersion does not account for the observed reduction inarsenic concentrations. Analyses of Fe(II)/Fe(Total), As (III)/As(Total),As/Fe and As/sulphate suggest co-precipitation/precipitation of arsenic withmetal sulfides and/or co-precipitation/adsorption with iron oxyhydroxides
dominate arsenic reduction during transport. Estimates of available arsenicwithin the reservoir sediments suggest only 15 to 25 y of discharge would
remain if no additional arsenic was added. However, arsenic concentrationsare not declining in wells with long term records and arsenic bound incontaminated sediment from upstream is delivered at an average of 590 to

330 Chapter 12
740 MT annually. Current USEPA remediation alternatives range from
leaving the existing system in place to total dam and reservoir sediment
removal. However, it is not clear how well the consequences of such actions
are understood.
1. DISCOVERY OF ARSENIC CONTAMINATIONAND POTENTIAL SOURCES
The small community of Milltown, Montana, is located at theconfluence of the Blackfoot and Clark Fork Rivers, about 10 km upstreamand east of Missoula, Montana (population of 57,059). The Clark Fork RiverValley trends E-W and cuts into Precambrian sedimentary (Belt Series)rocks of the Sapphire Mountains to the south and the Garnet Range to thenorth (Fig. 1). The valley is filled with 8 to 55 m of Quaternary–Recentalluvium (Woessner, 1995), an aquifer that supplies drinking water to theresidents of Milltown. During newly-required sampling of community wellsin November, 1981, the Montana Department of Health and EnvironmentalSciences (MT-DHES) determined that four community water wells serving33 residences in Milltown contained levels of arsenic ranging from 220 to
These values were above the USEPA MCL for arsenic ofMT-DHES advised the residents not to drink or cook with water from wellsin Milltown and bottled water was supplied to residents by ChampionInternational, the landowner.

12. Arsenic Contamination in the Water Supply of Milltown,Montana
331
In early 1982, we began a reconnaissance–level hydrogeologic study toidentify potential sources of arsenic (Woessner and Popoff, 1982). Prior tothe commencement of the study, local residents were interviewed to assessthe timing of the contamination and possible sources. The occurrence ofpoor–quality water having a metallic taste, and red and black staining ofporcelain fixtures appeared to be isolated to houses only in the southern partof Milltown (between the railroad tracks and I-90, Fig. 2). All residentsidentified the problem as long term. They were also eager to suggest anumber of possible sources for contaminants. The Champion Internationalplywood mill (now Stimpson Lumber) north of the effected area wasimmediately accused by some residents. In 1975, ground water adjacent toand just south of the plant site was contaminated with tannins and ligninswhen log treatment ponds overflowed. This resulted in abandoning a numberof wells and the replacement of water supplies with well C-2 (Fig. 2).
The residents also noted that prior to Champion's purchase of theproperty, in the early 1970's, Anaconda Mining Company operated a sawmillon the property, producing timbers for the mines at Butte (a large mining

332 Chapter 12
operation upstream—see below). It was suspected that arsenic may havebeen used at the mill as a wood preservative. Additionally, residents wereconcerned about an old dump, which was used for mill wastes and householdgarbage, located southeast of the effected area on the bank of MilltownReservoir, which is adjacent to the town.
Historical assessment showed that the problem was long term. Noproducts with high-arsenic concentrations were currently being used at theplywood mill and log soak pond liquids did not contain arsenic. AnacondaMining Company did use the site prior to Champion International, however,no records were available concerning use of arsenic. What was left of thedump wastes had been pushed out onto the reservoir sediments in the 1960'swhen I-90 was being constructed. Sediments beneath the dump had beenused as borrow to construct a road grade to the bridge crossing the BlackfootRiver arm of the reservoir. Woessner and Popoff (Woessner and Popoff,1982) also investigated the occurrence of spills of arsenic–containingcompounds resulting from a highway or rail accidents in Milltown and foundnone.
A few of the residents also wondered what was in the small reservoir tothe south that dammed the Clark Fork River. The river had received miningand milling wastes for over 100 years from the Butte and Anaconda areas190 to 240 km upstream. In 1975, Bailey, as part of her Master of Science atthe University of Montana, sampled reservoir sediments (Bailey, 1976) andfound elevated concentrations of copper, lead and zinc (Bailey and Weisel,1976). However, she did not analyze the sediment for arsenic.
The preliminary 1982 hydrogeologic study found that ground water in theMilltown area originated from three likely areas: 1) the Blackfoot alluvialvalley flowing beneath the mill site; 2) the Clark Fork River alluvium; 3) thereservoir (Woessner and Popoff, 1982). Although no wells existed betweenthe old dump site/reservoir and Milltown, the potential for flow from thereservoir area was evident because the reservoir stage was 5 m higher thanwater levels in contaminated wells.
Because we thought it likely that arsenic accompanied the metalcontamination found by Bailey in the reservoir sediment (Bailey and Weisel,1976), we also took four grab samples of sediment through the ice onMilltown reservoir in the winter of 1982. Analyses of these samples,completed in the summer of 1982, revealed that reservoir sediment containedsomewhat elevated concentrations of arsenic and lead: arsenic, 54-135 ppm;lead, 5-95 ppm. The sediment also contained very high levels of zinc, up to2,880 ppm. Using these limited values we calculated the potential volume ofcontaminated sediment residing in the reservoir, about 4.4 million tons. Thiswas sufficient to have Milltown Reservoir ranked as a CERCLA"Superfund" Site—#198 out of the initial 400 sites designated by theUSEPA. Subsequently, MT-DHES and USEPA asked us to identify the

12. Arsenic Contamination in the Water Supply of Milltown,Montana
333
source of arsenic and locate a new, arsenic–free water supply well for thecommunity of Milltown.
We began that work in July of 1983 and successfully completed it byJune 1984, identifying the reservoir sediment as the source of alluvialaquifer ground water contamination. Water quality sampling in 1983revealed the highest arsenic concentrations yet recorded at the fourcommunity wells, in the 100 to range. However, backgroundarsenic concentrations of less that (the detection limit) were foundimmediately north of the contaminated wells. Sand points located in thereservoir sediment showed ground water arsenic concentrations between 500and In the portion of the ground water system in which arsenicexceeded background, manganese and iron usually exceeded drinking waterstandards. At the completion of this initial work, a new community waterwell was proposed and later constructed north of the ground water impactedby arsenic, iron and manganese, near community well, C2 (Woessner et al.,1984). Since completion of our work in 1984, numerous additional siteevaluations have occurred as part of the CERCLA process (ENSR, 1991,1992; HLA, 1986, 1987; Hydrometrics, 1985; Titan, 1994).
In this chapter, we review the processes and pathways releasing andtransporting arsenic to the Milltown wells from the reservoir sediments. Thisinterpretation is based on our and our graduate student's research and a varietyof other sources on Milltown written over the last nineteen years.
2. RESERVOIR SEDIMENT SOURCE ANDCHARACTER
Milltown Dam was built in 1907 and impounds the Blackfoot and ClarkRivers at their confluence at Milltown, Montana (Fig. 2). The rock and cribdam is underlain by bedrock (under its south half) and alluvium (north half).Milltown Dam is run as a hydroelectric facility by Montana Power Company(now PPL), who has owned the dam since 1929. The low head and minimalstorage capacity (residence time of only 10 hours, Reynolds, 2001) of thereservoir severely limits its capability as a generation facility. It presentlygenerates only about 1.4 KW of electricity, although upgrades to 4 KW havebeen proposed. The reservoir behind the dam is small, covering only 245 ha,and is nearly filled with fine–grained sediment transported mostly by theClark Fork River and to a lesser extent by the Blackfoot River. It is thesesediments that contain elevated concentrations of arsenic and metals.
About 200 km upstream from Milltown Reservoir, large–scale mining andprocessing of copper ores over the last ca. 100 years at Butte and Anaconda

334 Chapter 12
released over 100 million metric tons (MT) of wastes into the headwaters(Silver Bow and Warm Springs creeks) of the Clark Fork River (Moore andLuoma, 1990). Other tributaries of the Clark Fork River above Milltown alsocontain a large number of abandoned mines and some processing facilities thathave added smaller quantities of wastes to those originating from theButte/Anaconda region (Helgen and Moore, 1996). Milltown Dam is the firstdam on the Clark Fork River downstream from the main inputs of waste fromAnaconda and Butte (excluding tailings ponds). The sediment filling the dam isa mixture of "naturally-derived" sediment from uncontaminated tributaries andmining waste from upstream sources. The sediment package wedges out fromapproximately 8 meters thick near the dam face to 0.5 meters about 3 kmupstream from the dam.
The stratigraphy of the reservoir sediment is complex. Inter-layeredchannel, floodplain and slough deposits create a complex mosaic of sedimenttypes and grain sizes with a vertical intermixing of sandy and muddy deposits(ENSR, 1992; Woessner et al., 1984). All cores from the reservoir showdiscontinuous, interlayers of sand, mud and clay with isolated concentrations oforganic material. The coarsest sediment is near the river channels and in theuppermost part of the reservoir. Finer-grained sediment is found in areas nearthe dam and farther from the active channel. The reservoir stage is over 5 mhigher than the ground water found in the adjacent Milltown alluvial aquifer.This results in movement of ground water through the fine-grained sedimentsand into the underlying alluvium.
The fine-grained sediments filling the reservoir overlay the originalfluvial plain sediments of the Clark Fork River. These now form an alluvialaquifer beneath the reservoir sediments. The fluvial sediments are composedof sand, gravel, cobbles and boulders. There is little known about theirstratigraphic framework other than its origin as high-energy fluvial andcatastrophic glacial-flood deposits (Alden, 1953). Based on borings tobedrock between lanes of the interstate and areas north of the reservoir, andinterpretations of bedrock depth from geophysical studies by Titan (1994)and Schombel (1994), floodplain alluvium was estimated to be from 6 to 10m thick, increasing from the dam to the southeast (Woessner, 1995). Groundwater in these sediments appears to flow to the north towards Milltown,though only limited head data are available in these sediments.
The alluvial sediments adjacent to and surrounding the north side of thereservoir are dominated by sand, gravel and boulders. This material isconnected with the pre-dam floodplain beneath the reservoir sediments and isof the same high-energy fluvial origin. The sediment package thickens from thereservoir to the north extending to depths of over 55 m. It is underlain byfractured bedrock that yields little ground water. Previous studies suggest thatzones of hydraulic conductivity exceeding 18,000 m/d are most likely presentin the alluvial aquifer (Woessner et al., 1984). Ground water occurs from 9 to

12. Arsenic Contamination in the Water Supply of Milltown,Montana
335
18 m below land surface and flow is generally from the reservoir area to thenorth-northwest.
The fine-grained sediments in the reservoir are highly elevated overbackground concentrations for a variety of elements. Arsenic values rangefrom lows of ca. <10 to 1600 ppm, with mean values ca. 200-300 ppm(Titan, 1994; Woessner et al., 1984). Copper and zinc are much higher, withhigh values up to ca. 11,000 ppm and 14,000 ppm, respectively; sulfidesulfur ranges from ca. 750 to 6000 ppm (Titan, 1994; Woessner et al., 1984).Different workers have calculated the total amount of contaminated sedimentin the reservoir. Estimates range from ca. (Woessner et al.,1984), (HLA, 1987), and (EMC2, 2000) resultingin from ca. 1500 to 2650 MT of arsenic residing in the reservoir sediment.Pore water chemistry shows that arsenic and metals are definitely movingfrom the solid to the solute phase—arsenic pore water values range up to
and are commonly above (Woessner, 1995).The presence of elevated metals and arsenic in the sediments corresponds
with the high concentration of dissolved constituents in the wells installed inthe reservoir sediment (HLA, 1987; Titan, 1996; Woessner et al., 1984). Inthese wells, TDS is commonly over 1,400 mg/1, dissolved arsenic rangesfrom ca. 100 to Mn from ca. 0.1 to 25 mg/1 and iron from ca. 1to 60 mg/1. Arsenic speciation results show that samples from withinreservoir sediment and the adjacent contaminated aquifer are dominated byAs(III) (Moore et al., 1988).
3. CONDITIONS CONTROLLING THE RELEASEOF ARSENIC
Arsenic and metals are transported into the reservoir from the Clark ForkRiver as original sulfide minerals and as iron oxide/hydroxidecrusts/coatings on silcates and other grains (Brook and Moore, 1988; Kuzel,1993). However, elemental and mineralogic relationships of metalstransported into and residing in the reservoir are complex and not wellestablished. Once in the reservoir, river sediments reside dominantly inanoxic environments. Three conceptual geochemical models of the processescausing arsenic migration from the reservoir sediment have been proposed.
The geochemical environments within the upper 1.5 meters of reservoirsediments were first described by Moore et al. (1988). They found an upperoxidized zone in only the upper few centimeters of subaerially exposedsediment, beneath which saturated sediment was dominated by anoxicconditions. Udaloy (1988) found that the anoxic zone extended to the base of

336 Chapter 12
the reservoir sediment and that the boundary with the oxic zone fluctuatedwith reservoir stage. She developed a conceptual geochemical model basedon microbially-mediated redox reactions and concluded that fluctuation instage controlled redox conditions which mobilized arsenic from the reservoirsediments. The strong downward hydraulic gradients then transportedarsenic, iron and manganese released by this redox pump (Moore, 1993) intothe underlying alluvial aquifer. Moore et al. (Moore et al., 1988) originallysuggested that sulfate reduction to sulfide and the subsequent precipitation ofmetal sulfides controlled arsenic transport to the ground water. Basically,they concluded that the system was sulfur limited, allowing arsenic to escapeto the underlying aquifer because the amount or rate of sulfide formationwas not sufficient to fix arsenic.
Subsequent work by Titan (1995) identified a transition zone between theupper oxic zone and lower anoxic zone. They discounted the redox pump asthe main driver of arsenic and metal release because of the typically smallannual fluctuations in reservoir stage (less than ca. 1.5 m) and instead usedan advancing "geochemical front" to mobilize arsenic from ironoxides/oxyhydroxides in the sediment. Their model requires either acontinual source of these phases (see below) or very slow kinetics for thedissolution of minerals deposited 130 to 90 years ago (the proposed periodof major deposition). This mechanism is supported partially by the fact thatarsenic concentration in the pore water locally increases with depth in thesediment (Moore, 1993; Titan, 1995). Titan also suggested that the systemwas sulfur limited allowing arsenic and iron to escape the anoxic-sulfidiczone at the base of the sediments. This mechanism is somewhat similar tothose proposed to release arsenic from the deltaic sediments in the Bengalregion of Bangladesh and India (Nickson et al., 2000), although thosesediments contain much lower concentrations of arsenic than the MilltownReservoir sediments.
CH2M Hill (1994) proposed similar mechanisms but suggested thatsulfide was not limiting arsenic mobility. Instead they suggested that arsenictransport was "...more related to the repeated adsorption of dissolved AsV byremanant or precipitated oxyhydroxides within the oxidized part of thetransition zone..." (CH2M Hill, 1994). They did, however, conclude thatinsufficient sulfide in their "reduced zone" (anoxic) allowed iron to remainmobile. Based on the brown color of some sediments from the lower portionof the stratigraphic package, they proposed that "...the lower part of thereservoir sediments appear to be more oxidized than reduced." They suggestthat an oxidized zone of ground water exists beneath the reservoir sediment.However, none of the water geochemistry supports this conclusion. Allwaters collected from the aquifer beneath the reservoir sediment andimmediately adjacent to the reservoir have signatures indicating an anoxicenvironment. Contaminated ground water in reservoir sediments and the

12. Arsenic Contamination in the Water Supply of Milltown,Montana
alluvial aquifer contains from 70 to 100% As(III) and high concentrations ofdissolved iron (commonly Many of the deeper wells withhigh iron also have relatively low sulfate suggesting that the ground wateraffected by Milltown Reservoir sediments is anoxic sulfidic (Moore, 1993).
All the conceptual geochemical models depend on reduction of pre-deposited iron oxides to release arsenic in the anoxic ground water zone ofthe reservoir and then into the underlying alluvial aquifer. The relationshipsbetween iron, sulfate and arsenic in ground water give some insight intothese processes (Fig. 3). In general, there is a strong correlation between ironand arsenic (Fig. 3A). These data support the concept that ironoxyhydroxides holding arsenic are dissolving under the anoxic conditions inthe reservoir sediment and releasing arsenic. This results in arsenic-contaminated ground water also high in iron. Both arsenic and iron arereduced during this process resulting in the strong correlation betweenAs(III) and Fe(II) (Fig. 3C). Although the sediment is anoxic there appearsto be limited sulfur to form sulfides (Moore, 1993). When sulfate is high inground water, arsenic and iron are both low (Fig. 3B & D), suggesting thatsulfides are forming but leaving excess sulfate. Alternatively, sulfide in theground water is oxidized and iron and arsenic are adsorbed/co-precipitatedwith oxyhydroxides. High concentrations of iron and arsenic are found onlyin ground water with low sulfate concentrations. Most likely the availabilityof sulfur limits the formation of metal sulfides (and hence the incorporationof iron and arsenic) (Moore et al., 1988) in the most contaminated areas ofthe reservoir sediment. This allows arsenic to escape from the reservoirsediment into the ground water flow system. Whatever the details of theserelease mechanisms, it is likely that these processes began almostimmediately after dam completion, in 1907 and 1908, as the pool elevationrose above the pre-dam floodplain water table. As a result, reservoir waterflowed through pre-dam contaminated floodplain sediments and newlydeposited wastes. The long-term presence of poor water quality in Milltown,as reported by the residents, supports the concept of a continuous release ofcontaminants from a long–time source.
4. ARSENIC TRANSPORT AND FATE IN THEALLUVIAL AQUIFER
Once arsenic is released from the contaminated reservoir sediments, itmoves vertically, exiting the sediments and entering the pre-dam alluvium
337

338 Chapter 12
underlying the reservoir. Woessner et al. (1984) and Udaloy (1988) found thathydraulic gradients in the fine reservoir sediment were strongly downward,averaging between 0.15 to 0.40. Titan (1995) used four wells and computed anaverage vertical gradient of 0.25. Titan’s (1995) analyses of Udaloy (1988) andHydrometrics (1985) slug test data and their grain-size data results in meanhydraulic conductivity values that range from 0.061 to 0.64 m/d. Assumingthese values represent horizontal hydraulic conductivity and that verticalconductivities are typically 0.1 of horizontal values, then sediment verticalhydraulic conductivity would range from 0.0061 to 0.064 m/d. Assuming aporosity of the reservoir sediments of 0.4, an average horizontal hydraulicgradient of 0.25, and the range of vertical hydraulic conductivity values,vertical ground water velocities would range from 0.004 to 0.04 m/d.Movement of river water through the channel sediments and in the pool areanear the dam most likely occurs at a higher velocity because the sediment

12. Arsenic Contamination in the Water Supply of Milltown,Montana
339
thickness is about one third the thickness of the exposed sediments, so has alarger hydraulic gradient.
Once ground water leaves the fine-grained reservoir sediments, it entersthe underlying, conductive, pre-dam floodplain alluvium. These gravel-dominated deposits are seamlessly connected to the alluvial material justnorth of the reservoir forming the prolific aquifer beneath Milltown. Groundwater flow in this system is principally horizontal, moving to the north andnorthwest (Fig. 4). The ground water flow directions reveal that reservoir-derived ground water flows north towards Milltown, then turns westwardinto a region of converging flow just west of the Blackfoot arm of thereservoir. A strong southwesterly component of ground water flow down theBlackfoot valley to the north converges with ground water coming from thealluvium beneath the reservoir, forcing ground water to the west. Headdifferences of >4.8 m between the stage of the Blackfoot reservoir arm andthe underlying water table suggest that this water body is mostly perched andhas little impact of the flow of ground water beneath it.
Valley alluvium has been influenced by the high-energy catastrophicLake Missoula emptying events during the last ice age. As a result, zones oflarge diameter, well-sorted gravel and boulders make up parts of thesedimentary package. Woessner et al. (1984) and Titan (1995) report a rangein hydraulic conductivity values from 1200 to 18,000 m/d in the alluvium.With hydraulic gradients ranging from 0.25 to 0.004, an assumed porosity of0.2, velocities would likely range from 360 to 1,500 m/d. It is this aquiferthat supplies water to Milltown, the surrounding area and 10 km downgradient, to the >50,000 residents of the city of Missoula.
We assessed the transport of arsenic in these two ground water systems,the fine-grained reservoir sediments-river channel, and the alluvial aquifer,using flux calculations for a portion of the reservoir and the correspondingflow tube in the alluvial aquifer (Fig. 5). The selected area of fine-grainedreservoir sediments represents an area of and the associated riverchannel an area of The saturated cross sectional area of theunderlying pre-dam floodplain alluvium parallel to the interstate isBased on a maximum vertical hydraulic conductivity value of 0.064 m/d, avertical gradient of 0.25 for the reservoir sediments and 0.75 for the riverchannel sediments, the discharge from the fine-grained reservoir sedimentswould be and respectively. Discharge in the pre-damfloodplain alluvium was estimated at based on a hydraulicconductivity value of 1645 m/d and a gradient of 0.012 (Woessner, 1995).
The mass of arsenic moving from the fine-grained reservoir sediments tothe underlying alluvium was computed by using an average arsenic

340 Chapter 12
concentration of derived from monitoring well sampling (Titan,1995), however, arsenic concentrations ranged widely with some
A value of was used for the stream channelsediments source (Titan, 1995). A median arsenic value for the cross sectionof alluvium of was assigned (averages of Titan data are about 0.90mg/). These values result in a flux of arsenic from the fine-grained sedimentsof 3.9 kg/d and from the river channel of 0.5 kg/d, for a total of 4.4 kg/darsenic (Fig. 5). However, the arsenic flux through the saturated alluvialcross section adjacent to the reservoir is calculated to be 67.8 kg/d. Based onthese computations, 24.6 tons/y of arsenic is flowing from beneath thereservoir, out of the flow tube, into the adjacent aquifer. This is considerablymore than the 1.6 tons/y calculated to leave the fine-grained, reservoirsediment and flow downwards into the flow tube.

12. Arsenic Contamination in the Water Supply of Milltown,Montana
341
The water and mass flux analyses raise issues as to the source of arsenicin the flow tube (Figs. 4 and 5) within the reservoir area. The water fluxfrom the reservoir sediments and river channel sediments is only 6 % of thewater flowing in the underlying 8.2 m thick buried floodplain alluvium.Assuming that the hydraulic parameters used are correct and fluxcalculations adequately reflect the system, there must be another source ofwater and arsenic that is not accounted for in the analysis. The floodplainalluvial flow tube is defined only two-dimensionally and constrained by only2 wells finished in the underlying gravel (within the reservoir). Possibly, amore complex, buried floodplain three-dimensional flow system addsarsenic-rich ground water from up-gradient (upstream within the reservoir)to the flow tube shown. Without additional nested wells in the coarsesediments beneath the reservoir sediment, this hypothesis can not beconfirmed.

342 Chapter 12
As the water flows from beneath the reservoir sediments along a flowpath, (Fig. 5), arsenic concentrations change from at the edge of thereservoir (well 101B) to over a flow distance of about 250 meters(Fig. 6A). By 760 m, the concentration has decreased to Furtherchanges during transport are unclear as limited well data suggest the plumecentroid my not intersect the remaining wells (Fig. 4). However, a well about1550 m down gradient (well 922), but slightly off the trend of the plume,contains ground water with of arsenic (background values in the areaare about If this well represents the arsenic concentration in the enterof the plume at this distance, then concentrations decreased approximatelyexponentially along the flow tube after exiting the reservoir. Iron follows asimilar trend (Fig. 6B).

12. Arsenic Contamination in the Water Supply of Milltown,Montana
343
Theoretical behavior of a conservative tracer originating from a constantand continuous source in a two-dimensional flow field would be expected tomaintain source concentration in this case) throughout the entireobserved flow tube (1550 m) after only a short time period. However,potential conservative tracers in the plume (sodium and chloride, Fig. 7A)show the classical binary-mixing, dilution relationship (Faure, 1998)suggesting that three-dimensional dispersion (dilution) affects plumebehavior. Mixing of un-impacted ground water from the Blackfoot Rivervalley with contaminated water from the reservoir would explain thesodium-chloride relationships. However, plots of arsenic, iron and sulfatewith chloride show no simple binary-mixing relationships, so dilution alonecannot explain the decrease in these constituents (Fig. 7B, C & D).Concentration changes along the flow tube must be controlled, at leastsomewhat, by geochemical processes. Durinng transport, the most likelycontrol on arsenic is precipitation on and/or adsorption to aquifer materials.The water leaving the reservoir is anoxic (high dissolved iron andmanganese and dominated by As(III) and Fe (II) (high values in Fig. 6 C). Aplot of iron vs. arsenic shows that as water moves down the flow path,arsenic and iron decrease in concentration (Fig. 6A & B) and are stronglycorrelated (Fig. 6D). This suggests that a geochemical mechanism isdecreasing arsenic and iron together because these relationships cannot beexplained by dilution alone (Fig. 7).
One of two possible mechanisms are likely: 1) co-precipitation/precipitation of arsenic with metal sulfides; 2) co-precipitation/adsorption of arsenic with iron oxyhydroxides. Bothmechanisms would produce the relationships seen in Fig. 6D. Sulfate is lowat the reservoir margin and increases slightly and irregularly along the flowpath (Fig. 6C) with the highest concentrations found farthest from thereservoir. This suggests that sulfur is not limiting precipitation in the plume.However, a simple trend is not evident. Plots of Fe(II)/Fe(Total) andAs(III)/As(Total) were constructed to examine the redox state of theseconstituents along the flow path; they show somewhat similar trends (Fig. 8).Iron is dominated by Fe(II) throughout the plume and decreases slightlyalong the flow path. The last well in the plot (which also may not lie directlyin the plume center) has very low iron concentrations Thedetermination of Fe(II) in this sample is suspect because the Fe(II) value isfour times the Fe(total) value. These data would suggest that anoxicconditions persist throughout most of the plume and oxic conditions existonly at the far end of the plume (low total Fe). The As(III)/As(Total) rationsare somewhat higher in the plume at about 800 m from the reservoir. Thesample farthest from the reservoir has the lowest ratio, but this sample is

344 Chapter 12
suspect because of low As(Total) concentrations. Overall, the arsenic redoxdata are quite variable, but also indicate that at the end of the plume groundwater may be more oxic than farther up gradient, although the last samplemay not be directly in the center of the plume. Unfortunately, theseinconclusive relationships in the geochemical data along the flow path, makedistinguishing between sulfide and iron-oxyhydroxide precipitation verydifficult. However, the trends and relationships in the geochemical data doshow that the decrease in arsenic away from the reservoir is a combination ofplume diffusion and precipitation/adsoprtion of arsenic along with ironwithin the aquifer as it moves along the flow path.

12. Arsenic Contamination in the Water Supply of Milltown,Montana
345
5. ARSENIC FLUX AND TRENDS
Although the geochemical and hydrogeologic mechanisms of arsenicfixation and transport within and from the reservoir are not finally resolved,arsenic is certainly being released from the reservoir sediment at relativelyhigh rates (tons per year). We estimate that 25.7 MT/yr of arsenic leave thereservoir sediment and enter the adjacent aquifer (Fig. 5). 24.6 MT/yr comefrom the lower reservoir area (essentially our flow tube in the analysisabove). This is ca. 10-20% of the total amount of arsenic estimated to reside

346 Chapter 12
in the reservoir (1500-2650 MT, see second section above). At these rates allthe arsenic should be removed from the reservoir sediment in 60 to 100years. These estimates assume that all the arsenic would be removed fromthe sediment and the concentration would fall to zero. In actuality,concentrations would not fall below background concentrations, and may notreach this level. Extractions show that only 20-30% of the arsenic in thesediment is likely available (Titan, 1995; Woessner, 1995). If this estimate iscorrect, then all the currently-remaining, available arsenic should beremoved from the reservoir sediment in from 15-25 years. If these rates arecorrect, then we might expect to see decreases in porewater/ground-waterarsenic data collected over that last 17 years as sediment concentrationsdecreased. However, the arsenic concentrations in the aquifer do not appearto be decreasing (see below). We expect that there must be another source ofarsenic: The continual addition of arsenic-contaminated sediment fromupstream.
The USGS has collected sediment load data for the Clark Fork River(Hornberger et al., 1997; Lambing, 1991) above and below the reservoir(Gages 12334550 & 12340500) and the Blackfoot River above the reservoir(Gage 12340000) from 1985 to 1995. These eleven years had roughlysimilar peak flows to those for the seventy years of record:vs. standard deviation), respectively. From 1985 to1990, sediment accumulated in the reservoir for five of the six yearssampled, ranging from 4,600 to 48,700 MT/year. Only during one year,1987, was sediment eroded from the reservoir, when the reservoir stage waslowered for repairs for several months (Udaloy, 1988). During this year,15,800 MT of sedimenteroded from the reservoir. Even with this removal anaverage of 14,800 MT of sediment per year was deposited in the reservoirfrom 1985 to 1990. Measurements from 1991 to 1995 found that an averageof 11,700 MT/y accumulated in the reservoir. This is likely a typical loadingrate over the last seventy years, however, there have been high flow eventsthat may have removed arsenic-rich sediment from reservoir. During 1997,peak flows were relatively high. There were only six other years with peakflows higher (including the estimated flood of record in 1908) in seventyyears of record. We monitored sediment and arsenic flux during this flowevent and found that only during approximately two weeks of the highestflow did the reservoir release more sediment than it received. Over the entireevent (March to late June), we estimate that about 6.8 MT of arsenicaccumulated in the reservoir (Shifflett, in preparation). Although sedimentflux has not been determined for the highest flow years, modeling usingHEC-6 for fifty-one years of flow records predicted an average yearlyaccumulation of 17,200 MT (EMC2, 2000; Titan, 1995). They foundsignificant erosion only at flows above which have occurred onlythree times during the seventy years of continuous record. The 100-year

12. Arsenic Contamination in the Water Supply of Milltown,Montana
347
recurrence interval flow showed large amounts of erosion in the HEC-6model runs, eroding 119,000 MT/y of sediment from the reservoir. However,this amount of sediment would be made up by deposition during only 7.4years of average flows. All these data show that Milltown Reservoir is amajor sink for sediment, and therefore, arsenic.
Because the USGS data are similar to the HEC-6 modeling and are actualdata rather than simulated data, we used it for calculating the flux of arsenicthrough the reservoir. Using an average concentration of 50 mg/Kg ofarsenic in the sediment coming into the reservoir from the Clark Fork River(data from Breuninger, 2000) and average 1985-90 data as one end memberand the average 1990-95 data for the other, we calculate that from 590 to 740MT of arsenic are added to the reservoir each year. Using the samepercentage of available arsenic as used above, about 25% of this wouldpossibly be available, or 148 to 185 MT/yr. This flux would be highlyvariable based on the USGS sediment flux data, but over the long term thereservoir is a sink for sediment-bound arsenic and prevents it from movingdownstream. This of course provides a continually replenished source forground water contamination originating from the reservoir sediments. Usingour estimates of flux out of the reservoir, we estimate that an additional "5 to7 years" of available arsenic are added to the reservoir each year. However,the disposition of this sediment within the reservoir is of primary importancein determining the long-term potential for arsenic contamination. Our fluxestimates found that 38% of the ground water and 96% of the arsenic load tothe adjacent aquifer comes from the lower section of the reservoir. However,the upper section of the reservoir likely accumulates more sediment than thelower section because of channel morphology and flow regime. Channels inthe upper reservoir are sinuous, shallow and braided with sloughs andbackwater areas common (Fig. 9) and therefore make excellent sedimenttraps. We would expect that concentrations in the lower reservoir shoulddecrease over time as arsenic is rapidly removed by ground water transportthrough the sediment. However, we would only need ca. 10% of the totalarsenic added to the reservoir each year to accumulate in the lower reservoirto maintain the yearly flux. Through time, we would expect the upperreservoir to play a more important role in supplying arsenic because it wouldcontinue to accumulate arsenic-contaminated sediment from upstream.
Although there have been hundreds of samples taken for chemicalanalyses at Milltown, there are very few long-term records comparing datafrom individual wells (Woessner, 1995). Woessner compared data from tenwells within the plume area and found that most concentrations increasedbetween 1983-84 and 1990-92. Data from three of those wells with thelargest number of samples (additional data from Titan, 1995) are plotted inFig. 10. Well 101B shows the strongest difference in arsenic concentrations

348 Chapter 12

12. Arsenic Contamination in the Water Supply of Milltown,Montana
349
between 1983-84 and 1990-92, with nearly complete separation of all datacollected. The median concentration changed from 746 to Themedian arsenic values in wells 107C also increase through time, from 361 to
but are less clearly separated when the variability of the data areconsidered (Fig. 10). Well 102B median values changed from 853 to 920
but these differences are likely not significant (Fig. 10). Unfortunately,there is very little long-term data from wells located farther down the plumewhere changes in plume size and concentration would be easiest to see. But,the long term data within the plume does show that arsenic concentrationsare increasing through time. This suggests that the geochemical andhydrogeologic mechanisms removing arsenic from the sediment andtransporting it to the adjacent ground water are dynamic.
6. WHAT WILL THE FUTURE BRING?
The concern by government agencies and the public over MilltownReservoir have moved well beyond ground water contamination. Potentialintegrity/safety of the dam, release of contaminated sediments downstream,effects on threatened fish species (bull trout), restricted fish passage,expansion of introduced fish species (northern pike), power generation andrecreational use, are all now driving decisions for remediation. Thediscussion now focuses more on the fate of metal-contaminated sedimentsthan on arsenic levels in ground water. The objectives of any remediation atthe site are now to eliminate the release of contaminated sedimentdownstream, protect aquatic life below the dam, and protect wetlandresources while considering power generation needs and recreational use(EMC2, 2000). The USEPA is considering a range of alternative remediationscenarios from total removal of the contaminated sediment and the dam tono action. It is assumed that under all these alternatives the effects on groundwater contamination will be positive or negligible and that the system isdefined well enough to predict outcomes (both in the surface water and theground water). To date, the work at Milltown has failed to resolve the keygeochemical and hydrologic processes responsible for arsenic and metaltransport and fate. We believe that there are major hydrogeologic andgeochemical questions that need answering before predictions of finaloutcomes of remedial actions can be made. Questions, such as: 1) What arethe geochemical processes controlling fixation of arsenic in the reservoir andwill they remain stable? (It is especially crucial to establish whetheroxyhydroxides or sulfides fix arsenic in the aquifer.) 2) What is the long-term fate of arsenic in the plume/aquifer? (The present records showincreases in arsenic concentrations and we need to know what controls these

350 Chapter 12
concentration changes and what we can expect after remediation.) 3) Howwill dam/sediment removal alter the ground water flow paths and thetransport of arsenic from the upper reservoir? (That area now supplies asmall proportion of the arsenic to the aquifer, but changed hydrologic andgeochemical regimes may alter arsenic release/flux from this area; it isimportant to know if this will become an substantial source for surface waterand ground water contamination.)
Beyond these and other technical questions, we also need to consider thepossibility that the geochemical and hydrogeologic system at Milltown (andsimilar sites) is so complex that we will be unable to make reliablepredictions, but only measure the response to our actions. In that case, weshould consider Milltown as a large field laboratory. Appropriately-scaledexperiments need to be conducted as remediation progresses to providefeedback into the remediation process. This "adaptive remediation" wouldbetter assure success as scientists and regulators continue to deal withcomplex systems like Milltown reservoir. The goal should not be just theremediation of one site to meet specific criteria, but a deep understanding ofprocess and function that can be applied to the restoration of contaminatedaquatic systems anywhere in the world.

Chapter 13
Natural Remediation Potential of Arsenic-Contaminated Ground Water
Kenneth G. Stollenwerk and John A. ColmanU.S. Geological Survey
Migration of leachate from a municipal landfill in Saco, Maine has resulted inarsenic concentrations in ground water as high as Laboratoryexperimental data indicate the primary source of arsenic to be reductivedissolution of arsenic-enriched iron oxyhydroxides in the aquifer by organiccarbon in landfill leachate. A core from an uncontaminated part of the aquiferyielded no dissolved iron or arsenic when leached with oxic ground water.Eluent ground water spiked with organic carbon in order to create reducingconditions mobilized both ferrous iron and arsenite from this core. The landfillwas capped in early 1998 to eliminate the source of leachate. Cores from thecontaminated portion of the aquifer were collected and leached withuncontaminated ground water in the laboratory to simulate natural remediationconditions. Data from these experiments show that significant concentrationsof labile organic carbon have accumulated on aquifer solids, causingsignificant biological oxygen demand. In laboratory leaching experiments ofthe most contaminated core, the organic carbon caused complete consumptionof the influent dissolved oxygen (6 mg/L) for 220 pore volumes. Arsenicleaching from contaminated cores rapidly decreased in concentration initiallyin response to flushing with uncontaminated ground water. Subsequentleaching produced more gradual decreases in dissolved arsenic concentrations,controlled by a combination of reductive dissolution of arsenic-enriched ironoxyhydroxides and adsorption/desorption. In leachate from the mostcontaminated core, arsenic concentrations exceeded the new United StatesEnvironmental Protection Agency drinking-water standard of formore than 200 pore volumes. A geochemical model simulated theconcentration of selected constituents as uncontaminated ground water elutedthrough contaminated aquifer solids. Concentrations of dissolved oxygen,arsenic, and iron, in leachate from one core were used to calibrate the model.This model was validated by successfully simulating constituentconcentrations in leachate from cores collected from other contaminated areasof this aquifer.

352 Chapter 13
INTRODUCTION1.
Concentrations of arsenic (As) that exceed the new Federal drinking-water standard of (U.S. Environmental Protection Agency, 2001)are a common problem in New England water supply wells (Zuena andKeane, 1985). Peters et al. (1999) reported As concentrations as high as 180
in water from domestic wells in New Hampshire that were completedin bedrock. They found an association between high As concentrations inground water and pegamatite dikes in granitic bedrock. Ayotte et al. (1999)observed that there was a correlation between concentrations of As greaterthan in water from domestic bedrock wells in eastern New Englandand calcareous metasedimentary rocks. In both of these studies the source ofAs appears to be from weathering of bedrock and not from anthropogeniccontamination. Anthropogenic induced changes in ground water chemistryare also suspected to have caused high As concentrations in some areas ofNew England. Arsenic concentrations as high as have beenmeasured in ground water associated with plumes of leachate from manylandfills in contact with bedrock in New England (Edward Hathaway,Remedial Project Manager, U.S. Environmental Protection Agency, oralcommun., 1997). The As appears to have been mobilized from aquifer solidsby leachate from these landfills.
The aqueous chemistry of As can be complex. Arsenic is stable in fouroxidation states (+5, +3, 0, -3) under Eh conditions prevalent in aqueoussystems (Ferguson and Gavis, 1972). Arsenic metal rarely occurs and the -3oxidation state is found only in very reducing environments. Arsenate[As(V)] is stable in oxidizing environments. For pH values common ingound water, the predominate As(V) species in solution arebetween pH 2.2 and 6.9, and between pH 6.9 and 11.5. Arsenite[As(III)] is stable in moderately reducing environments;predominates up to pH 9.2, and from pH 9.2-12 (Ferguson andGavis, 1972). If conditions are favorable, biomethylation can form a varietyof methylated species that are stable under oxidizing or reducing conditions.The more common methylated species include: methylarsonic acid
dimethylarsinic acid methylarsonousacid and dimethylarsinous acid (Bramanand Foreback, 1973; Cullen and Reimer, 1989; National Research Council,1999). In sulfidic solutions, thioarsenic species such as and
can form (Clarke and Helz, 2000; Helz et al., 1995).The oxidation state of As has a significant effect on its rate of transport in
ground water, with As(V) adsorbing to a greater extent than As(III) at lowerpH values and As(III) adsorbing to a greater extent than As(V) at higher pHvalues (Bowell, 1994; Manning et al., 1998; Pierce and Moore, 1982; Raven

13. Natural Remediation Potential of Arsenic-Contaminated GroundWater
353
et al., 1998). Relatively low concentrations of As in ground water that resultfrom weathering of geologic materials can become concentrated viaadsorption onto various mineral phases including iron (Fe), aluminum (Al),and manganese (Mn) oxyhydroxides, and clay minerals (Anderson et al.,1976; Lin and Puls, 2000; Oscarson et al., 1983; Pierce and Moore, 1982).Changes in pH or the concentration of competing ions can result indesorption of As (Darland and Inskeep, 1997; Fuller and Davis, 1989;Schlottmann and Breit, 1992). A change from an oxidizing to a reducingenvironment can cause reduction of Fe oxyhydroxides and release ofadsorbed As to ground water (Nimick, 1998; Panno et al., 1994).
Recent experimental observations suggest that bicarbonate canfacilitate mobilization of As from As-containing sulfides such as orpiment
in both oxic and anoxic environments (Kim et al., 2000).Mobilization of As was facilitated by increasing concentrations andpH. The authors found that As was not significantly leached from aquifersolids when was 305 mg/L and pH was 7.4. Increasing to 1200mg/L at pH 8.5 resulted in leaching of 1.5% of the As from the aquifer sol-ids; for 36,000 mg/L at pH 8.5, 14.8% of the As was leached from theaquifer solids.
This chapter presents results of an investigation of As contamination ofground water at the Saco Municipal Landfill Superfund Site, Saco, Maine.The source of As was investigated as well as the potential for naturalremediation of selected constituents in contaminated ground water followingclosure of the landfill.
2. SITE DESCRIPTION
The Saco Municipal Landfill (Fig. 1) was operated from the early 1960’sto 1989 and consists of three separate landfill areas (Nielsen et al., 1995).Landfill Areas 1 and 2 (not shown on Fig. 1) are located on the east side ofSandy Brook and have been capped with clay since 1976 and 1989. Areas 1and 2 are underlain by a fine sand facies of distal marine fan deposits 1.5 to6 m thick (Colman and Lyford, submitted). Beneath the sand areglaciomarine silt and clay deposits 7.5 to 45 m thick. Arsenic concentrationsin ground water that has been contaminated by leachate from both of theselandfills are low (average (Woodard andCurran, 1998). Area 4 (formerly 3 and 4) is on the west side of Sandy Brook.This landfill has been inactive since 1989 and was covered with animpermeable membrane in 1998. The geology of Area 4 is distinctlydifferent from Areas 1 and 2. Area 4 is underlain by gravel and till-like

354 Chapter 13
facies of glaciomarine fan deposits 0 to 11 m thick. Bedrock underlies thesurficial deposits and in places directly underlies the landfill. The bedrock isa fine- grained hornfels consisting of thinly-layered, calcareous, quartz-muscovite phyllite locally interlayered with thin beds of micaceous quartzite.Ground water beneath and downgradient from Area 4, which is the focus ofthis investigation, contains As concentrations as high as (average =

13. Natural Remediation Potential of Arsenic-Contaminated GroundWater
355
n=12, range The plume of contaminated groundwater from Area 4 discharges to Sandy Brook (Fig. 1).
Leachate from the Area 4 landfill has contaminated surficial alluviumand the upper part of the bedrock aquifer at the Saco site (Fig. 2).Contaminated ground water contains greater concentrations of dissolvedsolids than uncontaminated ground water from either the bedrock oralluvium (Table 1). Organic carbon from the landfill has caused reducingconditions in the aquifer as indicated by low concentrations of dissolvedoxygen and high concentrations of dissolved organic carbon (DOC), Fe,Mn, and ammonia Sulfate reducing conditions may be presentin the immediate vicinity of the landfill; however, no sulfide species weremeasured in any of the ground water samples (detection limit = 0.1 mg/L). Itis possible that any sulfides that formed were scavenged throughprecipitation of iron sulfides; however, iron sulfides were not analyzed for incore material. High concentrations of dissolved Fe and Mn indicate thatreduction of the oxyhydroxide phases of these elements by organic carbondominate the redox potential in contaminated areas of the aquifer sampledduring this study.
High concentrations of As are generally associated with ground watercontaminated by leachate from the landfill (Table 1). Arsenic concentrationsin uncontaminated ground water from bedrock and alluvial wells near thelandfill were Ground-water samples collected for As speciationwere filtered in-line through a filter and quick frozen in liquidnitrogen (Colman and Lyford, submitted). About 80% (range = 64-94%,n=9) of the total dissolved As in contaminated ground water was As(III), theremainder was As(V). However, the 20% As(V) may have been a result ofanalytical error associated with warming of the samples in an oxygenenvironment prior to analysis (Colman and Lyford, submitted). Seven of thenine contaminated ground water samples had concentrations below thefield detection level of 0.05 mg/L. The other two samples hadconcentrations of 0.10 and 0.15 mg/L. Dissolved organic carbonconcentrations were much greater in contaminated ground water than inuncontaminated ground water. Given these ground water chemistries,geochemical modeling indicates that all As should have been As(III).Methylated species of As were not detected.
In general, As in landfill leachate is found in very low concentrations(Christensen et al., 2001). The source of As at the Area 4 site could be wastedeposited in the landfill or the geologic materials on which waste wasdeposited. No wells were drilled within the Area 4 landfill; therefore, itspotential as a source of As could not be determined. Samples representativeof geologic formations from both sides of Sandy Brook were collected from

356 Chapter 13
areas outside the contaminated ground water plumes and anlyzed for total Asand Fe. Hydroxylamine hydrochloride extractions were alsoused to assess the leachable As and Fe associated with non-crystalline Feoxyhydroxides (Colman and Lyford, submitted). Their results show muchgreater concentrations of As in the geologic formations associated with Area4 than Areas 1 and 2. Whole rock As concentrations in the unconsolidateddeposits east of Sandy Brook (representative of material underlying Areas 1and 2) contained 3.0 to As. The leachable fractioncontained 0.2 to As. Unconsolidated sediments west of Sandy

13. Natural Remediation Potential of Arsenic-Contaminated GroundWater
357
Brook (representative of material underlying Area 4) had whole rock Asconcentrations ranging from 6.8 to and the leachablefraction had As concentrations from 0.7 to Bedrock west of SandyBrook had whole rock As concentrations ranging from 8.5 to and
leachable concentrations from 0.2 to (Colman andLyford, submitted). We hypothesize that prior to landfill construction,naturally occurring As in ground water was adsorbed by Fe and possibly Aloxyhydroxides, coating the bedrock fractures and surfaces of alluvial grains.

358 Chapter 13
Migration of organic carbon from the landfill is thought to have causedreductive dissolution of Fe oxyhydroxides, releasing As to ground water.
After Area 4 was covered in 1998, natural dewatering of the landfill wasestimated to take about two years. Pre-landfill ground-water-flow conditionswere expected to become reestablished and contaminants removed asuncontaminated ground water from upgradient flowed through the aquifer.The primary objective of this study was to assess the rate of naturalremediation of the aquifer with respect to As. A second objective was todetermine if aquifer solids could be the primary source of As in the landfillplume beneath and downgradient from Area 4.
3. METHODS
3.1 Experimental
Remediation experiments3.1.1
Cores were collected from contaminated areas in the aquiferdowngradient of Area 4 (Figs. 1 and 2) and leached with uncontaminatedground water to estimate the volume of water needed to decrease Asconcentrations to acceptable levels. The cores were collected in aluminumcore barrels and immediately frozen with dry ice for transport to thelaboratory where they were stored in a freezer maintained at minus 20°Cuntil needed for experiments. Cores were 4.6-cm inside diameter and rangedin length from 28 to 61 cm. Breakthrough curves for selected constituentsfrom two of the contaminated cores are shown in this paper. Both cores werecollected from the alluvial glaciomarine fan deposits and consist of fine sandand silt. The first core is from site MW97-13S1 at a depth of about 7 mbelow land surface, just below the water table; the second core is from nearthe glaciomarine fan/bedrock contact at site MW97-13S2 at a depth of 10 mbelow land surface (Fig. 2).
For each leaching experiment, a core was removed from the freezer andthe plastic caps on each end of the core were replaced with thick-walledrubber caps containing inlet and outlet ports and a 2-mm-thick porous disk toensure an even flow of eluent across the core surface. Nylon-mesh filterdisks were placed inside each cap to contain the aquifer solids. The core wasallowed to thaw for three days and reach room temperature (~22°C) prior toleaching.

13. Natural Remediation Potential of Arsenic-Contaminated GroundWater
359
A peristaltic pump was used to move uncontaminated ground waterthrough the cores at an average velocity of 0.2 m/d, the average velocity ofground-water flow in the aquifer. Uncontaminated ground water (Table 2)was synthesized in the laboratory and is an average of the ground-watercomposition from four wells in an area that was uncontaminated by thelandfill. The experimental apparatus was too large to fit in a glove box;therefore, it was necessary to collect samples manually in order to maintainan oxygen-free environment. Leachate from cores was transferred to asample collection bottle through Teflon tubing to minimize oxygencontamination. (Use of brand names in this chapter is for identificationpurposes only and does not constitute endorsement by the U.S. GeologicalSurvey.) Collection bottles were 60-mL high density polyethylene bottles formost constituents and 125 mL amber glass bottles for DOC analysis.Leachate samples that were to be analyzed for redox-sensitive constituentswere collected manually under an oxygen free, nitrogen atmosphere. Duringthe early phase of the experiments, all leachate was collected and analyzed tocapture rapid changes in chemistry. Therefore, samples were collected onlyduring the day; flow through the cores was stopped overnight. To maintainan average velocity of 0.2 m/d, cores were leached at 0.8 m/d during the day.After the rate of change in concentrations of leachate constituents becamesmall, cores were leached at a constant flow rate of 0.2 m/d, 24 hours a day.During the day, samples were collected as described above. At night theeffluent was routed to waste. The total volume of leachate and the massbalance of constituents were tracked throughout the experiments.Concentrations in the leachate routed to waste were interpolated fromconcentrations determined during manual collection.
Samples were analyzed immediately after collection for[Fe(III)], nitrite nitrate and specificconductance. Dissolved organic carbon samples were stored at 4°C andgenerally analyzed within one week. Aliquots for As(III), As(V) andphosphate [(P(V)] were acidified to pH 2 with ultrapure hydrochloric acid(HCl) and stored in 30-mL polyethylene bottles until analyzed. Periodicanalyses of unacidified samples immediately after collection verified thatacidification with ultrapure HCl had no effect on the oxidation state of As.Samples were also collected for cation analysis and acidified with HCl.Samples for anion analysis were acidified with nitric acid
3.1.2
An experiment was conducted to evaluate the potential for mobilizationof As from uncontaminated aquifer solids as a result of reduction of Fe
Iron reduction core experiment

Chapter 13360
oxyhydroxides by organic carbon. A core from site MW97-16S in the tillnear Area 4 (Fig. 1) that had not been affected by the leachate plume wascollected and prepared as described in the previous section. Uncontaminatedground water containing sucrose (120 mg/L DOC) was eluted through thecore at 0.2 m/d. The intent was to establish anoxic conditions in the core inorder to initiate reductive dissolution of Fe oxyhydroxide, releasing anyassociated As. Leachate samples were collected as described in the previoussection.
3.2 Analytical
As(III), As(V), P(V)3.2.1
A modified phosphomolybdate method was used to determine As(III),As(V) and P(V) in the laboratory experiments (Johnson, 1971; Murphy and

13. Natural Remediation Potential of Arsenic-Contaminated GroundWater
361
Riley, 1962; Oscarson et al., 1980; Strickland and Parson, 1968). Thismethod is based on the spectrophotometric measurement of the blue As(V)and P(V) molybdate complexes. Phosphate is measured in one sample afterreducing As(V) to As(III), which does not form the color complex. In asecond sample, both P(V) and As(V) are measured and the As(V) concen-tration determined by subtracting the P(V) concentration. A third sample isoxidized to convert As(III) to As(V), and the As(III) concentration obtainedby subtracting As(V) and P(V).
The limit of detection for As(III) and As(V) with this technique iswith an error of ± 70% at the 95% confidence interval. Concentrationsbetween 3 and have an error of ± 40% at the 95% confidenceinterval. Concentrations between 10 and have an error of ± 15% atthe 95% confidence interval, and concentrations greater than havean error of ± 10% at the 95% confidence interval. Error estimates weredetermined for 15 different concentrations ranging from toThere were 15 replicates at each concentration. Periodic analyses of replicatesamples for total As by ICP were within the confidence intervals statedabove.
Ground water samples collected from the aquifer were analyzed for totalinorganic As and As(III), and methylated As species by a combination ofhydride generation, gas chromatography, and atomic absorptionspectroscopy (Crecelius et al., 1986). Inorganic As(V) was determined bydifference between total inorganic As and As(III).
3.2.2 Other solutes
Dissolved oxygen, Fe(II), Fe(III), and were measuredusing the colorimetric CHEMets™ method. This method uses glassampoules sealed under a vacuum containing an appropriate reagent. The tipof the ampoule is snapped off while immersed in the sample. A fixed amountof sample is drawn into the ampoule where the solute reacts with the reagent,forming a color complex. The intensity of color is measured with aphotometer for and by visual comparison with standards of a knownconcentration for the other solutes. The specific methods used for eachanalyte are described in the product catalog (CHEMetrics, 1998).
Solution pH was measured with a Ross combination electrode and Orionmodel 601A pH meter. Specific conductance was measured with a YellowSprings Instruments model 32 conductance meter and cell. Cations weredetermined by inductively coupled atomic-emission spectroscopy. Sulfateand chloride were determined by ion chromatography. Bicarbonate wasdetermined by titration with to pH 4.5.

Chapter 13362
3.3 Computer Model
The one-dimensional reaction-transport model PHREEQC version 2(Parkhurst and Appelo, 1999) was used to simulate chemical changes,resulting from elution of ground water through the cores. PHREEQC has thecapability to model advective transport of water in combination with avariety of chemical reactions including homogeneous aqueous reactions,mineral equilibria, and surface-complexation reactions. Version 2 ofPHREEQC has added capabilities to simulate kinetic reactions.
3.4
The composition of pore waters from contaminated cores 1 and 2 wereused to initialize the model (Table 2). Concentrations represent leachatecollected from the initial half pore volume of each core. Eluent specified inthe transport simulations had the composition of uncontaminated groundwater in Table 2. Reactions proposed to describe concentration changes forselected constituents within the cores are based on comparisons betweeneluent and leachate chemistry and analysis of selected constituents in thecore samples. Equilibrium constants and kinetic rates for the reactions wereadjusted to give the best fit to leachate concentrations from core 1. The samereactions, equilibrium constants, and kinetic rates were then tested bymodeling the concentrations of constituents in leachate from core 2. Thisgeochemical model will be used in the future to simulate evolution ofcontaminated ground water associated with the Area 4 landfill at the aquiferscale.
Reactions included in the geochemical model were those that had themost significant impact on As concentrations in the core experiments. Theprimary biogeochemical reaction in the cores is oxidation of organic carbonby a succession of electron acceptors: Sulfideconcentrations in ground water were below the detection level of 0.1 mg/L,indicating the absence of any significant sulfate reduction. Theoretically,after reduction of Mn oxyhydroxides should be reduced prior to Feoxyhydroxides. In reality, both Mn and Fe were measured in core leachateindicating simultaneous reduction of both solid phases. Because of thedifficulty in fitting rate constants for both reactions to the experimental data,reduction of Mn oxyhydroxides was excluded from the geochemical model.The resulting impact on As concentrations was considered to be negligiblebecause Fe oxyhydroxides generally have a greater capacity for Asadsorption than do Mn oxyhydroxides (Stollenwerk, this volume). Also, Feoxyhydroxide concentrations in these aquifer solids were about 16 timesgreater than Mn oxyhydroxides (Colman and Lyford, submitted). Reduction
Geochemical Model

13. Natural Remediation Potential of Arsenic-Contaminated GroundWater
363
of Mn oxyhydroxides was considered in calculating the concentration ofreactive organic carbon for the geochemical model (discussed later).
Reduction of by organic carbon was modeled according to:
In reality, the organic compounds are more complex; however,information on the composition of the organic phase was not collected. Therate of reduction represented by reaction 1 was modeled using Monodkinetics:
The maximum rate constant for decay of organic carbon by was2.0e-07 1/s. When concentrations decreased below Feoxyhydroxides became the dominant electron acceptor according to:
Decay of organic carbon by was modeled at a constant rate of6.7e-09 1/s.
Arsenic was modeled using a combination of adsorption on andreductive dissolution of a separate, modified solid phase with afixed concentration of As. Although Fe oxyhydroxide is represented as
in reaction 3, the actual formula for this solid phase in thegeochemical model is This As/Fe ratio is based on resultsfrom the Fe reduction core experiment which is discussed later.
A diffuse layer surface-complexation model was used to modeladsorption of As. Two different types of sites were used;represents the total concentration of surface complexation sites, which wereused to model adsorption/desorption of
These sites act as a buffer for pH control. Equilibrium constants for bothreactions were obtained from Dzombak and Morel (1990). Thefor reaction 4 is 7.29; the for reaction 5 is -8.93.
A subset of sites were used to model adsorption of Asspecies:

364 Chapter 13
For the pH values of leachate in these experiments (6.5 to 7.5), the As(V)species in reactions 6 and 7 predominate. Arsenate concentrations werebelow detection limits throughout the experiments; however, after reactiveorganic carbon concentrations in the core decreased to the level wherereduction of was incomplete, geochemical modeling predicted oxidationof As(III) to As(V). Because As(V) was not detected in core effluent, it wasnot possible to derive equilibrium constants for these adsorption reactions onthis core material, and the equilibrium constants listed in Dzombak andMorel (1990) were used in the model. For reaction 6, the was23.51 and for reaction 7, the was 10.58. Arsenite adsorption wasmodeled by:
The species predominates for the pH range of theseexperiments. The equilibrium constant, Log was obtained byfitting the As(III) data in leachate from core 1. This constant is greater thanthe Log K of 5.41 reported by Dzombak and Morel (1990) for adsorption ofAs(III) by x-ray amorphous Fe oxyhydroxide (ferrihydrite).
Phosphate was present in leachate from the cores and likely competeswith As for adsorption sites. The concentration of P(V) in the pore water andfirst 25 pore volumes of effluent from core 1 was 0.3 mg/L, graduallydecreasing to about 0.05 mg/L by the end of the experiment. Phosphate inthe pore water and first 30 pore volumes of core 2 was 0.1 mg/L, graduallydecreasing to about 0.02 mg/L by the end of the experiment. The effects ofP(V) on adsorption of As, as well as other potential competing species suchas and were not included in the geochemical model toreduce its complexity. Any effect that these species might have on Asadsorption was included in the Log K for As(III) that was fit to the experi-mental data. The same holds true for potential effects of cations.
A summary of the parameters used in the model is provided in Table 3.Dispersivity was determined from breakthrough of nonreactive bromide.Input for PHREEQC requires units of mass per liter of solution. Therefore,concentrations that were directly measured in the solid phase including themass of solids, and concentrations of and reactive organic

36513. Natural Remediation Potential of Arsenic-Contaminated GroundWater
carbon, were converted using a measured porosity of 0.4 and an assumedsolid density of
The concentration of was estimated to be 0.05 mol/L,about 20% of the average Fe concentration measured in theleaches. The As/Fe ratio was calculated from the Fe reduction coreexperimental data. Adsorption reactions were assumed to occur on a separateFe oxyhydroxide phase. Surface site concentrations were based on data fromDzombak and Morel (1990). They estimated the total concentration ofsurface sites for ferrihydrite as 0.205 mol/mol Fe. However, aquifer solidsgenerally contain Fe oxyhydroxides such as goethite that have a smalleradsorption capacity than ferrihydrite. For example, Sun and Doner (1998)measured about 40% less adsorption of As(III) and As(V) by goethite thanferrihydrite. The concentration of sites used to model As adsorption in ourexperiments was used as a fitting parameter. We chose a total surface siteconcentration for cores 1 and 2 that was half of the concentration suggestedby Dzombak and Morel (1990).
The concentrations of reactive organic carbon for the model were 20% ofthe total organic carbon measured in the cores. This percentage was

366 Chapter 13
calculated from the measured amount of Fe(III) and Mn(IV) reducedduring the core 1 experiment.
4. RESULTS
4.1 Iron Reduction Core Experiment
The purpose of this experiment was to test the hypothesis that As inground water that has been contaminated by leachate from the landfill couldbe a result of reductive dissolution of an As-enriched Fe oxyhydroxidephase. An alluvial core consisting of fine sand and silt (MW95-16S, Fig. 1)uncontaminated by landfill leachate was used. Uncontaminated ground water(Table 2) was spiked with 120 mg/L DOC in the form of sucroseand eluted through the core. In this experiment, about 8 pore volumes wererequired to establish a sufficient bacterial population to completely reduce
in the eluent and initiate reductive dissolution of Fe oxyhydroxide.Ferrous iron was first detected in pore volume 8, and As(III) in pore volume10 (Figs. 3a-3b). Concentrations of both As(III) and Fe(II) rapidly increaseduntil about pore volume 50. After pore volume 50, there was considerablevariability in the concentrations of both As(III) and Fe(II)(30-60 mg/L); however, the average concentrations of As(III) (about 200
and Fe(II) (about 45 mg/L) were relatively constant between porevolume 50 and 160. The large range in concentrations of As(III) and Fe(II)after pore volume 50 was a result of the effect of different velocities on thereductive dissolution of Fe oxyhydroxide. During periods of no flow, theeluent had more time to equilibrate with the solid phases; the initial porevolume that eluted upon resumption of flow contained high concentrationsof As(III) and Fe(II). During periods of continuous flow, there was less timefor reaction and concentrations decreased, usually approaching steady statefor a particular flow rate. By pore volume 160, flow through the core becameimpeded to the extent that water could no longer be eluted through the core,presumably because accumulation of bacterial biomass and reaction by-products occluded porosity. Examination of the core material after theexperiment was stopped revealed significant amounts of black materialcoating the grains. Geochemical modeling indicated supersaturation withrespect to siderite; therefore, precipitation of an iron carbonate phase couldalso have contributed to blockage of flow through the core.
The concentrations of As(III) and Fe(II) in leachate from this experimentwere simulated with the same geochemical model calibrated to the data fromcore 1 (discussed in a later section). The rate constant used to model

13. Natural Remediation Potential of Arsenic-Contaminated GroundWater
367
368 Chapter 13
reduction of in core 1 did not account for the timerequired to establish a bacterial colony; therefore, the model predicted anearlier increase in Fe(II) concentrations than was observed (Fig. 3b). Aftersteady-state concentrations were reached at about pore volume 50, the modelunderpredicted average Fe(II) concentrations by about 8 mg/L. Transport ofAs(III) through the core was mediated by adsorption/desorption reactions.The model predicted greater adsorption of As(III) during the first 50 porevolumes than was observed (Fig. 3a). However, the model did simulate theaverage As(III) concentrations after pore volume 50.
There was a correlation between As(III) and Fe(II) concentrations in thisexperiment (correlation coefficient of 0.79; Fig. 4), indicating an associationbetween As and Fe oxyhydroxides. The average As/Fe ratio was 0.67%when converted to a weight basis (0.5% based on molar concentrations).This ratio is about 7 times greater than the average measured by Colman andLyford (submitted) in their extractions of uncontaminatedaquifer solids. Their results measured As/Fe ratios, on a weight basis, rang-ing from 0.008-0.29% (average 0.095%, n=18). The differences in As/Feratios between these two studies could be a result of differences in the initialratios of As/Fe, and/or the dissolution procedure. In addition todissolving the As-enriched fraction, extractions also mighthave dissolved Fe oxyhydroxides that had much lower concentrations of As.Readsorption of As during the extractions was evaluated byadding a known concentration of As to replicates for about 20% of the coresamples. Complete recovery of all added As indicated no readsorptionduring the extraction procedure.
The higher As/Fe ratio in the Fe reduction core experiment also couldhave been caused by precipitation of siderite within the core.Bicarbonate concentrations were not measured in core leachate; however,geochemical modeling indicated that pore water should have beensupersaturated with respect to based on the amount of organic carbonthat had to be oxidized to produce the observed Fe(II) concentrations inleachate. Precipitation of siderite was not modeled. The As/Fe ratio from theFe reduction experiment was used in the geochemical model rather than thelower ratios from the extractions because geochemicalconditions in the core experiment were more likely to be representative ofthose occurring in the aquifer.
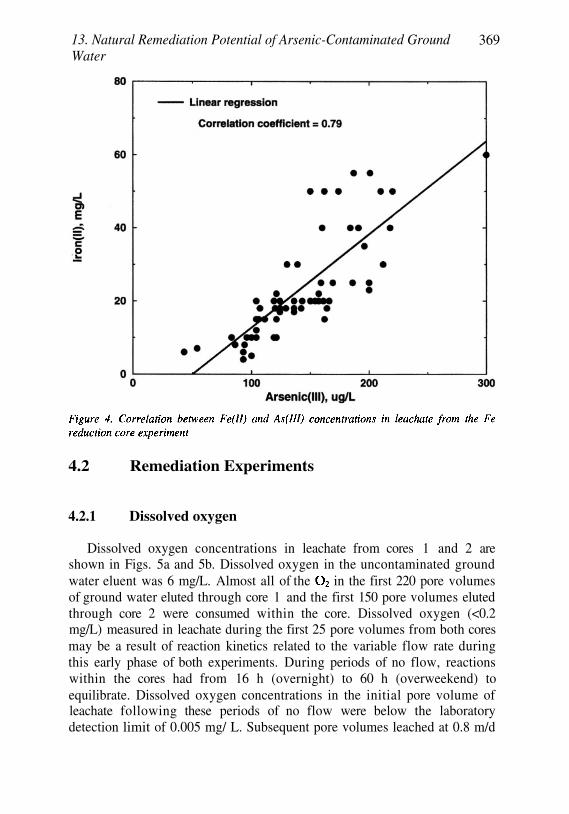
4.2 Remediation Experiments
4.2.1 Dissolved oxygen
Dissolved oxygen concentrations in leachate from cores 1 and 2 areshown in Figs. 5a and 5b. Dissolved oxygen in the uncontaminated groundwater eluent was 6 mg/L. Almost all of the in the first 220 pore volumesof ground water eluted through core 1 and the first 150 pore volumes elutedthrough core 2 were consumed within the core. Dissolved oxygen (<0.2mg/L) measured in leachate during the first 25 pore volumes from both coresmay be a result of reaction kinetics related to the variable flow rate duringthis early phase of both experiments. During periods of no flow, reactionswithin the cores had from 16 h (overnight) to 60 h (overweekend) toequilibrate. Dissolved oxygen concentrations in the initial pore volume ofleachate following these periods of no flow were below the laboratorydetection limit of 0.005 mg/ L. Subsequent pore volumes leached at 0.8 m/d
13. Natural Remediation Potential of Arsenic-Contaminated GroundWater
369

Chapter 13370

13. Natural Remediation Potential of Arsenic-Contaminated GroundWater
371
resulted in insufficient time for complete reaction and was detected inleachate. After a constant steady-state velocity of 0.2 m/d was established,
concentrations in leachate remained below the detection limit untilbegan to break-through at about pore volume 220 for core 1 and pore volume150 for core 2. The earlier breakthrough of from core 2 than from core 1is indicative of the lower concentration of reactive organic carbon in core 2.
The most plausible explanation for loss of oxygen in the eluent groundwater is reduction by organic carbon. Core 1 contained 0.08 mol/kg totalorganic carbon and core 2 contained 0.05 mol/kg total organic carbon.Whether the reaction between and organic carbon occurred in the solidphase or in solution could not be determined; however, DOC was detected inleachate throughout the experiment (Fig. 6). Initial pore water DOCconcentrations were 45 mg/L in core 1 and 31 mg/L in core 2 (not plotted inFig. 6). Concentrations in leachate from both cores rapidly decreased to lessthan 1 mg/L within 20 pore volumes; DOC concentrations then graduallydecreased to about 0.1 mg/L by the end of the experiments.

372 Chapter 13
Reduction of by organic carbon according to reaction 1 producesmost of which dissociates to and at the pH values of these
experiments (between 6.5 and 7.5). Therefore, evidence for reaction 1 can beinferred from leachate concentrations. The stoichiometry of reaction1 indicates that one mole of should be produced for every mole ofthat is reduced. Thus, reduction of 6 mg/L in the eluent should produceabout 11 mg/L Reduction of Fe and Mn oxyhydroxides (discussedlater) would have produced an additional 3 mg/L of In addition,dissolution of carbonate minerals in the cores could also have contributed
to solution. Geochemical modeling indicates that siderite wassupersaturated in the pore water of both cores (saturation index = 1.4 forcore 1 and 2.3 for core 2), an indication that could have been presentin both cores prior to the start of the experiments. Calcite was undersaturatedin core 1 (saturation index = -0.91), but was supersaturated in core 2(saturation index = 0.93).
Bicarbonate in the initial pore water of core 1 was 630 mg/L, and thepore water of core 2 contained 1240 mg/L Eluent was 30mg/L. Concentrations rapidly decreased to less than 100 mg/L within thefirst 10 pore volumes (Fig. 7). Between pore volumes 10 and 90,decreased from 100 mg/L to about 60 mg/L. These concentrations aregreater than can be accounted for by oxidation of organic carbon byFe(III), and Mn(III,IV) and indicate an additional contribution, likely fromdissolution of carbonate minerals and/or desorption of After porevolume 90, concentrations remained relatively constant between 43mg/L and 50 mg/L. These concentrations are close to what would beexpected when adding the eluent (30 mg/L) to the producedfrom reduction of (11 mg/L), and Fe and Mn oxyhydroxides (3 mg/L).Although this explanation simplifies the combination of reactions that mostlikely were occurring in the cores, it supports reduction by organiccarbon.
An estimate of the concentration of reactive organic carbon in each corewas determined for the geochemical model. This concentration (20% of thetotal organic carbon in the cores) was based on the amount required toreduce in core 1 (about 15%), the amount required to reduce Fe and Mnoxyhydroxides in core 1 (about 3%), plus an additional 2% that was includedto account for the fact that reduction was continuing when theexperiments were stopped. The concentration of reactive organic carbonused in the model was 0.016 mol/kg (0.06 mol/L) for core 1 and 0.01 mol/kg(0.038 mol/L) for core 2. These results indicate that measurements of totalorganic carbon alone do not provide sufficient information for predicting thereducing capacity of aquifer solids contaminated by organic matter. It is the

13. Natural Remediation Potential of Arsenic-Contaminated GroundWater
373
reactive fraction of the organic carbon that is an important indicator of thepersistence of reducing conditions.
The maximum rate that organic carbon reacted with oxygen (2.0e-07 1/s)was determined by fitting the rate constant to the concentrations inleachate from core 1 (Fig. 5a). The model used a constant velocity of 0.2 m/dwhich did not account for the velocity fluctuations during the first 25 porevolumes. Therefore, the concentrations measured in leachate during thefirst 25 pore volumes were not simulated. The same rate constant was thenused to simulate in leachate from core 2 (Fig. 5b). The model suc-cessfully simulated the observed breakthrough of at pore volume 150.
These results are derived from only two cores in the contaminatedaquifer; the nature of breakthrough curves for from other parts of theaquifer might differ depending on the reactivity and amount of organiccarbon. However, the results do indicate that, given a reasonable estimate ofreactive organic carbon (with respect to redox reactions), it should bepossible to model the persistence of reducing conditions after the source ofcontamination has stopped.

374 Chapter 13
4.2.2 Iron
Total dissolved Fe concentrations in ground water contaminated by Area4 leachate were much greater than dissolved Fe in uncontaminated ground-water (Table 1). Speciation of Fe in these ground water samples was notdetermined; however, geochemical modeling indicated that the majority(>99%) of Fe was in the ferrous oxidation state. Although some of this Femight have originated in the landfill, most appears to result from thereduction of Fe oxyhydroxides in the aquifer by organic carbon. In waterfrom seven of the eight wells with high concentrations of dissolved Fe,concentrations were below the field detection limit of 0.05 mg/L, Dissolved
in water from the other well was 0.15 mg/L. Dissolved Mn concentrationsin water from these wells were also significantly greater than inuncontaminated ground water (Table 1), an indication of reductivedissolution of Mn oxyhydroxides.
The concentration of Fe in pore water from core 1 was 50 mg/L, and theconcentration in pore water from core 2 was 32 mg/L (Table 2). Chemicalanalyses measured only Fe(II); Fe(III) was below the detection limit. Theconcentration of Fe(II) in leachate from the contaminated cores rapidlydecreased as Fe-free uncontaminated ground water displaced thecontaminated pore water (Figs. 8a-8b). Within a few pore volumes, Fe(II)concentrations were less than 5 mg/L. For the remainder of the experiments,Fe(II) concentrations decreased at a much slower rate. The lowconcentrations (<5 mg/L) measured in the first 25 pore volumes of leachatecoincided with higher flow velocities and measurable concentrations.Based on the mass of Fe(II) in leachate from core 1, the concentration ofreactive organic carbon necessary to reduce Fe(III) to Fe(II) was about 2%of the total organic carbon.
Adsorption/desorption could have affected Fe(II) concentrations inleachate from both columns; however, adsorption reactions involving Fe(II)were not considered in the geochemical model. Separation of the effects ofadsorption on aqueous Fe(II) concentrations from reductive dissolution of Feoxyhydroxides was not possible given the data collected during theseexperiments. Therefore, iron concentrations were only modeled withreaction 3, reduction of by organic carbon.

13. Natural Remediation Potential of Arsenic-Contaminated GroundWater
375

376 Chapter 13
Data from the Fe reduction experiment were used to define the Asconcentration of The PHASES data block of the input file forPHREEQC redefined according to the following reaction:
Ferrous iron concentrations decreased to below detection in leachate fromboth cores at the approximate pore volume that began to be detected inleachate. The modeled Fe(II) concentrations in leachate from core 1 (Fig. 8a)were obtained by fitting the rate constant for reaction 3 [using
and the Log K for reaction 8 to the experimental data.When concentrations in the cores had decreased to less thanreduction of As-enriched Fe oxyhydroxide was initiated at a rate of 6.7e-091/s. This rate constant was then used to model the data from core 2, andproduced comparable results for Fe(II) concentrations in leachate and for thepore volume at which Fe(II) concentrationsdecreased to below detection(Fig. 8b).
4.2.3
Reduction of Mn oxyhydroxides concurrent with Fe oxyhydroxides wasapparent in both cores (data not shown). Manganese concentrations followeda pattern similar to Fe(II); however, initial Mn concentrations were muchlower than Fe(II) (Table 2). Manganese concentrations in leachate wereabout one-half of the Fe concentrations. Although reduction of Mnoxyhydroxides was not simulated in the geochemical model, the total massof Mn in leachate from core 1 was used to estimate the amount of reactiveorganic carbon that had been oxidized. Assuming that all of the Mn wasreduced from Mn(IV) to Mn(II), the concentration of organic carbonoxidized by Mn (IV) was about 1% of the total organic carbon concentrationin the core 1 solids.
4.2.4
Arsenite concentrations in leachate from cores 1 and 2 are shown in Figs.9a and 9b. Although 20% of the total As concentration measured incontaminated ground water samples collected in 1997 (Table 1) wasdetermined to be As(V), all of the As in the core experiments was As(III).Arsenite concentrations in leachate from core 1 (initial pore water
Manganese
Arsenic

13. Natural Remediation Potential of Arsenic-Contaminated GroundWater
377

5. CONCLUSIONS
High concentrations of As in ground water beneath and downgradient ofa municipal landfill appear to have been caused by organic carbon inleachate migrating from the landfill. Bedrock and alluvium on which the
378 Chapter 13
concentration = and core 2 (initial pore water concentration = 480were controlled by three mechanisms. The rapid decrease in As(III)
during the first 15 pore volumes of both experiments can be attributed todisplacement of As(III) in the pore water by As-free uncontaminated groundwater and desorption of high concentrations of As(III) from the solid phase.Between pore volumes 15 and 50, As(III) decreased at a slower rate;concentrations were likely dominated by desorption. The rate of decrease inAs(III) was much more gradual after pore volume 50; concentrations werecontrolled by a combination of release of As(III) to solution from thereductive dissolution of and adsorption/desorptionequilibria. Arsenite concentrations decreased to below detection at about thesame pore volume that Fe(II) concentrations became undetectable(coincident with breakthrough of
The equilibrium constant for adsorption of As(III) was adjusted to givethe best match to As(III) concentrations in leachate from core 1 (Fig. 9a).The geochemical model predicted that as moved through the cores andconditions became oxidizing, As(III) should be oxidized to As(V) andstrongly adsorbed, thus resulting in As concentrations below the detectionlimit at the pore volume when broke through.
The geochemical model simulated As(III) concentrations in the first 50pore volumes of leachate from core 2. However the model simulatedmeasurable As(III) to about pore volume 150, whereas the data in Fig. 9bshow that As(III) concentrations decreased to the detection limit by porevolume 100.
The As(III) data from these core experiments have significantimplications for remediation. More than 200 pore volumes were required tolower concentrations in leachate from core 1 to the drinking-water standardof for As. Persistence of anoxicconditions in these cores appears tohave had the most significant impact on the mobility of As. When conditionsin the core were reducing, As(III) dominated and reductive dissolution ofAs-containing Fe oxyhydroxides provided a continual source of As. Whenthe redox environment became oxidizing, as evidenced by breakthrough of
As concentrations decreased to below detection. Geochemical modelingpredicted that any remaining As(III) in the core oxidized to As(V) and wasstrongly adsorbed.

13. Natural Remediation Potential of Arsenic-Contaminated GroundWater
379
landfill was located contain Fe oxyhydroxide coatings that are enriched inAs. Data from laboratory experiments support the hypothesis that reductivedissolution of these Fe oxyhydroxides releases As to solution. Arsenicconcentrations in ground water are moderated however by adsorption on thesolid phase.
Capping the landfill, thereby blocking the source of more reactiveorganic carbon, followed by allowing natural recovery of the aquifer, isexpected to eventually restore the water quality of the aquifer to pre-landfillconditions. However, analyses of core material from contaminated areas ofthe aquifer show that significant concentrations of organic carbon haveaccumulated on the aquifer solids during the years of landfill operation.Leaching of contaminated cores with oxygenated, uncontaminated groundwater indicated that some of this organic carbon is reactive to oxidantsincluding Fe(III), and Mn(III, IV). Data from these experiments haveshown that more than 200 pore volumes of uncontaminated ground watermay be needed to reestablish oxidizing ground water conditions.
When concentrations in ground water began to increase in thelaboratory core leaching experiments, reductive dissolution of Feoxyhydroxides stopped, eliminating mobilization of As. Arsenite remainingin solution or adsorbed as an As(III) species is predicted to oxidize to As(V)which is more strongly adsorbed. In these experiments, a decrease in Asconcentrations to below the drinking-water standard of wasassociated with increasing concentrations of and with Fe concentrationsthat were below detection.
Data from one of the laboratory experiments were used to develop andcalibrate a geochemical model. This model was successful in simulatingconcentrations of Fe, and As in leachate from other cores and may besuitable for modeling natural remediation processes in the contaminatedaquifer.
Results from this study could be applicable to other areas in NewEngland or elsewhere where high concentrations of As are found in groundwater associated with landfills. The data show that, even after the source oflandfill leachate is eliminated, lowering As to pre-landfill concentrations vianatural remediation could require several years.
ACKNOWLEDGMENTS
The authors thank James Tindall, Roger Lee, and Robert Frod forproviding constructive reviews of this manuscript.

This page intentionally left blank

Chapter 14
Modeling in situ iron removal from groundwater withtrace elements such as As
C.A.J. Appelo1 and W.W.J.M. de Vet21Hydrochemical Consultant, Valeriusstraat 111071 MB Amsterdam, The Netherlands2Hydron-ZH, Postbus 122, 2800 AC Gouda, The Netherlands
The cyclic injection of oxygenated water in an aquifer may induce in situ ironremoval from groundwater. During injection of aerated water, sorbed ferrousiron is displaced by cations, oxidized in the pore space, and precipitated asferric iron oxyhydroxide. During pumping, ferrous iron is sorbed fromgroundwater on the exchange and sorption sites, and the breakthrough ofdissolved iron is retarded. Other trace elements such as arsenic may beeliminated jointly with iron by sorption or co-precipitation.The volume of iron-free groundwater that can be pumped per volume ofinjected, aerated water defines the efficiency of the process. The efficiency isdetermined by the ratio of the retardations of oxygen during injection and ofiron during pumping. This chapter shows how these retardations can becalculated forgiven water qualities and aquifer compositions.The first seven cycles of an in situ iron removal project in The Netherlandswere simulated with the hydrogeochemical transport model PHREEQC(version 2). The concentration changes of andAs are discussed in detail. Arsenic shows concentration jumps in pumpedgroundwater which are related to oxidation/reduction and sorption/desorptionreactions resulting from the water quality variations.
1. INTRODUCTION
In situ iron removal is a useful technique for reducing the ironconcentration in groundwater pumped for consumption or industrialpurposes (Hallberg and Martinell, 1976; Meyerhoff, 1996; Rott andLamberth, 1993; Van Beek, 1980). The technique entails the periodicinjection of a volume of aerated or oxygenated water in an aquifer, followedby pumping of the injected water and subsequently of groundwater in which

the iron concentration is lower than in native groundwater. Iron in theaquifer is oxidized during injection of the oxygenated water and precipitatesas iron-oxyhydroxide. The loss of iron also liberates cation exchangerswhich are filled again when pumping is resumed and groundwater withdissolved iron contacts the cation exchange sites in the aquifer (Appelo etal., 1999). The precipitated iron forms a sorber which augments theexchange capacity of the aquifer. Moreover, iron-oxyhydroxide is a wellknown scavenger for heavy metals, and by analogy with above groundoperations (Benjamin et al., 1996) it can be expected that together with iron,the concentrations of heavy metals in groundwater will decrease as well. Aloss of arsenic with in situ iron removal has been reported already (Rott etal., 1996).
Chapter 14382
However, it is still fairly uncertain which chemical or biochemicalprocess takes the lead in changing the concentrations of heavy metals inaquifers. Sorption on ferrihydrite can now be modeled in great detail usingdata from laboratory experiments, but to discern between sorption anddesorption and uptake and release in a growing and reordering precipitate isdifficult even in the laboratory (Eick et al., 1999; Fuller et al., 1993; Gerth etal., 1993; McKenzie, 1980; Nesbitt et al., 1995; Waychunas et al., 1993;Zachara et al., 1987). It is also clear that other iron-oxyhydroxides thanferrihydrite exhibit other sorption behavior, and have other constants in thesurface complexation model (Mathur, 1995). Another drawback is thatcomplexation constants for and are lacking, although these areimportant species in groundwater that will influence sorption of otherelements. Thus, it is important to perform field studies which show theapplicability of our models for sorption in natural systems (Davis et al.,1998; Kent et al., 2000; Runkel et al., 1999; Stollenwerk, 1998) and thischapter follows that line.
In particular, data were interpreted from the groundwater pumping stationSchuwacht of Hydron-ZH (Gouda, The Netherlands) where the water qualitywas monitored for the first 7 cycles of in situ iron removal. Emphasis wasplaced on the effects for arsenic concentrations, prompted by fear that thesubsoil might become contaminated by trace elements which areincorporated in the iron precipitates. The general principles of in situ ironremoval are not difficult and the efficiency of the operation can be estimatedwith simple formulas. However, for arsenic also redox effects andcomplicated displacements from sorption sites are significant which cannotbe calculated without numerical models. This chapter describes the generalprinciples of in situ iron removal and discusses details of the Schuwachtplant starting with simple hand calculations for basic insight and continuingwith more comprehensive modeling for As.

14. Modeling in situ iron removal from groundwater with As 383
2. PRINCIPLES OF IN SITU IRON REMOVAL
Concentration profiles of oxygen and iron at three successive steps of insitu iron removal are shown in Figure 1. During injection of aeratedwater, groundwater with dissolved iron is displaced in the aquifer. If sorptionsites would be absent, ferrous iron would simply move along withgroundwater, and the reaction between oxygen and would be limited tosmall amounts due to mixing at the front. However, cations from injectedwater exchange for sorbed and the oxidation of this iron consumesoxygen. Thus, the oxygen front lags behind the injection water front. Whenthe operation is switched to pumping, first the injected volume is withdrawn,with some front spreading as result of dispersion. Then, for some time,groundwater can be pumped with a reduced iron concentration, becauseferrous iron is lost to the exchange sites as groundwater flows through theoxidized zone. After a fixed time, or when the iron concentration passessome limit, another volume of aerated water is injected and the next cycle(or run) of in-situ iron removal begins.
The efficiency of the process can be calculated if we neglect dispersionand limit the sorption reactions to the zone where oxygen has penetrated, andthen consider how much iron can be sorbed in that part of the aquifer. Thus,first the position of the oxygen front at the end of the injection stage must belocated. This position can be found from the reaction of oxygen with ferrousiron:
All dissolved for this reaction comes from sorbed iron and theretardation of oxygen amounts to:
where is sorbed iron (mol/1 pore water) and is dissolved oxygenin injection water (mol/1). Sorbed iron in eqn. 2 is in exchange equilibriumwith dissolved iron in groundwater and can be calculated with standardgeochemical programs as will be demonstrated in section 3.

384 Chapter 14
For the case of linear flow, the distance between the oxygen front and theinjection well is:
where is the distance traveled by the injected water. The fraction ofinjected water from which oxygen is activily utilized in the process is:
Note that eqn. 4 implies that oxygen may not be reacting at all when theretardation equals 1, i.e. when sorbed iron is zero, or in eqn. 2. On theother hand, all oxygen is used when sorbed iron is infinite. Thus, theefficiency of in situ iron removal depends on the sorption capacity of theaquifer for iron, and it will be low in a coarse, gravelly aquifer.

14. Modeling in situ iron removal from groundwater with As 385
Now during pumping, if native groundwater with dissolved iron returnsand flows along the emptied sorption sites, will be sorbing again, andiron is retarded with respect to groundwater flow. The retardation equals:
Equation (5) allows to calculate the volume of groundwater that can bepumped until the sorption sites are all filled again and the iron concentrationof native groundwater arrives at the well. The volume of water in betweenthe injection well and is:
And the volume of groundwater which can be pumped is:
Note again, that eqn. 7 implies that iron arrives immediately at the wellwhen the ratio of sorbed and dissolved iron is very small, and, of course, thatit will never arrive when the concentration of dissolved iron is zero. Thus,the efficiency of in situ iron removal also depends on the concentration ofiron in groundwater.
We can define the efficiency of in situ iron removal as:
which, according to eqn. 7, equals:
For a hand calculation, we may assume that in eqn. 5 is the same aswas used for calculating the reaction of oxygen in eqn. 2, and initiallyneglect the additional sorption of iron on the precipitate. Otherwise, if thesorption on the precipitated iron-oxyhydroxide is known, it can be used toincrease in eqn. 5 with respect to eqn. 2 by the appropriate factor.
3. SORPTION REACTIONS OF
Sorption in aquifers takes place mainly on clay minerals, organic matterand oxides, and is differently modeled depending on the properties of thesolid. Clay minerals such as smectite and illite carry a charge due to
structural substitutions which is constant at the pH's of groundwater.Sorption of cations is, in this case, a cation exchange reaction which does notaffect the charge of the clay mineral. For example when from injectionwater displaces from the exchange sites of the clay mineral, the reactionis:
Here, X indicates the cation exchanger, with a charge of X-. The cationexchange capacity (CEC, can be estimated with empiricalformulas such as:
where (% clay) and (% C) are the weight percentages of clay andorganic carbon, respectively (Appelo and Postma, 1993). The CEC can berecalculated to a capacity per liter groundwater by multiplying with the bulkdensity and dividing by the water filled porosity (-):
Cation exchange in groundwater is a multicomponent process in whichall the solute cations participate. It can be calculated easily with geochemicalmodels such as PHREEQC-2 (Parkhurst and Appelo, 1999) which havedatabases with representative values of the exchange constants. An examplePHREEQC-2 input file for calculating exchangeable iron is given in Table 1.
Sorption to iron-oxyhydroxide can be computed with the surfacecomplexation model of Dzombak and Morel (1990). This model assemblesthe results of numerous laboratory experiments on sorption of trace elementsto ferrihydrite (Hfo, hydrous ferric oxide, FeOOH). Ferrihydrite is a more orless amorphous substance which is found in nature in seepage zones ofreduced, iron containing groundwater. Probably, it will be representative forthe iron-oxyhydroxide which forms during in situ iron removal in aquifers,but this has not been verified yet.
The main difference between surface complexation and exchange is thatthe surface complexer will acquire a charge depending on the ions which aresorbed to the surface. The proton is an important charge-determining ion,and in distilled water ferrihydrite will carry a charge depending on the pHand be chargeless at a pH of about 8.1. Thus, at pH = 7, ferrihydrite has apositive charge and cations are bound only when their chemical affinity tothe surface oxygens is sufficient to overcome the electrostatic repulsion. The
386 Chapter 14

14. Modeling in situ iron removal from groundwater with As 387
electrostatic effect is calculated with the Boltzmann factor,where the potential is a function of the charge and the surface area of theferrihydrite, and, in Dzombak and Morel's model, of the ionic strength of thesolution. Chemical binding is distributed over weak and strong sites whichexist in a proportion of 0.2 and 0.005 mol sites / mol ferrihydrite. Theincreasing complexation capacity with increasing amounts of ferrihydritethat precipitate during in situ iron removal can be modeled with PHREEQC-2 by coupling Hfo, the moles of the surface complex, to the mass offerrihydrite in the system, cf. Table 1.

Chapter 14388
Surface complexation is a typical multi-component reaction, similar tocation exchange. The database for surface complexation includescomplexation constants for major elements in groundwater such as and
but not for and In the first instance, constants for theseions can be estimated with linear free energy relations (LFER's) in which theproperties of similar chemical systems are compared and interpolated(Dzombak and Morel, 1990). Thus, the surface complexation constant for
is expected to lie in between the ones for and for , in line withthe known differences of the association constants of these heavy metalswith in water. For the weak sites, the LFER gives:
The LFER-derived complexation constant K enabled to fit the recentlypublished experimental sorption isotherm of Liger et al. (1999) very well,except at pH > 8 (Fig. 2). The deviation at higher pH is due to sorption of ahydroxy complex and the data of Liger et al. were used for optimizing newconstants for the database which are given in Table 2. The complexationconstant for the strong sites could not be derived from Liger's data becausethe concentration was low for ferrihydrite and high for The value inTable 2 was obtained from new measurements by C. Tournassat with moreappropriate concentrations in the experiment. It may be noted that theexperimental value is much different from the one which can be estimatedby interpolation with and thus indicating that the LFER valueneeds to be checked whenever possible.
Another important ion in groundwater, is also lacking from thedatabase in Dzombak and Morel's model. The bicarbonate ion is usuallyavoided in sorption experiments with oxides because of pH buffering andslow, kinetic exchange at the air-solution interface. The experimental data ofVan Geen et al. (1994) for goethite were used to derive complexationconstants for ferrihydrite which are listed in Table 2. Although goethite has amuch higher crystallinity than ferrihydrite, it was found that the sorptionenvelope of on ferrihydrite measured by Zachara et al. (1987) couldbe modeled with nearly the same constants (Appelo et al., 2002). The majoreffect of sorption of on ferrihydrite is identical to what was notedalready by Van Geen et al. for goethite, i.e. a large proportion of the surfacesites will be occupied by at the usual bicarbonate concentrations ingroundwater.

14. Modeling in situ iron removal from groundwater with As 389
4. A SPECIFIC EXAMPLE: PUMPING STATIONSCHUWACHT, HYDRON-ZH
Pumping station Schuwacht of the drinking water company Hydron-ZHis a bank filtration unit with the pumping wells located at a distance of 70 -200 m from the river Rhine near Gouda, The Netherlands. In 1998 and 1999,pumping from filter PP8 was periodically interrupted to inject a volume oftreated and aerated groundwater. Water was injected at for 2 days

and immediately afterwards pumping was resumed at for 40 days.The purpose of the injection was to ameliorate the conditioning of the rawwater for the water treatment plant where iron, manganese, ammonia andmethane are removed.
Pumping well PP8 is located in coarse sandy sediments of the Sterkselformation at a depth of 20-30 m bs. Chemical analysis of the sand providedan average of 0.5% calcite, 0.03% organic carbon, 300 ppm Fe as Fe-oxide,no pyrite, and less than 1 ppm As. The lower 7 m sediment contained 1%silt, the upper 3 m 5-7% silt and the porosity was 0.34. The sediment'sexchange capacity was estimated to be in the coarse sandy lowerpart and in the upper 3 m.
Water in the well originates for almost 100% from the Rhine, but thewater quality has changed during infiltration in the riverbed and passagethrough the aquifer. The concentrations of and thealkalinity have increased, and the groundwater contains methane. Methane isimportant for judging the suitability of an aquifer for in situ iron removal andfor modeling the chemical processes, since it often indicates a redox state inwhich sulfides have formed and are stable. When sulfides are present, arapid reaction with injected oxygen will have various adverse effects for thewater quality, varying from decrease of pH to increase of heavy metals.However, methane formation is not expected in the Sterksel aquifer for thegiven, low concentration of organic carbon, but it may originate in theorganic rich layers of the riverbed. Water sampled at various times showedthat the methane concentration was inversely coupled to theconcentration and increased linearly as the ratio of to Cl- decreased.This indicates that methane is probably formed locally during infiltration inthe river bed in part of the water after has been reduced, and that thiswater is mixed with water without methane but with in the well. In thiscase, sulfides may be present in the riverbed, but they are not expected in theaquifer and need not be considered for the in situ iron removal operation.Water quality analyses are given in Table 3.
4.1 Efficiency calculations
The oxygen concentration in the injected water was 0.28 mmolAccording to reaction 1, this amount can oxidize 1.12 mmol Theiron concentration in native groundwater is 0.1 mmol and thesimplest calculation would predict an efficiency of 11.2, i.e. for every liter ofinjected water, 11.2 liters groundwater without iron may be pumped.However, it was noted above (reaction 2) that the efficiency is limited by theintermediate reaction with sorbed iron.
Chapter 14390

14. Modeling in situ iron removal from groundwater with As 391
The concentration of sorbed in the fine sandy part of the aquifer canbe calculated to be for the initial groundwater quality (firstanalysis in Table 3). Using eqn. 2, the retardation of the oxygen front is
At the end of the first cycle, water wereinjected and the front had radiated to 11.8 m from the well, with 9.7 m filterlength and porosity 0.34. The oxygen front was then located at the positionwhich conforms to the injection of or 10.9 m. Thefronts were also calculated with PHREEQC-2 (Parkhurst and Appelo, 1999)and are given for cycles 1 and 7 in Figure 3. The modeled oxygen front forthe first run shows slightly more retardation than was calculated by hand,because injected water was oxidizing dissolved at the front by mixingwith groundwater. Mixing by dispersion in the aquifer is included in thecomputer model, but the reactions due to this process are difficult to accountfor in hand calculations.
Duringpumping, ferrous iron is sorbed to 0.19mmol/l exchange sites,and furthermore to 0.19 mmol/l precipitated iron-oxyhydroxide. The amountsorbed to iron-oxyhydroxide was calculated to be 0.2 mol per mol iron-oxyhydroxide for the water composition of PP8 (discussed later). The totaliron sorbed during the first cycle is thus 0.19 + (0.2 × 0.19) = 0.23 mmol/l.The expected efficiency is therefore, from eqn. 9,
Note that it is the dynamics of the system, expressedby the retardations of the ions, that makes the efficiency decrease to a muchsmaller value than was estimated earlier when assuming simply that allwas available for oxidation of iron.
In the second run, sorbed iron had increased to andtherefore the oxygen front was more retarded than in the first cycle. Also,

392 Chapter 14
0.23 mmol/l iron-oxyhydroxide precipitated and the sorption capacityamounted to 0.19 + (0.2 × ( 0.19 + 0.23) = 0.27 mmol/l in the third run. Theincreased sorption capacity resulted in a more retarded front which isillustrated for the run in Figure 3. The retardation and hence theefficiency will continue to increase until in the final end all oxygen isreacting immediately at the injection well, and the theoretical limit of 11.2 isreached for the efficiency.
4.2 Amounts and distribution of precipitate
The total amount of iron-oxyhydroxide which precipitated during a cyclein Schuwacht, can be estimated from:
where indicates mol precipitate/l at run number n. For run 7the amount is 2.5 mmol or 23 ppm Fe in the sediment, which is ingood agreement with the model calculation shown in Figure 4. The totalprecipitate after run 7 would occupy 0.009% of the porosity, assuming adensity of for the precipitate. The amounts are small and, indeed,clogging has not been observed in systems which have been operating forover 20 years (Meyerhoff, 1996). Clogging is probably also preventedbecause closing pores will force the injected water to pass around, thusevening out the reaction in space.

14. Modeling in situ iron removal from groundwater with As 393
4.3 Concentration fronts of selected elements duringpumping
Cation exchange will modify the concentrations in groundwater duringpumping of groundwater, and it will be different for cations which sorb onclay minerals (such as and for ions which also sorb on iron-oxyhydroxide. Elements which do not sorb, will be a tracer for thegroundwater front and it was found that methane behaved conservatively inSchuwacht. Equilibria with calcite, siderite and rhodochrosite were alsoconsidered in separate model runs, but the carbonates seemed to beunimportant in Schuwacht. Thus, the model results described here, are for asystem with cation exchange and surface complexation only.
MethaneFigure 5 shows the methane concentration for cycles 1 and 7 as function
of the ratio of pumped and injected volume, The methaneconcentration was half of the groundwater concentration at andclose to the final concentration at The end concentration was 2 mg
in the first run, and 0.8 mg/1 in the run due to variations in thegroundwater quality. However, the concentration patterns were identical inboth runs, and conform to a conservative substance, with a dispersivity of0.3 m of the aquifer. The concentrations of and dissolved organiccarbon also showed conservative behavior, which indicates that injectedwater did not react with sedimentary organic carbon.

394 Chapter 14
AmmoniumFigure 6 shows the ammonium concentration for cycles 1 and 7. The
groundwater concentration of ammonium changed from 3.8 in cycle 1 to 3.3mg/l in cycle 7. Figure 6 shows a dotted line for conservative flow, and a fullline for the case that cation exchange is included in the model. Theinsignificant difference is due to the small exchange capacity offor the lower 7 m and for the upper 3 m of the aquifer. Theheterogeneity was modeled in separate computer runs for the upper and thelower part, adapting only the cation exchange capacity and combining themodel results in the proportion of 3:7. The model results for runs 1 and 7would coincide exactly when normalized to the final concentration, becausethe exchange capacity of the sediment is invariant and iron-oxyhydroxidedoes not adsorb ammonium.
ManganeseThe ion sorbs both to clay minerals and to iron-oxyhydroxide, and
the sediment's exchange capacity increases in proportion to the amount ofiron-oxyhydroxide which precipitated in the previous runs. The increasingretardation associated with the increase of the sorption capacity is clearlyvisible in Figure 7 in the delayed increase of the Mn concentration in run 7compared to run 1. The retardation is directly related to the number ofsorption sites on the iron-oxyhydroxide precipitate which is discussed next.The model shows a reasonable match of the observed concentrations buttends to be less disperse.

14. Modeling in situ iron removal from groundwater with As 395
The iron concentrations during pumping in the first and seventh run areshown in Figure 8. Again, the end-concentration in groundwater fluctuatedand was 6 and 5.2 mg for run 1 and 7, respectively. In the first run, aretardation of approximately 2.5 with respect to conservative behavior isindicated in Figure 8, which is close to what was calculated by hand before.The increased retardation in subsequent runs can be modeled if the sorptionsites amount to 1.4 mol sites per mol Fe. This is quite high, Dzombak andMorel (1990) proposed 0.2 mol sites per mol ferrihydrite. Of course, thelatter number is valid for laboratory conditions where the oxides are
Iron

Chapter 14396
prepared for more or less standardized experiments and aged and sometimesheated. It may be that during in situ iron removal, the precipitate forms a thinlayer on existing surfaces of only a few atom layers thick, thus acquiring aspecific surface area that is larger than in the laboratory preparates. Also, notall the sites are covered by ferrous iron, but phosphate and carbonate occupymore than 90% of the 1.4 mol sites per mol iron, which suggests that acomplicated, mixed solid grows in the aquifer, and not a neat iron-oxyhydroxide with properties which remain invariant over months and forwhich sorption and desorption can be calculated with one and the samemodel. It is also probable that the efficiency increase will be less in later runsbecause the specific surface area diminishes when the precipitate grows inthickness and ripens out and incorporates and rejects various elements in amore crystalline solid. It can be noted here that in model runs with calciteequilibrium the pH is slightly higher and more iron is sorbed because thesurface charge is more negative. The optimized number of sites thendecreases to about 1.3 mol per mol iron. However, the modeled pH issomewhat higher than was measured.
The effect of sorption of on ferrihydrite in the model also requiresdiscussion. With the derived complexation constants, was, togetherwith phosphate, the dominant species on the weak sites of the ferrihydritesurface. Sorption had no effect on the groundwater concentrations ofbut the high concentrations did affect the sorption of the other surfacespecies, in particular of and Without sorption of theincreased sorption of in run 7 compared to run 1 can be modeled withfewer sorption sites, 0.8 mol sites per mol Fe would be sufficient. However,even that number is high compared to the usual estimates for laboratoryprepared ferrihydrite, and the formation of a mixed solid still seems the mostplausible. The existing iron-oxyhydroxide in the aquifer was given anunreactivity factor of 3e-3, meaning that 300 ppm Fe initially amounted to(1.4 mol sites/mol Fe) × (300mg/kg / 56g/mol) × × 3e-3 =0.135 mmol sites/l groundwater. The (un)reactivity factor was bracketed onthe high end by retardation for iron in the first cycle, and on the low end byhaving sufficiently sorbed As available for desorption (discussed later).
The modeled concentration lines in Figure 8 are for a combination of acoarse sand (2/3 of aquifer thickness) and silty sand (1/3 of thickness). Thehigher initial exchange capacity of the silty sand increases the retardation,and smears out the concentration pattern. This does fit the observed slowincrease to the final concentration in the first run, but the modeled pattern istoo steep for the seventh run. It may be that the pattern is more spread out inthe field because in the aquifer more layers exist with a different initialexchange capacity than in the simple two-units model. Such differences willlead to a faster initial breakthrough, and to a more retarded arrival of the

39714. Modeling in situ iron removal from groundwater with As
final concentration. However, it is also likely that kinetics of theoxidation and of the exchange and sorption reactions will play a role.
PhosphateThe 1.4 sorption sites per mol precipitated iron was determined by
comparing the iron as well as the phosphate concentrations (Fig. 9). Thesorption behavior of the two ions on ferrihydrite is intimately coupled.Sorption of and increases the negative charge of ferrihydrite,and stimulates sorption of (the surface of ferrihydrite would bepositively charged at the pH of groundwater if phosphate would not bepresent). On the other hand, sorption of compensates the negativecharge increase and thus tends to stimulate sorption of phosphate as well.Just as for iron, has important effects in limiting sorption and in evenmore markedly influencing the concentration increases of phosphate.Without sorption of the modeled concentration increase of phosphateis much steeper as is shown in Figure 10, and the assumed two-layerstructure of the model aquifer becomes quite conspicuous in two steps in themodel lines. The stepwise character is a result of the steep sorption isothermof phosphate on ferrihydrite when sorption of is not in the model.
ArsenicThe arsenic concentration in pumped water varied from less than
As/l to The concentration pattern of As was different from the otherelements and showed a marked concentration increase at the time that ironand phosphate arrived at the well (Fig. 11). The highest concentrations of
were found in the first two cycles only, in later runs theconcentrations decreased to less than although still showing aconcentration jump when the iron and phosphate concentrations started toincrease in the well. Only total arsenic concentrations were measured, butthe modeled pattern in Figure 11 is the result of redox reactions of As(III)and As(V), of the different affinity of these species for ferrihydrite, andfurther marked by the displacement by phosphate. For an insight in thecompeting reactions which affect the behavior of As, it is helpful to calculatedistribution coefficients for the groundwater quality at hand (first cycle inTable 3). The distribution coefficients relate the concentration sorbed tosolute, and are given in undimensionalized form in Table 4.
Inspecting Table 4, it can be noted that arsenite is much less sorbed thanarsenate in groundwater without phosphate. However, in the presence of
the sorption of arsenate is diminished to a very small quantity due tonegative charging of the ferrihydrite surface. The effect is greater forarsenate than for arsenite because arsenate is sorbed as a negative species,while arsenite forms a neutral surface complex. The surface complexalso is mainly neutral, and the ion floods the weak sites of ferrihydrite and

398 Chapter 14
displaces arsenite while the effect on arsenate is somewhat less. On the otherhand, sorption of charges the surface positively, and enhances sorptionof arsenate, while it merely competes for sorption sites with arsenite. Thesmaller distribution coefficient for groundwater compared to injected water,is entirely due to the presence of more phosphate and in groundwater.
Now, the effect of injection of oxidized water is that As(III) is oxidized,and since As(V) is sorbed stronger than As(III), dissolved concentrationswould diminish. However, when contacts the surface to which As(V)

14. Modeling in situ iron removal from groundwater with As 399
is attached, it desorbs As, as indicated by the low distribution coefficient(Table 4). According to the model calculations, displaces As in theform of a wave which arrives in the well just before the increase of thephosphate concentration. As soon as arrives, As(V) is reduced to As(III)which is less affected by and sorbs again in agreement with the higherdistribution coefficient. To model the concentration wave of arsenic,sufficient As(III) must be present in the system. Thus, in the first run thenumber of sorption sites on iron-oxyhydroxide had to be adequate and this

400 Chapter 14
bracketed the (un)reactivity factor for already present iron-oxyhydroxide inthe aquifer. Also, the surface complexation constant for wasincreased threefold to obtain sufficiently sorbed arsenic.
The modeled pattern in Figure 11 shows the observed concentrationtrends, but, clearly, it does not match the details. Notably, the predicted Aspeaks arrive too early and they are too small. The column experiments ofIsenbeck-Schröter (1995) and Darland and Inskeep (1997) required kineticreactions for Freundlich or Langmuir sorption isotherms for As, but a kineticmodel appears to spread out the As concentrations in Figure 11 only, and itdoes not shift the position of the peak to later arrival times. Therefore, otherreactions might explain the discrepancy.
First, it is remarkable that the As concentration was quite high alreadywhen injected water was backpumped. It may be that As was sorbed tocolloidal iron-oxyhydroxide particles formed during oxidation, but were toosmall to be removed by filtration over before analysis. Thismechanism was suggested by Rott et al. (1996) who observed similar Aspeaks during the first cycles of an in situ iron removal system. Whensamples were analyzed from a later cycle in Schuwacht, the Asconcentrations had decreased to about As/l and they were similar inunfiltered and filtered subsamples. Thus, sorption to colloidal ironcannot be ruled out as a mechanism and it should be investigated thoroughlyin the incipient cycles of another system.
Second, the combined presence of and in groundwater, andprecipitation of both Mn-oxides and Fe-oxides would lead to separation inspace of the precipitates, with reducing the Mn-oxides (Postma andAppelo, 2000). This may have special, but as yet not quantified effects onthe behavior of As.
Third, the surface complexation model of Dzombak and Morel (1990) isbased on data published by Pierce and Moore (1982) and is excellent for

14. Modeling in situ iron removal from groundwater with As 401
calculating laboratory experiments with As by Wilkie and Hering (1996) andManning and Goldberg (1996). The data of Manning and Goldberg onlyrequire a small adaptation of the ionic strength to use the double layer modeland to arrive at a similar potential/charge relation for ferrihydrite as for theconstant capacity model which they applied. These authors investigatedcompetition of for sorption of As. However, themulticomponent effects of a natural groundwater are still to be verified and acolumn experiment with well defined conditions and water qualities ishighly desirable for elucidating the combined effects of the variousprocesses on As during in situ iron removal.
5. SUMMARY
The principles of in situ iron removal from groundwater were explainedin simple terms, based on the reaction of sorbed ferrous iron in the aquifer.The efficiency of an in situ iron removal system was defined as the ratio ofthe volume of groundwater pumped to the volume of oxygenated waterinjected. For the easy case of sharp fronts without dispersion or smearing bykinetics, the efficiency is given by the ratio of the retardation of over theretardation of A specific case of in situ ironremoval in the Netherlands was discussed, showing many of the details of insitu iron removal common to these systems. The features are connected withexchange and sorption reactions in the aquifer. Sorption for ammonium wassmall and identical for all cycles. Retardation of andincreased in successive cycles due to sorption to the iron-oxyhydroxidewhich was precipitated in the previous cycles. The concentration patterns ofthese elements could be modeled well with known reactions. Arsenicshowed a complicated behavior with initial concentration jumps whichappear to be related to redox transitions and displacement by Arelatively high sorption capacity of the freshly precipitated ferrihydritesuggests that the precipitate in the aquifer is a mixed solid of Fe, P and C,rather than a neat iron-oxyhydroxide to which and other elements aresorbed.
ACKNOWLEDGEMENTS
The cooperation of ir D. van der Woerdt for initiating this study is highlyappreciated. Helpful reviews were provided by Kees van Beek, MargotIsenbeck-Schröter, and Ken Stollenwerk.

This page intentionally left blank

Chapter 15
In situ Arsenic Remediation in a fractured, alkalineaquifer
Alan H. Welch, Kenneth G. Stollenwerk, Douglas K. Maurer and Lawrence S.FeinsonU.S. Geological Survey
In situ removal of arsenic from ground water used for water supply has beenaccomplished in circum-neutral ground water containing high dissolved iron
concentrations. In contrast, the ground water at our study site is alkaline,contains measurable dissolved oxygen and little dissolved iron. Because thedissolved iron concentration is low in the basalt aquifer, the iron oxide content
of the aquifer would not increase with successive pumping cycles unless iron
is added to the injected water. Additionally, the high pH limits adsorption ontoiron oxide present in the aquifer. Having the ability to lower arsenic
concentrations in high-pH, oxic ground water could have wide application
because similar high arsenic ground water is present in many parts of the
world.
Laboratory and field results show that the basalt has limited capacity foradsorption of As(V), presumably by naturally occurring hydrous ferric oxide(HFO). However, addition of HFO can significantly increase As(V)adsorption. Lowering the pH combined with increasing the iron oxide contentin the basalt aquifer reduces arsenic concentrations in produced ground water.
Arsenic removal was very effective in laboratory experiments and during early
part of the initial push-pull experiment. Moderate arsenic removal afterincreasing the iron oxide content of the basalt aquifer and lowering the pH
during the cross-flow experiments was limited to about 50% at best. This
relatively low removal may be due to a variety or combination of factors,including local hydraulics of the aquifer, chemical reaction kinetics, and
changing aqueous chemistry caused by the lowered pH.

In situ removal of arsenic from ground water used for water supply hasbeen accomplished by using co-precipitation or adsorption involving ironoxide (Appelo et al., 1999; Rott and Friedle, 1999). The most commonapproach consists of withdrawing iron-rich ground water and introducingatmospheric oxygen or potassium permanganate (Matthess, 1981;Meyerhoff, 1996; Rott and Friedle, 1999) to promote the formation of ironoxide and conversion of any dissolved As(III) to As(V) followed byinjection in an aquifer and subsequent withdrawal for use. Ground water inthese systems is moderately to strongly reducing, as evidenced by thepresence of dissolved Fe(II) (Rott and Friedle, 1999) and methane (Appeloand deVet, this volume). The process is usually cyclic, with a period ofinjection followed by a period of pumping of water with lowered arsenic andiron concentrations continuing long after the volume of injected water hasbeen pumped. The efficiency of arsenic removal has been noted to increaseafter continued cycles without well or aquifer clogging even after operationfor decades (Appelo et al., 1999; Meyerhoff, 1996). HFO (hydrous ferricoxide) appears to be the most important phase responsible for removing thearsenic from the ground water (Appelo and deVet, this volume). The arsenicremoval process associated with iron removal may be described as a seriesof reactions involving dissolved oxygen, aqueous and exchangeable cationsincluding Fe(II), and arsenic (Appelo and deVet, this volume). Injection ofwater containing dissolved oxygen can lead to rapid exchange of Fe(II) forcations in the injected water with subsequent Fe(II) oxidation to form HFO.When the flow direction is reversed, the injected water has lower arsenic andiron concentrations.
The initial hypothesis for this study was that arsenic concentrations inwater pumped from a basalt aquifer could be lowered by adsorption ontoiron oxide. The hydraulic and geochemical conditions at the study site havesome important differences compared with the approach described above.Water at the test site is alkaline (pH = 9.1), contains measurable dissolvedoxygen (about 1 mg/L; wells B-3, B-5, and B-6 in Table 1), contains littledissolved iron, and the arsenic is dominantly As(V) (site number 69 ofMaurer, 2001 is well B-3). In contrast, reported successes with in-situarsenic removal generally involve Fe(II)-rich water with a circum-neutralpH. Because the dissolved iron concentration is low in the basalt aquifer, theiron oxide content of the aquifer will not increase with successive pumpingcycles unless iron is added to the injected water. Additionally, the high pHlimits adsorption of anions onto iron oxide present in the aquifer.Nonetheless, remediation of arsenic in high pH, oxic ground water may havewide application because similar high-arsenic ground water is present inmany parts of the United States (Welch et al., 2000) and elsewhere such asnorthern Argentina (Smedley et al., 2002).
404 Chapter 15
1. INTRODUCTION

A basalt aquifer underlying Fallon, Nevada (Fig. 1), is the sole source ofmunicipal supply for the city of Fallon, the Fallon Naval Air Station, and theFallon Paiute-Shoshone Tribe; serving a total population of about 11,000people. Concentrations of dissolved arsenic in water pumped from the basaltrange from 70 to (Maurer, 2001, p. 52; Maurer and Welch, 1996).The basalt aquifer is a mushroom-shaped body of basalt, its top exposed atRattlesnake Hill, an eroded volcanic cone about 1.6 km in diameter and 61 mhigh, and the remainder buried as deeply as 183 m below land surface nearits periphery (Fig. 1). In plan view, the lateral extent of the basalt is roughlypeanut-shaped, oriented southwest to northeast, and is about 6.4 km wideand 16 km long. The age of the basalt ranges from about 1 million years fora sample taken from Rattlesnake Hill, to 2.5 million years for a sample takenfrom a test hole about 2.4 km south of the cone. The aquifer is highlyproductive, with transmissivities of over 100,000 and varies inlithology from dense, fractured flows and breccias to highly porous,scoriaceous zones (Glancy, 1986, p. 15 and 18).
EXPERIMENTAL METHODS
3.1 Well Construction
The study concentrated at a site on the eastern side of Rattlesnake Hill(Fig. 1). The site was chosen because the basalt is present at shallow depthsand the location is down gradient and relatively distant from municipalsupply wells. Initially three wells were installed for the study; two (B-3 andB-6) separated by 6.1 m and a third (B-5) 122 m south of B-6. Plans were touse the two nearby wells for injection and sampling, and to use the third wellas a source of water from the basalt for injection.
The three initial wells were drilled using a 15-cm diameter air-hammerand odex casing that was removed as the wells were constructed. Basalt wasencountered at a depth of about 9.1 m below land surface at all wells, staticwater levels lie at about 15.2 m below land surface, and the wells are from21.3 to 22.9 m deep. The wells were constructed of 5-cm PVC casing, andPVC screen with 0.5-cm machine slots was emplaced in the bottom 3 m ofthe borehole. Sand pack was emplaced from 1.5 to 4.6 m above the screenand the remainder of the borehole was filled with bentonite grout.Preliminary injection and sampling using a submersible pump, capable of
3.
2. HYDROLOGY AND GEOCHEMISTRY OF THEBASALT AQUIFER NEAR RATTLESNAKE HILL
15. In situ Arsenic Remediation in a fractured, alkaline aquifer 405

406 Chapter 15
pumping about 5 gal/min, suggested that a larger pumping capacity would bedesirable for continued testing. A fourth well (B-7) was installedapproximately equidistant from wells B-3 and B-6 to shorten the flow pathbetween injection and pumping wells. The fourth well was constructed usingthe 15-cm diameter air hammer and by driving 15-cm diameter steel casingto a depth of 22.9 m below land surface. The lower 3 m of the steel casinghas .32-cm wide machine slots.

Basalt cores were collected from a depth of 21 to 22 m duringconstruction of well B-3. Recovered basalt ranged from dense, intactsections of core to less dense, vesicular pieces of basalt 1 to 5-cm diameter,which may represent a loosely consolidated scoriaceous zone. The intactcores contained vesicles, which were not interconnected. The cores wereimpermeable to water flow; therefore, column experiments were notpossible. Batch reactor experiments were conducted on the smaller pieces ofbasalt. Some of these pieces had visible coatings of calcite and reddish-brown coatings that are assumed to be iron oxide on one or two surfaces.The presence of calcite, phillipsite, and clay minerals is consistent with X-ray diffraction analysis and thin-section petrography reported by Lico andSeiler (1994) for samples from other wells penetrating the basalt aquifer.The coatings were most likely deposited on fracture surfaces exposed toground water. Although these basalt pieces contained numerous vesicles,interconnectivity was poor. Water-saturated porosity of individual pieces,approximately 3 to 5-cm in diameter, ranged from 1.5 to 5.6%, and averaged3.7% (n=5).
The buffering capacity of basalt surfaces exposed to ground water wasestimated by acid titration. Larger pieces were broken into 0.1 to 3 cm-sizepieces for experimental convenience. Although breaking the pieces creatednew surfaces, the greater part of the buffering capacity is most likely due tothe presence of calcite. The newly broken samples were not crushed tominimize the area of fresh basalt surfaces which were geochemicallydifferent from in situ surfaces previously exposed to ground water.Approximately 50 g from five separate basalt samples were added to 100 mLdeionized water in 250 mL polyethylene bottles. Initial pH values of theslurries ranged from 9.0 to 9.9 and were related to the abundance of visiblecalcite coatings. Hydrochloric acid (0.1 N) was rapidly added to each slurryto achieve a pH of 4.5. The bottles were placed on a reciprocating mixer andallowed to equilibrate for 3 days. This HCl addition was repeated seventimes for each of the five samples.
15. In situ Arsenic Remediation in a fractured, alkaline aquifer 407
3.2 Laboratory Simulations
3.2.1 Buffering capacity of the basalt
3.2.2 Arsenate adsorption
The capacity of basalt to adsorb As(V) as a function of pH was measuredfor three basalt samples. The samples were initially equilibrated with asynthetic ground water with an arsenic concentration of

408 Chapter 15

15. In situ Arsenic Remediation in a fractured, alkaline aquifer 409
which is somewhat greater than in the ambient ground water (see analysis ofB-3 collected prior to the addition of ferric chloride in Table 1). The arsenicconcentration was then determined at pH values ranging from about 6 to 9.5.The iron oxide content of these samples was then increased through theaddition of ferric chloride After each iron addition, arsenicconcentrations were then determined over the same pH range. Finally, thearsenic concentration of the solution was increased to withsubsequent determination of the pH-arsenic relation. Three basalt sampleswere examined using this experimental procedure.
Basalt pieces weighing about 100 g and ranging in size from 0.1 to 3 cmwere added to 1000 mL polyethylene bottles and equilibrated with 500 mLof the synthetic ground water. Initial pH values were adjusted to about 6.5with 0.1 N HCl; pH was then gradually increased with 0.1 N NaOH. Slurrysamples were equilibrated for one day on a reciprocating mixer followingeach addition of NaOH. Aliquots (20 mL) were removed, filtered through a
membrane and analyzed for As(V) and P(V).was then added to the slurries to evaluate the effect of HFO
precipitation on As(V) adsorption. Additional synthetic ground water wasadded to each slurry to make the final volume 500 mL. In one experiment,10 mg/L Fe(III) was added. The slurries were then equilibrated for 3 days toallow complete precipitation of HFO. NaOH was then added to slowlyincrease pH. Slurries were equilibrated for 1 day following each addition of0.1 N NaOH, followed by filtering of 20 mL aliquots for As(V) andP(V) analysis. Additional was then added to increase the Fe(III)concentration to 100 mg/L and the experiment was repeated as above.Arsenate adsorption for the 100 mg/L Fe(III) concentration was measuredfor initial As(V) concentrations of 145 and The iron additions of10 and 100 mg/L are equivalent to 0.1 and 1.0 mg/g of basalt.
3.3 Field Sampling and Analytical Methods
Ground-water samples were collected from four wells in the study area.Data for these sites, along with previously collected water-quality data, aregiven in Table 1 and locations are shown on Fig. 1. Measurements oftemperature, pH, and dissolved oxygen were made in a flow-throughchamber. Field meters were calibrated using appropriate pH standards(Wilde and Radtke, 1998). Alkalinity was determined on-site byincremental titration of filtered water with sulfuric acid (Wilde and Radtke,1998).
Water samples collected for determination of inorganic constituents wereprocessed in the field and shipped to the USGS National Water QualityLaboratory for analysis (Fishman, 1993; Fishman and Friedman, 1989;Garbarino, 1999). Filtered samples were collected after passing through a

pore-size capsule filter. Samples analyzed for cations were acidifiedto a pH of about two in the field with ultra pure Samples for analysisof nitrogen species and phosphate were collected in opaque plastic bottlesand chilled to about 3 °C. Unfiltered samples also were collected, primarilyfor analysis of arsenic and iron.
A modified phosphomolybdate method was used to determine As(III),As(V) and P(V) (Johnson, 1971; Murphy and Riley, 1962; Oscarson et al.,1980; Strickland and Parson, 1968) in the field and in water associated withbatch experiments. This method is based on the spectrophotometricmeasurement of the blue As(V) and P(V) molybdate complexes. Phosphateis measured in one sample after reducing As(V) to As(III), which does notform the color complex. In a second sample, both P(V) and As(V) aremeasured and the As(V) concentration is determined by subtracting the P(V)concentration. A third sample is oxidized to convert As(III) to As(V), andthe As(III) concentration is obtained by subtracting As(V) and P(V).
The limit of detection for arsenic with this technique is with anerror of ±70% at the 95% confidence interval. Concentrations between 3 and
have an error of ±40% at the 95% confidence interval.Concentrations between 10 and have an error of ±15% at the 95%confidence interval, and concentrations > have an error of ±10% atthe 95% confidence interval. Error estimates were determined for 15different concentrations ranging from 3 to There were 15replicates at each concentration.
410 Chapter 15
3.4 Field Experiments
Field experiments designed to evaluate the removal of arsenic fromground water included lowering the pH of injected water and increasing theadsorption capacity of the basalt aquifer. The experiments are describedbelow.
1. Two push-pull experiments consisted of pumping water from B-5into B-3 followed by recovery of the injected water. The pH of theinjected water was adjusted between 5.1 and 6.4 through theaddition of HCl. Recovery and field-testing of water from B-3indicated minimal or no removal of arsenic. The results areconsistent with the laboratory experiments, which indicated thatthe basalt has limited capacity for arsenic adsorption. A similarexperiment consisted of adding of to increase the adsorptioncapacity of the aquifer and to decrease the pH. Arsenicconcentrations were significantly lower in the recovered water.A cross-flow experiment, consisting of continuous pumping andinjection, included addition of followed by pH adjustment.
2.

Field and laboratory testing indicated significant arsenic removal,although the arsenic concentrations increased as the pH increased.Another cross-flow experiment nine months after the addition of
Water was again injected into the aquifer following pHadjustment. Arsenic was removed from the pumped water,although to a lesser degree.
RESULTS OF LABORATORY AND FIELDEXPERIMENTS
The pieces of basalt recovered from well B-3 neutralized an average ofbasalt (range 5.8 to n = 5; final pH = 7.0).
Placing this neutralization capacity in the context of the in situ conditionsfor the basalt aquifer is difficult because the large range in porosity andpermeability for the aquifer. However, an approximation can be obtained ifthe assumption is made that the average effective porosity of 3.7% measuredfor the basalt used in this experiment is comparable to the effective porosityof basalt in the aquifer. Assuming a bulk density of for the basalt,the aquifer basalt would be able to neutralize about 610 mmol Forcomparison, the and in the basalt aquifer ground water canneutralize about 5 mmol This observation has important implicationsfor pH adjustment alone as a technique for lowering As(V) concentrations.The natural buffering capacity of the aquifer may rapidly neutralize any lowpH ground water injected into the aquifer, thereby maintaining high pHvalues with minimal As(V) adsorption.
Decreasing the pH of synthetic ground water did not have a significanteffect on As(V) adsorption by unaltered basalt (Fig. 2). In one basalt sample,the As(V) concentration decreased from atpH 6.6. There was essentially no As(V) removed by the second basaltsample, and As(V) concentrations in the third sample were actually greaterthan the initial concentration in the synthetic ground water.Apparently, the basalt initially contained adsorbed As(V), which wasreleased to solution during the experiment.
Precipitation of HFO caused a decrease in aqueous As(V) for the threebasalts at all pH values. For an initial Fe(III) concentration of 10 mg/L, therewas a 30 to 50% increase in As(V) adsorption for pH values >7. At pH 6.2,almost all of the As(V) was removed from solution. Increasing the initialFe(III) concentration to 100 mg/L resulted in sufficient HFO precipitation to
4.1 Laboratory Experiments
15. In situ Arsenic Remediation in a fractured, alkaline aquifer 411
3.
4.

412 Chapter 15
completely adsorb As(V) at all pH values below 9. Even at pH 9, almost85% of the As(V) was removed from solution. The substantial adsorptioncapacity of the added HFO [100 mg/L Fe(III)] is evident in Fig. 3. In thisexperiment, the initial As(V) concentration was All As(V) wasadsorbed at pH values <7. Even at pH 9.4, 40% was removed.
The presence of other strongly adsorbing solutes would be expected tocompete with As(V) for adsorption sites. Phosphate is one such solute.Phosphate concentration in the synthetic ground water used in the laboratoryexperiments was 0.38 mg/L. Phosphate actually increased in ground waterequilibrated with unaltered basalt, and basalt from two of the 10 mg/LFe(III) experiments (Fig. 4). At pH >9, P(V) concentrations ranged from0.41 to 0.62 mg/L. Phosphate was adsorbed as pH decreased; however, evenat pH 6, there was still substantial P(V) in solution. P(V) concentrationsdecreased to below the detection level after the addition of 100 mg/L Fe(III).
4.2 RESULTS OF FIELD EXPERIMENTS
The second push-pull experiment ‘pushed’ about 610 L from well B-5 ata rate of about 8.3 L/min into well B-3 with the addition of about 55 g of Fein the form After about one hour, well B-3 was pumped until morethan twice the injected volume was recovered. The low pH in the waterduring the beginning of the recovery period was caused by precipitation ofiron oxide, as described by the reaction: Fieldcolorimetric analysis of arsenic indicated that arsenic was removed

15. In situ Arsenic Remediation in a fractured, alkaline aquifer 413
throughout the pumping (Fig. 5). Arsenic removal was confirmed bylaboratory analysis on four samples collected during the recovery period(Table 1), although arsenic removal was less efficient as the pH increased.Arsenic removal continued after a volume equivalent to that injected (about610 L) was pumped and the pH exceeded 8. The following removalestimates are based on the assumption that the ambient arsenic concentrationwas the mean concentration of wells B-3, B-5 and B-6 in June1999 (Table 1). Nearly 70% of the arsenic was removed from the first 1,000liters. About 44% of arsenic was removed from the water when the totalvolume pumped ranged from 610 to 1,000 L owing to less efficient removalas the pH increased to above 8.

414 Chapter 15
These results provide empirical evidence that reaction rates aresufficiently rapid to produce substantial arsenic removal, presumably due toadsorption on iron oxide. Although the laboratory experiments indicated thatthis approach could reduce arsenic concentrations, the hydraulics andchemistry of the aquifer are not sufficiently well understood to accuratelypredict the results. Of particular concern was the fractured character of theaquifer. If two wells are connected by a wide fracture then the surface area incontact with the ground water could be insufficient to produce significantarsenic adsorption. At the other extreme, even closely spaced wells may notbe hydraulically well connected. The latter situation is the case for wells B-7and B-6. Well B-7, which has a larger diameter casing and therefore allowsgreater pumping rates, was drilled to allow injection into wells B-3 and B-6.However, injection of about 135,000 liters of water from B-7 into B-6 at arate of about 150 L/min with the addition of HCl showed no measurableeffect in water quality withdrawn from B-7. This apparent limited hydraulicconnection between these wells resulted in changing the design of thesubsequent remediation experiment to include only wells B-7 and B-3 (Fig.6).
A cross-flow experiment increased the iron oxide content of the basaltaquifer followed by pH adjustment. Two cycles of iron addition, pHadjustment, and recovery (Fig. 7) consisted of: 1.) Addition of 1 kg of(2 kg total) with a pumping rate of about 100 L/min, 2.) HCl addition tolower the pH of the recovered ground water to < 7.0, and 3.) Pumping towaste at a rate of about 200 to 230 L/min with no injection. About one-half

15. In situ Arsenic Remediation in a fractured, alkaline aquifer 415
of the water pumped from well B-7 was not re-injected during the HCladdition to simulate some withdrawal for water use.
Filtered arsenic concentrations in ground water pumped during the HCladdition generally ranged from about 50 to (Fig. 8A), whichcorresponds to removal of about 25 to 50% (assuming an arsenicconcentration of about in the ambient ground water). The arsenicremoval was not greater after the second addition of compared to theremoval after the first addition. Filtered arsenic concentrations were lowerthan the ambient concentration of after the cessation of the HCladdition even when the pH exceeded 8.0.
Arsenic transport on particulate iron has been suggested as the cause ofhigher arsenic concentrations observed in the water pumped immediatelyafter injection of iron- and arsenic-rich water (Appelo and deVet, this

volume; Rott and Meyerhoff, 1996). During the first two periods of HCladdition, unfiltered samples contained more arsenic than filtered samples(Fig. 8A). Immediately after the second treatment, the water had adistinct reddish iron oxide color and the amount of particulate iron was veryhigh (>10 mg/L), as indicated by the high iron content in unfiltered samples(Fig. 8B). Shortly after the cessation of the addition the filtered andunfiltered arsenic concentrations were about and both the filteredand unfiltered iron concentrations rapidly decreased (Fig. 8B). Takentogether, the arsenic and iron concentrations during the latter part of the finalperiod of HCl addition suggest that the arsenic was primarily dissolved andthat about 25% of the arsenic was removed.
Nine months after the first cross-flow test, the effect of pH adjustment onarsenic concentration was evaluated during another cross-flow experiment.The pumping rate from well B-7 was about 210 L/min and about one-third ofthe water was diverted to waste. Arsenic concentrations in filtered samplesdecreased to values in the range 101 to near the end of pumpingwhen the pH was about 7.0, which corresponds to a removal efficiency ofabout 10 to 15% (Fig. 9). Unfiltered arsenic and iron concentrations near theend of the pumping (pumping volume = 108,000 L) were 103 andrespectively, suggesting that arsenic transport on particulate iron oxide wasnot an important source of arsenic in the pumped ground water.
Calcium and magnesium concentrations were higher in lower pH groundwater pumped during the last two field experiments (Fig. 10A). Additionally,the lower pH ground water is undersaturated with respect to calcite, whichhas been identified in the basalt aquifer (Lico and Seiler, 1994). Because thedissolution rates increase with increasing undersaturation, calcite dissolutionis expected to be greater in the lower pH water (Fig. 10A). The somewhathigher sodium concentrations in the lower pH ground water (Table 1) arelikely a result of cation exchange, which appears to be an important controlon the cation composition of ground water in the Carson Desert (Lico andSeiler, 1994). If cation exchange is the primary cause of the higher sodiumconcentrations, then the amount of calcite dissolution is equal to the amountinvolved in the exchange plus the increase in the aqueous calcium. Becausephosphate can substitute for carbonate in calcite, the increase in phosphatemay be related to the amount of calcite dissolution. Because phosphatecompetes for adsorption sites on iron oxide, the increased phosphateconcentrations may be partially responsible for limiting the arsenic removal.If calcite is the source of the phosphate, then greater arsenic removalefficiencies may be achieved by adjusting the pH to a value in the range ofabout 7.0 to 8.0, which could produce much less calcite dissolution thanappears to occur in water with a pH less than about 7.0. Additionally, long-term injection of ground water with a lower pH may eventually dissolve
416 Chapter 15

15. In situ Arsenic Remediation in a fractured, alkaline aquifer 417
much of the calcite leading to decreasing amounts of dissolution, whichcould improve the arsenic removal.
5. DISCUSSION
The laboratory and field results show that the aquifer basalt has limitedcapacity for adsorption of As(V), presumably by naturally occurring HFO.However, addition of HFO can significantly increase As(V) adsorption. Theeffectiveness of HFO addition to this aquifer depends on the HFOconcentration and the pH because the concentration of adsorption sites onHFO increases with decreasing pH. Initially, pH adjustment will only be

418 Chapter 15
effective for a short time because of the buffering capacity of the basalt.However, repeated treatments of the aquifer with Fe(III) and supplementalpH adjustments should reduce the carbonate concentrations in the basaltreducing the buffering capacity and allowing lower pH conditions to persistfor longer periods.
The cross-flow and laboratory experiments demonstrate that decreasingthe pH combined with increasing the iron oxide content in the basalt aquiferreduces arsenic concentrations in produced ground water. Arsenic removal
was very effective in laboratory experiments and during the early part of theinitial push-pull experiment. Moderate arsenic removal after increasing theiron oxide content of the basalt aquifer and lowering the pH during the cross-flow experiments was limited to about 50%. This relatively low removalmay be due to a variety or combination of factors, including local hydraulicsof the aquifer, chemical reaction kinetics, and changing aqueous chemistrycaused by the lowered pH.
The fractured character and high hydraulic conductivity of the basaltaquifer has been emphasized by various investigators (Glancy, 1986; Maurerand Welch, 1996). Ground water in fractured media is in much less intimatecontact with the surface of the aquifer material compared with mostsedimentary aquifers. This low surface area could limit the amount ofadsorption by the iron oxide that was introduced into the aquifer. As notedabove, the arsenic removal efficiency did not appear to increase after asecond addition of Because of the relatively low surface area, the ironoxide may have coated much of the fracture surface near the pumped wellduring the earlier iron additions. Iron oxide formed by the last additionmay largely form a coating on the previously formed oxide, limiting anyincrease in effective oxide surface area available for adsorption.
The funding from the Fallon Paiute-Shoshone Tribe through the U.S.Bureau of Reclamation’s Native American Technical Assistance Programfor the arsenic remediation experiments is gratefully acknowledged. TheChurchill County Road Department and the U.S. Bureau of Reclamationallowed access to the field site. The manuscript benefited from constructiveand insightful reviews by Mike Lico and Steve Sando of the U.S. GeologicalSurvey and Carol Boughton of the U.S. Bureau of Reclamation.
15. In situ Arsenic Remediation in a fractured, alkaline aquifer 419
ACKNOWLEDGEMENTS

This page intentionally left blank

REFERENCES CITED
Acharyya, S. K., 1997, Arsenic in groundwater - geological overview, Consultation onarsenic in drinking water and resulting arsenic toxicity in India and Bangladesh.,Proceedings of WHO conference, New Delhi, May 1997, p. 12.
Acharyya, S. K., Chakraborty, P., Lahiri, S., Raymahashay, B. C., Guha, S., Bhowmik, A.,Chowdhury, T. R., Basu, G. K., Mandal, B. K., Biswas, B. K., Samanta, G., Chowdhury,K., Chanda, C. R., Lodh, D., Roy, S. L., Saha, K. C., Roy, S., Kabir, S., Quamruzzaman,Q., Chakraborti, D., and McArthur, J. M., 1999, Brief communications: Arsenic poisoningin the Ganges delta. The natural contamination of drinking water by arsenic needs to beurgently addressed: Nature, v. 401, p. 545.
Acharyya, S. K., Lahiri, S., Raymahashay, B. C., and Bhowmik, A., 2000, Arsenic toxicity ofgroundwater in parts of the Bengal basin in India and Bangladesh: the role of Quaternarystratigraphy and Holocene sea-level fluctuation: Environmental Geology, v. 39, no. 10, p.1127-1137.
Adyalkar, P. G., Ghosh, P. C., and Mehta, B. C., 1981, On the salinity of groundwater inSouth 24 Parganas District, West Bengal, India: in van Duijvenbooden, W., Glasbergen,P., and Lelyveld, H., eds., Quality of Groundwater, p. 63-67.
Affolter, R. H., and Hatch, J. R., 2002, Characterization of the quality of coals from theIllinois Basin, Resource Assessment of the Springfield, Herrin, Danville, and Baken Coalsin the Illinois Basin, U.S. Geological Survey Professional Paper 1625-O Chapter E.
Aggett, J., and Aspell, A. C., 1978, Release of arsenic from geothermal sources: New ZealandEnergy Research & Development Report, 35, 12 p.
-, 1980, Arsenic from geothermal sources in the Waikato catchment: New Zealand Journal ofScience, v. 23, p. 77-82.
Aggett, J., and Kreigman, M. R., 1988, The extent of formation of arsenic(Ill) in sedimentinterstitial waters and its release to hypolimnetic waters in Lake Ohakuri: WaterResources, v. 22, p. 407-411.
Aggett, J., and O‘Brien, G. A., 1985, Detailed model for the mobility of arsenic in lacustrinesediments based on measurements in Lake Ohakuri: Environmental Science &Technology, v. 19, p. 231-238.
Aggett, J., and Roberts, L. S., 1986, Insight into the mechanism of accumulation of arsenateand phosphate in hydro lake sediments by measuring the rate of dissolution withethylenediaminetetraacetic acid: Environmental Science & Technology, v. 20, p. 183-186.
Aichelle, S., Hill-Rowley, R., and Malone, M., 1999, Arsenic, nitrate, and chloride in groundwater, Oakland County, Michigan: U. S. Geological Survey Fact Sheet 135-98, 6 p.
Ainsworth, C. C., Girvin, D. C., Zachara, J. M., and Smith, S. C., 1989, Chromate adsorptionongoethite: Effects of aluminum substitution: Soil Science Society of America Journal, v.53, p. 411-418.
Aiuppa, A., Dongarra, G., Capasso, G., and Allard, P., 2000, Trace elements in the thermalgroundwaters of Vulcano Island (Sicily): Journal of Volcanology and GeothermalResearch, v. 98, p. 189-207.
Alam, M. K., Hasan, A. K. M. S., Khan, M. R., and Whitney, J. W., 1990, Geological map ofBangladesh, scale 1:1,000,000., Geological Survey of Bangladesh, Dhaka.
Alberta Health and Wellness, 2000, Arsenic in groundwater from domestic wells in threeareas of northern Alberta: Alberta Health and Wellness--Health Surveillance, 35 p.

422 References Cited
Alden, W. C., 1953, Physiography and glacial geology of western Montana and adjacentareas: U.S. Geological Survey Profressional Paper 231, 200 p.
Allaby, A., and Allaby, M, 1990, The Consise Oxford Dictionary of Earth Sciences: OxfordPaperback Reference: New York, Oxford University Press, 410 p.
Allison, J. D., Brown, D. S., and Novo-Gradac, K. J., 1991, MINTEQA2/PRODEFA2; Ageochemical assessment model for environmental systems, Version 3.0 user's manual:U.S. Environmental Protection Agency, 106 p. p.
Alpers, C. N., and Nordstrom, D. K., 1999, Geochemical modeling of water-rock interactionsin mining environments: in Plumlee, G. S., and Logsdon, M. J., eds., The EnvironmentalGeochemistry of Mineral Deposits, Part A. Processes, Techniques, and Health Issues,Society for Economic Geologists, Reviews in Economic Geology, p. 289-323.
Anderholm, S. K., 1988, Ground-water geochemistry of the Albuquerque-Belen Basin,Central New Mexico: U.S. Geological Survey Water-Resources Investigations Report 86-4094, 110 p.
-, 2001, Mountain-front recharge along the east side of the Albuquerque Basin, central NewMexico (revised): U.S. Geological Survey Water-Resources Investigations Report 00-4010, 36 p.
Anderson, C. T., 1930, The heat capacities of arsenic, arsenic trioxide and arsenic pentoxideat low temperatures: Journal of the American Chemical Society, v. 52, p. 2296-2301.
Anderson, G. M., 1983, Some geochemical aspects of sulfide precipitation in carbonate rocks:in International conference on Mississippi Valley Type lead-zinc deposits, Rolla,Missouri, p. 61-76.
Anderson, M. A., and Benjamin, M. M., 1990, Surface and bulk characteristics of binaryoxide suspensions: Environmental Science & Technology, v. 24, p. 692-698.
Anderson, M. A., Ferguson, H. F., and Gavis, J., 1976, Arsenate adsorption on amorphousaluminum hydroxide: Journal of Colloid and Interface Science, v. 54, p. 391-399.
Anderson, M. A., and Malotky, D. T., 1979, The adsorption of protolyzable anions onhydrous oxides at the isoelectric pH: Journal of Colloid and Interface Science, v. 72, p.413-427.
Anderson, M. A., Tejedor-Tejedor, M. I., and Stanforth, R. R., 1985, Influence of aggregationon the uptake kinetics of phosphate on goethite: Environmental Science & Technology, v.9, p. 632-637.
Angeli, J., and Souchay, P., 1960, Sur les thioarsenites en solution: Compte Rendu, v. C 250,p. 713-715.
Anonymous, 1999, Arsenic in Drinking Water: Washington DC, National Academy Press,263 p.
Anthony, J. W., Bideaux, R. A., Bladh, K. W., and Nichols, M. C., 1990, Elements, Sulfides,Sulfosalts, Handbook of Mineralogy: Tucson, Arizona, Mineral Data Publishing.
-, 1997, Halides, Hydroxides, Oxides, Handbook of Mineralogy, Mineral Data Publishing, p.628.
Antikainen, P. J., and Tevanen, K., 1961, The effect of temperature on the ionization ofarsenious acid: Suomen Kemistilehti, v. 34B, p. 3-4.
Aoki, M., and Yui, S., 1981, Mineralogical Properties and genesis of scorodite in theOsorezan geothermal area: Hirosaki University, p. 104-111 p.
Appelo, C. A. J., Drijver, B., Hekkenberg, R., and De Jonge, M., 1999, Modeling in situ ironremoval from ground water: Ground Water, p. 811-817.
Appelo, C. A. J., and Postma, D., 1993, Geochemistry, groundwater and pollution, .A.A.Balkema, Rotterdam, p. 536.
Appelo, C. A. J., Van Der Weiden, M. J. J., Tournassat, C., and Charlet, L., 2002, Surfacecomplexation of ferrous iron and carbonate on ferrihydrite and the mobilization of arsenic:Environmental Science & Technology, v. 36, p. 3096-3103.

References Cited 423
Appold, M. S., and Garven, G., 1999, The hydrology of ore formation in the Southeast-Missouri District; numerical models of topography-driven fluid flow during the OuachitaOrogeny: Economic Geology, v. 94, no. 6, p. 913-935.
Arcand, G. M., 1957, Distribution of tripositive arsenic between hydrochloric acid solutionsand l,l'-dichlorodiethyl ether: Journal of the American Chemical Society, v. 79, p. 1865-1870.
Archer, D. G., 1992, Thermodynamic properties of the system. I.Thermodynamic properties of NaCl(cr): Journal of Physical Chemistry, v. 21, p. 1-21.
-, 1998, Thermodynamic properties of import to environmental processes and remediation. I.Previous thermodynamic property values for cadmium and some of its compounds:Journal of Physical Chemistry, v. 27, p. 915-946.
-, 2000, Thermodynamic properties of the system: Journal of PhysicalChemistry, v. 29, p. 1141-1156.
Archer, D. G., Filor, D., Oakley, E., and Cotts, E. J., 1996, Enthalpy increment measurementsfrom 4.5 K. to 350 K and the thermodynamic properties of the titanium silicide Ti5Si3(cr):Journal of Chemical and Engineering Data, v. 41, p. 571-575.
Archer, D. G., and Nordstrom, D. K., in press, Thermodynamic properties of selected arsenicspecies of import to ground-water applications: Journal of Chemical and EngineeringData.
Armienta, M. A., Rodriques, R., Aguayo, A., Ceniceros, N., Villasenor, G., and Cruz, O.,1997, Arsenic contamination of groundwater in Zimapan, Mexico: Hydrogeology Journal,v. 5, no. 2, p. 39-46.
Arnorsson, S., and Linvall, R., 2001, The distribution of arsenic, molybdenum and tungsten innatural waters in basaltic terrain, North Iceland: in Proceedings, 10th Water-RockInteraction Symposium, Sardinia.
Astor, B., 1999, A Study Of The Effects Of Strip Mining On Stream Water Chemistry In TheBlack Warrior Basin: Masters: University Of Alabama, 92 p.
Aurelius, L., 1988, Investigation of arsenic contamination of groundwater occurring nearKnott, Texas: Texas Department of Agriculture, 53 p.
Axness, K. A., Potokar, J., and Van Drasek, T., 2002, When the well runs dry: examining thewater supply issues in Brown County, Wisconsin: Water Resources IMPACT, v. 4, no. 2,p. 4-8.
Ayotte, J. D., Montgomery, D. L., Flanagan, S. M., and Robinson, K. W., in review, Arsenicin ground water in eastern New England: Occurrence, controls, and human healthimplications: Pembroke, New Hampshire, U.S. Geological Survey Water-ResourcesInvestigations Report.
Ayotte, J. D., Nielsen, M. G., and Robinson, G. R., Jr., 1998, Relation of arsenicconcentrations in ground water to bedrock lithology in eastern New England: inGeological Society of America Annual Meeting, Toronto, Ontario, p. A-58.
Ayotte, J. D., Nielsen, M. G., Robinson, G. R. J., and Moore, R. B., 1999, Relation of arsenic,iron, and manganese in ground water to aquifer type, bedrock lithogeochemistry, and landuse in the New England coastal basin: U.S. Geological Survey Water-ResourcesInvestigations Report 99-4162, 60 p.
Ayotte, J. D., Ryker, S. J., and Proctor, A., 2001, Variation in bedrock ground-water arsenicconcentrations and implications for human-health studies in New England: in GeologicalSociety of America, 2001 annual meeting, Boston, MA.
Azcue, J. M., and Nriagu, J. O., 1994, Arsenic: Historical perspectives: in Nriagu, J. O., ed.,Arsenic in the Environment Part 1: Cycling and Characterization: Advances inEnvironmental Science and Technology: New York, John Wiley and Sons, p. 430.
Bagla, P., and Kaiser, J., 1996, Epidemiology - India's spreading health crisis draws globalarsenic experts: Science, v. 274, no. 5285, p. 174-175.

424 References Cited
Bailey, A. K., 1976, Concentration of heavy metals in the sediments of a hydroelectricimpoundment: M.S.: University of Montana, 62 p.
Bailey, A. K., and Weisel, G. F., 1976, Completion report: Concentration of heavy metals insediments of a hydroelectric impoundment: Montana State University Joint WaterResources Research Center, 75 p.
Bajpai, S., and Chaudhuri, M., 1999, Removal of arsenic from ground water by manganesedioxide-coated sand: Journal of Environmental Engineering, v. 125, p. 782-784.
Baker, M. D., Wong, P. T. S., Chau, Y. K., Mayfield, C. I., and Inniss, W. E., 1983,Methylation of arsenic by freshwater green algae: Canadian Journal of Fisheries andAquatic Sciences, v. 40, p. 1254-1257.
Ball, J. W., and Nordstrom, D. K.., 1985, Major and trace-element analyses of acid minewaters in the Leviathan Mine drainage basin, California/Nevada: U.S. Geological SurveyWater-Resources Investigations Report 85-4169, 46 p. p.
-, 1998, Critical evaluation and selection of standard state thermodynamic properties forchromium metal and its aqueous ions, hydrolysis species, oxides and hydroxides: Journalof Chemical and Engineering Data, v. 43, p. 895-918.
Ball, J. W., Nordstrom, D. K., Jenne, E. A., and Vivit, D. V.. 1998, Chemical analyses of hotsprings, pools, geysers and surface waters from Yellowstone National Park, Wyoming,and vicinity, 1974-75: U.S. Geological Survey Open-File Report, 98-182, 45 p.
Ball, J. W., Parks, G. A., Haas, J. L., Jr., and Nordstrom, D. K., 1988, A personal computerversion of PHAS20, for the multiple simultaneous multiple regression of thermochemicaldata: U.S. Geological Survey Open-File Report, 88-489-A, 119 p.
Ballantyne, J. M., and Moore, J. N., 1988, Arsenic geochemistry in geothermal systems:Geochimica et Cosmochimica Acta, v. 52, p. 475-483.
Barnes, H. L., 1983, Ore-depositing reactions in Mississippi Valley-type deposits: inKisvarsanyi, G., Grant, S. K., Pratt, W. P., and Koenig, J. W., eds., Internationalconference on Mississippi Valley-type lead-zinc deposits; proceedings volume: Rolla,Missouri, United States, University of Missouri Press, p. 77-85.
Barringer, J. L, Szabo, Z., Barringer, T. H., and Holmes, C. W., 2001, Mobility of arsenic inagricultural and wetlands soils and sediments, northern Coastal Plain of New Jersey: inUSGS Workshop on Arsenic in the Environment, Denver, Colorado.
Barton, P. B., 1969, Thermochemical study of the system Fe-As-S: Geochimica etCosmochimica Acta, v. 33, p. 841-857.
Batten, W. G., and Bradbury, K. R., 1996, Regional groundwater flow system between theWolf and Fox Rivers near Green Bay, Wisconsin: Wisconsin Geologic and NaturalHistory Survey Information Circular 75, 28 p.
Bauer, H. H., and Vaccaro, J. J., 1990, Estimates of ground-water recharge to the ColumbiaPlateau regional aquifer system, Washington, Oregon, and Idaho, for predevelopment andcurrent land-use conditions: U.S. Geological Survey Water-Resources InvestigationsReport 88-4108, 37 p.
Beezer, A. E., Mortimer, C. T., and Tyler, E. G., 1965, Heats of formation and bond energies.Part XIII. Arsenic tribromide, arsenious and arsenic oxides, and aqueous solutions ofsodium arsenite and sodium arsenate: Journal of the Chemical Society (A), p. 4471-4478.
Belkin, H. E., and Anonymous, 1998, Mineralogy and speciation of arsenic in coals of theUpper Permian Longtan Formation, Guizhou Province, P.R. China: Abstracts withPrograms - Geological Society of America, v. 30, no. 7, p. 59.
Belzile, N., and Tessier, A., 1990, Interactions between arsenic and iron oxyhydroxides inlacustrine sediments: Geochimica et Cosmochimica Acta, v. 54, p. 103-109.
Benjamin, M. M., Sletten, R. S., Bailey, R. P., and Bennett, T., 1996, Sorption and filtrationof metals using iron-oxide coated sand: Water Resources Research, v. 30, p. 2609-2620.

References Cited 425
Beran, A., Goetzinger, M. A., and Rieck, B., 1994, A fluid inclusion study of realgar from theAllchar deposit, FYR Macedonia: Neues Jahrbuch fur Mineralogie. Abhandlungen, v. 167,p. 345-348.
Berg, M., Iran, H. C., Nguyen, T. C., Pham, H. V., Schertenleib, R., and Giger, W., 2001,Arsenic contamination of groundwater and drinking water in Vietnam: A human healththreat: Environmental Science & Technology, v. 35, no. 13, p. 2621-2626.
Berger, B. R., Goldhaber, M. B., Hildenbrand, T., Wanty, R. B., and Anonymous, 1998,Origin of carlin-sryle gold deposits; coupled regional fluid flow, core-complex relatedextension, strike-slip faults, and magmatism: Abstracts with Programs - GeologicalSociety of America, v. 30, no. 7, p. 371.
Bethke, C. M., 1986, Hydrologic constraints on the genesis of the Upper Mississippi Valleymineral district from Illinois Basin brines: Economic Geology, v. 81, p. 233-249.
Bethke, C. M., and Marshak, S., 1990, Brine migrations across North America -- the platetectonics of groundwater: Annual Review of Earth and Planetary Sciences, v. 18, p. 228-315.
Bevans, H. E., Lico, M. S., and Lawrence, S. J., 1998, Water quality in the Las Vegas Valleyarea and the Carson and Truckee River Basins, Nevada and California, 1992-96: U.S.Geological Survey Circular 1170, 1170, 47 p.
Bexfield, L. M., and Anderholm, S. K., 1997, Water-quality assessment of the Rio GrandeValley, Colorado, New Mexico, and Texas-Ground-water quality in the Rio Grande floodplain, Cochiti Lake, New Mexico, to El Paso, Texas, 1995: U.S. Geological Survey Water-Resources Investigations Report, 96-4249, 93 p.
-, 2000, Predevelopment water-level map of the Santa Fe Group aquifer system in the MiddleRio Grande Basin between Cochiti Lake and San Acacia, New Mexico, U.S. GeologicalSurvey Water-Resources Investigations Report, p. 1 sheet.
-, 2002, Spatial patterns and temporal variability in water quality from City of Albuquerquedrinking-water supply wells and piezometer nests, with implications for the ground-waterflow system: U.S. Geological Survey Water-Resources Investigations Report 01-4244,101 p.
Bexfield, L. M., Lindberg, W. E., and Anderholm, S. K., 1999, Summary of water-qualitydata for City of Albuquerque drinking-water supply wells, 1988-97, U.S. GeologicalSurvey Open-File Report 99-195.
Beyer, H., 1989, Arsenolite as alteration product of realgar at low temperatures: Aufschluss,v. 40, p. 215-220.
BGS and DPHE, 2001, Arsenic contamination of groundwater in Bangladesh: in Kinniburgh,D. G., and Smedley, P. L., eds., BGS Technical Report WC/00/19: Keyworth, BritishGeological Survey.
Bhattacharya, P., Chatterjee, D., and Jacks, G., 1997a, Occurrence of arsenic-contaminatedgroundwater in alluvial aquifers from delta plains, Eastern India: options for safe drinkingwater supply: Water Resources Development, v. 13, p. 79-92.
-, 1997b, Occurrence of As-contaminated eroundwater in alluvial aquifers from the DeltaPlains, Eastern India: options for safe drinking water supply: Water ResourcesDevelopment, v. 13, p. 79-82.
Bierens de Haan, S., 1991, A review of the rate of pyrite oxidation in aqueous systems at lowtemperature: Earth-Science Reviews, v. 31, no. 1, p. 1-10.
Birkle, P., and Merkel, B., 1998, Environmental effects of surface outflow of geothermalwater at the geothermal field of Los Azufres, Mexico: Geothermal Resources CouncilTransactions, p. 287-291.
Blachnik, R. v., Hoppe, A., and Wickel, U., 1980, The systems arsenic-sulfurand arsenic-selenium and the thermodynamic data for their compounds: Zeitschrift fur AnorganischeChemie, v. 463, p. 78-90.

426 References Cited
Blackburn, W. H., and Dennen, W. H., 1997, Encyclopedia of Mineral Names: MineralogicalAssociation of Canada, 360 p.
Bonazzi, P., Menchetti, S., and Pratesi, G., 1995, The crystal structure of pararealgar,American Mineralogist, v. 80, p. 400-403.
Bostick, B. C., and Fendorf, S. E., 1999, Arsenite surface complexes on metal sulfides: inProceedings of the Soil Science Society of America Annual Meeting, p. 178.
Bottomley, D. J., 1984, Origins of some arseniferous groundwaters in Nova Scotia and NewBrunswick, Canada: Journal of Hydrology, v. 69, no. 1-4, p. 223-257.
Bowell, R. J., 1994, Sorption of arsenic by iron oxides and oxyhydroxides in soils: AppliedGeochemistry, v. 9, p. 279-286.
Boyle, D. R., Turner, R. J. W., and Hall, G. E. M., 1998, Anomalous arsenic concentrations ingroundwaters of an island community, Bowen Island, British Columbia: EnvironmentalGeochemistry and Health, v. 20, no. 4, p. 199-212.
Bragg, L. J., Oman, J. K., Tewalt, S. J., Oman, C. L, Rega, N. H., Washington, P. M., andFinkelman, R. B., 1997, U. S. Geological Survey Coal Quality (COALQUAL) database;version 2.0, U.S. Geological Survey Open-File Report, 97-134.
Braman, R. S., and Foreback, C. C., 1973, Methylated forms of arsenic in the environment:Science, v. 182, p. 1247-1249.
Brammer, H., and Brinkman, R., 1977, Surface-water gley soils in Bangladesh: Environment,landforms and soil morphology: Geoderma, v. 17, p. 91-109.
Brannon, J. C., Podosek, F. A., and Cole, S. C., 1997, Radiometric dating of MississippiValley-type ore deposits: in Sangster, D. F., ed., Carbonate-hosted lead-zinc deposits:Special Publication - Society of Economic Geologists, p. 536-545.
Brannon, J. M., and Patrick, W. H., 1987, Fixation, transformation and mobilization ofarsenic in sediments: Environmental Science & Technology, v. 21, p. 450-459.
Breit, G. N., Foster, A. L., Sanzalone, R. F., Yount, J. C., Whitney, J. W., Welch, A. H.,Islam, M. K., and Islam, M. N., 2001, Arsenic cycling in eastern Bangladesh: the role ofphyllosilicates: Geological Society of America Abstracts with Program, v. 32, no. 7, p.A192.
Breuninger, A. B., 2000, Effects of floodplain remediation on bed sediment contamination inthe upper Clark Fork River basin, western, Montana.: M. S. Thesis: University of Montana,182 p.
Breward, N., and Williams, M., 1994, Preliminary appraisal of the environmentalgeochemistry of the Bau mining area, Sarawak, Malaysia: British Geological Survey,WC/94/67R, 18 p.
Britton, H. T. S., and Jackson, P., 1934, Physicochemical studies of complex formationinvolving weak acids. Part X. complex formation between tartaric acid and (a) arsenicacid, (b) arsenious acid, (c) antimonous hydroxide, in acid and alkaline solutions. Thedissociation constants of arsenious and arsenic acids: Journal of the Chemical Society, p.1048-1062.
Britzke, E. V., Kapustinsky, A. F., and Tschenzowa, L. G., 1933, The affinity of metals forsulfur. Part III. Combustion- and formation-enthalpies of the sulfides of arsenic and the
58-64.Brook, E. J., and Moore, J. N., 1988, particle-size and chemical control of As, Cd, Cu, Fe,
Mn, Ni, Pb, and Zn in bed sediment from the Clark Fork River, Montana, U.S.A.: TheScience of the Total Environment, v. 76, p. 247-266.
Brookins, D. G., 1986, Geochemical behavior of antimony, arsenic, cadmium, and thallium:Chemical Geology, v. 54, p. 271-278.
compounds Zeitschrift fur Anorganische Chemie, v. 213, p.

References Cited 427
Brown, G. E., Jr., 1990, Spectroscopic studies of chemisorption reaction mechanisms atoxide-water interfaces: in Hochella, M. F., and White, A. F., eds., Mineral-Water InterfaceGeochemistry: Washington, D. C., Mineralogical Society of America, p. 309-363.
Brown, K. L., and Bacon, L. G., 2000, Cascade development and mineral extraction -alternatives to reinjection. In Environmental Safety and Health Issues in GeothermalDevelopment: in World Geothermal Congress, Kazuno, Japan.
Bruce, B. W., and Oelsner, G. P., 2001, Contrasting water quality from paireddomestic/public supply wells, central High Plains: Journal of the American WaterResources Association, v. 37, no. 5, p. 1389-1403.
Bryndzia, L. T., and Kleppa, O. J., 1988, Standard molar enthalpies of formation of realgar(a-AsS) and orpiment by high-temperature direct-synthesis calorimetry: Journal ofChemical Thermodynamics, v. 20, p. 755-764.
Burgess, W., Burren, M., Cuthbert, M., Mather, S., Perrin, J., Hasan, M., Ahmed, K.,Ravenscroft, P., and Rahman, M., 2000, Field relationships and models of arsenic inaquifers of southern Bangladesh: in Proceedings of the XXX IAH Congress onGroundwater: Past Achievements and Future Challenges, Cape Town, South Africa, p.707-712.
Burkel, R. S., and Stoll, R. C., 1999, Naturally occurring arsenic in sandstone aquifer watersupply wells of northeastern Wisconsin: Ground Water Monititoring & Remediation, v.19, no. 2, p. 114-121.
and determination of the crystal structure: Canadian Mineralogist, v. 39, p. 809-818.Busenberg, E., Plummer, L. N., Doughten, M. W., Widman, P. K., and Bartholomay, R. C.,
2000, Chemical and isotopic composition and gas concentrations of ground water andsurface water from selected sites at and near the Idaho National Engineering andEnvironmental Laboratory, Idaho, 1994-97: U.S. Geological Survey Open-File Report, 00-81,55 p.
Cannon, W. F., Kolker, A., Westjohn, D. B., Miller, J. D., Jr. (chairperson), and Jirsa, M. A.c., 1998, The geological source of arsenic in ground water in southeastern Michigan: inInstitute on Lake Superior Geology, 44th annual meeting, Minneapolis, MN, UnitedStates, p. 50-51.
Carlson, L., Lindstrom, E. B., Hallberg, K. B., and Tuovinen, O. H., 1992, Solid phaseproducts of bacterial oxidation of arsenical pyrite: Applied and EnvironmentalMicrobiology, v. 58, p. 1046-1049.
Carlson, R. C., 1999, Trends in the United States marketplace for individually owned privatewater wells: Spectrum Economics Inc., for the National Ground Water EducationalFoundation, 41 p.
Carrillo, A., and Drever, J. I., 1998, Adsorption of arsenic by natural aquifer material in theSan Antonio-El Triunfo mining area, Baja California, Mexico: Environmental Geology, v.35, p. 251-257.
Carroll, R. E., Pashin, J. C., and Kugler, R. L., 1995, Burial history and source-rockcharacteristics of Upper Devonian through Pennsylvanian strata, Black Warrior basin,Alabama: Geological Survey of Alabama Circular, v. 187, p. 29.
Cartwright, I., and Oliver, N. H. S., 2000, Metamorphic fluids and their relationship to theformation of metamorphosed and metamorphogenic ore deposits: in Spry, P. G., Marshall,B., and Yokes, F. M., eds., Metamorphosed and Metamorphogenic Ore Deposits: Reviewsin Economic Geology, p. 81 -96.
Cebrian, M. E., Albores, A., Garcia-Vargas, G., and Del Razo, L. M., 1994, Chronic arsenicpoisioning in humans: The case of Mexico: in Nriagu, J. O., ed., Arsenic in theEnvironment, Part II: Human Health and Ecosystem Effects: Advances in EnvironmentalScience and Technology: New York, John Wiley and Sons, p. 93-107.
Burns, P. C., and Percival, J. B., 2001, Alacranite, A new occurrence, new formula,

428 References Cited
Cederberg, G. A., Street, R. L., and Leckie, J. O., 1985, A groundwater mass transport andequilibrium chemistry model for multicomponent systems: Water Resources Research, v.21, p. 1095-1104.
Celico, P., Dall'Aglio, M., Ghiara, M. R., Stanzione, D., Brondi, M, and Prosperi, M., 1992,Geochemical monitoring of the thermal fluids in the Phlegraean Fields from 1970 to 1990:Bollettino della Scoieta Geologica Italiana, v. 111, p. 409-422.
CGWB, 1999, High Incidence of arsenic in groundwater in West Bengal: Central GroundWater Board, Ministry of Water Resources, Goverment of India.
CH2M Hill, 1990, Spatial distribution and temporal variations of arsenic in the AlbuquerqueBasin (subtasks 3D and 3E report): Albuquerque, CH2M Hill report.
-, 1991, Executive Summary, Task 3-Arsenic characterization (subtask 3F): CH2M Hill reportto the City of Albuquerque Public Works Department, April 5, 1991, 7 p.
-, 1994, Milltown Supefund Site supplemental data interpretation of geochemical releasemechanisms and arsenic fate and transport: Helena, Montana, USEPA.
Chague-Goff, C., Rosen, M. R., and Eser, P., 1999, Sewage effluent discharge andgeothermal input in a natural wetland, Tongariro Delta: New Zealand, EcologicalEngineering, v. 12, p. 149-170.
Chakraborty, A. K., and Saha, K.. C., 1987, Arsenical dermatitis from tubewell water in WestBengal: Indian Journal of Medical Research, v. 85, p. 326-334.
Chapin, C. E., and Dunbar, N. W., 1994, A regional perspective on arsenic in waters of theMiddle Rio Grande Basin, New Mexico, in New Mexico Water Resources ResearchInstitute, The water future of Albuquerque and the Middle Rio Grande Basin: NewMexico Water Resources Research Institute, p. 257-276.
Charles, R. W., Buden, R. J. V., and Goff, F., 1986, An interpretation of the alterationassemblages at Sulphur Springs, Valles Caldera, New Mexico: Journal of GeophysicalResearch, Solid Earth and Planets, v. 91, no. B2, p. 1887-1898.
Chatterjee, A., Das, D., Mandal, B. K., Chowdhury, T. R., Samanta, G., and Chakraborti, D.,1995, Arsenic in groundwater in 6 districts of West Bengal, India - the biggest arseniccalamity in the world. 1. Arsenic species in drinking water and urine of the affectedpeople: Analyst, v.120 no. 3, p. 643-650.
CHEMetrics, 1998, Product Catalog.Chen, C. J., Chuang , Y. C., Lin, T. M., and Wu, H. Y., 1985, Malignant neoplasms among
residents of a blackfoot disease-endemic area in Taiwan: high-arsenic artesian well waterand cancers: Cancer Research, v. 45, p. 5895-5899.
Chen, C.-J., Hsu, L.-L, Tseng, C. H., Hsueh, Y.-M., and Chiou, H.-Y., 1999, Emergingepidemics of arseniasis in Asia. In Arsenic: Exposure and Health Effects: in Proceedings,3rd International Conference, Oxford, p. 113-121.
Chen, S. L., Dzeng, S. R., Yang, M. H., Chlu, K. H., Shieh, G. M., and Wai, C. M., 1994,Arsenic species in groundwaters of the Blackfoot Disease Area, Taiwan: EnvironmentalScience & Technology, v. 28, p. 877-881.
Chen, S. L., Yeh , S. J., Yang, M. H., and Lin, T. H., 1995, Trace element concentration andarsenic speciation in the well water of a Taiwan area with endemic Blackfoot disease:Biological Trace Element Research, v. 48, no. 3, p. 263-274.
Chen, X., 2001, Migration of induced-infiltrated stream water into nearby aquifers due toseasonal ground water withdrawal: Ground Water, v. 39, no. 5, p. 721-728.
Cheng, L., Fenter, P., Sturchio, N. C., Zhong, Z., and Bedzyk, M. J., 1999, X-ray standingwave study of arsenite incorporation at the calcite surface: Geochimica et CosmochimicaActa, v. 63, p. 3153-3157.
Cheng, L., Lyman, P. F., Sturchio, N. C., and Bedzyk, M. J., 1997, X-ray standing waveinvestigation of the surface structure of selenite anions adsorbed on calcite: SurfaceScience, v. 382, p. L690-L695.

References Cited 429
Cherry, J. A., Shaikh, A. U., Tallman, D. E., and Nicholson, R. V., 1979a, Arsenic species asan indicator of redox conditions in groundwater: Journal of Hydrology, v. 43, p. 373-392.
Cherry, J. A., Shaikh, D. E., Tallman, D. E., and Nicholson, R. V., 1979b, Arsenic species asan indicator of redox conditions in ground water: Journal of Hydrology, v. 43, p. 373-392.
Chesley, J. T., Halliday, A. N., Kyser, T. K., and Spry, P. G., 1994, Direct dating ofMississippi Valley-Type Mineralization; use of Sm-Nd in fluorite: Economic Geology andthe Bulletin of the Society of Economic Geologists, v. 89, no. 5, p. 1192-1199.
Chitrakar, R. L., and Neku, A., 2001, The scenario of arsenic in drinking water in Nepal:Department of Water Supply & Sewerage, Nepal, 11 p.
Chiu, V. Q., and Hering, J. G., 2000, Arsenic adsorption and oxidation at manganite surfaces:1. Method for simultaneous determination of adsorbed and dissolved arsenic species:Environmental Science & Technology, v. 34, p. 2029-2034.
Choi, Y. S., 1998, Sequence stratigraphy and sedtmentology of the Middle to UpperOrdovician Ancell and Sinnipee Groups, Wisconsin: Ph.D. Dissertation: University ofWisconsin-Madison, 284 p.
Chormann, F. H., Jr.;, 1985, The occurrence of arsenic in soils and stream sediments, Town ofHudson, New Hampshire: M.S.: University of New Hampshire, 222 p.
Chowdhury, T. R., Basu, G. K., Mandal, B. K., Biswas, B. K., Samanta, G., Chowdhury, U.K., Chanda, C. R., Lodh, D., Roy, S. L., Saha, K. C., Roy, Sibtosh, Kabir, Saiful,Quamruzzaman, Qazi, and Chakraborti, D., 1999a, Arsenic poisoning in the Ganges delta,brief communication, Nature, p. 545-546.
Chowdhury, T. R., Basu, G. K., Mandal, B. K., Biswas, B. K., Samanta, G., Chowdhury, U.K., Chanda, C. R., Lodh, D., Roy, S. L., Saha, K. C., Roy, S., Kabir, S., Quamruzzaman,Q., and Chakraborti, D., 1999b, Arsenic poisoning in the Ganges delta: Nature, v. 401, p.545-546.
Chowdhury, T. R., Manal, B. K., Samanta, G., Basu, G. K., Chowdhury, P. P., Chanda, C. R.,Karan, N. K., Lodh, D., Dhar, R. K., Das, D., Saha, K. C., and Chakraborti, D., 1997,Arsenic in groundwater in six districts of West Bengal, India:the biggest arsenic calamityin the world: the status report up to August 1995: in Chappell, W. R., ed., Arsenic:exposure and health effects: London, Chapman and Hall, p. 93-111.
Christensen, B. T., Bertelsen, F., and Gissel-Nielsen, G., 1989, Selenite fixation by soilparticle-size separates: Journal of Soil Science, v. 40, p. 641-647.
Christensen, T. H., Kjeldsen, P., Bjerg, P. L., Jensen, D. L., Christensen, J. B., Baun, A.,Albrechtsen, H.-J., and Heron, G., 2001, Biogeochemistry of landfill leachate plumes:Applied Geochemistry, v. 16, p. 659-718.
City of Albuquerque, 2000, Water quality report: City of Albuquerque annual report tocustomers: City of Albuquerque, 12 p.
Clark, A. H., 1970, Alpha-arsenic sulfide, from Mina Alacnin, Pampa Larga, Chile: AmericanMineralogist, v. 55, p. 1338-1344.
-, 1972, Mineralogy of the Alacran deposit, Pampa Larga, Chile. V. Dimorphite of supergeneorigin: Neues Jahrbuch Fur Mineralogie. Monatshefte, p. 423-429.
Clarke, F. W., 1924, The data of geochemistry: U.S. Geological Survey Bulletin, 770, 841 p.Clarke, M. B., and Helz, G. R., 2000, Metal-thiometalate transport of biologically active trace
elements in sulfidic environments. 1. Experimental evidence for copper thioarsenitecomplexing: Environmental Science & Technology, v. 34, p. 1477-1482.
Cobb, J. C., 1979, Timing and development of mineralized veins during diagenesis in coalbeds: in Neuvieme Congres International de Stratigraphie et de Geologie du Carbonifere,Washington and Champaign-Urbana, p. 371-376.
Colman, J. A., and Lyford, F. P., submitted, Geochemical associations and sources of arsenicin landfill leachate from a landfill in Saco, Maine.

Conlon, T. D., 1998, Hydrogeology and simulation of ground-water flow in the sandstoneaquifer, northeastern Wisconsin: U.S. Geological Survey Water-Resources InvestigationsReport 97-4096, 60 p.
Cook, J., 1987, Left Bank Outfall Drain Stage I Project: scavenger well studies and pilotproject: British Geological Survey, 14 p.
Copard, Y., Disnar, J. R., Becq-Giraudon, J. F., and Boussafir, M., 2000, Evidence and effectsof fluid circulation on organic matter in intramontane coalfields (Massif Central, France):International Journal of Coal Geology, v. 44, no. 1, p. 49-68.
Cordy, G. E., Gellenbeck, D. J., Gebler, J. B., Anning, D. W., Coes, A. L, Edmonds, R. J.,Rees, J. A. H., and Sanger, H. W., 1998, Water quality in the Central Arizona Basins,Arizona, 1995-98: U.S. Geological Survey Circular 1213, 1213, 38 p.
Coston, J. A., Fuller, C. C., and Davis, J. A., 1995, Pb2+ and Zn2+ adsorption by a naturalaluminum- and iron-bearing surface coating on an aquifer sand: Geochimica etCosmochimica Acta, v. 59, p. 3535-3547.
Coveney, R. M., Jr., Goebel, E. D., and Ragan, V. M., 1987, Pressures and temperatures fromaqueous fluid inclusions in sphalerite from Midcontinent country rocks: EconomicGeology, v. 82, no. 3, p. 740-751.
Cox, C. D., and Ghosh, M. M., 1994, Surface complexation of methylated arsenates byhydrous oxides: Water Research, v. 28, p. 1181-1188.
Cox, J. D., Wagman, D. D., and Medvedev, V. A., 1989, CODATA Key Values forThermodynamics, Hemisphere, 271 p.
Craig, H., Boato, G., and White, D., 1956, Isotopic geochemistry of thermal waters: inProceedings of 2nd Conference on Nuclear Processes in Geological Settings, p. 29-38.
Crecelius, E. A., Bloom, N. S., Cowan, C. E., and Jenne, E. A., 1986, Speciation of seleniumand arsenic in natural water and sediments, volume 2: Arsenic speciation: Palo Alto,California, Battelle, Pacific Northwest Laboratories, p. variously paginated.
Criaud, A., and Fouillac, C., 1989, The distribution of arsenic(III) and arsenic(V) ingeothermal waters: Examples from the Massif Central of France, the Island of Dominicain the Leeward islands of the Caribbean, the Valles Caldera of New Mexico, USA, andsouthwest Bulgaria: Chemical Geology, no. 76, p. 259-269.
CSME, 1997, Geology and geochemistry of arsenic occurrences in groundwater of sixdistricts of West Bengal: Centre for Study of Man & Environment, Calcutta.
Cullen, W. R., and Reimer, K. J., 1989, Arsenic speciation in the environment: ChemicalReviews, v. 89, p. 713 - 764.
Culvert, H. V., 1967, Low-temperature specific heat of arsenic and antimony: PhysicalReview, v. 157, p. 560-563.
Cutnmings, D. E., Caccavo, F. J., Fendorf, S., and Rosenweig, R. F., 1999, Arsenicmobilization by the dissimilatory Fe(III)-reducing bacterium Shewanella alga BrY:Environmental Science & Technology, v. 33, p. 723-729.
Dana, E. S., and Ford, W. E. A., 1949, Textbook of Mineralogy: New York, John Wiley andSons, 851 p.
D'Angelo, D., Norton, S. A., and Loiselle, M. C., 1996, Historical uses and fate of arsenic inMaine: M.S.: Water Research Institute, 33 p.
Darby, d. E. C., 1980, Arsenic and boron in the Tongonan environment: Geothermal ResourceCouncil Transactions, v. 4, p. 671-674.
Darland, J. E., and Inskeep, W. P., 1997a, Effects of pH and phosphate competition on thetransport of arsenate: Journal of Environmental Quality, v. 26, p. 1133-1139.
-, 1997b, Effects of pore water velocity on the transport of arsenate: Environmental Science &Technology, v. 31, p. 704-709.
Das, D., Chatterjee, A., Mandal, B. K., Samanta, G., Chakraborti, D., and Chanda, B., 1995,Arsenic in ground-water in 6 districts of West Bengal, India - the biggest arsenic calamity
430 References Cited

in the world. 2. Arsenic concentration in drinking-water, hair, nails, urine, skin-scale andliver-tissue (biopsy) of the affected people: Analyst, v. 120, no. 3, p. 917-924.
Das, D., Samanta, G., Mandal, B. K., Chowdhury, T. R., Chanda, C. R., Chowdhury, P. P.,Basu, G. K., and Chakraborti, D., 1996, Arsenic in groundwater in six districts of WestBengal, India: Environmental Geochemistry and Health, v. 18, no. 1, p. 5-15.
Davies, J., 1994, The hydrogeochemistry of alluvial aquifers in Central Bangladesh: inMcCall, G. J. H., ed., Groundwater Quality: AGID Special Publication, Chapman andHall, London, p. 9–18.
-, 2001, Geology and sedimentology: in Kinniburgh, D. G., and Smedley, P. L., eds., Arseniccontamination of groundwater in Bangladesh: British Geological Survey Technical ReportWC/00/19: Keyworth, p. 17-46.
Davis, C. C., Knocke, W. R., and Edwards, M., 2001, Implications of aqueous silica sorptionto iron hydroxide: Mobilization of iron colloids and interference with sorption of arsenateand humic substances: Environmental Science & Technology, v. 35, p. 3158-3162.
Davis, J. A., Coston, J. A., Kent, D. B., and Fuller, C. C., 1998, Application of the surfacecomplexation concept to complex mineral assemblages: Environmental Science &Technology, v. 32, p. 2820-2828.
Davis, J. A., James, R. O., and Leckie, J. O., 1978, Surface ionization and complexation at theoxide/water interface. I. Computation of electrical double layer properties in simpleelectrolytes: Journal of Colloid and Interface Science, v. 63, p. 480-499.
Davis, J. A., and Kent, D. B., 1990, Surface complexation modeling in aqueous geochemistry:in Hochella, M. F., and White, A. F., eds., Mineral-Water Interface Geochemistry:Washington, D. C., Mineralogical Society of America, p. 177-248.
Davis, M. K., Reich, K. D., and Tikkanen, M. W., 1994, Nationwide and California arsenicoccurrence studies: in W.R. Chappell, C. O. A., and C.R. Cothern, ed., Arsenic exposureand health: Northwood, England, Science and Technology Letters, p. 31-40.
DCH, 1997, Arsenic pollution in groundwater of Bangladesh: Dhaka, Dhaka CommunityHospital Trust.
De Carlo, E. H., and Thomas, D. M., 1985, Removal of arsenic from geothermal fluids byadsorptive bubble flotation with colloidal ferric hydroxide: Environmental Science &Technology, v. 19, p. 538-544.
de Senarmont, H., 1851, Sur la formation des mineraux par voie humide dans les gitsmetallifered concretionnes.: Annales de Chimie et de Physique, v. 32, p. 129-175.
De Vitre, R., Belzile, N., and Tessier, A., 1991, Speciation and adsorption of arsenic ondiagenetic iron oxyhydroxides: Limnology and Oceanograpy, v. 36, p. 1480-1485.
Deely, J. M., and Sheppard, D. S., 1996, Whangaehu River, New Zealand: Geochemistry of ariver discharging from an active crater lake: Applied Geochemistry, v. 11, p. 447-460.
DeKonnick, L. L., 1909, The precipitation of arsenic with hydrogen sulfide: Bulletin desSocietes Chimiques Belges, v. 23, p. 88-94.
Del Razo, L. M., Arellano, M. A., and Cebrain, M. E., 1990, The oxidation states of arsenic inwell-water from a chronic arsenicism area of northern Mexico: Environmental Pollution,v. 64, p. 143-153.
Demuth, J., and Avouris, P., 1983, Surface spectroscopy: Physics Today, p. 62-68.Dennehy, K. F., Litke, D. W., and McMahon, P. B., 2002, The High Plains Aquifer, USA:
groundwater development and sustainability: in Hiscock, K. M. R., M.O.; Davison, R.M.,ed., Sustainable Groundwater Development: London, The Geological Society of London,p. 99-119.
Dipankar, D., Amit, C., Samanta, G., Mandal, B. K., Chowdhury, T. R., Samanta, G.,Chowdhury, P. P., Chanda, C. R., Gautam, B., Dilip, L., Swarup, N., Chakroborty, T.,Mandal, S., Bhattacharya, S. M., and Chakraborti, D., 1994, Arsenic contamination in
References Cited 431

groundwater in six districts of West Bengal, India: the biggest arsenic calamity in theworld: Analyst, v. 119, no. 12, p. 168N-170N.
Douglass, D. L., Shing, C., and Wang, G., 1992, The light-induced alteration of realgar topararealgar: American Mineralogist, v. 77, p. 1266-1274.
Dove, P. M., and Rimstidt, J. D., 1985, The solubility and stability of scorodite,American Mineralogist, v. 70, p. 838-844.
Dowdle, P. R., Laverman, A. M., and Oremland, R. S., 1996, Bacterial dissimilatoryreduction of arsenic(V) to arsenic(III) in anoxic sediments: Applied and EnvironmentalMicrobiology, v. 62, p. 1664-1669.
Doyle, T. A., Davis, A., and Runnells, D. D., 1994, Predicting the environmental stability oftreated copper smelter flue dust: Applied Geochemistry, v. 9, p. 337-350.
DPHE/BGS/MML, 1999, Groundwater studies for arsenic contamination in Bangladesh.Phase I: Rapid Investigation Phase.
Drever, J. I., 1997, The Geochemistry of Natural Waters: Surface and GroundwaterEnvironments, Prentice-Hall, 436 p.
Drummond, S. E., and Ohmoto, H., 1985, Chemical evolution and mineral deposition inboiling hydrothermal systems: Economic Geology, v. 80, p. 126-147.
Dunning, G. E., 1988, Calcium arsenate minerals. New to the Getchell mine, Nevada:Mineralogical Record, v. 19, p. 253-257.
Dziegielewski, B., Sharma, S., Bik, T., Margono, H., and Yang, X., 2002, Analysis of wateruse trends in the United States: 1950-1995: Southern Illinois University, under 1999 U.S.Geological Survey National Competitive Grant No. 99HQGR0222, Subgrant No. 00-312.
Dzombak, D., and Morel, F., 1990a, Surface Complexation Modeling: Hydrous Ferric Oxide:New York, Wiley, 393 p.
Dzombak, D. A., and Morel, F. M. M., 1990b, Surface complexation modeling: HydrousFerric Oxide: Wiley, p. 393.
Eary, L. E., 1992, The solubility of amorphous from 25 to 90°C: Geochimica etCosmochimica Acta, v. 56, p. 2267-2280.
Eary, L. E., and Schramke, J. A., 1990, Rates of Inorganic Oxidation Reactions InvolvingDissolved Oxygen: in Melchior, D. C., and Bassett, R. L., eds., Chemical Modeling ofAqueous Systems II, American Chemical Society Symposium 416, p. 379-396.
Eckel, E. B., 1997, Minerals of Colorado, Fulcrum, 665 p.Egawa, H., Nonaka, T., and Maeda, H., 1985, Studies of selective absorption resins XXII:
Removal and recovery of arsenic ion in geothermal power waste solution with chelatingresin containing mercapto groups: Separation Science and Technology, v. 20, p. 653-664.
Eggleton, R. A., and Fitzpatrick, R. W., 1988, New data and a revised structural model forferrihydrite: Clays and Clay Minerals, v. 36, p. 111-124.
Ehrlich, H. L., 1996, Geomicrobiology: New York, Marcel Dekker Inc.Eick, M. J., Peak, J. D., Brady, P. V., and Pesek, J. D., 1999, Kinetics of lead
adsorption/desorption on goethite: Residence time effect: Soil Science Society of AmericaJournal, v. 42, p. 28-39.
Elkhatib, E. A., Bennett, O. L., and Wright, R. J., 1984a, Arsenite sorption and desorption insoils: Soil Science Society of America Journal, v. 48, p. 1025-1030.
-, 1984b, Kinetics of arsenite sorption in soils: Soil Science Society of America Journal, v. 48,p. 758-762.
Elliott, W. C., and Aronson, J. L., 1987, Alleghanian episode of K-bentonite illitization in thesouthern Appalachian Basin: Geology, v. 15, p. 735-739.
Ellis, A. J., 1967, The chemistry of some explored geothermal systems: in Barnes, H. L., ed.,Geochemistry of Hydrothermal Ore Deposits: New York, Holt, Rinehart, arid WinstonInc., p. 465-514.
432 References Cited

Ellis, A. J., and Mahon, A., 1977, Chemistry and Geothermal Systems: New York, AcademicPress, 392 p.
Ellis, A. J., and Mahon, W. A. J., 1964, Natural hydrothermal systems and experimental hot-water/rock interactions: Geochimica et Cosmochimica Acta, v. 28, p. 1323-1357.
-, 1967, Natural hydrothermal systems and experimental hot water/rock interactions (Part II):Geochimica et Cosmochimica Acta, v. 31, p. 519-538.
EMC2, 2000, Milltown Reservoir Draft Focused Feasibility Study Report: Anaconda, ARCO.Emerson, S., Kalhorn, S., Jacobs, L., Tebo, B. M., Nealson, K. H., and Rosson, R. A., 1982,
Environmental oxidation rate of manganese(II): bacterial catalysis: Geochimica etCosmochimica Acta, v. 46, p. 1073-1079.
Engesgaard, P., and Kipp, K. L., 1992, A geochemical transport model for redox-controlledmovement of mineral fronts in groundwater flow systems: A case of nitrate removal byoxidation of pyrite: Water Resources Research, v. 28, p. 2829-2843.
Engesgaard, P., and Traberg, R., 1996, Contaminant transport at a waste residue deposit, 2,Geochemical transport modeling: Water Resources Research, v. 32, p. 939-951.
ENSR, 1991, Preliminary phase I remedial investigation report- Milltown reservoir sedimentssuperfund site: Executive summary for exhibits I, II and III.: Fort Collins, Colorado,ENSR Consulting and Engineering.
-, 1992, Milltown reservoir sediments superfund site, remedial investigation: Fort Collins,Colorado, ENSR Consulting and Engineering.
Erickson, R. L., Chazin, B., and Erickson, M. S., 1988, Summary geochemical maps of theHarrison 1 x 2 degree quadrangle, Arkansas and Missouri:, U. S. Geological SurveyMiscellaneous Field Studies Map MF-1994-A, p. 1 sheet.
Erickson, R. L. Erickson, M. S., Chazin, B., Baxter, J. W., Masters, J. M., and Eidel, J. J.,1987, Subsurface geochemical investigation in western and southern Illinois; a pilot study:Illinois Mineral Notes, v. 98, p. 45.
Erickson, R. L., Erickson, M. S., Mosier, E. L., and Chazin, B., 1991, Geochemical studies ofsubsurface carbonate rocks: in Martin, J. A., and Pratt, W. P., eds., Geology and mineral-resource assessment of the Springfield 1 by 2 degrees quadrangle, Missouri, as appraisedin September 1985: U. S. Geological Survey Bulletin 1942, p. 51-52.
Erickson, R. L., Mosier, E. L., Odland, S. K., and Erickson, M. S., 1981, A favorable belt forpossible mineral discovery in the subsurface Cambrian rocks in southern Missouri:Economic Geology, v. 76, p. 921-933.
Erickson, R. L., Mosier, E. L., and Viets, J. G., 1978, Generalized geologic and summarygeochemical maps of the Rolla 1 x 2 degree quadrangle, Missouri: U. S. GeologicalSurvey Miscellaneous Field Studies Map MF-1004-A, scale 1:250,000.
Erickson, R. L., Mosier, E. L., Viets, J. G., Odland, S. K., and Erickson, M. S., 1983,Subsurface geochemical exploration in carbonate terraines; Midcontinent, U.S.A.: inKisvarsanyi, G., Grant, S. K., Pratt, W. P., and Koenig, J. W., eds., Internationalconference on Mississippi Valley-type lead-zinc deposits; proceedings volume: Rolla,Missouri, University of Missouri Press, p. 575-583.
Eskenazy, G. M., 1995, Geochemistry of arsenic and antimony in Bulgarian coals: ChemicalGeology, v. 119, no. 1-4, p. 239-254.
Evans, M. A., and Battles, D. A., 1999, Fluid inclusion and stable isotope analyses of veinsfrom the central Appalachian Valley and Ridge province: Implications for regionalsynorogenic hydrologic structure and fluid migration: Geological Society of AmericaBulletin, v. 111, no. 12, p. 1841-1860.
Ewers, G. R., 1977, Experimental hot water-rock interactions and their significance to naturalhydrothermal systems in New Zealand: Geochimica et Cosmochimica Acta, v. 41, p. 143-150.
References Cited 433

Ewers, G. R., and Keays, R. R., 1977, Volatile and precious metal zoning in the Broadlandsgeothermal field, New Zealand: Economic Geology, v. 72, p. 1337-1354.
Farmer, V. C., Krishnamurti, G. S. R., and Huang, P. M., 1991, Synthetic allophane andlayer-silicate formation in systems at 23°C and 89°C ina calcareous environment: Clays and Clay Minerals, v. 39, p. 561-570.
Faure, G., 1998, Principles and Applications of Geochemistry: Upper Saddle River, NewJersey, Prentice Hall, 600 p.
Federal Register, 2001, National Primary Drinking Water Regulations; Arsenic andClarifications to Compliance and New Source Contaminants Monitoring; Final Rule:Office of the Federal Register, v. 66, no. 14, p. 6975-7066.
Feldman, P., and Rosenboom, J. W., 2000, Cambodia drinking water quality assessment:Government of Cambodia.
Fendorf, S., Eick, M. J., Grossl, P., and Sparks, P. D. L., 1997, Arsenate and chromateretention mechanisms on goethite. 1. Surface structure: Environmental Science &Technology, v. 31, no. 2, p. 315-326.
Ferguson, J. F., and Gavis, J., 1972, A review of the arsenic cycle in natural waters: WaterResearch, v. 6, p. 1259-1274.
Finlayson, J. B., and Webster, J. G., 1989, Arsenic, iron and silica in effluent and sinters ofthe Wairakei borefield: DSIR Chemistry Division, 89/17, 22 p.
Fishman, M. J., 1993, Methods of analysis by the U.S. Geological Survey National WaterQuality Laboratory--Determination of inorganic and organic constituents in water andfluvial sediments: U.S. Geological Survey Open-File Report 93-125, 217 p.
Fishman, M. J., and Friedman, L. C., 1989, Methods for the determination of inorganicsubstances in water and fluvial sediments: U.S. Geological Survey Techniques of Water-Resources Investigations, Book 5, Chapter Al , 545 p. p.
Fishman, N. S., 1997, Basin-wide fluid movement in a Cambrian paleoaquifer: Evidence fromthe Mt. Simon Sandstone, Illinois and Indiana.
Flint, R. F., 1957, Glacial and Pleistocene geology: London, John Wiley and Sons, Inc., 553
p.Focazio, M. J., Welch, A. H., Watkins, S. A., Helsel, D. R., and Horn, M. A., 2000, A
retrospective analysis on the occurrence of arsenic in public ground-water resources of theUnited States and limitations in drinking-water-supply characterizations: U.S. GeologicalSurvey Water-Resources Investigations Report 99-4179, 21 p.
Foerster, F., and Pressprich, H., 1927, On the electromotive force behavior of the arsenious-arsenic acid solutions: Z.eitschrift fur Elektrochemie, v. 33, p. 176-181.
Forbes, G. S., Estill, H. W., and Walker, O. J., 1922, Induction period in reactions betweenthiosulfate and arsenite or arsenate: a useful clock reaction: Journal of the AmericanChemical Society, v. 44, p. 97-102.
Fordham, A. W., and Norrish, K., 1979, Arsenate-73 uptake by components of several acidicsoils and its implications for phosphate retention: Australian Journal of Soil Research, v.17, p. 307-316.
Fordyce, F. M., Williams, T. M., Paijitprapapon, A., and Charoenchaisri, P., 1995,Hydrogeochemistry of arsenic in an area of chronic mining-related arsenism, Ron PhibunDistrict, Nakhon Si Thammarat Province, Thailand: preliminary results: British GeologicalSurvey, 73 p.
Foster, A. L., 1999, Partitioning and Transformation of Arsenic and Selenium in Natural andLaboratory Systems: Ph.D.: Stanford University, 225 p.
Foster, A. L., Breit, G. N., Welch, A. H., Whitney, J. W., Yount, J. C., Islam, M. S., Alam, M.M., Islam, M. K., and Islam, M. N., 2000a, In-situ identification of arsenic species in soiland aquifer sediment from Ramrail, Brahmanbaria, Bangladesh: American GeophysicalUnion Fall Meeting Supplement, p. H21D-01.
434 References Cited

Foster, A. L., Breit, G. N., Whitney, J. W., Welch, A. H., Yount, J. C., Alam, M. K., Islam,M. N., Islam, M. S., Karim, M., and Manwar, A., 2000b, X-ray absorption fine structurespectroscopic investigation of arsenic species in soil and aquifer sediments fromBrahmnabaria, Bangladesh: in 4th Annual Arsenic Conference, San Diego, Jun 18-22,2000.
Foster, A. L., Brown, G. E., Jr., Parks, G. A., and Tingle, T. N., 1998a, Quantitativespeciation of arsenic in mine tailings using x-ray absorption spectroscopy: AmericanMineralogist, v. 89, p. 553-568.
Foster, A. L., Brown, G. E. J., and Parks, G. A., 1998b, X-ray absorption fine-structurespectroscopy study of photocatalyzed, heterogeneous As(III) oxidation on kaolin andanatase: Environmental Science & Technology, v. 32, p. 1444-1452.
Founder, R. O., and Potter, R. W., 1982, A revised and expanded silica (quartz)geothermometer: Geothermal Resource Council Bulletin, v. 11, no. 10, p. 3-12.
Fournier, R. O., Thompson, J. M., and Hutchison, R. A., 1986, Fluctuations in composition ofCistern Spring, Morris Geyser Basin, Yellowstone National Park, Wyoming - variableboiling and mixing 1962-1985: in Proceedings, 5th Water-Rock Interaction Symposium,Reykjavik, Iceland, p. 206-209.
-, 1992, The geochemistry of hot spring waters at Norris Geyser Basin, Yellowstone NationalPark, USA: in 7th Water-Rock Interaction Symposium, Park City, Utah, USA., p. 1289-1292.
Fournier, R. O., and Truesdell, A. H., 1973, An empirical Na-K-Ca geothermometer fornatural waters: Geochimica et Cosmochimica Acta, v. 37, p. 515-525.
Fowler, A. D., and Anderson, M. T., 1991, Geopressure zones as proximal sources ofhydrothermal fluids in sedimentary basins and the origin of mississippi valley-typedeposits in shale-rich sequences: Institution of Mining and Metallurgy, Transactions,Section B: Applied Earth Science, v. 100, p. B14-B18.
Franke, O. L., DeHan, R. S., Cleaves, E. T., Job, C. A., Anzzolin, A. R., Wilber, W. G., andLapham, W. W., 1997, Conceptual frameworks for ground-water-quality monitoring,Denver, p. 94.
Frazier, W. J., and Schwimmer, D. R., 1987, Regional stratigraphy of North America, PlenumPress, New York, 719 p.
Freeman, M. C., 1985, The reduction of arsenate to arsenite by an Anabaena-bacteriaassemblage isolated from the Waikato River: New Zealand Journal of Marine andFreshwater Research, v. 19, p. 277-282.
Frey, M. M., and Edwards, M. A., 1997, Surveying arsenic occurrence: Journal of theAmerican Water Works Association, v. 89, no. 3, p. 105-117.
Frost, F., Frank, D., Pierson, K., Woodruff, L., Raasina, B., Davis, R., and Davies, J., 1993, Aseasonal study of arsenic in ground water, Snohomish County, Washington, USA:Environmental Geochemistry and Health, v. 15, p. 209-214.
Frost, R. R., and Griffin, R. A., 1977, Effect of pH on adsorption of arsenic and seleniumfrom landfill leachate by clay minerals: Soil Science Society of America Journal, v. 41, p.53-57.
Fuller, C. C., and Davis, J. A., 1989, Influence of coupling of sorption and photosyntheticprocesses on trace element cycles in natural waters: Nature, v. 340, p. 52-54.
Fuller, C. C., Davis, J. A., Coston, J. A., and Dixon, E., 1996, Characterization of metaladsorption variability in a sand and gravel aquifer, Cape Cod, Massachusetts, U.S.A.:Journal of Contaminant Hydrology, v. 22, p. 165-187.
Fuller, C. C., Davis, J. A., and Waychunas, G. A., 1993, Surface-chemistry of ferrihydrite. 2.Kinetics of arsenate adsorption and coprecipitation: Geochimica et Cosmochimica Acta, v.57, p. 2271-2282.
References Cited 435

Gao, Y., and Mucci, A., 2001, Acid base reactions, phosphate and arsenate complexation, andtheir competitive adsorption at the surface of goethite in 0.7 M NaCl solution: Geochimicaet Cosmochimica Acta, v. 65, p. 2361- 2378.
Garbarino, J. R., 1999, Methods of Analysis by the U.S. Geological Survey National WaterQuality Laboratory--Determination of Dissolved Arsenic, Boron, Lithium, Selenium,Strontium, Thallium, and Vanadium Using Inductively Coupled Plasma-MassSpectrometry: U.S. Geological Survery Open-File Report 99-093, 31 p.
Garrett, A. B., Holmes, O., and Laube, A., 1940, The solubility of arsenious oxide in dilutesolutions of hydrochloric acid and sodium hydroxide. The character of the ions of trivalentarsenic. Evidence for polymerization of arsenious acid: Journal of the American ChemicalSociety, v. 62, p. 2024-2028.
Garven, G., 1985, The role of regional fluid flow in the genesis of the Pine Point Deposit,Western Canada sedimentary basin: Economic Geology and the Bulletin of the Society ofEconomic Geologists, v. 80, no. 2, p. 307-324.
Garven, G., Ge, S., Person, M. A., and Sverjensky, D. A., 1993, Genesis of stratabound oredeposits in the Midcontinent basins of North America; 1, The role of regional groundwaterflow: American Journal of Science, v. 293, no. 6, p. 497-568.
Gaus, I., Webster, R., and Kinniburgh, D. G., 2001, Scales of variation: in Kinniburgh, D. G.,and Smedley, P. L., eds., British Geological Survey Technical Report WC/00/19:Keyworth, p. 161-173.
Gavrieli, I., Zheng, Y., van Geen, A., Stute, M., Dhar, R., Ahmed, M. A., Simpson, J., andGoldstein, S. L., 2000, Hydrogeochemical study of arsenic contamination in Bangladeshgroundwater - the role of redox condition: in Goldschmidt 2000, Oxford, UK, p. 435.
Gayer, R., Rickard, D., 1994, Colloform Gold in Coal from Southern Wales: Geology, v. 22,p. 35-38.
Gayer, R. A., Cole, J. E., Frodsham, K., Hartley, A. J., Hillier, B., Miliorizos, M., and White,S. C., 1991, The role of fluids of the evolution of the South Wales Coalfield forelandbasin: in Proceedings of the Annual conference of the Ussher Society, Bristol, p. 380-384.
Gayer, R. A., Rose, M., Dehmer, J., and Shao, L. Y., 1999, Impact of sulphur and traceelement geochemistry on the utilization of a marine-influenced coal; case study from theSouth Wales Variscan foreland basin: in Proceedings, Geochemistry of coal and its impacton the environment and human health, Amsterdam, p. 151 -174.
German, J. M., 1989, Geologic setting and genesis of gold deposits of the Dahlonega andCarroll County gold belts, Georgia: Economic Geology and the Bulletin of the Society ofEconomic Geologists, v. 84, no. 4, p. 903-923.
Gerth, J., Bruemmer, G. W., and Tiller, K. G., 1993, Retention of Ni, Zn and Cd by Si?associated goethite: Z. Pflanzenern. Bodenk, v. 156, p. 123-129.
Ghosh, M. M., and Teoh, R. S., 1985, Adsorption of arsenic on hydrous aluminum oxide: in7th Mid-Atlantic Industrial Waste Conference, Lancaster, Pennsylvania, p. 139-155.
Ghosh, M. M., and Yuan, J. R., 1987, Adsorption of inorganic arsenic and organoarsenicalson hydrous oxides: Environmental Progress, v. 6, p. 150-157.
Ghosh, S., and De, S., 1995, Source of the arsenious sediments at Kachua and Itina, HabraBlock, North 24 Paraganas, West Bengal - a case study: Indian Journal of Earth Sciences,v. 22, p. 183-189.
Gibbons, R. D., 1994, Statistical Methods for Groundwater Monitoring: New York, Wileyand Sons, 286 p.
Giggenbach, W. F., 1971, Isotopic composition of waters of the Broadlands Geothermal field:New Zealand Journal of Science, v. 14, p. 961-969.
1988, Geothermal solute equilibria. Derivation of Na-K-Mg-Ca geoindicators: Geochimicaet Cosmochimica Acta, v. 52, p. 2749-2765.
436 References Cited

References Cited 437
Gihring, T. M., Druschel, G. K., McCleskey, R. B., Hamers, R. J., and Banfield, J. F., 2001,
Glancy, P. A., 1986, Geohydrology of the basalt and unconsolidated sedimentary aquifers in
Gluskoter, H. J., Kuhn, J. K., and Miller, W. G., 1977, Organic and inorganic affinities of
God, R., and Zemann, J., 2000, Native arsenic - realgar mineralization in marbles from
Goff, F., and Gallaher, B., 2001, Volcanic and hydrothermal evolution of Valles Caldera,
Goff, F., Shevenell, L., Gardner, J. N., Vuataz, F. D., and Grigsby, C. O., 1988, The
Goldberg, A., and Glaubig, R. A., 1988a, Anion sorption on a calcareous, montmorillonitic
Goldberg, S., 1986, Chemical modeling of arsenate adsorption on aluminum and iron oxide
Goldberg, S., and Glaubig, R. A., 1988b, Anion sorption on a calcareous, montmorillonitic
Goldberg, S., and Johnston, C. T., 2001, Mechanisms of arsenic adsorption on amorphous
Goldberg, S. A., and Steltenpohl, M. G., 1990, Timing and characteristics of Paleozoic
Goldfarb, R., Groves, D. I., and Gardoll, S., 2001, Orogenic gold and geologic time: A global
Goldhaber, M. B., 1983, Experimental study of metastable sulfur oxyanion formation during
Goldhaber, M. B., Bigelow, R. C., Hatch, J., and Pashin, J. C., 2000, Distribution of a suite of
Goldhaber, M. B., Church, S. E., Doe, B. R., Aleinikoff, J. N., Brannon, J. C., Podosek, F. A.,
Goldhaber, M. B., Irwin, E., Atkins, B., Lee, L., Black, D. D., Zappia, H., Hatch, J. R.,Pashin, J. C., Barwick, L. H., Cartwright, W. E., Sanzolone, R., Ruppert, L. F., Kolker, A.,and Finkelman, R., 2001, Arsenic in stream sediments of northern Alabama: U.S.Geological Survey Miscellaneous Field Studies Map MF-2357.
Goldhaber, M. B., Rowan, E. L., Hatch, J. R., Zartman, R. E., Pitman, J. K., and Reynolds, R.L., 1994, The Illinois Basin as a flow path for low temperature hydrothermal fluids: inProceedings, Illinois Basin energy and mineral resources workshop, United States, p. 10-12.
Golding, L. A., Timperley, M. H., and Evans, C. W., 1997, Non-lethal responses of thefreshwater snail Potamopyrgus antipodarum to dissolved arsenic: EnvironmentalMonitoring and Assessment, v. 47, p. 239-254.
Rapid arsenite oxidation by Thermus aquaticus and Thermus thermophilus: Field andlaboratory investigations: Environmental Science & Technology, v. 35, p. 3857-3862.
the Fallon area, Churchill County, Nevada: U.S. Geological Survey Water-Supply Paper2263,62 p.
elements in coals: Abstracts with Programs - Geological Society of America, v. 9, no. 7, p.990.
Saualpe, Carinthia, Austria: Mineralogy and Petrology, v. 70, p. 37-53.
New Mexico: Geological Society of America Field Trip Guide, Geological Society ofAmerica field trip #401.
hydrothermal outflow plume of Valles Caldera, New Mexico, and a comparison with otheroutflow plumes: Journal of Geophysical Research, v. 93, no. B6, p. 6041-6058.
soil - Arsenic: Soil Science Society of America Journal, v. 52, p. 1297-1399.
minerals: Soil Science Society of America Journal, v. 50, p. 1154-1157.
soil - selenium: Soil Science Society of America Journal, v. 52, p. 954-958.
oxides evaluated using macroscopic measurements, vibrational spectrosopy, and surfacecomplexation modeling: Journal of Colloid and Interface Science, v. 234, p. 204-216.
deformation and metamorphism in the Alabama inner piedmont: American Journal ofScience, v. 290, p. 1169-1200.
synthesis: Ore Geology Reviews.
pyrite oxidation at pH 6-9 and 30 deg C: American Journal of Science, v. 238, p. 193-217.
elements including arsenic and mercury in Alabama coal: USGS MF 2333.
Mosier, E. L., Taylor, C. D., and Gent, C. A., 1995, Lead and sulfur isotope investigationof Paleozoic sedimentary rocks from the southern Midcontinent of the United States:Implications for paleohydrology and ore genesis of the Southeast Missouri lead belts:Economic Geology, v. 90, no. 7, p. 1875-1910.

438 References Cited
Goleva, G.A., 1974, Metal content of hydrotherms in areas of active volcanism. InHydrothermal Mineral-forming Solutions in the Areas of Active Volcanism, Nauka,Novosibiriskby: New Delhi, Amerind Publishing Co, 113-115 p.
Gooch, F. A., and Whitfield, J. E., 1888, Analysis of waters of the Yellowstone National Parkwith an account of the methods of analysis employed: U.S. Geological Survey Bulletin 47,84 p.
Goodbred, S. L., and Kuehl, S. A., 2000, The significance of large sediment supply, activetectonism, and eustasy on margin sequence development: Late Quaternary stratigraphyand evolution of the Ganges-Brahmaputra delta: Sedimentary Geology, v. 133, p. 227-248.
Gotkowitz, M. B., Schreiber, M. E., and Simo, J. A., 2001, Contrasts in the geologic andhydrochemical occurrences of arsenic contamination of groundwater in eastern Wisconsin:in 47th Institute on Lake Superior Geology, p. 28.
Gotkowitz, M. B., Schreiber, M. E., and Simo, T., 2000, Delineating causes of arseniccontamination of groundwater, eastern Wisconsin: EOS Transactions, AGU Fall MeetingSupplement, v. 81, p. 552.
Grantham, D. A., and Jones, J. F., 1977, Arsenic contamination of water wells in NoviaScotia: American Water Works Association, v. 69, no. 12, p. 653-657.
Grauch, V. J. S., Gillespie, C. L., and Keller, G. R., 1999, Discussion of new gravity maps forthe Albuquerque Basin area, in Albuquerque Geology: in New Mexico Geological SocietyFiftieth Annual Field Conference, p. 119-124.
Grauch, V. J. S., Sawyer, D. A., Keller, G. R., and Gillespie, C. L., 2001, Contributions ofgravity and aeromagnetic studies to improving the understanding of subsurfacehydrogeology, Middle Rio Grande Basin, New Mexico: in Cole, J. C., ed., Fourth annualworkshop of U.S. Geological Survey Middle Rio Grande Basin Study: Albuquerque, NewMexico, U.S. Geological Survey Open-File Report 00-488, p. 3-4.
Gregg, J. M., and Shelton, K. L., 1989, Geochemical and petrographic evidence for fluidsources and pathways during dolomitization and lead-zinc mineralization in SoutheastMissouri: in Proceedings, Mississippi valley-type sulfide diagenesis and its relation tocarbonate paragenesis and basin hydrologic systems: A special session of Annual midyearmeeting, Austin, Texas, p. 153-175.
Gregg, J. M., Shelton, K. L., and Bauer, R. M., 1992, Geochemical and fluid inclusionevidence for regional alteration of Upper Cambrian carbonates by basinal fluids insouthern Missouri source rocks in the southern Midcontinent: in 1990 symposium onsource rocks in the southern Midcontinent, Norman, OK, p. 313-320.
Grenthe, I., Fuger, J., Konings, R. J. M., Lemire, R. J., Muller, A. B., Nguyen-Trung Cregu,C., and Wanner, H., 1992, Chemical Thermodynamics of Uranium, North-Holland:Amsterdam, 715 p.
Grossl, P. R., and Sparks, D. L., 1995, Evaluation of contaminant ion adsorption/desorpton ongoethite using pressure-jump relaxation kinetics: Geoderma, v. 67, p. 87-101.
Grove, D. B., and Stollenwerk, K. G., 1987, Chemical reactions simulated by ground-water-quality models: Water Resources Bulletin, v. 23, p. 601-615.
Groves, D. I., Goldfarb, R. J., Gebre-Mariam, M., Hageman, S. G., and Robert, F., 1998,Orogenic gold deposits: A proposed classification in the context of their crustaldistribution and relationship to other gold deposit types: Ore Geology Reviews, v. 302, p.7-27.
Gruebel, K. A., Davis, J. A., and Leckie, J. O., 1988, The feasibilty of using sequentialextraction techniques for arsenic and selenium in soils and sediments: Soil Science Societyof America Journal, v. 52, p. 390-397.
Gudmundsson, B. T., and Arnorsson, S., in press, Geochemical monitoring of the Krafla andNamafjall geothermal areas, North Iceland: Geothermics.

References Cited 439
Gulens, J., Champ, D. R., and Jackson, R. E., 1979, Influence of Redox Environments on theMobility of Arsenic in Ground Water: in Jenne, E. A., ed., Chemical modeling in aqueoussystems, p. 81-95.
Gulledge, J. H., and O'Conner, J. T., 1973, Removal of arsenic (V) from water by adsorptionon aluminum and ferric hydroxides: Journal - American Water Works Association, v. 65,p. 548-552.
Guo, H. R., Chen, C. J., and Greene, H. L., 1994, Arsenic in drinking water and cancers: abrief descriptive view of Taiwan studies: in Chappell, W. R., Abernathy, C. O., andCothern, C. R., eds., Arsenic Exposure and Health: Northwood, Science and TechnologyLetters, p. 129-138.
Gupta, S. K., and Chen, K. Y., 1978, Arsenic removal by adsorption: Journal of WaterPollution Control Federation, v. 50, p. 493-506.
Gurian, P. L., Small, M. J., Lockwood, J. R., III;, and Schervish, M. J., 2001a, Addressinguncertainty and conflicting cost estimates in revising the arsenic MCL: EnvironmentalScience & Technology, v. 35, no. 22, p. 4414-4420.
Gurian, P. L., Small, M. J., Lockwood, J. R., and Schervish, M. J., 2001b, Benefit-costestimation for alternative drinking water maximum contaminant levels: Water ResourcesResearch, v. 37, no. 8, p. 2213-2226.
Guthrie, G. M., and Lesher, C. M., 1989, Geologic setting of lode gold deposits in thenorthern Piedmont and Brevard Zone, Alabama: U.S. Geological Survey Bulletin 136.
Haack, S. K., and Rachol, C. M., 2000a, Arsenic in ground water in Lapeer County,Michigan: U.S. Geological Survey Fact Sheet 129, 2 p.
-, 2000b, Arsenic in ground water in Livingston County, Michigan: U.S. Geological SurveyFact Sheet 130, 2 p.
-, 2000c, Arsenic in ground water in Genesse County, Michigan: U.S. Geological Survey FactSheet 127, 2 p.
-, 2000d, Arsenic in ground water in Huron County, Michigan: U.S. Geological Survey FactSheet 128, 2 p.
-, 2000e, Arsenic in ground water in Sanilac County, Michigan: U.S. Geological Survey FactSheet 132, 2 p.
-, 2000f, Arsenic in ground water in Shiawassee County, Michigan: U.S. Geological SurveyFact Sheet 131, 2 p.
-, 2000g, Arsenic in ground water in Tuscola County, Michigan: U.S. Geological Survey FactSheet FS 133, 2 p.
-, 2000h, Arsenic in ground water in Washtenaw County, Michigan: U.S. Geological SurveyFact Sheet FS 134, 2 p.
Haack, S. K., and Trecanni, S. L., 2000, Arsenic concentration and selected geochemicalcharacteristics of ground water and aquifer material in southeastern Michigan: U.S.Geological Survey Water Resources Investigations Report 00-4171, 38 p.
Halcrow and DHV, 1995, National Minor Irrigation Development Project - Baseline SurveyWater Quality Part 1: Sir William Halcrow and Partners Ltd, DHV Consultants BV.
Hall, G. E. M., Pelchat, J. C., and Gauthier, G., 1999, Stability of inorganic arsenic(III) andarsenic(V) in water samples: Journal of Analytical Spectrometry, v. 14, p. 205-213.
Hallberg, R. O., and Martinell, R., 1976, Vyredox - in situ purification of groundwater:Ground Water, v. 14, p. 88-93.
Halter, W. E., and Pfeifer, H. R., 2001, Arsenic(V) adsorption onto between 25 and70°C: Applied Geochemistry, v. 16, p. 793-802.
Hamdy, A. A., and Gissel-Nielsen, G., 1977, Fixation of selenium by clay minerals and ironoxides: Z.eitschrift fur Pflanzenernachrung und Bodenkunde, v. 140, p. 63-70.

Hanor, J. S., 1997, Controls on the solubilization of lead and zinc in basinal brines,Carbonate-hosted lead-zinc deposits, Special Publication, Sangster, D.F., ed., Society ofEconomic Geologists, p. 483-500.
Harrison, J. B., and Berkheiser, V., 1982, Anion interactions with freshly prepared hydrousiron oxides: Clays and Clay Minerals, v. 30, p. 97-102.
Hatch, J. R., 1983, Geochemical processes that control minor and trace element compositionof United States coals: in Shanks, W. C., III, ed., Cameron Volume on UnconventionalMineral Deposits, American Intstitute of Mining Engineers, p. 89-98.
Hatch, J. R., Gluskoter, H. J., and Lindahl, P. C., 1976, Sphalerite in coals from the IllinoisBasin: Economic Geology, v. 71, no. 3, p. 613-624.
Hatcher, R. D., Jr., Thomas, W. A., Geiser, P. A., Snoke, A. W., Mosher, S., and Wiltschko,D. V., 1989, Alleghanian Orogen The Appalachian-Ouachita Orogen in the United: in TheGeology of North America, Boulder, Colorado, p. 233-318.
Haury, V., Jann, S., Kofod, M., Scholz, C., and Isenbeck-Schroter, M., 2000, Redox-inducedspecies distribution of arsenic in a suboxic groundwater environment - columnexperiments: in Proceedings of the International Conference on Groundwater Research,Copenhagen, Denmark, p. 197-198.
Hawley, J. W., and Haase, C. S., 1992, Hydrogeologic framework of the northernAlbuquerque Basin: Socorro, New Mexico, Bureau of Mines and Mineral ResourcesOpen-File Report 387.
Hay, R. L., Lee, M., Kolata, D. R., Matthews, J. C., and Morton, J. P., 1988, Episodic potassicdiagenesis of Ordovician tuffs in the Mississippi Valley area: Geology, v. 16, p. 743-747.
Hayes, K. F., 1987, Equilibrium, spectroscopic, and kinetic studies of ion adsorption at theoxide/aqueous interface: Ph.D. Dissertation: Stanford University.
Hayes, K. F., Redden, G., Ela, W., and Leckie, J. O., 1990, Surface complexation models: Anevaluation of model parameter estimation using FITEQL and oxide mineral titration data:Journal of Colloid and Interface Science, v. 142, p. 448-479.
Hayes, T. M., and Boyce, J. B., 1982, Extended x-ray absorption fine structure spectroscopy:Solid State Physics, v. 37, p. 173-348.
Hayes, T. S., Palmer, J. R., Pratt, W. P., Krizanich, G. W., Whitfield, J. W., and Seeger, C.M., 1997, Cross sections showing stratigraphic and depositional lithofacies of UpperCambrian rocks and the relation of lithofacies to potential for mississippi valley-typemineralization in the Harrison 1 degrees X 2 degrees quadrangle, Missouri and Arkansas(folio of the Harrison 1 degrees X 2 degrees quadrangle, Missouri and Arkansas): inMiscellaneous Field Studies Map - U. S. Geological Survey.
He, Z., Gregg, J. M., Shelton, K. L., and Palmer, J. R., 1997, Sedimentary facies control offluid flow and mineralization in Cambro-Ordovician strata, southern Missouri basin-widediagenetic patterns: in SEPM Conference on Basin-wide diagenetic patterns: Integratedpetrologic, geochemical, and hydrologic consideration, Lake Ozark, Missouri, UnitedStates, p. 81-99.
Hearn, P. P., Jr., Sutter, J. F., and Belkin, H. E., 1987, Evidence for late-Paleozoic brinemigration in Cambrian carbonate rocks of the Central and Southern Appalachians;implications for mississippi valley-type sulfide mineralization: Geochimica etCosmochimica Acta, v. 51, no. 5, p. 1323-1334.
Hearn, P. P., and Sutter, J. F., 1985, Authigenic potassium feldspar in Cambrian carbonates;evidence of Alleghanian brine migration: Science, v. 228, no. 4707, p. 1529-1531.
Heinrich, C. A., and Eadington, P. J., 1986a, Thermodynamic predictions of the hydrothermalchemistry of arsenic and their significance for the paragenetic sequence of somecassiterite-arsenopyrite-base metal sulphide deposits: Economic Geology, v. 81, p. 511-529.
440 References Cited

-, 1986b, Thermodynamic predictions of the hydrothermal chemistry of arsenic, and theirsignificance for the paragenetic sequence of some cassiterite-arsenopyrite-base metalsulfide deposits: Economic Geology, v. 81, p. 511-529.
Helgen, S. O., and Moore, J. N., 1996, Natural background determination and impactquantification in trace metal-contaminated river sediments: Environmental Science &Technology, v. 30, no. 1, p. 129-135.
Helz, G. R., Tossell, J. A., Charnock, J. M., Pattrick, R. A. D., Vaughn, D. J., and Garner, C.D., 1995, Oligomerization in As(III) sulfide solution: Theoretical constraints andspectroscopic evidence: Geochimica et Cosmochimica Acta, v. 59, p. 4591-4604.
Hem, J. D., 1985, Study and interpretation of the chemical characteristics of natural water:U.S. Geological Survey Water Supply Paper 2254, 264 p.
Henley, R. W., 1985a, Applied chemistry in the exploration and development of New Zealandgeothermal systems: New Zealand Journal of Technology, v. 1, p. 207-221.
-, 1985b, The geothermal framework of epithermal deposits. In Geology and Geochemistry ofEpithermal Systems: Reviews in Economic Geology, v. 2, p. 1-24.
Hering, J. G., Pen-Yuan, C., Wilke, J. A., and Elimelech, M., 1997, Arsenic removal fromdrinking water during coagulation: Journal of Environmental Engineering, p. 800-807.
Hess, R. E., and Blanchar, R. W., 1976, Arsenic stability in contaminated soils: Soil ScienceSociety of America Journal, v. 40, p. 847-852.
Heyl, A. V., 1983, Geologic characteristics of three major Mississippi Valley districts: inInternational Conference on Mississippi Valley-Type lead-zinc deposits, Rolla, Missouri,United States, p. 27-60.
Hiemstra, T., and Van Riemsdijk, W. H., 1999, Surface structural ion adsorption modeling ofcompetitive binding of oxyanions by metal (hydr)oxides: Journal of Colloid and InterfaceScience, v. 210, p. 182-193.
Hingston, F. J., Posner, A. M., and Quirk, J. P., 1971, Competitive adsorption of negativelycharged ligands on oxide surfaces: Discussions, Faraday Society, v. 52, p. 334-342.
-, 1972, Anion adsorption by goethite and gibbsite: 1. The role of the proton in determiningadsorption envelopes: Journal of Soil Science, v. 23, p. 177-192.
Hinkle, S. R., and Polette, D. J., 1999, Arsenic in ground water of the Willamette Basin,Oregon: U.S. Geological Survey, 98-4205, 28 p.
Hinman, N. W., and Linstrom, R. F., 1996, Seasonal changes in silica deposition in hot springsystems: Chemical Geology, v. 132, p. 237-246.
Hirner, A. V., Krupp, R. E., Gainsford, A. R., and Staerk, H., 1990, Metal-organicassociations in sediments-II: Algal mats in contact with geothermal waters: AppliedGeochemistry, v. 5, p. 507-513.
HLA, 1986, Milltown reservoir feasibility study: Denver, Colorado, Harding LawsonAssociates.
-, 1987, Volume I, Milltown reservoir data report supplemental investigations conductedunder the feasibility study: Denver, Colorado, Harding Lawson Associates.
Hochella, M. F., Jr., 1995, Mineral surfaces: Their characterization and their chemical,physical, and reactive nature: in Vaughan, D. J., and Pattrick, R. A. D., eds., MineralSurfaces: London, Chapman and Hall, p. 17-60.
Hofstra, A. H., and Cline, J., S., 2000, Characteristics and Models for Carlin-Type GoldDeposits: SEG Reviews, v. 13, p. 163-220.
Hornberger, M. I., Lambing, J. H., Luoma, S. N., and Axtmann, E. V., 1997, Spatial andtemporal trends of trace metals in surface water, bed sediment, and biota of the upperClark Fork basin, Montana, 1985-1995: U.S. Geological Survey Open-File Report, 97-669, 127 p.
References Cited 441

Hower, J. C., Wild, G. D., Pollock, J. D., Trinkle, E. J., Bland, A. E., and Fiene, F. L., 1990,Petrography, geochemistry, and mineralogy of the Springfield (western Kentucky No. 9)coal bed: The Journal of Coal Quality, v. 9, no. 3, p. 90-100.
Hsia, T. H., Lo, S. L., and Lin, C. F., 1992, As(V) adsorption on amorphous iron oxide: Triplelayer modelling: Chemosphere, v. 25, p. 1825-1837.
Hsia, T. H., Lo, S. L., Lin, C. F., and Lee, D. Y., 1994, Characterization of arsenateadsorption on hydrous iron oxide using chemical and physical methods: Colloids andSurfaces A: Physiochemical and Engineering Aspects, v. 85, p. 1-7.
Hsu, K. H., Froines, J. R., and Chen, C. J., 1997, Studies of arsenic ingestion from drinkingwater in northeastern Taiwan: chemical speciation and urinary metabolites: in Abernathy,C. O., Calderon, R. L., and Chappell, W. R., eds., Arsenic Exposure and Health Effects:London, Chapman and Hall, p. 190-209.
Huber, G. R., Sacher, M., Vollman, A., Huber, H., and Rose, D., 2000, Respiration ofarsenate and selenate by hyperthermophilic archea: Systematic and Applied Microbiology,v. 23, p. 305-314.
Hultgren, R., Desai, P. D., Hawkins, D. T., Gleiser, M., Kelley, K. K., and Wagman, D. D.,1973, Arsenic. Selected Values of the Thermodynamic Properties of the Elements:American Society for Metals, p. 39-46.
Hydrometrics, 1985, Water resources impacts resulting from proposed rehabilitation of theMilltown Hydroelectric project.: Helena, Montana, Hydrometrics.
Ilchik, R. P., and Barton, M. D., 1997, An amagmatic origin of carlin-type gold deposits:Economic Geology and the Bulletin of the Society of Economic Geologists, v. 92, no. 3, p.269-288.
Imes, J. L., and Emmett, L. F., 1994, Geohydrology of the Ozark Plateaus aquifer system inparts of Missouri, Arkansas, Oklahoma, and Kansas, U.S. Geological Survey ProfessionalPaper, p. D1-D127.
Iqbal, S. Z., 2001, Arsenic contamination in Pakistan.: in UN-ESCAP Meeting: Geology andHealth., Bangkok, Thailand.
Isenbeck-Schröter, M., 1995, Transportconditions of heavy metals and oxoanions - columnexperiments and their modeling: Ber. Geowissenschaften Univ. Bremen (in German), v.67, p. 182.
Isensee, A. R., Kearney, P. C., Woolson, E. A., Jones, G. E., and Williams, V. P., 1973,Distribution of alkyl arsenicals in model ecosystem: Environmental Science &Technology, v. 7, p. 841-845.
ISSI Consulting Group, The Cadmus Group, and ICF Consulting, 2000, Arsenic occurrencein public drinking water supplies: Prepared for the U.S. Environmental Protection Agencyunder contract nos. 68-C7-0005 and 68-C-99-206., EPA-815-R-00-023, 138 p.
Ivakin, A. A., Vorob'eva, S. V., and Gertman, E. M., 1979a, Determination of the second andthird dissociation constants of arsenious acid: Russian Journal of Inorganic Chemistry, v.24, p. 36-40.
Ivakin, A. A., Vorob'eva, S. V., Gertman, E. M., and Voronova, E. M., 1976, Acid-baseequilibria and self-association in arsenious acid solutions: Zhurnal NeorganicheskoyKhimiy, v. 21, p. 442-448.
Ivakin, A. A., Vorobeva, S. V., Gorelov, A. M., and Gertmann, E. M., 1979b, Solubility ofarsenic(III) sulphide in aqueous NaCl solutions: Russian Journal of Inorganic Chemistry,v. 24, p. 1089-1091.
Jacobs, L. W., Syers, J. K., and Keeney, D. R., 1970, Arsenic sorption by soils: Soil ScienceSociety of America, Proceedings, v. 34, p. 750-754.
Jain, A., and Loeppert, R. H., 2000, Effect of competing anions on the adsorption of arsenateand arsenite by ferrihydrite: Journal of Environmental Quality, v. 29, p. 1422-1430.
442 References Cited

Jain, A., Raven, K. P., and Loeppert, R. H., 1999, Arsenite and arsenate adsorption onferrihydrite: Surface charge reduction and net OH- release stoichiometry: EnvironmentalScience & Technology, v. 33, p. 1179-1184.
Jain , C. K., and Ali, I., 2000, Arsenic: Occurrence, toxicity and speciation techniques: WaterResources, v. 34, p. 4304-4312.
Jenne, E. A., 1976, Trace Element Sorption by Sediments and Soils -- Sites and Processes: inChappel, W. R., and Peterson, K. K., eds., Molybdenum in the Environment, Dekker, p.425-553.
Jewell, P. W., and Parry, W. T., 1988, Geochemistry of the Mercury gold deposit (Utah,U.S.A.): Chemical Geology, v. 69, p. 245-265.
Ji, G., and Silver, S., 1995, Bacterial resistance mechanisms for heavy metals ofenvironmental concern: Journal of Industrial Microbiology, v. 14, p. 61-75.
Johnson, D. L., 1971, Simultaneous determination of arsenate and phosphate in naturalwaters: Environmental Science & Technology, v. 5, p. 411-414.
Johnson, G. K., Papatheodorou, G. N., and Johnson, C. E., 1980, The enthalpies of formationand high temperature thermodynamic functions of the arsenic sulfides and
Journal of Chemical Thermodynamics, v. 12, p. 545-57.Jones, B., Renaut, R. W., and Rosen, M. R., 1997, Biogenicity of silica precipitates around
geysers and hot-spring vents, North Island, New Zealand: Journal of Sediment Research,v. 67, p. 88-104.
Joshi, A., and Chaudhuri, M., 1996, Removal of arsenic from ground water by iron coatedsand: Journal of Environmental Engineering, v. 122, p. 769-771.
Junta, J. L., and Hochella, M. F. J., 1994, Manganese (II) oxidation at mineral surfaces: Amicroscopic and spectroscopic study: Geochimica et Cosmochimica Acta, v. 58, p. 4985-4999.
Kanivetsky, R., 2000, Arsenic in Minnesota Ground Water: Hydrogeochemical Modeling ofthe Quaternary Buried Artesian Aquifer and Cretaceous Aquifer Systems: University ofMinnesota, 55, 23 p.
Kaplan, I. R., and Rittenberg, S. C., 1964, Microbiological fractionation of sulphur isotopes:Journal of General Microbiology, v. 34, p. 195-212.
Karagas, M. R., Le, C. X., Morris, S., Blum, J. D., Lu, X., Spate, V., Carey, M., Stannard, V.,Klaue, B., and Tosteson, T. D., 2001, Markers of low level arsenic exposure for evaluatinghuman cancer risks in a US population: International Journal of Occupational Medicineand Environmental Health, v. 14, no. 2, p. 171-175.
Karayigit, A. I., Spears, D. A., and Booth, C. A., 2000, Antimony and arsenic anomalies inthe coal seams from the Gokler Coalfield, Gediz, Turkey: International Journal of CoalGeology, v. 44, no. 1, p. 1-17.
Karpov, G. A., and Naboko, S. I., 1990, Metal contents of recent thermal waters, mineralprecipitates and hydrothermal alteration in active geothermal fluids, Kamchatka: Journalof Geochemical Exploration, v. 36, p. 57-71.
Keating, E. H., and Bahr, J. M., 1998, Reactive transport modeling of redox geochemistry:Approaches to chemical disequilibrium and reaction rate estimation at a site in northernWisconsin: Water Resources Research, v. 34, p. 3573-3584.
Kelley, V. C., 1936, Occurrence of claudetite in Imperial County, California: AmericanMineralogist, v. 21, p. 137-138.
Kent, D. B., Abrams, R. H., Davis, J. A., Coston, J. A., and LeBlanc, D. R., 2000, Modelingthe influence of variable pH on the transport of zinc in a contaminated aquifer usingsemiempirical surface complexation models: Water Resources Research, v. 36, p. 3411-3425.
443References Cited

Kent, D. B., Davis, J. A., Anderson, L. C. D., and Rea, B. A., 1995, Transport of chromiumand selenium in a pristine sand and gravel aquifer: Role of adsorption processes: WaterResources Research, v. 31, p. 1041-1050.
Kent, D. B., Niedan, V. W., Isenbeck-Schroter, M., Stadler, S., Jann, S., Hohn, R., and Davis,J. A., 2001, The influence of oxidation-reduction and adsorption reactions on arsenictransport in the oxic, suboxic, and anoxic zones of a mildly acidic sand and gravel aquifer:in U. S. Geological Survey Workshop on Arsenic in the Environment, Denver, Colorado.
Keon, N. E., Swartz, C. H., Brabander, D. J., Myneni, S. C., and Hemond, H. F., 2000,Evaluation of arsenic mobility in sediments using a validated extraction method: EOSTransactions, AGU Fall Meeting Supplement, v. 81, p. 526.
Kernodle, J. M., McAda, D. P., and Thorn, C. R., 1995, Simulation of ground-water flow inthe Albuquerque Basin, central New Mexico, 1901-1994, with projections to 2020: U.S.Geological Survey, 114 p.
Kerrich, R., and Cassidy, K. F., 1994, Temporal relationships of lode gold mineralization toaccretion, magmatism, metamorphism, and deformation -- Archean to present: A review:Ore Geology Reviews, v. 9, p. 263-310.
Khadka, M. S., 1993, The groundwater quality situation in alluvial aquifers of the KathmanduValley, Nepal.: AGSO Journal of Australian Geology and Geophysics, v. 14, p. 207-211.
Khan, A. A., 1995, Arsenic contamination in groundwater, its causes and mitigation: ageological perspective: in International Conference on Arsenic in Ground Water: Cause,Effect and Remedy, Calcutta, India, p. 43.
Khan, A. A., Imam, B., Akhter, S. H., Hasan, M. A., and Ahmed, K. M. U., 1998, Subsurfaceinvestigation in the arsenic problem areas of Rajarampur, Chanlai and Baragharia;Nawabganj District, Bangladesh: Dhaka, Geohazards Research Group, Department ofGeology, University of Dhaka.
Khramova, G. C., 1974, Effects of intensified activity of the Ebeko Volcano on thecomposition of the water of Goryachoe Lake. In Hydrothermal Mineral-forming Solutionsin the Areas of Active Volcanism, Nauka, Novosibirisk.: in S.I., N., ed.: New Delhi,,Amerind Publishing Co., p. 88-94.
Kim, M.-J., 1999, Arsenic dissolution and speciation in groundwater of southeastMichiganUniversity of Michigan, 201 p.
Kim, M.-J., Nriagu, J. O., and Haack, S. K., 2000, Carbonate ions and arsenic dissolution bygroundwater: Environmental Science & Technology, v. 34, no. 14, p. 3094-3100.
Kinniburgh, D. G., 2001, Sorption and transport: in Kinniburgh, D. G., and Smedley, P. L.,eds., Arsenic contamination of groundwater in Bangladesh: Vol. 2: Final Report. BritishGeological Survey Technical Report WC/00/19: Keyworth, p. 211-228.
Kinniburgh, D. G., Gale, I. N., Smedley, P. L., Darling, W. G., West, J. M., Kimblin, R. T.,Parker, A., Rae, J. E., Aldous, P. J., and O'Shea, M. J., 1994, The effects of historicabstraction of groundwater from the London Basin aquifers on groundwater quality:Applied Geochemistry, v. 9, no. 2, p. 175-196.
Kinniburgh, D. G., and Smedley, P. L., 2001, Arsenic contamination of groundwater inBangladesh, Vol 3 Hydrochemical Atlas, . British Geological Survey Technical ReportWC/00/19: Keyworth, p. 124.
Kipp, K. L., and Parkhurst, D. L., in press, Parallel processing for PHAST - A 3D reactive-transport simulator: in XIV International Conference on Computational Methods in WaterResources, Delft, The Netherlands.
Kirschning, H.-J., and Plieth, K., 1955, Electrochemical studies of the conversion point ofcubic and monoclinic arsenic modifications: Zeitschrift fur Anorganische und AllgemeineChemie, v. 280, p. 346-352.
Klemm, W., Spitzer, H., and Niermann, H., 1963, Investigations of some half-metals:Angewandte Chemie, v. 72, p. 985-994.
444 References Cited

Kneebone, P. E., and Hering, J. G., 2000, Behaviour of arsenic and other redox-sensitiveelements in Crowley Lake, CA: A reservoir in the Los Angeles aqueduct system:Environmental Science & Technology, v. 34, p. 4307-4312.
Koga, A., 1961, Distribution of gold in hot springs at Beppu (in Japanese): Journal of theChemical Society of Japan, v. 82, p. 1476-1478.
Kolker, A., Cannon, W. F., Westjohn, D. B., and Woodruff, L. G., 1998a, Arsenic-rich pyritein the Mississippian Marshall Sandstone: Source of anomalous arsenic in southeasternMichigan ground water: in Geological Society of America Annual Meeting, Toronto,Ontario, p. A-58.
-, 1998b, Arsenic-rich pyrite in the Mississippian Marshall Sandstone: Source of anomalousarsenic in southeatern Michigan ground water: Geological Society of America, 1998Abstracts with Programs, v. 30, no. 7, p. A-59.
Kolker, A., Cannon, W. F., Woodruff, L. G., Westjohn, D. B., Haack, S. K., and Kim, M.-J.,1999, Arsenic in southeastern Michigan ground water: Results of USGS test drilling:EOS, American Geophysical Union Transactions, v. 80, no. 17, p. S146 - S147.
Kolker, A., and Finkelman, R. B., 1998, Potentially hazardous elements in coal: Modes ofoccurrence and summary of concentration data for coal components: Coal Preparation, v.19, p. 133-157.
Konhauser, K. O., and Ferris, F. G., 1996, Diversity of iron and silica precipitation bymicrobial mats in hydrothermal waters, Iceland: Implications for Precambrian ironformations: Geology, v. 24, p. 323-326.
Korte, N., 1991, Naturally occurring arsenic in groundwaters of the midwestern UnitedStates: Environmental Geology and Water Sciences, v. 18, no. 2, p. 137-141.
Koterba, M. T., Wilde, F. D., and Lapham, W. W., 1995, Ground -water data-collectionprotocols and procedures for the National Water-Quality Assessment Program: Collectionand documentation of water quality samples and related data: U.S. Geological SurveyOpen-File Report 95-399, 113 p.
Kotlyar, B. B., Sinder, D. A., Jachens, R. C., and Theodore, T. G., 1998, Regional Analysis ofthe Distribution of Gold Deposits in Northeast Nevada Using NURE Arsenic Data andGeophysical Data: in Tosdal, R. M., ed., Contributions to the Gold Metallogeny ofNorthern Nevada, US Geological Survey, p. 234-242.
Krohelski, J. T., 1986, Hydrogeology and ground-water use and quality, Brown County,Wisconsin: Wisconsin Geological and Natural History Survey Information Circular, 57 p.
Krupp, R. E., 1990, Comment on "As(III) and Sb(III) sulfide complexes: An evaluation ofstoichiometry and stability from existing experimental data by N.F. Spycher and M.H.Reed: Geochimica et Cosmochimica Acta, v. 54, p. 3239-3240.
Krupp, R. E., and Seward, T. M., 1990, Transport and deposition of metals in the Rotokawageothermal system, New Zealand: Mineralium Deposita, v. 25, p. 73-81.
Kucharski, R., 1996, Possible occurrence of an intrusive body in deep Paleozoic basement ofthe Olkusz district, Poland
Carbonate-hosted zinc-lead deposits in the Silesian-Cracow area, Poland, p. 163-165.Kuo, T.-L., 1968, Arsenic content of artesian well water in endemic area of chronic arsenic
poisoning: Reports of the Institute of Pathology of the National Taiwan University, v. 20,p. 7-13.
Kuwabara, J. S., Chang, C. Y., and Pasilis, S. P., 1990, Effects of benthic flora on arsenictransport.: Journal Environmental Engineering, v. 116, p. 394-409.
Kuzel, L, S., 1993, The role of Fe and Mn oxy-hydroxides in contaminated coarse-grainedriver sediment: M.S. Thesis: The University of Montana, 87 p.
La Force, M. J., Hansel, C. M., and Fendorf, S., 2000, Arsenic speciation, seasonaltransformations, and co-distribution with iron in a mine waste-influenced palustrineemergent wetland: Environmental Science & Technology, v. 34, p. 3937-3943.
References Cited 445

Ladeira, A. C. Q., Ciminelli, V. S. T., Duarte, H. A., Alves, M. C. M., and Ramos, A. Y.,2001, Mechanism of anion retention from EXAFS and density functional calculations:Arsenic (V) adsorbed on gibbsite: Geochimica et Cosmochimica Acta, v. 65, p. 1211-1217.
Lambing, J. H., 1991, Water-quality and transport characteristics of suspended sediment andtrace elements in streamflow of the upper Clark Fork basin from Galen to Missoula,Montana, 1985-1990: U.S. Geological Survey Open-File Report, 91-4139, 73 p.
Langmuir, D., 1997, Aqueous Environmental Geochemistry: New Jersey, Prentice-Hall, 600
p.Langner, H. W., and Inskeep, W. P., 2000, Microbial reduction of arsenate in the presence of
ferrihydrite: Environmental Science & Technology, v. 34, p. 3131-3136.Langner, H. W., Jackson, C. R., McDermot, T. R., and Inskeep, W. P., 2001, Rapid oxidation
of arsenite in a hot spring microbial ecosystem: Environmental Science & Technology, v.35, p. 3302-3309.
Lapham, D. M., Barnes, J. H., Downey, W. F., Jr., and Finkelman, R. B., 1980, Mineralogyassociated with burning anthracite deposits of eastern Pennsylvania: Mineral ResourcesReport, v. 78, p. 1-82.
Laverman, A. M., Blum, J. S., Schaefer, J. K., Phillips, E. J. P., Lovley, D. R., and Oremland,R. S., 1995, Growth of strain SES-3 with arsenate and other diverse electron acceptors:Applied and Environmental Microbiology, v. 61, p. 3556-3561.
Leach, D., Viets, J. G., Foley-Ayuso, N., and Klein, D. P., 1995, Mississippi Valley-type Pb-Zn deposits: in du Bray, E. A., ed., Preliminary compilation of descriptivegeoenvironmental mineral deposit models: USGS Open-File Report 95-831, p. 234-243.
Leach, D. L, Plumlee, G. S., Hofstra, A. H., Landis, G. P., Rowan, E. L, and Viets, J. G.,1991, Origin of late dolomite cement by CO2-saturated deep basin brines; evidence fromthe Ozark region, central United States: Geology, v. 19, no. 4, p. 348-351.
Leach, D. L., and Rowan, E. L., 1986, Genetic Link between Ouachita foldbelt tectonism andthe Mississippi Valley-Type lead zinc deposits of the Ozarks: Geology, v. 14, p. 932-935.
Leach, D. L., and Sangster, D. F., 1993, Mississippi valley-type lead-zinc deposits: inKirkham, R. V., Sinclair, W. D., Thorpe, R. I., and Duke, J. M., eds., Mineral depositmodeling, Geological Association of Canada, p. 289-314.
Leach, D. L., Viets, J. G., Kozlowski, A., and Kibitlewski, S., 1997, Geology, geochemistry,and genesis of the Silesia-Cracow zinc-lead district, southern Poland Carbonate-hostedlead-zinc deposits: in Sangster, D. F. e., ed., Special Publication, Society of EconomicGeologists, p. 144-170.
Lee, L., and Goldhaber, M. B., 2001, The distribution of MVT-related metals in acidinsoluble residues of paleozoic rocks in the Ozark plateaus region of the United States:U.S. Geological Survey Open-File Report, 01-0042, 35 p.
Lee, R. C. L., 2000, The effect of Mississippi Valley-type mineralization on the naturalbackground chemistry of groundwater in the Ozark Plateaus region of the United States:M.S. Thesis: Colorado School of Mines, 210 p.
Lesher, C. M., Cook, R. B., and Dean, L. S., 1989, Gold deposits of Alabama: GeologicalSociety of Alabama, 229 p.
Levine, I. N., 1975, Molecular Spectroscopy: New York, John Wiley and Sons, 491 p.Lico, M. S., and Seiler, R. L., 1994, Ground-water quality and geochemistry, Carson Desert,
western Nevada: U.S.Geological Survey Open-File Report 94-31, 91 p.Liger, E., Charlet, L., and Van Cappellen, P., 1999, Surface catalysis of Uranium(VI)
reduction by iron(II): Geochimica et Cosmochimica Acta, v. 63, p. 2939-2955.Lin, Z., and Puls, R. W., 2000, Adsorption, desorption and oxidation of arsenic affected by
clay minerals and aging process: Environmental Geology, v. 39, p. 753-759.Lindgren, W., 1928, Mineral Deposits: New York, McGraw-Hill Book Co., 1049 p.
446 References Cited

Lindorf, D. E., Feld, J., and Connelly, J., 1987, Groundwater sampling procedures guidelines:Wisconsin Department of Natural Resources Publication PUBL-WR-153-87, 44 p.
Lively, R. S., Morey, G. B., and Mossler, J. H., 1997, Element distribution patterns in theOrdovician Galena Group, southeastern Minnesota: Indicators of fluid flow andprovenance of terrigenous material: Economic Geology, v. 92, no. 3, p. 351-359.
Livesey, N. T., and Huang, P. M., 1981, Adsorption of arsenate by soils and its relation toselected chemical properties and anions: Soil Science, v. 131, p. 88-94.
Lo, M.-C., Hsen, Y.-C., and Lin, K.-K., 1977, Second report on the investigation of arseniccontent in underground water in Taiwan: Taiwan Provincial Institute of EnvironmentalSanitation, Taichung, Taiwan.
Lockwood, J. R., III, Schervish, M. J., Gurian, P., and Small, M. J., 2001, Characterization ofarsenic occurrence in US drinking water treatment facility source waters: Department ofStatistics, Carnegie Mellon University, 700, 32 p.
Loehr, T. M., and Plane, R. A., 1968, Raman spectra and structures of arsenious acid andarsenites in aqueous solution: Inorganic Chemistry, v. 7, p. 1708-1714.
Long, H. K., and Farrar, J. W., 1995, Report on the U.S. Geological Survey's evaluationprogram for standard reference samples distributed in October 1994; T-l 31 (traceconstituents), T-133 (trace constituents), M-132 (major constituents), N-43 (nutrients), N-44 (nutrients), P-23 (low ionic strength) and Hg-19 (mercury): U.S. Geological Survey,95-0117, 139 p.
Longtin, J. P., 1988, Occurrence of radon, radium, and uranuim in groundwater: Journal ofthe American Water Works Association, v. 80, no. 7, p. 84-93.
Lowson, R. T., 1982, Aqueous pyrite oxidation by molecular oxygen: Chemical Reviews, v.82, p. 461-497.
Lozinsky, R. P., 1988, Stratigraphy, sedimentology, and sand petrology of the Santa Fe Groupand pre-Santa Fe Tertiary deposits in the Albuquerque Basin, central New Mexico: Ph.D.dissertation: Socorro, New Mexico Institute of Mining and Technology, 298 p.
Lu, F. J., Shih, S. R., Lui, T. M., and Shown, S. H., 1990a, The effect of fluorescent humicsubstances existing in the well water of Blackfoot disease endemic areas in Taiwan onprothrombin time and activated partial thromboplastin time in vitro: Thrombosis Research,v. 57, p. 747-753.
Lu, G., Marshak, S., and Kent, D. V., 1990b, Characteristics of magnetic carriers responsiblefor Late Paleozoic remagnetization in carbonate strata of the mid-continent, U.S.A.: Earthand Planetary Sciences Letters, v. 99, p. 351-361.
Lumsdon, D. G., Fraser, A. R., Russell, J. D., and Livesey, N. T., 1984, New infrared bandassignments for the arsenate ion adsorbed on synthetic goethite Journal ofSoil Science, v. 35, p. 381-386.
Luo, Z. D., Zhang, Y. M., Ma, L., Zhang, G. Y., He, X., Wilson, R., Byrd, D. M., Griffiths, J.G., Lai, S., He, L., Grumski, K., and Lamm, S. H., 1997, Chronic arsenicism and cancer inInner Mongolia - consequences of well-water arsenic levels greater than inAbernathy, C. O., Calderon, R. L., and Chappell, W. R., eds., Arsenic Exposure andHealth Effects: London, Chapman and Hall, p. 55-68.
Ma, H. Z., Xia, Y. J., Wu, K. G., Sun, T. Z., and Mumford, J. L., 1999, Human exposure toarsenic and health effects in Bayingnormen, Inner Mongolia: in Chappell, W. R.,Abernathy, C. O., and Calderon, R. L., eds., Arsenic Exposure and Health Effects.Proceedings of the Third International Conference on Arsenic Exposure and HealthEffects: Amsterdam, Elsevier, p. 127-131.
Macy, J. M., Nunan, K., Hagen, K. D., Dixon, D. R., Harbour, P. J., Cahill, M., and Sly, L. I.,1996, Chrysiogenes arsenatis gen. nov., sp. nov., a new arsenate-respiring bacteriumisolated from gold mine wastewater: Systematic Biology, v. 46, p. 1153-1157.
447References Cited

Macy, J. M., Santini, J. M., Pauling, B. V., O'Neil, A. H., and Sly, L. I., 2000, Two newarsenate/sulfate-reducing bacteria: Mechanisms of arsenate reduction: Archives ofMicrobiology, v. 173, p. 49-57.
Maeda, S., Ohki, A., Kusadome, K., Kuroiwa, T., Yoshifuku, I., and Naka, K., 1992,Bioaccumulation of arsenic and its fate in a freshwater food chain: AppliedOrganometallic Chemistry, v. 6, p. 213-219.
Maeda, S., Wada, H., Kuneda, K., Onoue, M., Ohki, A., Higashi, S., and Takeshita, T., 1987,Methylation of inorganic arsenic by arsenic-tolerant freshwater algae: Journal -Organometallic, v. 1, p. 465-472.
Mahmood, S. N., Naeem, S., Siddiqui, I., and Khan, F. A., 1998, Studies on physico-chemicalnature of ground water of Korangi/Landhi (Karachi). Journal of the Chemical Society ofPakistan, v. 19, p. 42-48.
Mai, H., and Dott, R. H. J., 1985, A subsurface study of the St. Peter Sandstone in southernand eastern Wisconsin: Wisconsin Geological and Natural History Survey InformationCircular, 47 p.
Manceau, A., 1995, The mechanism of anion adsorption on iron oxides: Evidence for thebinding of arsenate tetrahedra on free Fe(O,OH)6 edges: Geochimica et CosmochimicaActa, v. 59, p. 3647-3653.
Manceau, A., and Combes, J., 1988, Structure of Mn and Fe oxides and hydroxides: Atopological approach by EXAFS.: Physics and Chemistry of Minerals, v. 15, p. 283-295.
Manceau, A., Gorshkov, A. I., and Drits, V. A., 1992a, Structural chemistry of Mn, Fe, Co,and Ni in manganese hydrous oxides: Part I. Information from XANES spectroscopy:American Mineralogist, v. 77, p. 1133-1143.
-, 1992b, Structural chemistry of Mn, Fe, Co, and Ni in manganese hydrous oxides: Part II.Information from EXAFS spectroscopy and electron and X-ray diffraction: AmericanMineralogist, v. 77, p. 1144-1157.
Mandal, B. K., Chowdhury, T. R., Samanta, G., Basu, G. K., Chowdhury, P. P., Chanda, C.R., Lodh, D., Karan, N. K., Dhar, R. K., Tamili, D. K., Das, D., Saha, K. C., andChakraborti, D., 1996, Arsenic in groundwater in seven districts of West Bengal, India -the biggest arsenic calamity in the world: Current Science, v. 70, no. 11, p. 976-986.
Manning, B. A., Fendorf, S. E., and Goldberg, S., 1998, Surface structures and stability ofarsenic(III) on goethite: Spectroscopic evidence for inner-sphere complexes:Environmental Science & Technology, v. 32, p. 2383-2388.
Manning, B. A., Fendorf, S. E., and Suarez, D. L., 2002, Arsenic(III) oxidation and As(V)adsorption reactions on synthetic birnessite: Environmental Science & Technology, v. 36,p. 976-981.
Manning, B. A., and Goldberg, S., 1996a, Modeling arsenate competitive adsorption onkaolinite, montmorillonite and illite: Clays and Clay Minerals, v. 44, p. 609-623.
-, 1996b, Modeling arsenate competitive adsorption on kaolinite, montmorillonite and illite,Clays and Clay Minerals, 44:609-623.: Soil Science Society of America Journal, v. 60, p.121-131.
-, 1997a, Adsorption and stability of arsenic(III) at the clay mineral-water interface:Environmental Science & Technology, v. 31, no. 7, p. 2005-2011.
-, 1997b, Arsenic(III) and arsenic(V) adsorption on three California soils: Soil Science, v.162, no. 12, p. 886-895.
Manning, C. E., and Ingebritsen, S. E., 1999, Permeability of the continental crust:Implications of geothermal data and metamorphic systems: Reviews of Geophysics, v. 37,p. 127-150.
Marquez-Zavalia, F., Craig, J. R., and Solberg, T. N., 1999, Duranusite, product of realgaralteration, Mina Capillitas, Argentina: Canadian Mineralogist, v. 37, p. 1255-1259.
448 References Cited

Masscheleyn, P. H., Delaune, R. D., and Patrick, W. H., Jr., 1991, Effect of redox potentialand pH on arsenic speciation and solubility in a contaminated soil: Environmental Science& Technology, v. 25, no. 8, p. 1414-1418.
Mathur, S. S., 1995, Development of a database for ion sorption on goethite using surfacecomplexation modeling: M.S. Thesis: Carnegie Mellon University, 178 p.
Matis, K. A., Zouboulis, A. I., and Valtadorou, A. V., 1999, Sorption of As(V) by goethiteparticles and study of their flocculation: Water, Air, and Soil Pollution, v. 111:, p. 297-316.
Matisoff, G., Khourey, C. J., Hall, J. F., Varnes, A. W., and Strain, W. H., 1982a, The natureand source of arsenic in northeastern Ohio groundwater: Ground Water, v. 20, no. 4, p.446-456.
Matisoff, G. C., Khorey, J., Hall, J. F., Varnes, A. W., and Strain, W. H., 1982b, The natureand source of arsenic in northeastern Ohio ground water: Ground Water, v. 20, no. 4, p.446-456.
Matthess, G., 1981, In situ treatment of arsenic contaminated groundwater: in Quality ofgroundwater; International symposium, Noordwijkerhout, Netherlands, p. 99-104.
Maurer, D. K., 2001, Hydrogeology and geochemistry of Fallon basalt and adjacent aquifers,and potential sources of basalt recharge, in Churchill County, Nevada: U.S. GeologicalSurvey Water-Resources Investigations Report 01-4130, 72 p.
Maurer, D. K., and Welch, A. H., 1996, Hydrogeology and potential effects of changes inwater use, Carson Desert Agricultural Area, Churchill County, Nevada: U.S. GeologicalSurvey Water Supply Paper 2436, 106 p.
McArthur, J. M., Ravenscroft, P., Safiullah, S., and Thirlwall, M. F., 2001, Arsenic ingroundwater: testing pollution mechanisms for sedimentary aquifers in Bangladesh:Water Resources Research, v. 37, p. 109-117.
McBride, B. C., and Wolfe, R. S., 1971, Biosynthesis of dimethylarsine bymethanobacterium: Biochemistry, v. 10, p. 4312-4317.
McCabe, C., Jackson, M., and Saffer, B., 1989, Regional patterns of magnetite authigenesis inthe Appalachian Basin: Implications for the mechanism of Late Paleozoicremagnetization: Journal of Geophysical Research, v. 94, no. B8, p. 10429-10443.
McKenzie, E. J., Brown, K. L., Cady, S. L., and Campbell, K. A., 2001, Trace metalchemistry and silicification of microorganisms in geothermal sinter, Taupo Volcanic Zone,New Zealand: Geothermics, v. 30, p. 483-502.
McKenzie, R., 1980, The adsorption of lead and other heavy metals on oxides of Mn and Fe.:Australian Journal of Soil Research, v. 18, p. 61-73.
McKenzie, R. M., 1989, Manganese oxides and hydoxides: in Dixon, J. B., and Weel, S. B.,eds., Minerals in soil environments: Madison, Soil Science Society of America, p. 439-465.
McKibben, M. A., and Barnes, H. L., 1986, Oxidation of pyrite in low temperature acidicsolutions; rate laws and surface textures: Geochimica et Cosmochimica Acta, v. 50, no. 7,p. 1509-1520.
McLaren, S. J., and Kim, N. D., 1995, Evidence for a seasonal fluctuation of As in NZ'slongest river and the effect of treatment on concentrations in drinking water:Environmental Pollution, v. 90, p. 67-93.
McNeill, L. S., and Edwards, M., 1995, Soluble arsenic removal at water treatment plants:Journal - American Water Works Association, no. April, p. 105-113.
Melamed, R., Jurinak, J. J., and Dudley, L. M., 1995, Effect of adsorbed phosphate ontransport of arsenate through an oxisol: Soil Science Society of America Journal, v. 59, p.1289-1294.
Meng, X., Bang, S., and Korfiatis, G. P., 2000, Effects of silicate, sulfate, and carbonate onarsenic removal by ferric chloride: Water Research, v. 34, p. 1255-1261.
References Cited 449

Menzies, A. W. C., and Potter, P. D., 1912, The two-component system: Water, arsenicpentoxide: Journal of the American Chemical Society, v. 34, p. 1452-1469.
Meyerhoff, R., 1996, Planning and application of in situ iron and manganese treatment ofgroundwater: Ph.D. Dissertation: University of Stuttgart, Germany (in German), 139 p.
Mielke, R. E., Southam, G., and Nordstrom, D. K., 2000, Arsenic resistant/oxidising bacteriain acidic geothermal environments, Yellowstone National Park, Wyoming. Abstracts withPrograms: in Annual Meeting Geological Society of America, p. A-190.
Miller, J. D., and Kent, D. V., 1988, Regional trends in the timing of Alleghanianremagnetization in the Appalachians: Geology, v. 16, p. 588-591.
Miller, L. D., Goldfarb, R. J., Gehrels, G. E., and Snee, L. W., 1994, Genetic links amongfluid cycling, vein formation, regional deformation, and plutonism in the Juneau gold belt,southeastern Alaska: Geology, v. 22, p. 203-206.
Minnesota Department of Natural Resources, 2000, Minnesota’s water supply--Naturalconditions and human impacts, 19 p.
Minnesota Pollution Control Agency, 1998, Baseline water quality of Minnesota's principalaquifers: Minnesota Pollution Control Agency, 299 p.
Mironova, G. D., and Zotov, A. V., 1980, Solubility studies of the stability of As(III) sulfidecomplexes at 90°C: Geochemistry International, v. 17, p. 46-54.
Mironova, G. D., Zotov, A. V., and Gulko, N. I., 1984, Determination of the solubility oforpiment in acid solutions at 25 - 150°C: Geochemistry International, v. 21, p. 53-59.
-, 1990, The solubility of orpiment in sulfide solutions at 25 - 150°C, and the stability ofarsenic sulfide complexes: Geochemistry International, v. 27, p. 61-73.
Mok, W. M., Riley, J. A., and Wai, C. M., 1988, Arsenic speciation and quality ofgroundwater in a lead-zinc mine, Idaho: Water Research (Oxford), v. 22, no. 6, p. 769-774.
Montanez, I. P., 1994, Late diagenetic dolomitization of Lower Ordovician, upper Knoxcarbonates; a record of the hydrodynamic evolution of the southern Appalachian Basin:AAPG Bulletin, v. 78, no. 8, p. 1210-1239.
Moore, J. N., 1993, Contaminant mobilization resulting from redox pumping in a metal-contaminated river reservoir system, Montana, U.S.A, Environmental Chemistry Lakesand Reservoirs: Chemical Series, American Chemical Society, p. 451-471.
-, 1994, Contaminant mobilization resulting from redox pumping in a metal-contaminatedriver-reservoir system, Environmental Chemistry of Lakes and Reservoirs: Advances inChemistry Series, p. 451-471.
Moore, J. N., Ficklin, W. H., and Johns, C., 1988, Partitioning of arsenic and metals inreducing sulfidic sediments: Environmental Science & Technology, v. 22, no. 4, p. 432-437.
Moore, J. N., and Luoma, S. N., 1990, Hazardous wastes from large-scale metal extraction: acase study: Environmental Science & Technology, v. 24, p. 1279-1285.
Moore, J. N., Walker, J. R., and Hayes, T. H., 1990, Reaction scheme for the oxidation ofAs(III) to As(V) by birnessite: Clays and Clay Minerals, v. 38, p. 549-555.
Morel, F. M. M., and Hering, J. G., 1993, Principles and Applications of Aquatic Chemistry:New York, Wiley-Interscience, 374 p.
Morel, F. M. M., Yeasted, J. G., and Westall, J. C., 1981, Adsorption Models: AMathematical Analysis in the Framework of General Equilibrium Calculations: inAnderson, M. A., and Rubin, A. J., eds., Adsorption of Inorganics at Solid-LiquidInterfaces: Ann Arbor, Michigan, Ann Arbor Science, p. 263-294.
Morrison, G. M. P., 1989, Trace element speciation and its relationship to bioavailability andtoxicity in aquatic samples: in Batley, G. E., ed., Trace Element Speciation: AnalyticalMethods and Problems: Boca Raton, Florida, CRC Press, p. 25-41.
References Cited450

References Cited 451
Morse, J. W., 1994, Interactions of trace metals with authigenic sulfide minerals: Implicationsfor their bioavailability: Marine Chemistry, v. 46, p. 1 -6.
Moses, C. O., Nordstrom, D. K., Herman, J. S., and Mills, A. L., 1987, Aqueous pyriteoxidation by dissolved-oxygen and by ferric iron: Geochimica et Cosmochimica Acta, v.51, no. 6, p. 1561-1571.
Murphy, J. W., and Riley, J. P., 1962, A modified single-solution method for thedetermination of phosphate in natural waters: Analytica Chimica Acta, v. 37, p. 31-36.
Murray, J. W., 1975, The interaction of metal ions at the manganese dioxide-solutioninterface: Geochimica et Cosmochimica Acta, v. 39, p. 505-510.
Myers, M. B., and Felty, E. J., 1970, Heats of fusion of the compoundsand Journal of the Electrochemical Society, v. 117, p. 818-820.
Myneni, S. C. B., 1995, Oxyanion-mineral surface interaction in alkaline environments:and sorption and desorption in ettringite: Ph.D. Dissertation: Ohio State University,250 p.
Myneni, S. C. B., Traina, S. J., Logan, T. J., and Waychunas, G. A., 1997, Oxyanion behaviorin alkaline environments: sorption and desorption of arsenate in ettringite: EnvironmentalScience & Technology, v. 31, p. 1761 -1768.
Myneni, S. C. B., Traina, S. J., Waychunas, G. A., and Logan, T. J., 1998, Experimental andtheoretical vibrational spectroscopic evaluation of arsenate coordination in aqueoussolutions, solids, and at mineral-water interfaces: Geochimica et Cosmochimica Acta, v.62, p. 3285-3300.
Nag, J. K., Balaram, V., Rubio, R., Alberti, J., and Das, A. K., 1996, Inorganic arsenic speciesin groundwater: A case study from Purbasthali (Burdwan), India: Journal of TraceElements in Medicine and Biology, v. 10, no. 1, p. 20-24.
National Research Council, 1999, Arsenic in Drinking Water: Washington, DC, NationalAcademy Press, 310 p.
Naumov, G. B., Ryzhenko, B. N., and Khodakovsky, I. L., 1974, Handbook ofThermodynamic Data, NTIS, U.S. Government Printing Office, 226-722 p.
Nesbitt, H. W., Canning, G. W., and Bancroft, G. M., 1998, XPS study of reactive dissolutionof 7-A birnessite by H3AsO3, with constraints on reaction mechanism: Geochimica etCosmochimica Acta, v. 62, p. 2097-2110.
Nesbitt, H. W., Muir, I. J., and Pratt, A. R., 1995, Oxidation of arsenopyrite by air and air-saturated, distilled water, and implications for mechanism of oxidation: Geochimica etCosmochimica Acta, v. 59, p. 1773-1786.
Nesbitt, H. W., and Reinke, M., 1999, Properties of As and S at NiAs, NiS, and Fel-xSsurfaces, and reactivity of niccolite in air and water: American Mineralogist, v. 84, p. 639-649.
Newman, D. K., Ahmann, D., and Morel, F. M. M., 1998, A brief review of microbialarsenate respiration: Geomocrobiology Journal, v. 15, p. 255-268.
Newman, D. K., Beveridge, T. J., and Morel, F. M. M., 1997a, Precipitation of arsenictrisulfide by Desulfotomaculum auripigmentum: Applied and EnvironmentalMicrobiology, v. 63, p. 2022-2088.
Newman, D. K., Kennedy, E. K., Coates, J. D., Ahmann, D., Ellis, D. J., Lovley, D. R., andMorel, F. M. M., 1997b, Dissimilatory arsenate and sulfate reduction inDesulfotomaculum auripigmentum sp. nov.: Archives of Microbiology, v. 168, p. 380-388.
Nicholson, R, V., Gillham, R. W., and Reardon, E. J., 1988, Pyrite oxidation in carbonate-buffered solution. 1. Experimental kinetics: Geochimica et Cosmochimica Acta, v. 52, no.5, p. 1077-1085.
Nickson, R., McArthur, J., Burgess, W., Ahmed, K. M., Ravenscroft, P., and Rahman, M.,1998, Arsenic poisoning of Bangladesh groundwater: Nature, v. 395, no. 6700, p. 338.

452 References Cited
Nickson, R. T., McArthur, J. M., Ravenscroft, P., Burgess, W. G., and Ahmed, K. M., 2000,Mechanism of arsenic release to groundwater, Bangladesh and West Bengal: AppliedGeochemistry, v. 15, no. 4, p. 403-413.
Nicolli, H. B., Suriano, J. M., Peral, M. A. G., Ferpozzi, L. H., and Baleani, O. A., 1989,Groundwater contamination with arsenic and other trace-elements in an area of the Pampa,Province of Cordoba, Argentina: Environmental Geology and Water Sciences, v. 14, no. 1,p. 3-16.
Nielsen, M. G., Stone, J. R., Hansen, B. P., and Nielsen, J. P., 1995, Geohydrology, waterquality, and conceptual model of the hydrologic system, Saco landfill area, Saco Maine:U.S. Geological Survey Water-Resources Investigations Report, 95-4027, 94 p.
Nimick, D. A., 1994, Arsenic transport in surface and ground water in the Madison and UpperMissouri River valleys, Montana: in American Geophysical Union 1975 Fall Meeting, p.247.
-, 1998, Arsenic hydrogeochemistry in an irrigated river valley -- a reevaluation: GroundWater, v. 36, p. 743-753.
Nimick, D. A., Moore, J. N., Dalby, C. E., and Svka, M. W., 1998, The fate of geothermalarsenic in the Madison and Missouri Rivers, Montana and Wyoming: Water ResourcesResearch, v. 34, p. 3051-3067.
Nishimura, T., and Robins, R. G., 1998, A re-evaluation of the solubility and stability regionsof calcium arsenites and calcium arsenates in aqueous solution at 25°C: MineralProcessing and Extractive Metallurgy Reviews, v. 18, p. 283-308.
Noguchi, K., and Nakagawa, R., 1969, Arsenic and arsenic-lead sulfide sediments fromTamagawa Hot Springs, Akita Prefecture: Proceedings of the Japan Academy, v. 45, p.45-50.
Nordstrom, D. K., 1982, Aqueous pyrite oxidation and the consequent formation of secondaryiron minerals, Acid Sulfate Weathering: Madison, Wisconsin, Soil Science Society ofAmerica, p. 37-56.
-, 2000a, Advances in the hydrogeochemistry and microbiology of acid mine waters:International Geology Review, v. 42, p. 490-515.
-, 2000b, Thermodynamic properties of environmental arsenic species: Limitations and needs:in Proceedings, Society Mining Metallurgy & Exploration Meeting, Salt Lake City, USA.
Nordstrom, D. K., Alpers, C. N., Ptacek, C. J., and Blowes, D. W., 2000, Negative pH andextremely acidic mine waters from Iron Mountain, California: Environmental Science &Technology, v. 34, p. 254-258.
Nordstrom, D. K., Ball, J. W., and McCleskey, R. B., 2001, Processes governing arsenicconcentrations in thermal waters of Yellowstone National Park: in U.S. Geological SurveyWorkshop on Arsenic in the Environment.
Nordstrom, D. K., and Munoz, J. L., 1994, Geochemical Thermodynamics, BlackwellScience, 493 p.
Nordstrom, D. K., and Southam, G., 1997, Geomicrobiology of sulfide mineral oxidation,Geomicrobiology: Interactions Between Microbes and Minerals: Reviews in Mineralogy,p. 361-390.
NRECA, 1997, Report of study of the impact of the Bangladesh rural electrification programon groundwater quality: NRECA International Ltd, 124 p.
Nriagu, J. O., 1994, Arsenic in the environment, Part I: Cycling and characterization: NewYork, John Wiley & Sons, 430 p.
Ohio Environmental Protection Agency, 2000, Ohio's ground water quality: 2000 305(b)report: Division of Drinking and Ground Waters, 55 p.
-, 2001a, Arsenic in Ohio's ground water: Columbus, Division of Drinking and GroundWaters (on line).
-, 2001b, Ground water in Ohio: Division of Drinking and Ground Waters, 4 p.
References Cited 453
Ohle, E. L., 1990, A comparison of the Old Lead Belt and the New Lead Belt in southeastMissouri: Economic Geology, v. 85, no. 8, p. 1894-1895.
-, 1997, Significant events in the geological understanding of the Southeast Missouri leaddistrict: in Sangster, D. F., ed., Carbonate-hosted lead-zinc deposits, Society of EconomicGeologists Special Publication, p. 1-7.
Oliver, N. H. S., 1996, Review and classification of structural controls on fluid flow duringregional metamorphism: Journal of Metamorphic Geology, no. 14, p. 477-492.
Oman, C. L., Hassenmueller, W. H., and Bragg, L. J., 1992, Indiana Coal and AssociatedRock Samples Collected from 1975-1977: U. S. Geological Survey Open File Report, 93-0111, 133 p.
O'Neil, P. E., Harris, S. C., Mettee, M. F., Shepard, T. E., and McGregor, S. W., 1993,Surface discharge of wastewaters from the production of methane from coal seams inAlabama; the Cedar Cove model: Geological Survey of Alabama, 155, 259 p.
O'Reilly, S. E., Strawn, D. G., and Sparks, D. L., 2001, Residence time effects on arsenateadsorption/desorption mechanisms on goethite: Soil Science Society of America Journal,v. 65, p. 67-77.
Ortiz, D., Lange, K., and Beal, L., 1999, Water resources data, New Mexico, water year 1998-Volume 1. The Rio Grande Basin, the Mimbres River Basin, and the Tularosa ValleyBasin: U.S. Geological Survey Water-Data Report NM-98-1, 404 p.
Osborne, F. H., and Ehrlich, H. L., 1976, Oxidation of arsenite by a soil isolate ofAlcaligenes: Journal of Applied Bacteriology, v. 41, p. 295-305.
Oscarson, D. W., Huang, P. M., Defosse, C., and Herbillon, A., 1981a, Oxidative power ofMn(IV) and Fe(III) oxides with respect to As(III) in terrestrial and aquatic environments:Nature, v. 291, p. 50-51.
Oscarson, D. W., Huang, P. M., and Liaw, W. K., 1980, The oxidation of arsenite by aquaticsediments: Journal of Environmental Quality, v. 9, p. 700-703.
-, 1981b, Role of manganese in the oxidation of arsenite by freshwater lake sediments: Claysand Clay Minerals, v. 29, p. 219-225.
Oscarson, D. W., Huang, P. M., Liaw, W. K., and Hammer, U. T., 1983, Kinetics of oxidationof arsenite by various manganese dioxides: Soil Science Society of America Journal, v.47, p. 644-648.
Ostergren, J. D., Jr, Parks, G. A., and Tingle, T. N., 1999, Quantitative speciation of lead inselected mine tailings form Leadville, CO: Environmental Science & Technology, v. 33, p.1627-1635.
Paktunc, A. D., Laflamme, J. H. G., Riveros, P. A., and Deschenes, G., 2000, Arsenicmineralogy and bench-scale cyanidation testwork on composite materials from the KetzaRiver mine site, Yukon.: CANMET, MMSL 2000-017 (CR).
Palache, C., Berman, H., and Frondel, C., 1944, Dana's System of Mineralogy: New York,John Wiley and Sons, 834 p.
Panno, S. V., Hackley, K. C., Cartwright, K., and Liu, C. L., 1994, Hydrochemistry of theMahomet Bedrock valley aquifer, east-central Illinois: Indicators of recharge and ground-water flow: Ground Water, v. 32, p. 591-604.
Park, C. F., Jr., and MacDiarmid, R. A., 1975, Ore Deposits: San Francisco, California, W.H.Freeman, 530 p.
Parker, D. R., Chaney, R. L., and Norvell, W. A., 1995, Chemical equilibrium models:Applications to plant nutrition research: in Loeppart, R. H., Schwab, A. P., and Goldberg,S., eds., Chemical Equilibrium and Reaction Models, Soil Science Society of America,Special Publication, No. 42, p. 163-200.
Parkhurst, D. L., and Appelo, C. A. J., 1999, User's guide to PHREEQC (version 2): U.S.Geological Survey Water-Resources Investigations Report 99-4259, 312 p.

454 References Cited
Parkhurst, D. L., Engesgaard, P., and Kipp, K. L., 1995, Coupling the geochemical modelPHREEQC with a 3D multi-component solute-transport model: in Fifth Annual V.M.Goldschmidt Conference, University Park, Pennsylvania, p. 77.
Parkhurst, D. L., and Plummer, L. N., 1993, Geochemical models: in Alley, W. M., ed.,Regional Ground-Water Quality: New York, Van Nostrand Reinhold, p. 199-225.
Parks, G. A., 1965, The isoelectric points of solid oxides, solid hydroxides, and aqueoushydroxo complex systems: Chemical Reviews, v. 65, p. 177-198.
-, 1990, Surface energy and adsorption at mineral-water interfaces: An introduction: inHochella, M. F., Jr., and White, A. F., eds., Mineral-Water Interface Geochemistry:Washington, D.C., Mineralogical Society of America, p. 133-175.
Parks, G. A., and de Bruyn, P. L., 1962, The zero point of charge of oxides: Journal ofPhysical Chemistry, v. 66, p. 967-973.
Paronikyan, V. O., and Matevosyan, A. S., 1965, Native arsenic from Amas deposits ofArmenian S.S.R.: Doklady Akademii Nauk Armyanskoy, v. 41, p. 240-243.
Paschke, S. S., Harrison, W. J., and Walton-Day, K., 2001, Effects of acidic recharge ongroundwater at the St. Kevin Gulch site, Leadville, Colorado: Geochemistry: Exploration,Environment, Analysis, v. 1, no. 1, p. 3-14.
Pashin, J. C., 1994, Coal-body geometry and synsedimentary detachment folding in OakGrove coalbed methane field, Black Warrior Basin, Alabama: AAPG Bulletin, v. 78, no.6, p. 960-980.
-, 1998, Stratigraphy and structure of coalbed methane reservoirs in the United States: Anoverview: International Journal of Coal Geology, v. 35, p. 1-4.
Pashin, J. C., Carrol, R. E., Hatch, J. R., and Goldhaber, M. B., 1999, Mechanical and thermalcontrol of cleating and shearing in coal: Examples from the Alabama coalbed methanefields, USA: in Mastalerz, M., Glikson, M., and Golding, S. D., eds., Coalbed Methane:Scientific, Environmental, and Economic Evaluation: Dordrecht, Kluwer AcademicPublishers, p. 305-328.
Pashin, J. C., Carroll, R. E., Barnett, R. L., and Beg, M. A., 1995, Geology and coal resourcesof the Cahaba coal field: Geological Survey of Alabama, 163, 49 p.
Paukov, I. E., Nogteva, V. V., and Strelkov, P. G., 1969, The true heat capacity of crystallineblack phosphorous and metallic arsenic in the temperature range 13-300°K: RussianJournal of Physical Chemistry, v. 43, p. 773-777.
Pauling, L., 1970, General Chemistry: San Francisco, 959 p.Pearce, J., Kinniburgh, D. G., Smedley, P. L., Ahmed, K. M., and Rahman, M., 2001,
Mineralogy and sediment chemistry: in Kinniburgh, D. G., and Smedley, P. L., eds.,Arsenic contamination of groundwater in Bangladesh: Keyworth, British GeologicalSurvey, Keyworth, p. 187-210.
Pelczar, J. S., 1996, Groundwater chemistry of wells exhibiting natural arsenic contaminationin east-central Wisconsin: M.S. Thesis: University of Wisconsin-Green Bay, 206 p.
Peralta, G. L., Kirk, D. W., Graydon, J. W., and Seyfried, P. L., 1996, Assessing theenvironmental impact of geothermal residues: Canadian Waste Management Research, v.16, p. 225-232.
Perry, M. J., and Mackun, P. J., 2001, Population change and distribution, 1990 to 2000: U.S.Census Bureau, C2KBR/01-2, 7 p.
Peryea, F. J., 1991, Phosphate-induced release of arsenic from soils contaminated with leadarsenate: Soil Science Society of Americal Journal, v. 55, p. 1301-1306.
-, 1998, Historical use of lead arsenate insecticides, resulting soil contamination andimplications for soil remediation: in 16th World Congress of Soil Science (CD Rom),Montpellier, France.

References Cited 455
Peryea, F. J., and Kammereck, R., 1997, Phosphate-enhanced movement of arsenic out oflead arsenate-contaminated topsoil and through uncontaminated subsoil: Water, Air andSoil Pollution, v. 93, no. 1-4, p. 243-254.
Peters, S. C., Blum, J. D., Klaue, B., and Karagas, M. R., 1999, Arsenic occurrence in NewHampshire drinking water: Environmental Science & Technology, v. 33, no. 9, p. 1328-1333.
PHED, 1991, Arsenic pollution in groundwater in West Bengal. Final Report: Public HealthEngineering Department, Public Health Department, Government of West Bengal.
PHED/UNICEF, 1999, Joint Plan of Action to Address Arsenic Contamination of DrinkingWater.
Phillips, S. E., and Taylor, M. L., 1976, Oxidation of arsenite to arsenate by Alcaligenesfaecalis: Applied and Environmental Microbiology, v. 32, p. 392-399.
Pierce, M. L., and Moore, C. B., 1982, Adsorption of arsenite and arsenate on amorphous ironhydroxide: Water Research, v. 16, p. 1247-1253.
Pitman, J. K., and Spoeetl, C., 1996, Origin and timing of carbonate cements in the St. PeterSandstone, Illinois Basin: Evidence for a genetic link to Mississippi Valley-typemineralization: in Crossey, L. J., Loucks, R., and Totten, M. W., eds., Siliciclasticdiagenesis and fluid flow: Concepts and applications: Special Publication, Society forSedimentary Geology, p. 187-203.
Plumlee, G. S., Leach, D. L., Hofstra, A. H., Landis, G. P., Rowan, E. L., and Viets, J. G.,1994, Chemical reaction path modeling of ore deposition in Mississippi Valley-type Pb-Zndeposits of the Ozark region, U.S. Midcontinent: Economic Geology, v. 89, no. 6, p. 1361-1383.
-, 1995, Chemical reaction path modeling of ore deposition in Mississippi Valley-type Pb-Zndeposits of the Ozark region, U.S. Midcontinent; reply: Economic Geology, v. 90, no. 5, p.1346-1349.
Plummer, L. N., Bexfield, L. M., Anderholm, S. K., Sanford, W. E., and Busenberg, E., 2001,Geochemical characterization of ground-water flow in parts of the Santa Fe Group aquifersystem, Middle Rio Grande Basin, New Mexico, U.S. Geological Survey Middle RioGrande Basin Study-Proceedings of the Fourth Annual Workshop: in Cole, J. C., ed.:Albuquerque, New Mexico, U.S. Geological Survey Open-File Report 00-488, p. 7-10.
-, in press, Geochemical characterization of ground-water flow in the Santa Fe Group aquifersystem, Middle Rio Grande Basin, New Mexico, U.S. Geological Survey Water-ResourcesInvestigations Report.
Plummer, L. N., Busenberg, E., Sanford, W. E., Bexfield, L. M., Anderholm, S. K., andSchlosser, P., 1997, Tracing and dating young ground water in the Middle Rio GrandeBasin, Albuquerque, New Mexico: Geological Society of America Abstracts withPrograms, v. 29, no. 6, p. 135-136.
Pokrovski, G., Gout, R., Schott, J., Zotov, A., and Harrichoury, J., 1996, Thermodynamicproperties and stoichiometry of As(III) hydroxide complexes at hydrothermal conditions:Geochimica et Cosmochimica Acta, v. 60, p. 737-749.
Popova, V. I., and Polyakov, V. O., 1985, Uzonite As4S5 - a new arsenic sulfide fromKamchatka: Zapiski Vsesoyuznogo Mineralogicheskogo Obshchestva, p. 369-373.
Popova, V. I., Popov, V. A., Clark, A. H., Polyakov, V. O., and Borisovskii, S. E., 1986,Alacranite As8S9 - a new mineral: Zapiski Vsesoyuznogo MineralogicheskogoObshchestva, v. 115, p. 360-368.
Post, J. E., and Bish, D. L., 1988, Ritveld refinement of the todorokite structure: AmericanMineralogist, v. 73, p. 861-869.
Post, J. E., and Veblen, D. R., 1990, Crystal structure determination of synthetic sodium,magnesium, and potassium birnessite using TEM and the Rietveld method: AmericanMineralogist, v. 75, p. 477-489.

456 References Cited
Postma, D., and Appelo, C. A. J., 2000, Reduction of Mn-oxides by ferrous iron in a flowsystem: Column experiment and reactive transport modeling: Geochimica etCosmochimica Acta, v. 64, p. 1237-1247.
Postma, D., Boesen, C., Kristiansen, H., and Larsen, F., 1991, Nitrate reduction in anunconfined sandy aquifer - water chemistry, reduction processes, and geochemicalmodeling: Water Resources Research, v. 27, no. 8, p. 2027-2045.
Pratt, W. P., 1992, Maps showing areal extent of selected Paleozoic shales in the northernMidcontinent, U.S.A.: U. S. Geological Survey Miscellaneous Field Studies Map, scale1:1,000,000.
Pratt, W. P., and Goldhaber, M. B., 1990, Mineral Resource Potential of the Midcontinent: inU. S. Geological Survey-Missouri Geological Survey symposium on Mineral-resourcepotential of the Midcontinent, St. Louis, Missouri, p. 42.
Pratt, W. P., Hayes, T. S., Erickson, R. L., Berendsen, P., and Kisvarsanyi, E. B., 1993,Assessment of the Joplin 1 degree by 2 degrees quadrangle, Kansas and Missouri, forMississippi Valley-type deposits and other minerals: U. S. Geological SurveyMiscellaneous Field Studies Map MF-2125-E, scale 1:250,000.
Prior, H. L., and Williams, G. A., 1996, Some mines and minerals of Morgan County,Missouri: Rocks and Minerals, v. 71, p. 102.
Puls, R. W., and Powell, R. M., 1992, Transport of inorganic colloids through natural aquifermaterial: Implications for contaminant transport: Environmental Science & Technology, v.26, p. 614-621.
Qing, H., and Mountjoy, E. W., 1994, Origin of dissolution vugs, caverns, and breccias in theMiddle Devonian Presqu'ile barrier, host of Pine Point mississippi valley-type deposits:Economic Geology and the Bulletin of the Society of Economic Geologists, v. 89, no. 4, p.858-876.
Rahim, S., 1998, Chemical quality of groundwater of Rawalpindi and Islamabad region: M.S.Thesis: National University of Sciences and Technology, Pakistan.
Rahman, M., and Hossain, K. S., 1999, Study Report on Source Detection of ArsenicContamination in Bangladesh Groundwater & Mitigation Measures: Bangladesh WaterDevelopment Board, 54 p.
Rankin, A., 1995, Hydrothermal orefields and ore fluids. Milestones in geology: in Le Bas,M., ed., Memoir - Geological Society of London, p. 237-247.
Rankin, A. H., 1990, Fluid inclusions associated with oil and ore in sediments.: in Ala, M.,Hatamian, H., Hobson, G. D., King, M. S., and Williamson, I., eds., Seventy-five years ofprogress in oil field science and technology: London, United Kingdom, p. 113-124.
Rard, J. A., and Archer, D. G., 1995, Isopiestic investigation of the osmotic and activitycoefficients of aqueous NaBr and the solubility of at 298.15 K.Thermodynamic properties of the system over wide ranges of temperature andpressure: Journal of Chemical and Engineering Data, v. 40, p. 170-185.
Raven, K. P., Jain, A., and Loeppert, R. H., 1998, Arsenite and arsenate adsorption onferrihydrite: Kinetics, equilibrium, and adsorption envelopes: Environmental Science &Technology, v. 32, p. 344-349.
Ray, S. P. S., 1997, Arsenic in groundwater in West Bengal.: in Consultation on arsenic indrinking water and resulting arsenic toxicity in India and Bangladesh, New Delhi, p. 13.
Reay, P. F., 1972, The accumulation of arsenic from arsenic-rich natural waters by aquaticplants: Journal of Applied Ecology, v. 9, p. 557-565.
Reeder, R. J., Lamble, G. M., Lee, J. F., and Staudt, W. J., 1994, Mechanism of SeO42-substitution in calcite: An XAFS study: Geochimica et Cosmochimica Acta, v. 58, p.5639-5646.
Renaut, R. W., Jones, B., and Rosen, M. R., 1996, Primary silica oncoids from OrakeikorakoHot Springs, North Island, New Zealand: Palaios, v. 11, p. 446-458.

References Cited 457
Ressler, T., Wong, J., Roos, J., and Smith, I. L., 2000, Quantitative speciation of Mn-bearingparticulates emitted from autos burning (methylcyclopentadienyl)manganese tricarbonyl-added gasolines using XANES spectroscopy: Environmental Science & Technology, v.34, p. 950-958.
Reuther, R., 1992, Arsenic introduced into a littoral freshwater model ecosystem: Sci. TotalEnv., v. 115, p. 219-237.
Reynolds, J. C., 2001, Distributed in situ gas measurements for the analysis and modeling ofbiogeochmical changes in the Clark Fork River: M.S.: The University of Montana, 118 p.
Reynolds, R. L., and Goldhaber, M. B., 1978, Recognition of oxidized sulfide minerals as anexploration guide for uranium: Journal of Research of the U. S. Geological Survey, v. 6,no. 4, p. 483-488.
RGAG & RGACG, 2000, Arsenic contamination in groundwater and hydrogeologicalbackground in Samta village, western Bangladesh: Sub-group for Arsenic contamination,Research Group for Applied Geology & Miyazaki University Research Group for ArsenicContamination in Groundwater, 32 p.
Richardson, S., and Vaughan, D. J., 1989, Arsenopyrite: a spectroscopic investigation ofaltered surfaces: Mineralogical Magazine, v. 53, p. 223-229.
Rickman, D. L., 1981, A thermochemical study of the ore deposits of the Milliken Mine, NewLead Belt, Missouri: Ph.D. Dissertation: University of Missouri, Rolla, Rolla, MO, UnitedStates, 336 p.
Riewe, T., Weissbach, A., Heinen, L., and Stoll, R. C., 2000, Naturally occurring arsenic inwell water in Wisconsin: Water Well Journal, p. 24-29.
Ritchie, J. A., 1961, Arsenic and antimony in some New Zealand thermal waters: NewZealand Journal of Science, v. 4, p. 218-229.
Roberts, A. C., Ansell, H. G., and Bonardi, M., 1980, Pararealgar a new polymorph of arsenicsulfide, from British Columbia: Canadian Mineralogist, v. 18, p. 525-527.
Roberts, W. L., and Rapp, G., Jr., 1965, Mineralogy of the Black Hills: South Dakota SchoolMines Technical Bulletin 18, 268 p.
Robertson, F. N., 1989, Arsenic in groundwater under oxidizing conditions, south-westUnited States: Environmental Geochemistry and Health, v. 11, no. 3-4, p. 171-185.
Robie, R. A., and Hemingway, B. S., 1995, Thermodynamic properties of minerals andrelated substances at 298.15 K and 1 bar (105 Pascals) pressure and at highertemperatures: U.S. Geological Survey Bulletin 2131, 461 p.
Robie, R. A., Hemingway, B. S., and Fisher, J. R., 1978, Thermodynamic properties ofminerals and related substances at 298.15 K and 1 bar (105 pascals) pressure and at highertemperatures: U.S. Geological Survey Bulletin 1452, 456 p.
Robie, R. A., and Waldbaum, D. R., 1968, Thermodynamic properties of minerals and relatedsubstances at 298.15 K (25.0oC) and one atmosphere (1.013 bars) pressure and at highertemperatures: U.S. Geological Survey Bulletin 1259, 256 p.
Robinson, B. H., Brooks, R. R., Outred, H. A., and Kirkman, J. H., 1995, Mercury and arsenicin trout from the Taupo Volcanic Zone and Waikato River, North Island: New ZealandChem. Speciation & Bioavail, v. 7, p. 27-32.
Robinson, G. R., Ayotte, J. D., and Ayuso, R. A., 2000, Arsenic in bedrock, ground water,and soils in New England: EOS Transactions, AGU Fall Meeting Supplement, v. 81, p.524.
Rochette, E. A., Bostick, B. C., Li, G., and Fendorff, S., 2000, Kinetics of arsenate reductionby dissolved sulfide: Environmental Science & Technology, v. 34, p. 4714-4720.
Rochette, E. A., Li, G. C., and Fendorf, S. E., 1998, Stability of arsenate minerals in soilunder biotically generated reducing conditions: Soil Science Society of America Journal,v. 62, p. 1530-1537.

Rogers, R. J., 1989, Geochemical comparison of ground water in areas of New England, NewYork, and Pennsylvania: Ground Water, v. 27, no. 5, p. 690-712.
Rosen, B. P., Bhattacharjee, H., and Shi, W., 1995, Mechanisms of metalloregulation of ananion-translocating ATPase: Bioenergetics and Biomembranes, v. 27, p. 85-91.
Roth, W. A., and Schwartz, O., 1926, Physical-chemical properties of solutions of germaniumdioxide (and arsenic trioxide): Bericht, v. 59, p. 338-348.
Rothbaum, H. P., and Anderton, B. H., 1976, Removal of silica and arsenic from geothermaldischarge waters by precipitation of useful calcium silicates: in 2nd United NationsSymposium on the Development and Uses of Geothermal Resources, p. 1417-1425.
Rott, U., and Friedle, M., 1999, Subterranean removal of arsenic from groundwater: in W. R.Chappell, C. O. A., and Calderon, R. L., eds., Arsenic Exposure and Health Effects:Oxford, United Kingdom, Elsevier Science Ltd., p. 389-396.
Rott, U., and Lamberth, B., 1993, Groundwater clean up by in situ treatment of nitrate, ironand manganese: Water Supply 11, p. 143-156.
Rott, U., and Meyerhoff, R., 1996, In-situ-Treatment of Arsenic in Groundwater: in IWSAInternational Workshop: Natural origin inorganic micropollutants, Vienna.
Rott, U., Meyerhoff, R., and Bauer, T., 1996, In situ treatment of groundwater with increasedconcentrations of iron, manganese and arsenic: Wasser-Abwasser (in German), v. 137, p.358-363.
Rowan, E. L., 1986, Cathodoluminescent zonation in hydrothermal dolomite cements:Relationship to Mississippi Valley-type Pb-Zn mineralization in southern Missouri andnorthern Arkansas.: in Hagi, R. D., ed., Process Mineralogy VI, Metallurgical Society, p.69-87.
Rowan, E. L., and Goldhaber, M. B., 1996, Fluid inclusions and biomarkers in the UpperMississippi Valley zinc-lead district: Implications for the fluid-flow and thermal history ofthe Illinois Basin: U.S. Geological Survey Bulletin, 20994-F.
Rowan, E. L., Goldhaber, M. B., and Hatch, J. R., 2001, The role of regional fluid flow in theIllinois basin's thermal history: Constraints from fluid inclusions and maturity ofPennsylvanian coals: AAPG Bulletin.
Rowan, E. L., Goldhaber, M. B., and Hatch, R. R., 1996, Constraints on the thermal andburial history of the Illinois Basin from fluid inclusions and thermal maturity of organicmatter: in Geological Society of America, 28th annual meeting, p. 387.
Rowan, E. L., and Leach, D. L., 1989, Constraints from fluid inclusions on sulfideprecipitation mechanisms and ore fluid migration in the Viburnum Trend lead district,Missouri: Economic Geology, v. 84, no. 7, p. 1948-1965.
Roy, W. R., Hassett, J. J., and Griffin, R. A., 1986a, Competitive coefficients for theadsorption of arsenate, molybdate, and phosphate mixtures by soils: Soil Science Societyof America Journal, v. 50, p. 1176-1182.
-, 1986b, Competitive interactions of phosphate and molybdate on arsenate adsorption: SoilScience, v. 142, p. 203-210.
Rumble III, D., 1994, Water circulation in metamorphism: Journal of Geophysical Research,v. 99, no. B8, p. 15499-15502.
Runkel, R. L., Kimball, B. A., McKnight, D. M., and Bencala, K. E., 1999, Reactive solutetransport in streams: a surface complexation approach for trace metal sorption: WaterResources Research, v. 35, p. 3829-3840.
Ryan, P. B., Huet, N., and MacIntosh, D. L., 2000, Longitudinal investigation of exposure toarsenic, cadmium, and lead in drinking water: Environmental Health Perspectives, v. 108,no. 8, p. 731-735.
Ryden, J. C., Syers, J. K., and Tillman, R. W., 1987, Inorganic anion sorption and interactionswith phosphate sorption by hydrous ferric oxide gel: Journal of Soil Science, v. 38, p. 211-217.
References Cited458

References Cited 459
Ryker, S. J., 2001, Mapping arsenic in ground water: Geotimes Newsmagazine of the EarthSciences, v. 46, no. 11, p. 34-36.
Ryling, R. W., 1961, A preliminary study of the distribution of saline water in the bedrockaquifers of eastern Wisconsin: Wisconsin Geological and Natural History SurveyInformation Circular 5, 23 p.
Rytuba, J. J., 1995, Cenozoic metallogeny of California: in Geology and ore deposits of theAmerican Cordillera; Symposium Proceedings, Reno, Nevada, p. 803-822.
Saad, D. L., 1996, Ground-water quality in the western part of the Cambrian -OrdovicianAquifer in the western Lake Michigan drainages, Wisconsin and Michigan: U.S.Geological Survey Water-Resources Investigation Report 96-4231, 40 p.
Sadiq, M., 1997, Arsenic chemistry in soils: An overview of thermodynamic predictions andfield observations: Water, Air and Soil Pollution, v. 93, no. 1-4, p. 117-136.
Sadiq, M., and Lindsay, W. L., 1981, Selection of standard free energies of formation for usein soil chemistry,: Colorado State University Experiment Station Techical Bulletin 134,Arsenic Supplement, 39 p.
Sakamoto, H., Kamada, M., and Yonehara, 1988, The contents and distribution of arsenic,antimony and mercury in geothermal waters: Bulletin of the Chemical Society of Japan, v.61, p. 3471-3477.
Sakata, M., 1987, Relationship between adsorption of arsenic(III) and boron by soil and soilproperties: Environmental Science & Technology, v. 21, p. 1126-1130.
Salomaa, P., Hakala, R., Vesala, S., and Aalto, T., 1969, Solvent deuterium isotope effects onacid-base reactions. Part III. Relative acidity constants of inorganic oxyacids in light andheavy water. Kinetic applications: Acta Chemica Scandinavica, v. 23, p. 2116-2126.
Sato, M., 1960, Oxidation of sulfide ore bodies: I. Geochemical environments in terms of Ehand pH: Economic Geology, v. 55, p. 928-961.
Savage, K. S., Tingle, T. N., O'Day, P. A., Waychunas, G. A., and Bird, D. K., 2000, Arsenicspeciation in pyrite and secondary weathering phases, Mother Lode Gold District,Tuolumne County, California: Applied Geochemistry, v. 15, p. 1219-1244.
Sayers, D. E., and Bunker, B. A., 1988, Data analysis: in Koningsberger, D. C., and Prins, R.,eds., X-ray Absorption: Principles, Applications, Techniques of EXAFS, SEXAFS, andXANES: New York, John Wiley and Sons.
Schedl, A., McCabe, C., Montanez, I. P., Fullagar, P. D., and Valley, J. W., 1992,Alleghanian regional diagenesis: A response to the migration of modified metamorphicfluids derived from beneath the Blue Ridge-Piedmont thrust sheet: Journal of Geology, v.100, p. 339-352.
Schindler, P. W., 1981, Surface Complexes at Oxide-Water Interfaces: in Anderson, M. A.,and Rubin, A. J., eds., Adsorption of Inorganics at Solid-Liquid Interfaces, p. 1 -49.
Schindler, P. W., and Stumm, W., 1987, The Surface Chemistry of Oxides, Hydroxides, andOxide Minerals: in Stumm, W., ed., Aquatic Surface Chemistry, Wiley Interscience, p. 83-110.
Schlottmann, J. L., and Breit, G. N., 1992, Mobilization of As and U in the Central OklahomaAquifer, USA: in Kharaka, Y. K., and Maest, A. S., eds., Water-Rock Interaction,Balkema, Rotterdam, p. 835-838.
Schombel, L. F., 1994, Bedrock and alluvial aquifer saturated thickness isopach maps: inWossner, W. W., ed.: Missoula, Montana, Montana Department of Justice, NaturalResource Damage Litigation Program, p. 130.
Schreiber, M. E., Simo, J. A., and Freiberg, P. G., 2000, Stratigraphic and geochemicalcontrols on naturally occurring arsenic in groundwater, eastern Wisconsin, USA:Hydrogeology Journal, v. 8, p. 161-176.

460 References Cited
Schrenk, M. O., Edwards, K. J., Goodman, R. M., Hamers, R. J., and Banfield, J. F., 1998,Distribution of Thiobacillus ferrooxidans and Leptospirillum ferrooxidans: Implicationsfor generation of acid mine drainage: Science, v. 279, no. 5356, p. 1519-1522.
Schwertman, U., and Taylor, R. M., 1989, Iron Oxides: in Dixon, J. B., and Weed, S. B., eds.,Minerals in Soil Environments: Madison, Wisconsin, Soil Science Society of America, p.379-438.
Scotese, C. R., Bambach, R. K., Barton, C., Van der Voo, R., and Ziegler, A. M., 1979,Paleozoic base maps: Journal of Geology, v. 87, no. 3, p. 217-277.
Scott, M. J., and Morgan, J. J., 1995, Reactions at Oxide Surfaces. 1. Oxidation of As(III) bySynthetic Birnessite: Environmental Science & Technology, v. 29, no. 8, p. 1898-1905.
Serfes, M. E., Spayd, S. E., Herman, G. C., and Monteverde, D. E., 2000, Arsenic occurrence,source and possible mobilization mechanisms in ground water of the Piedmontphysiographic province in New Jersey: EOS Transactions, AGU Fall MeetingSupplement, v. 81, p. 525.
Sergeyeva, E. I., Khodakovskiy, I. L., and Vernadskiy, V. I., 1969, Physiochemical conditionsof formation of native arsenic in hydrothermal deposits: Geochemistry International, v. 6,p. 681-694.
Seward, T. M., 1991, The hydrothermal geochemistry of gold: in Foster, R. P., ed., Goldmetallogeny and exploration, Blackie and Son, Glasgow, United Kingdon, p. 37-62.
Shannon, W. T., Owers, W. R., and Rothbaum, H. P., 1982, Pilot scale solids/liquidseparation in hot geothermal discharge waters using dissolved air flotation: Geothermics,v. 11, p. 43-58.
Shelton, K. L., Bauer, R. M., and Gregg, J. M., 1993, Fluid-inclusion studies of regionallyextensive epigenetic dolomites, Bonneterre Dolomite (Cambrian), southeast Missouri:Evidence of multiple fluids during dolomitization and lead-zinc mineralization: GeologicalSociety of America Bulletin, v. 105, no. 7, p. 972-978.
Shevenell, L., Goff, F., Vuataz, F., Trujillo, P. E., Jr., Counce, D., Janik, C. J., and Evans, W.,1987, Hydrogeochemical data for thermal and nonthermal waters and gases of the VallesCaldera-southern Jemez Mountains region, New Mexico: Los Alamos NationalLaboratory Report LA-10923-OBES, 100 p.
Shifflett, J., in preparation, Sediment release from Milltown Reservoir during the 1997 runoff:M.S. Thesis: University of Montana.
Shippers, A., and Jorgensen, B. B., 2001, Oxidation of pyrite and iron sulfide by manganesedioxide in marine sediments: Geochimica et Cosmochimica Acta, v. 65, p. 915-922.
Shoen, R., White, D. E., and Hemley, J. J., 1974, Argillization by descending acid atSteamboat Springs, Nevada: Clays and Clay Minerals, v. 22, p. 1-22.
Siegel, D. I., 1989, Geochemistry of the Cambrian-Ordovician aquifer system in the northernmidwest: U.S. Geological Survey Professional Paper 1405-D, 76 p.
Simmons, S. F., and Browne, P. R. L., 2000, Hydrothermal minerals and precious metals inthe Broadlands-Ohaaki Geothermal systems: Implications for understanding low-sulfidation epithermal environments: Economic Geology, v. 95, p. 971-999.
Simo, J. A., Freiberg, P. G., and Freiberg, K. S., 1996, Geological constraints on arsenic ingroundwater with applications to groundwater modeling: Water Resources CenterGroundwater Research Report GRR 96-01, 60 p.
Singer, P. C., and Stumm, W., 1970, Acidic mine drainage: the rate-determining step:Science, v. 167, p. 1121-1123.
Singh, D. B., Prasad, G., Rupainwar, D. C., and Singh, V. N., 1988, As(III) removal fromaqueous solution by adsorption: Water, Air & Soil Pollution, v. 42, p. 373-386.
Slattery, M., Kenah, C., Slattery, L., and Musser, K., 2000, Occurrence and release of groundwater arsenic in public water supply wells in Ohio: in 2000 Midwest Ground WaterConference, Columbus, Ohio.

References Cited 461
Sloss, L. L., 1963, Sequences in the cratonic interior of North America: Geological Society ofAmerica Bulletin, v. 74, no. 2, p. 93-114.
Smedley, P. L., Edmunds, W. M., and Pelig-Ba, K. B., 1996, Mobility of arsenic ingroundwater in the Obuasi gold-mining area of Ghana: some implications for humanhealth: in Appleton, J. D., Fuge, R., and McCall, G. J. H., eds., EnvironmentalGeochemistry and Health, Geological Society Special Publication No. 113, p. 163-181.
Smedley, P. L., and Kinniburgh, D. G., 2001, Source and behaviour of arsenic in naturalwaters, U.N. Synthesis Report on Arsenic in Drinking Water: Geneva, World HealthOrganization, p. 1-61.
-, 2002, A review of the source, behaviour and distribution of arsenic in natural waters:Applied Geochemistry, v. 17, no. 5, p. 517-568.
Smedley, P. L., Kinniburgh, D. G., Milne, C., Huq, S. I., and Ahmed, K. M., 2001a, Changeswith time: piezometer monitoring: in Kinniburgh, D. G., and Smedley, P. L., eds., Arseniccontamination of groundwater in Bangladesh, British Geological Survey Technical ReportWC/00/19, Keyworth, p. 175-185.
Smedley, P. L., Kinniburgh, D. G., Milne, C., Trafford, J. M., Huq, S. I., and Ahmed, K. M.,2001b, Hydrogeochemistry of three Special Study Areas: in Kinniburgh, D. G., andSmedley, P. L., eds., Arsenic contamination of groundwater in Bangladesh, BritishGeological Survey Technical Report WC/00/19, Keyworth, p. 105-149.
Smedley, P. L., Nicolli, H. B., Macdonald, D. M. J., Barros, A. J., and Tullio, J. O., 2002,Hydrogeochemistry of arsenic and other inorganic constituents in groundwaters from LaPampa, Argentina: Applied Geochemistry, v. 17, no. 3, p. 259-284.
Smedley, P. L., Zhang, M., Zhang, G. Y., and Luo, Z. D., 200lc, Arsenic and other redox-sensitive elements in groundwater from the Huhhot Basin, Inner Mongolia: in Cidu, R.,ed., Water Rock Interaction: Lisse, A.A. Balkema, p. 581-584.
-, in press, Mobilisation of arsenic and other trace elements in fluviolacustrine aquifers of theHuhhot Basin, Inner Mongolia: Applied Geochemistry.
Smith, A. L., Lingas, E. O., and Rahman, M., 2000, Contamination of drinking-water byarsenic in Bangladesh: a public health emergency: Bulletin of the World HealthOrganization, v. 78, p. 1093-1103.
Smith, B. C., 1996, Fundamentals of Fourier Transform Infrared Spectroscopy: New York,CRC Press, 202 p.
SOES/DCH, 2000, Groundwater arsenic contamination in Bangladesh: Calcutta and Dhaka,School of Environmental Studies, Jadavpur University, Calcutta, India and DhakaCommunity Hospital, Dhaka, Bangladesh.
Sohrin, Y., Matsui, M., Kawashima, M., Hojo, M., and Hasegawa, H., 1997, Arsenicbiogeochemistry affected by eutrophication in Lake Biwa, Japan: Environmental Science& Technology, v. 31, p. 2712-2720.
Solley, W. B., Pierce, R. R., and Perlman, H. P., 1988, Estimated Use of Water in the UnitedStates in 1985: U.S. Geological Survey Circular 1004, 82 p.
-, 1998, Estimated use of water in the United States in 1995: U.S. Geological Survey, 1200,71 p.
Sonderegger, J. L., and Ohguchi, T., 1988, Irrigation related arsenic contamination of a thin,alluvial aquifer, Madison River Valley, Montana, U.S.A.: Environmental Geology andWater Sciences, v. 11, p. 153-161.
Soussan, T., 2001, Bill would void arsenic standard, Albuquerque Journal: Thursday,February 1, 2001, p. D3.
Sposito, G., 1984, The Surface Chemistry of Soils, Oxford University Press, 234 p.Spycher, N. F., and Reed, H. M., 1989a, As(III) and Sb(III) sulfide complexes: An evaluation
of stoichimetry and stability from existing experimental data: Geochimica etCosmochimica Acta, v. 53, p. 2185-2194.

462 References Cited
-, 1989b, Evolution of a Broadlands-type epithermal ore fluid along alternative P-T paths:Implications for the transport and deposition of base, precious and volatile metals:Economic Geology, v. 84, p. 328-359.
Stanton, M. R., Grimes, D. J., Sanzolone, R. F., and Sutley, S. J., 1998, Preliminarygeochemical data from Santa Fe Group sediments in the 98th St. drill core, Middle RioGrande Basin, near Albuquerque, New Mexico: U.S. Geological Survey Open-File Report98-230, 59 p.
Stanton, M. R., Sanzolone, R. F., Sutley, S. J., Grimes, D. J., and Meier, A. M., 2001a,Mineralogical and geochemical constraints on Fe and As residence and mobility in theAlbuquerque Basin-Examples from basin sediments and volcanic rocks: in Cole, J. C., ed.,U.S. Geological Survey Middle Rio Grande Basin Study: Albuquerque, New Mexico, U.S.Geological Survey Open-File Report 00-488, p. 45-46.
Stanton, M. R., Sanzolone, R. F., Sutley, S. J., Grimes, D. J., Meier, A. M., and Lamothe, P.J., 200 1b, Abundance, residence, and mobility of arsenic in Santa Fe Group sediments,Albuquerque Basin, New Mexico: Rocky Mountain and South-Central Sections:Geological Society of America, 2001 Abstracts with Programs, v. 33, no. 5, p. A-2.
Stanton, W. I., 1991, The habitat and origin of lead ore in Grebe Swallet Mine, Charterhouse-on-Mendip, Somerset: Proceedings - University of Bristol Spelaeological Society, v. 19,no. 1, p. 43-65,
Stauffer, R. E., and Thomson, J. M., 1984, Arsenic and antimony in geothermal waters ofYellowstone National Park, Wyoming, USA: Geochimica et Cosmochimica Acta, v. 48,p. 2547-2561.
Stein, H. J., Markey, R. J., Morgan, J. W., Hannah, J. L., and Zak, K., 1997, Re-Os dating ofshear-hosted Au deposits using molybdenite: in Papunen, H., ed., Mineral Deposits:Research and Exploration--Where Do They Meet?: Rotterdam, Balkema, p. 313-317.
Steltenpohl, M. G., Heatherington, A. L., and Guthrie, G. M., 1995, Geologic setting andAlleghanian development of the Alabama and southwest Georgia inner and southernpiedmonts: in Guthrie, G. M., ed., The timing and tectonic mechanisms of the Alleghanianorogeny, Alabama piedmont: A guidebook for the thirty second annual field trip of theAlabama Geological Society.
Stenger, D. P., Kesler, S. E., Peltonen, D. R., and Tapper, C. J., 1998, Deposition of gold incarlin-type deposits; the role of sulfidation and decarbonation at Twin Creeks, Nevada:Economic Geology and the Bulletin of the Society of Economic Geologists, v. 93, no. 2, p.201-215.
Steuer, J. J., and Hunt, R. J., 2001, Use of a watershed-modeling approach to assesshydrologic effects of urbanization, North Fork Pheasant Branch basin near Middleton,Wisconsin: U.S. Geological Survey Water-Resources Investigations Report, 01–4113, 49P ·
Stojanovic, M., 1982, Crystallographic study of realgar and orpiment: Zapisnici SrpskoGeolosko Drustvo, p. 51-53.
Stollenwerk, K. G., 1995, Modeling the effects of variable groundwater chemistry onadsorption of molybdate: Water Resources Research, v. 31, p. 347-357.
-, 1996, Simulation of phosphate transport in sewage-contaminated groundwater, Cape Cod,Massachusetts: Applied Geochemistry, v. 11, p. 317-324.
-, 1998, Molybdate transport in a chemically complex aquifer: Field measurements comparedwith solute transport model predictions: Water Resources Research, v. 34, p. 2727-2740.
Stolz, J. F., and Oremland, R. S., 1999, Bacterial respiration of arsenic and selenium: FEMSMicobiology Letters, v. 23, p. 615-627.
Stone, A. T., and Ulrich, H., 1989, Kinetics and reaction stoichiometry in the reductivedissolution of manganese(IV) dioxide and Co(III) oxide by hydroquinone: Journal ofColloid Interface Science, v. 102, p. 509-522.

References Cited 463
Stowell, H. H., Guthrie, G. M., and Lesher, C. M., 1989, Metamorphism and goldmineralization in the Wedowee Group, Goldville District, northern Piedmont, Alabama:Geological Survey of Alabama, Report 136, 133-158 p.
Stowell, H. H., Lesher, C. M., Green, N., Peng, S., Guthrie, G., and Sinha, A. K., 1996,Metamorphism and gold mineralization in the Blue Ridge, southernmost Appalachians:Economic Geology, v. 91, p. 1115-1144.
Strickland, J. D. H., and Parson, T. R., 1968, A practical handbook of seawater analysis:Canada, Fisheries Research Board, Bulletin, v. 167, p. 50.
Stumm, W., 1992, Chemistry of the solid-water interface: New York, Wiley Interscience, 428
p .Stumm, W., Hohl, H. H., and Dalang, F., 1976, Interaction of metal ions with hydrous oxide
surfaces: Croat. Chem. Acta, v. 48, p. 491-504.Stumm, W., Huang, C. P., and Jenkins, S. R., 1970, Specific chemical interactions affecting
the stability of dispersed system: Croat. Chem. Acta, v. 42, p. 223-244.Stumm, W., Kummert, R., and Sigg, L., 1980, A ligand exchange model for the adsorption of
inorganic and organic ligands at hydrous oxide interfaces: Croat. Chem. Acta, v. 53, p.291-312.
Stumm, W., and Morgan, J. J., 1981, Aquatic Chemistry, John Wiley & Sons, 780 p.-, 1996, Aquatic Chemistry: Chemical Equilibria and Rates in Natural Waters, John Wiley
and Sons, 1022 p.Su, C., and Suarez, D. L., 1997, In situ infrared speciation of adsorbed carbonate on
aluminum and iron oxides: Clays and Clay Minerals, v. 45, p. 814-825.Suarez, D. L., Goldberg, S., and Su, C., 1999, Evaluation of oxyanion adsorption mechanisms
on oxides using FTIR spectroscopy and electrophoretic mobility: in Sparks, D. L., andGrundl, T. J., eds., Mineral-Water Interfacial Reactions, American Chemical Society, p.137-178.
Suk, D., Peacor, D. R., and Van der Voo, R., 1990, Replacement of pyrite framboids bymagnetite in limestone and implications for palaeomagnetism: Nature, v. 345, no. 6276, p.611-613.
Sullivan, K. A., and Aller, R. C., 1996, Diagenetic cycling of arsenic in Amazon shelfsediments: Geochimica et Cosmochimica Acta, v. 60, no. 9, p. 1465-1477.
Sun, G., Pi, J., Li, B., Guo, X., Yamauchi, H., and Yoshida, T., 2001, Arsenic exposure andhealth effects: in Abernathy, C. O., Calderon, R. L., and Chappell, W. R., eds., ArsenicExposure and Health Effects IV, Elsevier, p. 79-85.
Sun, X., and Doner, H., 1998, Adsorption and oxidation of arsenite on goethite: Soil Science,v. 163, p. 278-287.
Sun, X., and Doner, H. E., 1996, An investigation of arsenate and arsenite bonding structureson goethite by FTIR: Soil Science, v. 161, p. 865-872.
Sun, X., Doner, H. E., and Zavarin, M., 1999, Spectroscopy study of arsenite [As(III)]oxidation on Mn-substituted goethite: Clays and Clay Minerals, v. 47, p. 474-480.
Sverjensky, D. A., and Garven, G., 1992, Geochemistry; Tracing great fluid migrations:Nature, v. 356, no. 6369, p. 481-482.
Swedlund, P. J., and Webster, J. G., 1999a, Adsorption and polymerisation of silicic acid onferrihydrite, and its effect on arsenic adsorption: Water Research, v. 33, p. 3413-3422.
-, 1999b, Hydrous ferric oxide adsorption of arsenic from geothermal bore effluents: theeffects of moni-silic acid: Water Research, v. 33, p. 3413-3422.
Switzer, B. J., Bindi, A. B., Buzzelli, J., Stolz, J. F., and Oremland, R. S., 1998, Bacillusarsenicoselenatis, sp. nov., and Bacillus selentireducens, sp nov.: two haloalkaliphilesfrom Mono Lake California that respire oxyanions of selenium and arsenic.: Archives ofMicrobiology, v. 171, p. 19-30.

464 References Cited
Symons, D. T. A., Sangster, D. F., and Leach, D. L., 1997, Paleomagnetic dating ofMississippi Valley-type Pb-Zn-Ba deposits: in Sangster, D. F., ed., Carbonate-hosted lead-zinc deposits, Special Publication - Society of Economic Geologists, p. 515-526.
Tandukar, E. N., 2001, Scenario of arsenic contamination in groundwater in Nepal.:Department of Water Supply and Sewerage (DWSS), Nepal, 6 p.
Tasneem, M. A., 1999, Impact of agricultural and industrial activities on groundwater qualityin Kasur area.: The Nucleus, Quarterly Journal of the Pakistan Atomic EnergyCommission, v. 36.
Taylor, J. B., Bennett, S. L., and Heyding, R. D., 1965, Physical properties of and arsenic:Journal of Physics and Chemistry of Solids, v. 26, p. 69-74.
Taylor, R. M., 1987, Non-silicate Oxides and Hydroxides: in Newman, A. C. D., ed.,Chemistry of Clays and Clay Minerals, Wiley Interscience, p. 129-201.
Tazaki, K., 1995, Electron microscopic observations of biomineralization in biomats from hotsprings: Journal of the Geological Society of Japan, v. 101, p. 304-314.
Tempel, R. N., Shevenell, L. A., Lechler, P., and Price, J., 1999, Geochemical modelingapproach to predicting arsenic concentrations in a mine pit lake: Applied Geochemistry, v.15, p. 475-492.
Tessier, A., Campbell, P. G. C., and Bisson, M., 1979, Sequential extraction procedure for thespeciation of particulate trace metals: Analytical Chemistry, v. 51, p. 844-851.
Thanabalasingam, P., and Pickering, W. F., 1986a, Arsenic sorption by humic acids:Environmental Pollution Series B, v. 12, p. 233-246.
-, 1986b, Effect of pH on interaction between As(III) or As(V) and Manganese Dioxide:Water, Air, and Soil Pollution, p. 205-216.
Thomas, W. A., 1989, The Appalachian-Ouachita Orogen beneath the Gulf Coastal Plainbetween the outcrops in the Appalachian and Ouachita Mountains: in Hatcher, R. D. J.,Thomas, W. A., and Viele, G. W., eds., The Appalachian-Ouachita orogen in the UnitedStates: Boulder Colorada, Geological Society of America, p. 537-554.
Thomson, J. M., 1979, Arsenic and fluoride in the upper Madison River system: Firehole andGibbon Rivers and their tributaries, Yellowstone National Park, Wyoming and SoutheastMontana: Environmental Geology, v. 3, p. 13-21.
-, 1985, Chemistry of thermal and non-thermal springs in the vicinity of Lassen VolcanicNational Park: Journal of Volcanology and Geothermal Research, v. 25, p. 81-104.
Thorn, C. R., McAda, D. P., and Kernodle, J. M., 1993, Geohydrologic framework andhydrologic conditions in the Albuquerque Basin, central New Mexico: U.S. GeologicalSurvey, 93-4149, 106 p.
Thurman, E. M., 1985, Organic Geochemistry of Natural Waters, Kluwer, 497 p.Timperley, M. H., and Huser, B. A., 1996, Inflows of geothermal fluid chemicals to the
Waikato River catchment, New Zealand: New Zealand Journal of Marine and FreshwaterResearch, v. 30, p. 525-535.
Titan, 1994, Milltown reservoir sediments operable unit, working draft, final remedialinvestigation report Volume 1, Prepared for Atlantic Richfield Company, Prepared by:Bozeman, Montana, Titan Environmental Corporation.
-, 1995, Milltown Reservoir Sediments Operable Unit Final Draft Remedial InvestigationReport: Anaconda, ARCO.
-, 1996, Milltown Reservoir Sediments Site Draft Feasibility Study Report, ARCO.Titus, F. B., 1961, Ground-water geology of the Rio Grande trough in north-central New
Mexico, with sections on the Jemez Caldera and Lucero Uplift, Guidebook of theAlbuquerque country: in Northrop, S. A., ed., 12th Field Conference, New MexicoGeological Society, p. 186-192.
Toran, L., 1987, Sulfate contamination in groundwater from a carbonate-hosted mine: Journalof Contaminant Hydrology, v. 2, no. 1, p. 1-29.

References Cited 465
Toran, L., and Harris, R. F., 1989, Interpretation of sulphur and oxygen isotopes in biologicaland abiological sulfide oxidation: Geochimica et Cosmochimica Acta, v. 53, no. 2341-2348.
Tossell, J. A., 1997a, Theoretical studies on arsenic oxide and hydroxide species in mineralsand in aqueous solution: Geochimica et Cosmochimica Acta, v. 61, p. 1613-1623.
-, 1997b, Theoretical studies on arsenic oxide and hydroxide species in minerals and inaqueous solutions: Geochimica et Cosmochimica Acta, v. 61, p. 1613-1623.
Trafford, J. M., Lawrence, A. R., Macdonald, D. M. J., Van Dan, N., and Tran, D. N. H. N.T., 1996, The effect of urbanisation on the groundwater quality beneath the city of Hanoi,Vietnam.: British Geological Survey Technical Report WC/96/22, Keyworth.
Trainer, F. W., 1974, Ground water in the southwestern part of the Jemez Mountainsvolcanic region, New Mexico, 25th Field Conference, New Mexico Geological Society, p.337-345.
-, 1975, Mixing of thermal and nonthermal waters in the margin of the Rio Grande Rift,Jemez Mountains, New Mexico, New Mexico Geological Society 26th Field Conference,p. 213-218.
-, 1984, Thermal mineral springs in Cañon de San Diego as a window into Valles Caldera,New Mexico, 35th Field Conference, New Mexico Geological Society, p. 249-255.
Trainer, F. W., Rogers, R. J., and Sorey, M. L., 2000, Geothermal hydrology of VallesCaldera and the southwestern Jemez Mountains, New Mexico: U.S. Geological SurveyWater-Resources Investigations Report, 00-4067, 115 p.
Trentelman, K., Stodulski, L., and Pavlosky, M., 1996, Characterization of pararealgar andother light-induced transformation products from realgar by Raman microspectroscopy:Analytical Chemistry, p. 1755-1761.
Tseng, W. P., Chu, H. M., How, S. W., Fong, J. M., Lin, C. S., and Yeh, S., 1968, Prevalenceof skin cancer in an endemic area of chronic arsenicism in Taiwan: Journal of the NationalCancer Institute, v. 40, p. 453-463.
Tsuda, T., Ogawa, T., Babazono, A., Hamada, H., Kanazawa, S., Mino, Y., Aoyama, H.,Yamamoto, E., and Kurumatani, N., 1992, Historical cohort studies in three arsenicpoisoning areas in Japan: Applied Organometallic Chemistry, v. 6, no. 4, p. 333-341.
Turekian, K. K., and Wedepohl, K. H., 1961, Distribution of the elements in some major unitsof the earth's crust: Geological Society of America Bulletin, v. 72, no. 2, p. 175-191.
U.S. Bureau of the Census, 1999, Housing: Then and now, 50 years of decennial censuses,Historical census of housing: Washington, D.C., U.S. Bureau of the Census.
U.S. Environmental Protection Agency, 1976, Quality Criteria for Water, 286 p.-, 2001a, Drinking water standard for arsenic: USEPA Fact Sheet 815-F- 00-105, 3 p.-, 2001b, Factoids: Drinking water and ground water statistics for 2000: U.S. Environmental
Protection Agency, EPA 816-K-01-004, 10 p.-, 2002, Drinking water from household wells: U.S. Environmental Protection Agency, EPA
816-K.-02-003, 19 p.Udaloy, A. G., 1988, Arsenic mobilization in response to the draining and filling of the
reservoir at Milltown, Montana: M.S. Thesis: University of Montana, 140 p.Umitsu, M., 1993, Late Quaternary sedimentary environments and landforms in the Ganges
Delta: Sedimentary Geology, v. 83, p. 177-186.Upadhyay, S. K., 1993, Use of groundwater resources to alleviate poverty in Nepal: policy
issues.: in Kahnert, F., and Levine, G., eds., Groundwater irrigation and the rural poor:options for development in the Gangetic Basin: Washington D.C., World Bank.
USEPA, 1972, Water Quality Criteria 1972, U.S. Environmental Protection Agency, p.unpaginaged.
-, 1986, Quality Criteria for Water 1986: U.S. Environmental Protection Agency, 440/5-86-001.

466 References Cited
-, 1994, Methods for the determination of metals in environmental samples-Supplement 1:EPA-600/R-94-111.
UWEIL, 1994, Pretreatment of sulphates and sulfides, Technical Procedure 30.0: Universityof Waterloo, 30 p.
Vairavamurthy, M. A. e., Schoonen, M. A. A. e., Eglinton, T. I. e., Luther, G. W., III (editor),and Manowitz, B. e., 1994, Geochemical transformations of sedimentary sulfur: 208thnational meeting of the American Chemical Society, v. 612, p. 467.
Van Beek, C. G. E. M., 1980, A model for the induced removal of iron and manganese fromgroundwater in the aquifer: in 3rd Water-Rock Interaction Symposium, Edmonton,Canada, p. 29-31.
Van der Hoek, E., Bonouvrie, P. A., and Comans, R. N. J., 1994, Sorption of As and Se onmineral components of fly ash: relevance for leaching processes: Applied Geochemistry,v. 9, p. 403-412.
Van Geen, A., Robertson, A. P., and Leckie, J. O., 1994, Complexation of carbonate speciesat the goethite surface: implications for adsorption of metal ions in natural waters:Geochimica et Cosmochimica Acta, v. 58, p. 2073-2086.
Vergasova, L. P., 1983, Fumarole incrustations of lava flows of the effusive-explosive periodof the Great Tolbachik fissure eruption: Vulkanologiya i Seysmologiya, v. 6, p. 75-87.
Vesala, A., and Saloma, E., 1977, Determination of basicity constants by potentiostatictitration: Finnish Chemical Letters, p. 160-163.
Viets, J. G., and Leach, D. L., 1990, Genetic implications of regional and temporal trends inore fluid geochemistry of Mississippi Valley-type deposits in the Ozark region: EconomicGeology, v. 85, no. 4, p. 842-861.
Voigt, D. E., and Brantley, S. L., 1997, Chemical fixation of arsenic in contaminated soils:Applied Geochemistry, v. 11, p. 633-643.
Vorobeva, S. V., Ivakin, A. A., Gorelov, A. M., and Gertman, E. M., 1977, Thio-complexesof Arsenic(III) in solution: Russian Journal of Inorganic Chemistry, v. 22, p. 1479-1481.
Voss, R. L., and Hagni, R. D., 1985, The application of cathodoluminescence microscopy tothe study of sparry dolomite from the Viburnum Trend, southeast Missouri: in Hausen, D.M., and Kopp, O. C., eds., Mineralogy: Applications to the minerals industry; proceedingsof the Paul F. Kerr memorial symposium: New York, NY, United States, p. 51-68.
Wagman, D. D., Evans, W. H., Parker, V. B., Halow, I., Bailey, S. M., and Schumm, R. H.,1968, Selected Values of Chemical Thermodynamic Properties. Tables for the FirstThirty-Four Elements in the Standard Order of Arrangement: NBS Technical Note 270-3,264 p.
Wagman, D. D., Evans, W. H., Parker, V. B., Schumm, R. H., Halow, I., Bailey, S. M.,Churney, K. L., and Nuttall, R. L., 1982, The NBS Tables of Chemical ThermodynamicProperties. Selected Values for Inorganic and Cl and C2 Organic Substances in SI Units:Journal of Physical and Chemical Reference Data, v. 11, p. 392.
Wang, G., 1984, Arsenic poisoning from drinking water in Xinjiang: Chinese Journal ofPreventative Medicine, v. 18, p. 105-107.
Wang, G. Q., Huang, Y. Z., Xiao, B. Y., Qian, X. C., Yao, H., Hu, Y., Gu, Y. L., Zhang, C.,and Liu, K. T., 1997, Toxicity from water containing arsenic and fluoride in Xinjiang:Fluoride, v. 30, no. 2, p. 81-84.
Wang, L., and Huang, J., 1994, Chronic arsenism from drinking water in some areas ofXinjiang, China: in Nriagu, J. O., ed., Arsenic in the Environment, Part II: Human Healthand Ecosystem Effects, John Wiley, p. 159-172.
WAPDA/EUAD, 1989, Booklet on hydrogeological map of Pakistan 1:2,000,000.scale:Lahore, Water and Power Development Authority and Environment & Urban AffairsDivision, Government of Pakistan.

References Cited 467
Ward, D. M., Ferris, M. J., Nold, S. C., and Bateson, M. M., 1998, Natural view of microbialbiodiversity within hot spring cyanobacterial mat communities: Microbio. & Molec. Bio.Rev, v. 62, p. 1353-1370.
Warner, K. L., 1998, Water-quality assessment of the lower Illinois River Basin--Environmental setting: U.S. Geological Survey, 97-4165, 50 p.
-, 2001, Arsenic in glacial drift aquifers and the implication for drinking water-- LowerIllinois River Basin: Ground Water, v. 39, no. 3, p. 433-442.
Wauchope, R. D., 1975, Fixation of arsenical herbicides, phosphates and arsenate in soils:Journal of Environmental Quality, v. 14, p. 355-358.
Wauchope, R. D., and McDowell, L. L., 1984, Adsorption of phosphate, arsenate,methanearsonate, and cacodylate by lake and stream sediments: Comparisons with soils:Journal of Environmental Quality, v. 13, p. 499-504.
Waychunas, G. A., 1991, Crystal Chemistry of Oxides and Hydroxides: in Lindsley, D. H.,ed., Oxide Minerals: Petrologic and Magnetic Significance, Mineralogical Society ofAmerica, p. 11-68.
Waychunas, G. A., Davis, J. A., and Fuller, C. C., 1995, Geometry of sorbed arsenate onferrihydrite and crystalline FeOOH: Re-evaluation of EXAFS results and topologicalfactors in predicting sorbate geometry, and evidence for monodentate complexes:Geochimica et Cosmochimica Acta, v. 59, p. 3655-3661.
Waychunas, G. A., Fuller, C. C., Rea, B. A., and Davis, J. A., 1996, Wide angle X-rayscattering (WAXS) study of "two-line" ferrihydrite structure; effect of arsenate sorptionand counterion variation and comparison with EXAFS results: Geochimica etCosmochimica Acta, v. 60, p. 1765-1781.
Waychunas, G. A., Rea, B. A., Fuller, C. C., and Davis, J. A., 1993, Surface chemistry offerrihydrite: Part 1. EXAFS studies of the geometry of coprecipitated and adsorbedarsenate.: Geochimica et Cosmochimica Acta, v. 57, p. 2251 -2269.
Waypa, J. J., Elimelech, M., and Hering, J. G., 1997, Arsenic removal by RO and NFmembranes: Journal - American Water Works Association, v. 89, p. 102-114.
Weaver, T. R., and Bahr, J. M., 1991, Geochemical evolution in the Cambrian-Ordoviciansandstone aquifer, eastern Wisconsin . 1. Major ion and radionuclide distribution: GroundWater, v. 29, no. 3, p. 350-356.
Webster, J. G., 1990, The solubility of and speciation of As in dilute and sulfide-bearing fluids at 25°C and 90°C: Geochimica et Cosmochimica Acta, v. 54, p. 1009-1017.
-, 1999, The source of arsenic (& other elements) in the Marbel-Matingao River catchment,Mindanao, Philippines: Geothermics, v. 28, p. 95-111.
Webster-Brown, J. G., 2000, Chemical contaminants and their effects. In EnvironmentalSafety and Health Issues in Geothermal Development.: in World Geothermal Congress,Kazuno, Japan.
Weissberg, B. G., 1969, Gold-silver ore-grade precipitates from New Zealand thermal waters:Economic Geology, v. 64, p. 95-108.
Weissberg, B. G., Dickson, F. W., and Tunell, G., 1966, Solubility of orpiment inat 50-200°C and 100-1500 bars, with geological applications: Geochimica et
Cosmochimica Acta, v. 30, p. 815-827.Welch, A. H., 1994, Ground-water quality and geochemistry in Carson and Eagle Valleys,
western Nevada and eastern California: U.S. Geological Survey, 93-33, 99 p.-, 1998, Arsenic in ground water of the United States; processes leading to widespread high
concentrations: in International Conference on arsenic pollutioin of ground water inBangladesh: Causes, effects and remedies, Dhaka, Bangladesh, p. 146.
-, 1999, Arsenic in ground water supplies of the United States: in Chappell, W. R., Abernathy,C. O., and Calderon, R. L., eds., Arsenic Exposure and Health Effects, Elsevier, p. 416.

468 References Cited
Welch, A. H., Lawrence, S. J., Lico, M. S., Thomas, J. M., and Schaefer, D. H., 1997,Ground-water quality assessment of the Carson River basin, Nevada and California;results of investigations, 1987-91: U. S. Geological Survey Water-Supply Paper, 0886-9308, 93 p.
Welch, A. H., Lico, M. S., and Hughes, J. L., 1988, Arsenic in ground water of the westernUnited States: Ground Water, v. 26, no. 3, p. 333-347.
Welch, A. H., Westjohn, D. B., Helsel, D. R., and Wanty, R. B., 2000, Arsenic in groundwater of the United States: Occurrence and geochemistry: Ground Water, v. 38, no. 4, p.589-604.
Weller, W. W., and Kelley, K. K., 1964, Low-temperature heat capacities and entropies at298.15 °K of sulfides of arsenic, germanium, and nickel: U.S. Bureau of Mines ReportInvestigations 6511, 7 p.
Wentz, D. A., Bonn, B. A., Carpenter, K. D., Hinkle, S. R., Janet, M. L., Rinella, F. A.,Uhrich, M. A., Waite, I. R., Laenen, A., and Bencala, K. E., 1998, Water quality in theWillamette Basin, Oregon, 1991-95: U.S. Geological Survey Circular 1161, 34 p.
Westall, J. C., 1982, FITEQL: A program for the determination of chemical equilibriumconstants from experimental data: Oregon State University Technical Report 82-02, 61 p.
Westall, J. C., and Hohl, H., 1980, A comparison of electrostatic models for theoxide/solution interface: Advances in Colloid Interface Science, v. 12, p. 265-294.
Westjohn, D. B., and Weaver, T. L., 1995, Configuration of freshwater/saline-water interfaceand geologic controls on distribution of freshwater in a regional aquifer system, centralLower Peninsula of Michigan: U.S. Geological Survey, Water Resources InvestigationsReport 94-4242, 44 p.
-, 1998, Hydrogeologic framework of the Michigan Basin Regional Aquifer System: U.S.Geological Survey Professional Paper 1418, 47 p.
Whelan, J. F., Cobb, J. C., and Rye, R. O., 1988, Stable isotope geochemistry of sphaleriteand other mineral matter in coal beds of the Illinois and Forest City basins: EconomicGeology, v. 83, no. 5, p. 990-1007.
White, D. E., 1967, Mercury and base-metal deposits with associated thermal and mineralwaters: in Barnes, H., ed., Geochemistry of Hydrothermal Ore Deposits: New York, Holt,Rinehart, and Winston, p. 575-631.
-, 1968, Environments of generation of some base-metal ore deposits: Economic Geology, v.63, p. 301-335.
-, 1974, Diverse origins of hydrothermal fluids: Economic Geology, v. 69, p. 954-973.-, 1981, Active geothermal systems and hydrothermal ore deposits: Economic Geology, v.
75th Anniversary Volume, p. 392-423.White, D. E., Fournier, R. O., and Heropoulos, C., 1992, Gold and other minor elements
associated with the hot springs and geysers of Yellowstone National Park, Wyoming,supplemented with data from Steamboat Springs, Nevada: United States GeologicalSurvey Bulletin 2001, 19 p.
White, D. E., Muffler, L. J. P., and Truesdell, A. H., 1971, Vapour-dominated hydrothermalsystems compared with hot-water systems: Economic Geology, v. 66, p. 75-97.
White, D. E., and Waring, G. A., 1963, Volcanic emanations: in Fleischer, M., ed., Data ofGeochemistry, U.S. Geological Survey Professional Paper 440-K., p. 29.
WHO, 1993, Guidelines for Drinking Water Quality, 2nd Ed, Volume 1 Recommendations:World Health Organization, 188 p.
Wiersma, C. L., and Rimstidt, J. D., 1984, Rates of reaction of pyrite and marcasite withferric iron at pH 2: Geochimica et Cosmochimica Acta, v. 48, no. 1, p. 85-92.
Wiese, R. G., Jr., Muir, I. J., and Fyfe, W. S., 1990, Trace element siting in iron sulfides fromcoal determined by secondary ion mass spectrometry: Energy Sources, v. 12, no. 3, p. 251-264.

References Cited 469
Wijnja, H., and Schulthess, C. P., 2000, Interaction of carbonate and organic anions withsulfate and selenate adsorption on an aluminum oxide: Soil Science Society of AmericaJournal, v. 64, p. 898-908.
Wilde, F. D., and Radtke, D. B., 1998, National Field Manual for the collection of water-quality data, U.S. Geological Survey Techniques of Water-Resources Investigations, Book9, Chapter A6, p. 128.
Wilke, J. A., and Hering, J. G., 1998, Rapid oxidation of geothermal arsenic(III) instreamwaters of the eastern Sierra Nevada: Environmental Science & Technology, v. 32,p. 657-662.
Wilkie, J. A., and Hering, J. G., 1996, Adsorption of arsenic onto hydrous ferric oxide: effectsof adsorbate/adsorbent ratios and co-occurring solutes: Colloids and Surfaces A, v. 107, p.97-110.
Willett, I. R., Chartres, C. J., and Nguyen, T. T., 1988, Migration of phosphate intoaggregated particles of ferrihydrite: Journal of Soil Science, v. 39, p. 275-282.
Williams, M., 1997, Mining-related arsenic hazards: Thailand case-study: British GeologicalSurvey, WC/97/49, 36 p.
-, 2001, Arsenic in mine waters: an international study: Environmental Geology, v. 40, p.267-278.
Williams, M., Fordyce, F., Paijitprapapon, A., and Charoenchaisri, P., 1996, Arseniccontamination in surface drainage and groundwater in part of the southeast Asian tin belt,Nakhon Si Thammarat Province, southern Thailand: Environmental Geology, v. 27, no. 1,p. 16-33.
Winston, R. B., 1990, Vitrinite reflectance of Alabama's bituminous coal: Geological Surveyof Alabama Circular, 139, 54 p.
Wisconsin Department of Natural Resources, 1997, Status of groundwater in Wisconsin,WDNR: Bureau of Drinking Water and Ground Water, PUBL-DG-043-97, 51 p.
-, 1999, Answers to your questions about groundwater, Bureau of Drinking Water andGround Water.
Woessner, W. W., 1995, Milltown Groundwater Injury Assessment report: Department ofJustice, Natural Resource Damage Litgation Program, 36 p.
Woessner, W. W., Moore, J. N., Johns, C., Popoff, M. A., Sartor, L. C., and Sullivan, M.,1984, Arsenic source and water supply remedial action study, Milltown, Montana: Finalreport: Department of Geology, University of Montana, 448 p.
Woessner, W. W., and Popoff, M. A., 1982, Hydrogeologic survey of Milltown, Montana andvicinity: Department of Geology, University of Montana, 130 p.
Woo, N. C., and Choi, M. J., 2001, Arsenic and metal contamination of water resources frommining wastes in Korea: Environmental Geology, v. 40, p. 305-311.
Wood, S. A., Tait, C. D., and Janecky, D. R., 1998, A Raman spectroscopic study ofthioarsenite and arsenite species in low-temperature aqueous solutions: in Proceedings, 9thWater-Rock Interaction Symposium, Taupo, New Zealand, p. 863-866.
Woodard and Curran, I., 1998, Final Remedial Investigation Report of Saco MunicipalLandfill Superfund Site, Saco Maine: Portland, Maine, Woodard and Curran, Inc., p.variously paginated.
WRUD, 2001, Preliminary study on arsenic contamination in selected areas of Myanmar:Water Resources Utilization Department, Ministry of Agriculture and Irrigation.
Wu, Y., Hagni, R. D., and Paarlberg, N., 1996, Silver distribution in iron sulfides at the Buickand Brushy Creek mines, Viburnum Trend, southeast Missouri: in Sangster, D. F., ed.,Carbonate-hosted lead-zinc deposits: Special Publication #4, Society of EconomicGeologists.

470 References Cited
Xu, H., Allard, B., and Grimvall, A., 1988, Influence of pH and organic substance on theadsorption of As(V) on geologic materials: Water, Air, and Soil Pollution, v. 40, p. 293-305.
Yardley, B., W.D., 1997, The evolution of fluids through the metamorphic cycle: in Yardley,B. J. a. B., ed., Fluid Flow and Transport in Rocks: Mechanisms and Effects: London,Chapman and Hall, p. 101-121.
Yates, D. E., Levine, S., and Healy, T. W., 1974, Site-binding model of the electrical doublelayer at the oxide/water interface: Chemical Society, Faraday Transactions, v. 1, no. 70, p.1807-1818.
Yeh, G. T., and Tripathi, V. S., 1991, A model for simulating transport of reactivemultispecies components: Model development and demonstration: Water ResourcesResearch, v. 27, p. 3075-3094.
Yokoyama, T., Takahashi, Y., and Tarutani, T., 1993, Simultaneous determination of arsenicand arsenious acids in geothermal water: Chemical Geology, v. 103, p. 103-111.
Young, C. A., and Robins, R. G., 2000, The solubility of As2S3 in relation to the precipitationof arsenic from process solutions: in Young, C. A., ed., Minor Elements 2000: Littleton,Colorado, Society of Mining, Metallurgy, and Exploration, Inc., p. 381-391.
Yu, S.-C., and Zoltai, T., 1972, Crystallography of a high-temperature phase of realgar:American Mineralogical Journal, v. 57, p. 1873-1876.
Zacek, V., and Ondrus, P., 1997, Mineralogy of recently formed sublimates from Katerinacolliery in Radvanice, eastern Bohemia, Czech Republic: Bulletin of the Czech GeologicalSurvey, v. 72, p. 289-302.
Zachara, J. M., Girvin, D. C., Schmidt, R. L., and Resch, C. T., 1987, Chromate adsorption onamorphous iron oxyhydroxide in the presence of major groundwater ions: EnvironmentalScience & Technology, v. 21, p. 589-594.
Zhang, E., and Davis, A., 1993, Coalification patterns of the Pennsylvanian coal measures inthe Appalachian foreland basin, western and south-central Pennsylvania: GeologicalSociety of America Bulletin, v. 105, p. 162-174.
Zhang, Y., Lockwood, J. R., III, Schervish, M. J., Gurian, P., and Small, M. J., 2001,Hierarchical modeling of arsenic concentration at entry points in US public drinking watersupplies: Carnegie Mellon University, 739, 12 p.
Zheng, C., and Bennett, G. D., 1995, Applied Contaminant Transport Modeling, Theory andPractice: New York, Van Nostrand Reinhold, 440 p.
Zobrist, J., Dowdle, P. R., Davis, J. A., and Oremland, R. S., 1998, Microbial arsenatereduction vs arsenate sorption: Experiments with ferrihydrite suspensions.: MineralogicalMagazine, v. 62A, p. 1707-1708.
-, 2000, Mobilization of arsenite by dissimilatory reduction of adsorbed arsenate:Environmental Science & Technology, v. 34, no. 22, p. 4747-4753.
Zuena, A. J., and Keane, N. W., 1985, Arsenic contamination in private potable well: in U.S.EPA National Conference on Environmental Engineering, Northeastern University ofBoston, Massachusetts, p. 717-725
INDEX
adsorption, 67-68, 72, 74, 77, 79-80, 82-85, 88, 93, 99-100, 316,327, 365, 374
alkaline, 17, 40, 70, 100, 188,231, 238, 403-404
aluminosilicate, 55-57, 238anoxic, 37, 39-40, 62-63, 72, 77,
120-121, 293, 329, 335-337,343, 353, 360, 378
anthropogenic, 27, 68, 128, 173,175-177, 314, 352
Appalachian, 127, 129-130, 132-133, 145, 147, 158-162, 164
aqueous species, 14-15, 23, 78, 85arsenate, 2, 12, 14, 19, 27, 39- 42,
44, 52, 56, 59, 62, 64, 67-69,72,78-81, 83-84, 88, 90-91, 99,110-112, 119-122, 179, 190,201, 284, 316, 352, 364, 397-398, 407, 409
arsenic (III) oxide, 16arsenic oxide, 1, 10, 18, 20, 39arsenic sulfide, 1, 7, 13, 20, 23,
25, 36, 38-39, 72, 164arsenious acid, 17-18, 24, 110-
111arsenite, 14, 18, 27, 39, 41, 56,
67-71, 80, 100, 108, 110, 113,119, 121, 179, 190, 284, 286,351-352, 364, 376, 378-379,397-398
arsenolite, 1, 3, 7, 10, 12-13, 16,24-25
arsenopyrite, 10-11, 34-38, 40,107, 114, 152, 154, 179, 191,
200-202, 241, 246-247, 259,268
As(III), 6, 16, 18-19, 37, 42, 46-50, 53-55, 57-65, 68-72, 74,76-91, 96-100, 118, 184, 192-194, 196, 203, 208, 245, 250,288, 323, 335, 337, 343, 345,352, 355, 357, 359-361, 364-369, 376-379, 397-400, 404,410
As(V), 6, 14, 37, 39-42, 44,46-65, 68-72, 74, 76-93, 96-100,201, 244-245, 250-251, 352,355, 359-361, 364-365, 376-379, 397-400, 403-404, 407,409-413, 417
Asia, 179-182, 202, 205, 207, 209
bacterial, 71, 237, 262, 366, 368Bangladesh, 2, 27, 61, 68, 179-
180, 182-186, 188, 190-192,196, 204, 207, 209, 211-227,229-231, 233-234, 236-241,244-257, 260, 314, 336
brine migration, 129-130buffering capacity, 262, 278, 407,
411, 418
calcium, 14, 89, 124, 238, 416,418
California, 168-169Cambodia, 179, 206-207carbonate, 4, 14, 27, 30-31, 40-41,
63, 67, 77, 83-84, 87, 104-105,108, 117, 127, 131-132, 136,161, 201, 203, 238, 256, 260,277-280, 294, 366, 372, 393,396, 416,418
chemical extraction, 28, 84chemisorption, 28, 41,45,47-50,
52-54, 56-58, 65, 75

472 Index
China, 164, 179,182,192,207-209
Clark Fork River, 330, 332-335,346-347
claudetite, 1, 7, 10, 13-14, 16,24-25
coal, 11, 127, 130, 139-140, 142-155, 157-164, 205
CODATA, 4coprecipitation, 30, 38, 40-41, 45,
249
desorption, 28, 41, 46-47, 68, 74,90-93, 98-100, 184, 198, 211,244, 246, 249-252, 260, 278,280, 295, 304, 314, 317, 323-325, 327, 351, 353, 363, 368,372, 374, 378, 381-382, 396
elemental arsenic, 1, 4, 6
Fe(II), 40, 44, 72, 77, 203, 216,234, 244, 261-262, 329, 337,343, 345, 359-361, 366-368,369, 374-376, 378, 404
ferrihydrite, 43, 47-48, 51-52, 74,76-80, 85-93, 95, 97-98, 364-365, 382, 386-389, 395-398,400-401
Fox River Valley, 145, 177, 287
geothermal fluids, 101-107, 111,114, 122-123, 295, 327
, 4, 7-8, 19,72, 361, 9,72, 101, 104, 113-115
hematite, 43, 80hot springs, 11, 106-107, 112-
115, 118-119, 153hydrothermal, 11, 13, 25, 34, 39,
110-111, 114-115, 127-128,132-134, 139-140, 143, 145,
152-154, 156, 161, 164, 213,324
in situ, 32-33, 112-113, 161, 256,381-387, 390-391, 396,400-401, 403-404, 407, 411
India, 27, 68, 179, 186, 207, 336infrared spectroscopy, 45inner-sphere, 28-29, 53, 73-74,
76, 86, 88iron oxide, 77, 90, 184, 190-191,
198, 201, 208-209, 211, 224,228, 233, 244-247, 249-250,252, 255, 314, 335-337, 387,403-404, 407, 409, 412, 414,416, 418-419
iron oxide reduction, 191, 198,233, 247, 249-250, 252
iron oxyhydroxides, 278, 281,286, 292-294, 329, 337, 343,351
kinetic, 362, 388, 400
landfill, 200, 351, 353-355, 357-359, 362, 366, 374, 378-379
magnesium, 42, 89, 238, 416, 418Maine, 178, 351,353manganese oxide, 30, 42-43, 64,
71, 81-82, 99, 234manganese oxides, 30, 42, 64, 71,
81, 82, 99, 234marcasite, 133, 135, 159, 259,
268metamorphic, 34, 102, 127, 130,
145, 152-153, 155, 157-158,161-162, 164, 300, 308
Michigan, 168, 266, 279-284,287-292, 294
microorganism, 12, 65, 71-72,101, 279
Index 473
midcontinent, 127, 129-132, 134-135, 137, 139-140, 145, 148,163
mineralized, 14, 35, 72, 131, 135,139-140, 142-143, 246, 295,304, 318-319, 321, 323-324,326-327
mining, 1, 42, 128, 130, 140, 148,162, 177, 179-180, 182, 200-201, 205, 207, 213, 246, 261,329, 331-333
Mongolia, 27, 68, 179, 182, 192-194, 196, 207, 209
Myanmar, 179, 205-206
natural remediation, 351, 353,358, 379
Nepal, 179, 182, 199-200Nevada, 1, 119, 164, 168, 174,
405New Mexico, 102, 107, 113, 295,
299-300, 324New Zealand, 101, 103, 106-107,
114-115, 120, 124
organic, 27, 30, 41, 72, 77, 84-85,89, 117-118, 121, 184, 188,195, 198, 208, 234, 241, 246,249, 252, 261, 280, 316, 334,351, 355, 357-360, 362-365,368, 371-374, 376, 378-379,385-386, 390, 393
orpiment, 1, 3, 9-14, 16, 20-25,35-38, 110-112, 114-116, 118,123, 164, 353
outer-sphere, 28-29, 47, 73-74,86-87
oxic, 71, 77, 323, 327, 336, 343-344, 351, 353, 403-404
oxidation, 10, 28, 33-35, 37, 42-43, 58-63, 68, 70-71, 77, 81,99, 105, 111, 113-114, 119,124, 179, 184, 191, 196, 198,
201-202, 211, 237, 248, 256,259-262, 272-274, 276-278,280-281, 286-287, 292-294,314, 352, 359, 362, 364, 372,374, 381, 383, 391, 397, 400,404
oxygen, 20, 39, 45, 47, 70-72, 99,104, 111-112, 184, 195, 204,216-217, 234, 252, 255, 259,261-262, 272, 274-277, 279,284, 286, 293, 298, 305, 314,351, 355, 357, 359-361, 369-371, 373, 381, 383-385, 390-391, 403-404, 409
oxyhydroxides, 30, 42, 62, 65, 77,80, 89, 98-99, 245, 281, 292,336-337, 349, 351, 353, 356-357, 360, 362-363, 365, 368,372, 374, 376, 378-379, 382
Ozark, 130-138, 141
Pakistan, 179, 204, 208-209phosphate, 46-47, 63, 67, 85-86,
122, 177, 212, 216, 231, 246,249-251, 255, 279, 284, 359,361, 364, 396-399, 410, 412-413, 416, 418
PHREEQC, 95, 99, 362, 364, 376,381, 386-387, 391
physisorption, 28, 49-50, 54, 56-58
polymerization, 16-17, 28, 89precipitation, 12, 14, 22, 28-29,
38, 40, 44, 68, 77, 105-107,114-115, 118, 124, 133, 238-239, 261, 302, 314, 329, 336,343-344, 355, 357, 366, 368,381, 400, 404, 409, 411-412
pyrite, 11, 13, 34-40, 63, 114,127, 133-136, 142-143, 145,148, 150-152, 154, 159, 162,164, 184, 190-191, 209, 211,237, 241, 244, 246-249, 252,
Index
259, 261, 268-269, 272, 278,281,286-294, 314, 390
pyrite oxidation, 184, 209, 247-249, 252, 261, 281, 287-288,292-294
Raman spectroscopy, 12, 18, 32,110
realgar, 1, 3, 9-14, 16, 21-22, 24-25, 35-36, 38, 115, 164
redox,40, 61, 65, 68, 70, 111,113, 118, 191, 195-196, 201,204, 212, 216-217, 234, 237,245, 250, 252, 255-256, 262,267, 284, 286, 288, 292, 294,336, 343-344, 355, 359, 373,378, 382, 390, 397, 401
reduction, 28, 32, 59, 68, 70, 72,120-121, 184, 196, 202, 209,212, 223, 237, 248-250, 255-256, 260, 279, 293, 315, 329,336-337, 353, 355, 359-360,362-369, 371-372, 374, 376,381
reductive dissolution, 40, 58, 65,184, 234, 250, 260, 279-281,314, 351, 358, 360, 363, 366,374, 378-379
remediation, 93, 100, 200, 330,349-351, 358, 360, 369, 378,403-404, 406, 414-415, 419
scorodite, 11, 25, 39, 40, 42, 44,46, 62-64, 115, 201
silica, 55, 67, 82, 88, 105, 117,121, 124, 298
speciation, 2, 27, 29-32, 34, 36,38-39, 42, 61, 63, 67-68, 72,77, 82, 84, 90, 95, 99, 101, 110,113, 118-119, 123, 179, 190,284, 287-288, 298, 335, 345,355, 374
St. Peter aquifer, 265-266, 274-278
stoichiometry, 16, 42, 77, 111,372
sulfate,4, 41-42, 44, 63, 67, 74,86-88, 105, 108, 113-114, 216,226-228, 237, 248-249, 255-256, 259, 262, 270-272, 275,278-279, 284, 287, 336-337,342-344, 355, 361-362
sulfide, 10, 12, 14, 22-23, 27, 30,34-37, 40, 42, 62-63, 101, 104,110-114, 123, 133, 135, 137,152, 154, 162, 176, 213, 237,239, 256, 259, 260-263, 265,268, 272-274, 276-280, 284,286-287, 314, 316, 335-337,344, 355, 362
sulfide oxidation, 62, 256, 259-262, 272-274, 276-280, 286
sulfides, 4, 9, 24, 34-35, 37-39,62, 115, 133, 135-136, 152,161, 259-262, 268, 273-274,276-279, 329, 336-337, 343,349, 353, 355, 390
surface complexation, 45, 65, 67,73, 74, 79, 93-98, 100, 363,365, 382, 386, 388-389, 393,400
Taiwan, 27, 68, 123, 179, 182,191-192, 195-196
Taupo Volcanic Zone, 101, 103,107, 113-114, 116-117,119,121-122
temporal, 67, 99-100, 172, 175,186, 190, 199, 209, 251, 254
Thailand, 179-180, 182, 200, 202-203, 207
thioarsenite, 25, 110-111transport, 67, 82, 121, 157, 337,
368
474

Index 475
tubewell, 179, 183, 186, 190, 193-194, 196, 198-200, 202, 205-206, 209, 211-213, 216, 218-219, 223-224, 226-231, 240,252-254, 256
United States, 27, 34, 67-68, 127,129-131, 145, 164-167, 169,173-178, 314, 351, 404
Vietnam, 27, 68, 179, 182, 197-199
West Bengal, 179-180, 182, 186,188-192, 204, 207, 209, 213,223, 241, 246-247, 249, 253,314
Wisconsin, 173, 176-178, 259-260, 263, 267, 280, 287, 314
XAFS, 33-36, 38, 42-43, 45, 47-59, 62, 65
XPS, 32-33, 35, 37, 43, 59, 62
Yellowstone, 25, 101-103, 106-109, 112, 117, 119, 121-122