arsenic, nitrate, and chloride in groundwater, oakland ... · u.s. department of the interior u.s....
TRANSCRIPT
U.S. Department of the InteriorU.S. Geological Survey
Fact Sheet 2004-3120October 2004
Arsenic, Nitrate, and Chloride in Groundwater, Oakland County, Michigan
INTRODUCTIONIn 1996, the U.S. Geological Survey (USGS), in coopera-
tion with the Michigan Department of Environmental Quality (MDEQ) and nine southeast Michigan counties, began a study of the factors controlling arsenic concentrations in drinking water. The early results of this study raised broader concerns in Oakland County about the quality of groundwater in general and drinking water in particular. In response to these concerns, Oakland County worked with the USGS and the Center for Applied Environmental Research at the University of Michigan – Flint (CAER) to study distributions of arsenic, nitrate, and chloride in groundwater, with emphasis on sites where concen-trations of these constituents exceeded the Maximum Contami-nant Levels (MCL’s) and Secondary Maximum Contaminant Levels (SMCL’s) set by the U.S. Environmental Protection Agency (USEPA). The maps produced for this report are based on historical data compiled from MDEQ records. This fact sheet is a revision of USGS Fact Sheet 135-98, “Arsenic, nitrate, and chloride in groundwater in Oakland County in Oakland County, Michigan” (Aichele and others, 1998) to incorporate revisions to the USEPA MCL for arsenic.
ARSENIC Arsenic is a naturally occurring element in the environment.
Historically, arsenic compounds have been used in the manufac-ture of pesticides, metal products, pigments and dyes, and medi-cine. Concentrations of arsenic in water have been expressed in a variety of ways: milligrams per liter (mg/L), micrograms per liter (µg/L) or parts per billion (ppb). These units can be compared as follows: 1 mg/L = 1,000 µg/L = 1,000 ppb. The U.S. Environmental Protection Agency (2001) MCL for arsenic in drinking water is 0.01 mg/L, 10 µg/L or 10 ppb. This new standard was announced in January 2001 with full compliance required for all public water systems by January 2006. One part per billion, expressed as time, is 1 second in approximately 31 and one half years.
What is the source of arsenic in groundwater?
Arsenic is the twentieth most common element in the Earth’s crust, and is present in the soil and rocks of Oakland County. Arsenic in groundwater is usually a result of arsenic minerals dissolving naturally over time.
Where does arsenic occur in Oakland County?
Low concentrations of arsenic can be found in wells all across Oakland County. Out of 1,988 wells sampled, 663
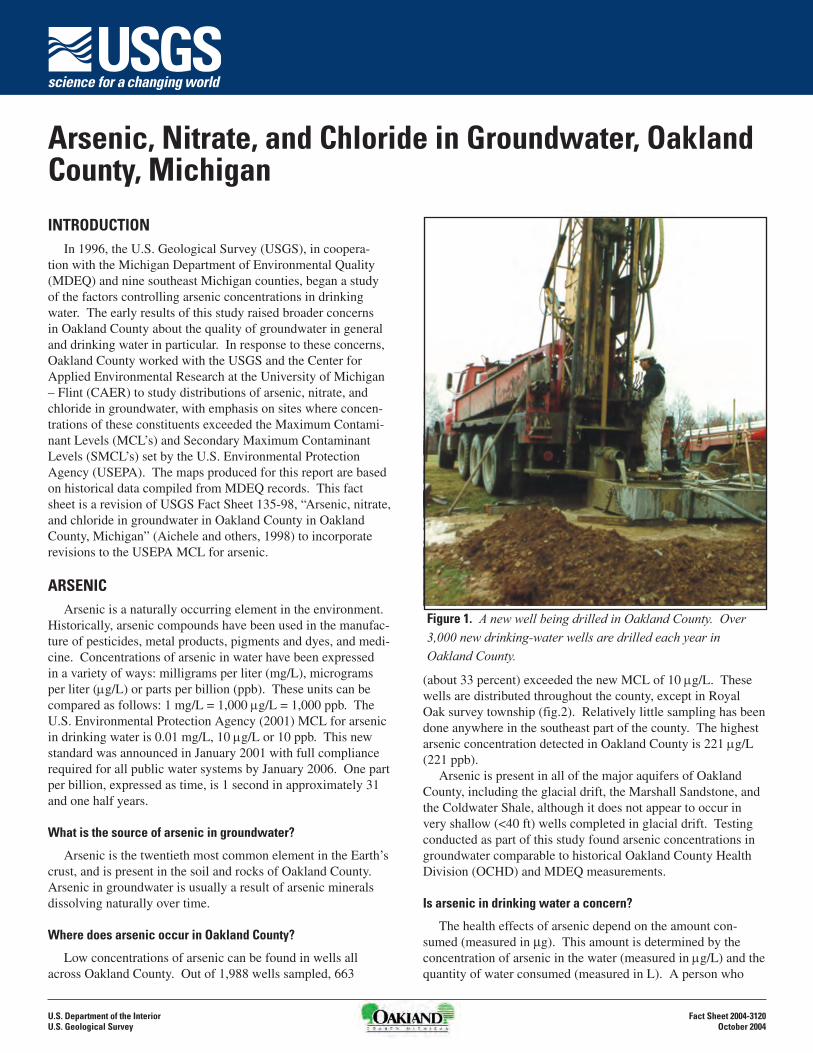
Figure 1. A new well being drilled in Oakland County. Over 3,000 new drinking-water wells are drilled each year in Oakland County.
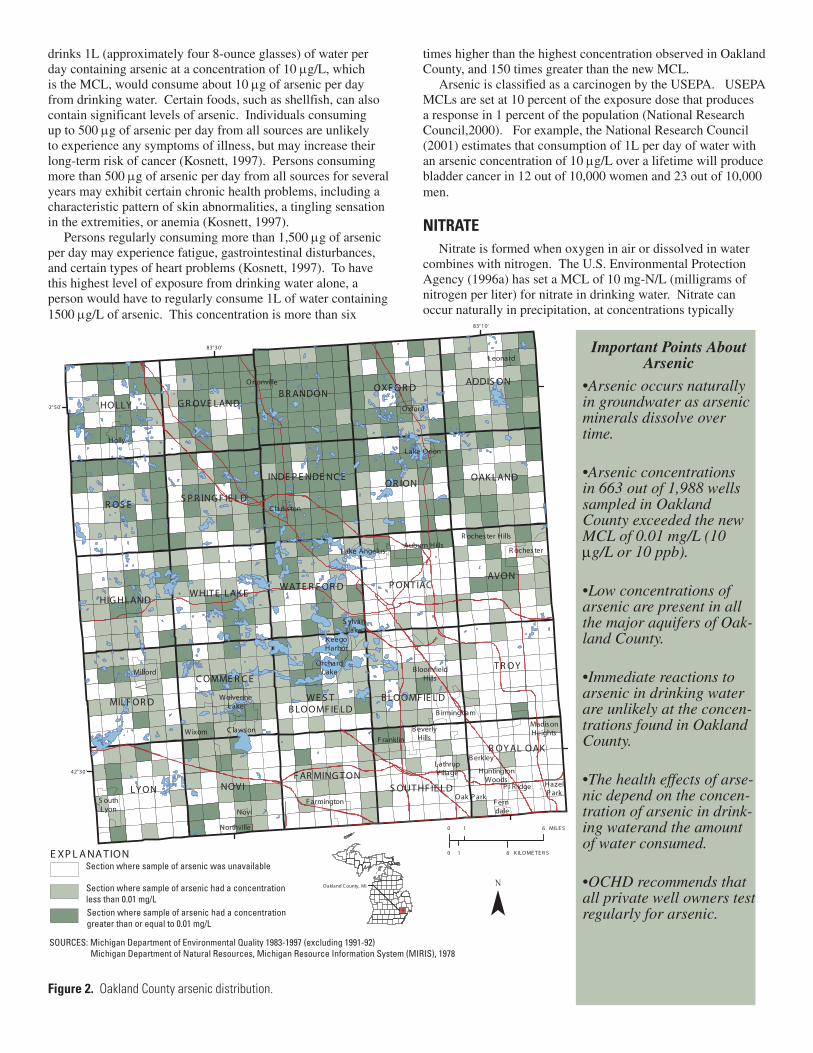
(about 33 percent) exceeded the new MCL of 10 µg/L. These wells are distributed throughout the county, except in Royal Oak survey township (fig.2). Relatively little sampling has been done anywhere in the southeast part of the county. The highest arsenic concentration detected in Oakland County is 221 µg/L (221 ppb).
Arsenic is present in all of the major aquifers of Oakland County, including the glacial drift, the Marshall Sandstone, and the Coldwater Shale, although it does not appear to occur in very shallow (<40 ft) wells completed in glacial drift. Testing conducted as part of this study found arsenic concentrations in groundwater comparable to historical Oakland County Health Division (OCHD) and MDEQ measurements.
Is arsenic in drinking water a concern?
The health effects of arsenic depend on the amount con-sumed (measured in µg). This amount is determined by the concentration of arsenic in the water (measured in µg/L) and the quantity of water consumed (measured in L). A person who
Important Points About Arsenic
•Arsenic occurs naturally in groundwater as arsenic minerals dissolve over time.
•Arsenic concentrations in 663 out of 1,988 wells sampled in Oakland County exceeded the new MCL of 0.01 mg/L (10 µg/L or 10 ppb).
•Low concentrations of arsenic are present in all the major aquifers of Oak-land County.
•Immediate reactions to arsenic in drinking water are unlikely at the concen-trations found in Oakland County.
•The health effects of arse-nic depend on the concen-tration of arsenic in drink-ing waterand the amount of water consumed.
•OCHD recommends that all private well owners test regularly for arsenic.
times higher than the highest concentration observed in Oakland County, and 150 times greater than the new MCL.
Arsenic is classified as a carcinogen by the USEPA. USEPA MCLs are set at 10 percent of the exposure dose that produces a response in 1 percent of the population (National Research Council,2000). For example, the National Research Council (2001) estimates that consumption of 1L per day of water with an arsenic concentration of 10 µg/L over a lifetime will produce bladder cancer in 12 out of 10,000 women and 23 out of 10,000 men.
NITRATENitrate is formed when oxygen in air or dissolved in water
combines with nitrogen. The U.S. Environmental Protection Agency (1996a) has set a MCL of 10 mg-N/L (milligrams of nitrogen per liter) for nitrate in drinking water. Nitrate can occur naturally in precipitation, at concentrations typically
Figure 2. Oakland County arsenic distribution.
drinks 1L (approximately four 8-ounce glasses) of water per day containing arsenic at a concentration of 10 µg/L, which is the MCL, would consume about 10 µg of arsenic per day from drinking water. Certain foods, such as shellfish, can also contain significant levels of arsenic. Individuals consuming up to 500 µg of arsenic per day from all sources are unlikely to experience any symptoms of illness, but may increase their long-term risk of cancer (Kosnett, 1997). Persons consuming more than 500 µg of arsenic per day from all sources for several years may exhibit certain chronic health problems, including a characteristic pattern of skin abnormalities, a tingling sensation in the extremities, or anemia (Kosnett, 1997).
Persons regularly consuming more than 1,500 µg of arsenic per day may experience fatigue, gastrointestinal disturbances, and certain types of heart problems (Kosnett, 1997). To have this highest level of exposure from drinking water alone, a person would have to regularly consume 1L of water containing 1500 µg/L of arsenic. This concentration is more than six
42°30’
42°50’
83°30’
83°10’
NOVI
R OS E
TROY
LYON
AVON
OR ION
HOLLY
OXFORDADDIS ON
MILFORD
OAKLAND
BRANDON
HIGHLANDWHITE LAKE
GROVE LAND
S PR INGF IE LD
WATE R FORD
FARMINGTON
COMME RCE
INDE PENDENCE
PONTIAC
SOUTHF IE LD
BLOOMFIE LDWE S TBLOOMFIE LD
Wixom
Auburn Hills
R OYAL OAK
Holly
Oak ParkFern�dale
MadisonHeights
B irmingham
R ochester
Milford
Berkley
F ranklin
B loomfieldHills
S outhLyon
OrchardLake
C lawson
HazelPark
Farmington
Oxford
Lake Angelus
Leonard
Lake Orion
WolverineLake
Northville
Ortonville
LathrupVillage
BeverlyHills
HuntingtonWoods
S ylvanLake
C larkston
KeegoHarbor
Novi
P l R idge
R ochester Hills
Section where sample of arsenic was unavailable
Section where sample of arsenic had a concentrationgreater than or equal to 0.01 mg/L
Section where sample of arsenic had a concentrationless than 0.01 mg/L
Oakland County, MI
E XPLANATION
0 1 6 MILE S
0 1 6 K ILOME TE R S
SOURCES: Michigan Department of Environmental Quality 1983-1997 (excluding 1991-92)Michigan Department of Natural Resources, Michigan Resource Information System (MIRIS), 1978
around 1 mg-N/L. Elevated concentrations, particularly those greater than 3 mg-N/L, are usually the result of human activity (U.S. Environmental Protection Agency, 1996b).
What is the source of nitrate in groundwater?
In Oakland County, the likely sources of elevated nitrate in drinking water are septic tank leachate and fertilizers, both of which are rich in nitrogen. Nitrate dissolves readily in water and moves freely with water through soil and rock where it is commonly consumed by microorganisms. Nitrate at concentra-tions greater than 3 mg-N/L indicates a fairly direct connection between one of the sources listed above and the drinking-water supply.
Where does nitrate occur in Oakland County?
Nitrate concentrations in excess of the 10 mg-N/L MCL
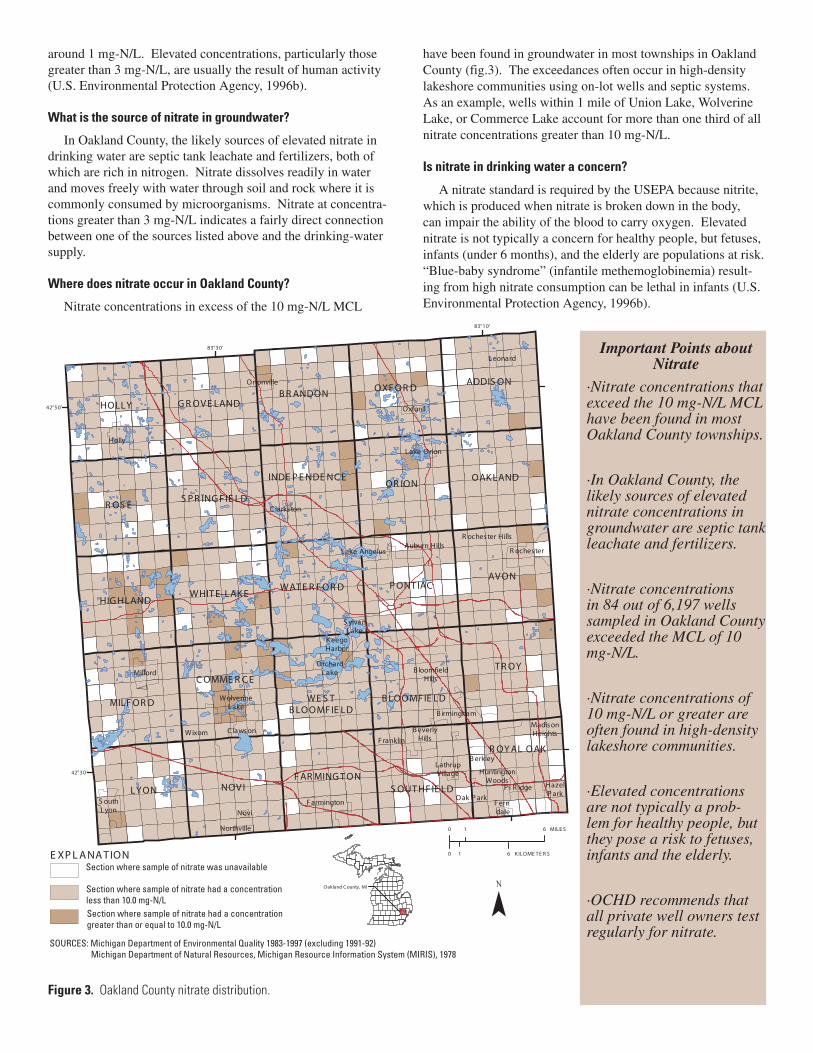
have been found in groundwater in most townships in Oakland County (fig.3). The exceedances often occur in high-density lakeshore communities using on-lot wells and septic systems. As an example, wells within 1 mile of Union Lake, Wolverine Lake, or Commerce Lake account for more than one third of all nitrate concentrations greater than 10 mg-N/L.
Is nitrate in drinking water a concern?
A nitrate standard is required by the USEPA because nitrite, which is produced when nitrate is broken down in the body, can impair the ability of the blood to carry oxygen. Elevated nitrate is not typically a concern for healthy people, but fetuses, infants (under 6 months), and the elderly are populations at risk. “Blue-baby syndrome” (infantile methemoglobinemia) result-ing from high nitrate consumption can be lethal in infants (U.S. Environmental Protection Agency, 1996b).
42°30’
42°50’
83°30’
83°10’
NOVI
R OS E
TROY
LYON
AVON
OR ION
HOLLY
OXFORDADDIS ON
MILFORD
OAKLAND
BRANDON
HIGHLANDWHITE LAKE
GROVE LAND
S PR INGF IE LD
WATE R FORD
FARMINGTON
COMME RCE
INDE PENDENCE
PONTIAC
SOUTHF IE LD
BLOOMFIE LDWE S TBLOOMFIE LD
Wixom
Auburn Hills
R OYAL OAK
Holly
Oak ParkFern�dale
MadisonHeights
B irmingham
R ochester
Milford
Berkley
F ranklin
B loomfieldHills
S outhLyon
OrchardLake
C lawson
HazelPark
Farmington
Oxford
Lake Angelus
Leonard
Lake Orion
WolverineLake
Northville
Ortonville
LathrupVillage
BeverlyHills
HuntingtonWoods
S ylvanLake
C larkston
KeegoHarbor
Novi
P l R idge
R ochester Hills
Section where sample of nitrate was unavailable
Section where sample of nitrate had a concentrationgreater than or equal to 10.0 mg-N/L
Section where sample of nitrate had a concentrationless than 10.0 mg-N/L
Oakland County, MI
E XPLANATION
0 1 6 MILE S
0 1 6 K ILOME TE R S
SOURCES: Michigan Department of Environmental Quality 1983-1997 (excluding 1991-92)Michigan Department of Natural Resources, Michigan Resource Information System (MIRIS), 1978
Important Points about Nitrate
·Nitrate concentrations that exceed the 10 mg-N/L MCL have been found in most Oakland County townships.
·In Oakland County, the likely sources of elevated nitrate concentrations in groundwater are septic tank leachate and fertilizers.
·Nitrate concentrations in 84 out of 6,197 wells sampled in Oakland County exceeded the MCL of 10 mg-N/L.
·Nitrate concentrations of 10 mg-N/L or greater are often found in high-density lakeshore communities.
·Elevated concentrations are not typically a prob-lem for healthy people, but they pose a risk to fetuses, infants and the elderly.
·OCHD recommends that all private well owners test regularly for nitrate.
Figure 3. Oakland County nitrate distribution.

CHLORIDEChloride is an element found in most common salts, such
as road salt, table salt, and water-softener salt. The USEPA (1996a) has set a SMCL of 250 mg/L for chloride. This limit was established because water with chloride concentrations greater than 250 mg/L tastes salty to most people. Chloride is naturally present in groundwater, particularly in deep bedrock aquifers. Background concentrations of chloride in drinking-water wells are highly variable, ranging from less than 10 mg/L in some glacial aquifers to more than 500 mg/L in deeper bedrock wells.
What is the source of chloride in drinking water?
Chloride occurs naturally in some sedimentary bedrock lay-ers, particularly shales. This chloride is a remnant of the seawa-ter present at the time the rocks were formed. Chloride is
very soluble in water and moves freely with water through soil and rock. Chloride is not readily consumed bymicroorganisms, so it is more persistent than nitrate. Road salt, applied for deicing or dust control, may infiltrate the soil and contaminate groundwater. Chloride also may originate from septic tank leachate, as a result of water softening or other activities in the household.
Where does chloride occur in Oakland County?
Chloride concentrations in excess of 250 mg/L are widely distributed in Oakland County (fig.4). They are commonly associated with high-density lakeshore communities using on-lot wells and septic systems. The chloride found in shallow wells around lakes and in densely populated areas probably comes from salts used in the household and then discharged through septic systems. Elevated chloride levels also may be
42°30’
42°50’
83°30’
83°10’
NOVI
R OS E
TROY
LYON
AVON
OR ION
HOLLY
OXFORDADDIS ON
MILFORD
OAKLAND
BRANDON
HIGHLANDWHITE LAKE
GROVE LAND
S PR INGF IE LD
WATE R FORD
FARMINGTON
COMME RCE
INDE PENDENCE
PONTIAC
SOUTHF IE LD
BLOOMFIE LDWE S TBLOOMFIE LD
Wixom
Auburn Hills
R OYAL OAK
Holly
Oak ParkFern�dale
MadisonHeights
B irmingham
R ochester
Milford
Berkley
F ranklin
B loomfieldHills
S outhLyon
OrchardLake
C lawson
HazelPark
Farmington
Oxford
Lake Angelus
Leonard
Lake Orion
WolverineLake
Northville
Ortonville
LathrupVillage
BeverlyHills
HuntingtonWoods
S ylvanLake
C larkston
KeegoHarbor
Novi
P l R idge
R ochester Hills
Section where sample of chloride was unavailable
Section where sample of chloride had a concentrationgreater than or equal to 250.0 mg/L
Section where sample of chloride had a concentrationless than 250.0 mg/L
Oakland County, MI
E XPLANATION
0 1 6 MILE S
0 1 6 K ILOME TE R S
SOURCES: Michigan Department of Environmental Quality 1983-1997 (excluding 1991-92)Michigan Department of Natural Resources, Michigan Resource Information System (MIRIS), 1978
Important Points about Chloride
·Chloride occurs naturally in groundwater and is also in most common salts.
·Chloride concentrations in 366 out of 6,227 wells sampled in Oakland County exceeded the SMCL of 250 mg/L.
·High concentrations are often associated with high density, lakeshore commu-nities.
·Elevated chloride concen-trations may be associated with road salt applications or storage and septic tank leachate.
·Chloride is not generally considered to be a health concern.
·The SMCL of 250 mg/L is based on aesthetic consid-erations (taste) rather than health considerations.
Figure 4. Oakland County chloride distribution.
associated with road salt application or storage. Several caseshave been documented in Oakland County of road salt storage facilities leaching chloride into groundwater.
Is chloride in drinking water a concern?
Chloride is not generally considered to be a health concern. However, some evidence indicates that high chloride intake may pose a hazard to persons with heart or kidney disease (Hutchinson, 1970).
HOW WERE THE MAPS PREPARED?The MDEQ maintains a database of results from water-
quality tests conducted for homeowners and businesses. In this study, maps were prepared from records of tests in Oak-land County where arsenic, nitrate and chloride measurements were made. The data spanned the years from 1988 through 1997 (excluding 1991-92).
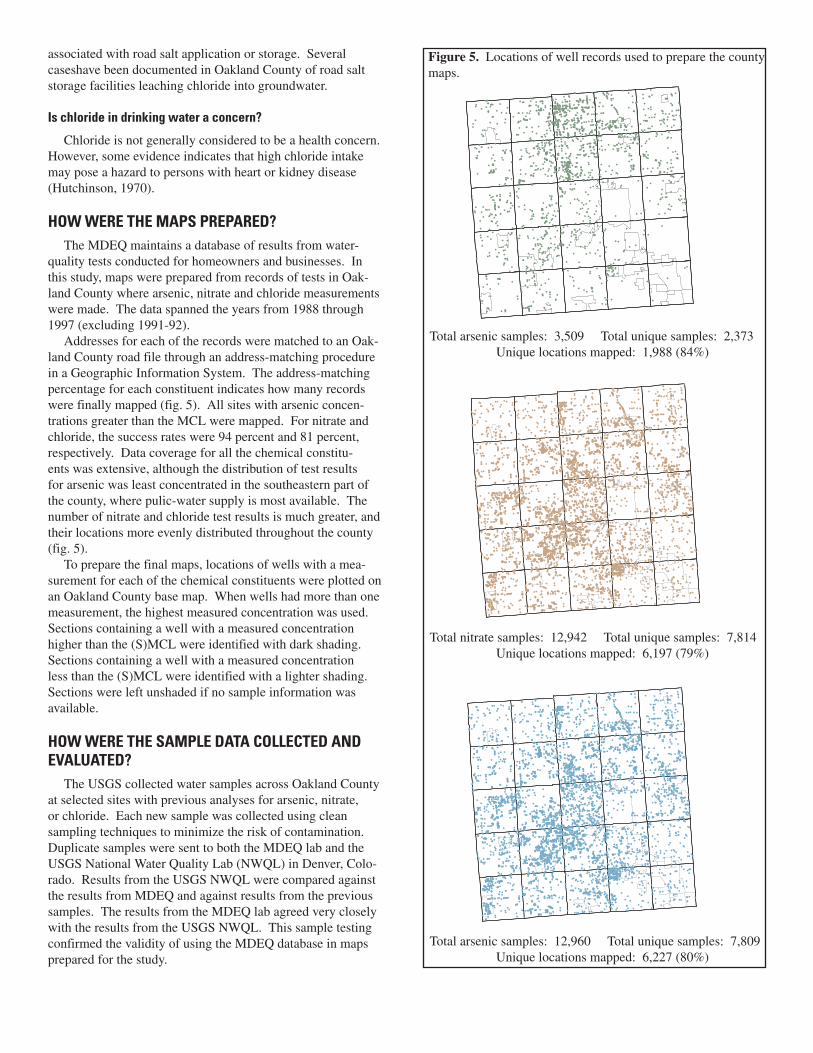
Addresses for each of the records were matched to an Oak-land County road file through an address-matching procedure in a Geographic Information System. The address-matching percentage for each constituent indicates how many records were finally mapped (fig. 5). All sites with arsenic concen-trations greater than the MCL were mapped. For nitrate and chloride, the success rates were 94 percent and 81 percent, respectively. Data coverage for all the chemical constitu-ents was extensive, although the distribution of test results for arsenic was least concentrated in the southeastern part of the county, where pulic-water supply is most available. The number of nitrate and chloride test results is much greater, and their locations more evenly distributed throughout the county (fig. 5).
To prepare the final maps, locations of wells with a mea-surement for each of the chemical constituents were plotted on an Oakland County base map. When wells had more than one measurement, the highest measured concentration was used. Sections containing a well with a measured concentration higher than the (S)MCL were identified with dark shading. Sections containing a well with a measured concentration less than the (S)MCL were identified with a lighter shading. Sections were left unshaded if no sample information was available.
HOW WERE THE SAMPLE DATA COLLECTED AND EVALUATED?
The USGS collected water samples across Oakland County at selected sites with previous analyses for arsenic, nitrate, or chloride. Each new sample was collected using clean sampling techniques to minimize the risk of contamination. Duplicate samples were sent to both the MDEQ lab and the USGS National Water Quality Lab (NWQL) in Denver, Colo-rado. Results from the USGS NWQL were compared against the results from MDEQ and against results from the previous samples. The results from the MDEQ lab agreed very closely with the results from the USGS NWQL. This sample testing confirmed the validity of using the MDEQ database in maps prepared for the study.
Figure 5. Locations of well records used to prepare the county maps.
Total arsenic samples: 3,509 Total unique samples: 2,373Unique locations mapped: 1,988 (84%)
Total nitrate samples: 12,942 Total unique samples: 7,814Unique locations mapped: 6,197 (79%)
Total arsenic samples: 12,960 Total unique samples: 7,809Unique locations mapped: 6,227 (80%)
What does all this mean?
·The maps refer to all areas not serviced by public water. Public water supply wells are routinely monitored to ensure compliance with U.S. Environmental Protection Agency standards.
·Arsenic, nitrate, and chloride were the only constituents addressed in this study. Other potential water contaminants have been observed in Oakland county and may occur in your area. Please contact the OCHD for details specific to your area.
·All the maps support the OCHD recommendation that homeowners regularly test drinking water that comes from wells.
·Each of the chemical constituents evaluated is widely distributed and homeowners should carefully review the county maps to see if their homes are in areas where concentrations above the U.S. Environmental Protection Agency standard have been reported. Township maps, which are included on separate fact sheets, provide more specific details on particular locations.
·Some individuals may be more sensitive than others to contaminants in drinking water. If symptoms persist, OCHD recommends you consult a physician for assistance.
SUMMARYThe distributions of arsenic, nitrate and chloride concentra-
tions in groundwater in Oakland County, Michigan were investi-gated on the basis of historical water-quality data obtained from MDEQ databases. Results indicate that of the wells sampled in Oakland County, about 33 percent exceeded the USEPA MCL for arsenic, about 1 percent exceeded the USEPA MCL for nitrate, and about 6 percent exceeded the USEPA SMCL for chloride. Maps provided in this report show the known distri-bution of arsenic, nitrate, and chloride in groundwater within Oakland County, Michigan.
−−By Steve Aichele (USGS)
ReferencesAichele, S.S., Hill-Rowley, R., and Malone, M., 1998, Arse-nic, Nitrate, and Chloride in Groundwater in Oakland County, Michigan: U.S. Geological Survey Fact Sheet 135-98, 6 p.
Hutchinson, F.E., 1970, Environmental pollution from highway deicing compounds. Journal of Soil and Water Conservation, v. 25, n.4, p. 144-46.
Kosnett, M., 1997, Clinical Guidance in the Evaluation of patients with Potential Exposure to Arsenic in Drinking Water. Michigan Department of Community Health, Lansing, Michi-gan, 10 p.
Environmental Protection Agency, 2001, National Primary Drinking Water Regulations; Arsenic and Clarifications to compliance and New Source Contaminants Monitoring. Federal Register, v. 66, n. 14, p. 6976-7066.
National Research Council, 2000, Arsenic in Drinking Water. National Academy Press, Washington D.C., 308 p.
National Research Council, 2001, Arsenic in Drinking Water, 2001 Update. National Academy Press, Washington D.C.,223 p.
Pontius, F., Brown, K., and Chen, C., 1994, Of arsenic in drink-ing water. Journal of the AWWA, v. 86, n. 10, p. 52-63.
U.S. Environmental Protection Agency, 1996a, Drinking water regulations and health advisories. Washington, D.C., U.S. Envi-ronmental Protection Agency, Office of Water, EPA 822-B-96-002.
For more information, contact:
U.S. Geological Survey,Water Resources Division6520 Mercantile Way, Ste.5Lansing, MI 48911(517) 887-8903http://www.usgs.gov
Oakland County Health Division1200 N. Telegraph RoadPontiac, MI 48341-0432(248) 858-1312http://www.co.oakland.mi.us