artem baklanov - votes aggregation techniques in geo-wiki crowdsourcing game: a case study
TRANSCRIPT

Vote Aggregation Techniques in the Geo-Wiki Crowdsourcing Game: A Case Study
Michael Khachay, Oleg Nurmukhametov
Artem Baklanov
Krasovskii Institute of Mathematics and Mechanics
Postdoctoral Research Scholar, ASA, IIASAKrasovskii Institute of Mathematics and Mechanics
Steffen Fritz, Carl Salk, Linda See, and Dmitry ShchepashchenkoIIASA

Young Scientists Summer Program
Since 1977, IIASA’s annual 3-month Young Scientists Summer Program (YSSP) offers opportunities to talented young researchers.

Crowdsourcing = Crowd + Outsourcing
Crowdsourcing is a new approach to perform tasks, when a group of distributed worldwide people in total can substitute an expert.
Example:GEO-wiki project, ESM, IIASA

Geo-Wiki: Cropland Capture Game
5 millions votes 170 000 satellite images
3000 volunteers 6 months
Goal: land cover map
www.geo-wiki.org d

Preprocessing of imagesBlur detection
Duplicate detection
Benchmarking of algorithms for vote
aggregation
Outline of presentation
Noise reduction Prediction

Preprocessing of imagesDuplicate detection
Blur detection
Benchmarking of algorithms for vote
aggregation
Outline of presentation
Noise reduction Prediction

Blur detection algorithm [H Tang, 2012].Input: imageOutput: coefficient of blur in [0, 100]
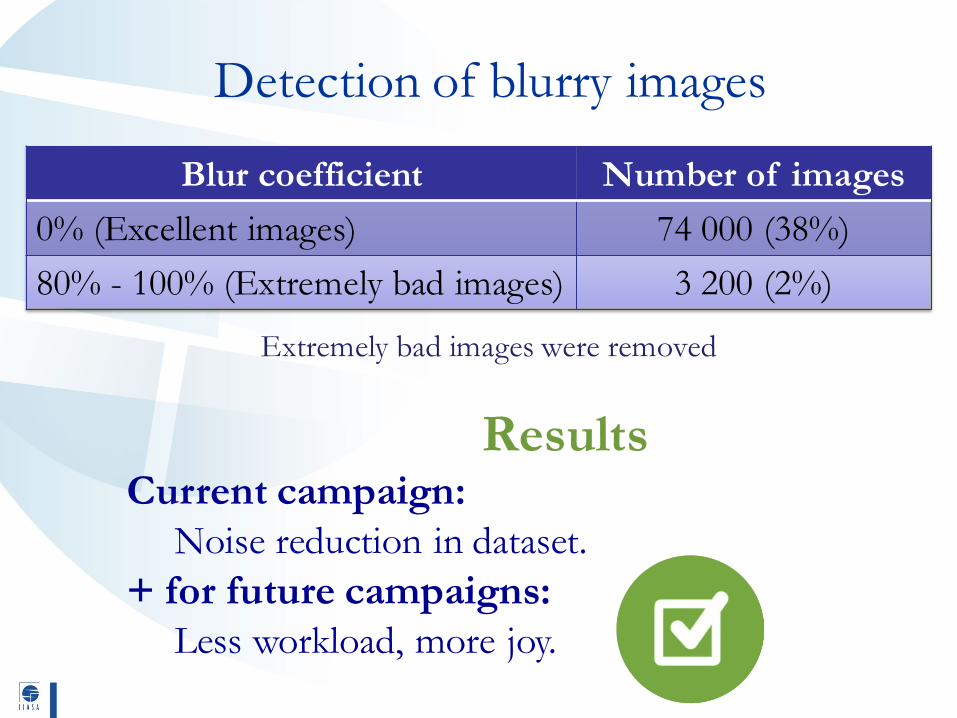
Detection of blurry images
100%0%

High quality images
Probability0%
10%
30%

Blurry images80% 90% 95%
98% 99%

The table and figure are fromTong, Hanghang, et al. "Blur detection for digital images using wavelet transform." Multimedia and Expo, 2004. ICME'04. 2004 IEEE International Conference on. Vol. 1. IEEE, 2004.
Blur detection algorithm

A key idea
• A= a number of Roof-Structure and Gstep-Structure edge points that have lost their sharpness.
• B= a number of Roof-Structure and Gstep-Structure edge points.
• Blur coefficient = 100*A/B
Detection of blurry images
ResultsCurrent campaign:
Noise reduction in dataset.+ for future campaigns:
Less workload, more joy.
Blur coefficient Number of images0% (Excellent images) 74 000 (38%)80% - 100% (Extremely bad images) 3 200 (2%)
Extremely bad images were removed

Detection of duplicates
Web Link
Image unique identifier Link to image
1 http://cg.tuwien.ac.at/~sturn/crop/img_78.1875_52.9958_1000.jpg
2 http://cg.tuwien.ac.at/~sturn/crop/img_78.1875_52.9958_500.jpg
3 http://cg.tuwien.ac.at/~sturn/crop/img_78.1875_52.9958_300.jpg
… …
Binary file Image content

Detection of duplicates
Find the 10 differences

Detection of duplicates
The pixel-by-pixel differences
Links: different
Binary files: different
Image content: similar

pHash (perceptual hash) [Zauner, 2010].
Detection of duplicates

pHash. High level description
1. Resize to 32x32 and grayscale;;2. Perform DCT-2 transformation and keep top-left 8x8;;
3. Calculate the average value of alternating components;;
4. Set the 64 hash bits to 0 (or 1) on whether DCT values more (or less) the average value.

Detection of copiesMethod Copies count Time to completion
Binary data comparison (MD5) 2 700 Fast (~10 min)Image content comparison (pHash) 10 000 (6%) Slow(~7 hours)
ResultsCurrent campaign:
Increase of statistically significance;Reduction of dimensionality.
+ for future campaigns: Less workload, more joy.
Votes were merged.

Preprocessing of imagesDuplicate detection
Blur detection
Benchmarking of algorithms for vote
aggregation
Outline of presentation
Noise reduction Prediction

A part of the dataset was annotated by an expert after the campaign took place:
• 854 images;;• 1813 volunteers;;• 16 940 votes.
We sample two subsets for training and testing
70/30 ratio
Expert dataset

Baseline algorithms
We use SVD to reduce dimensionality and 10-fold cross-validation to fit parameters

A publicly available code implements KOS and EM algorithm;; both are implemented in conjunction with reputation algorithm (also called Hard penalty).
https://github.com/ashwin90/Penalty-based-clustering
[EM] Dawid, A.P., Skene, A.M.: Maximum likelihood estimation of observer error-rates using the em algorithm. Applied statistics pp. 20–28 (1979)
[Hard penalty] Jagabathula, S., et al.: Reputation-based worker filtering in crowdsourcing. In: Advances in Neural Information Processing Systems. pp. 2492–2500 (2014)
[KOS] Karger, D.R., Oh, S., Shah, D.: Iterative learning for reliable crowdsourcing systems. In: Advances in neural information processing systems. pp. 1953–1961 (2011)
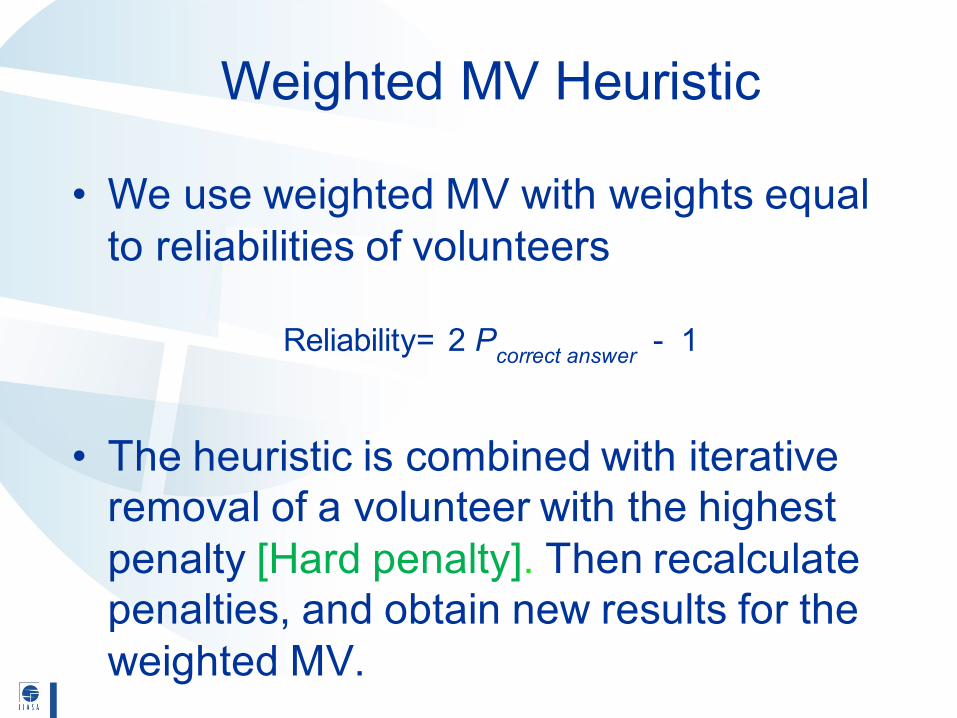
Weighted MV Heuristic
• We use weighted MV with weights equal to reliabilities of volunteers
Reliability= 2 Pcorrect answer - 1
• The heuristic is combined with iterative removal of a volunteer with the highest penalty [Hard penalty]. Then recalculate penalties, and obtain new results for the weighted MV.

Accuracy for ‘crowdsourcing’ algorithmsBaseline: AdaBoost (35 features)
91.08
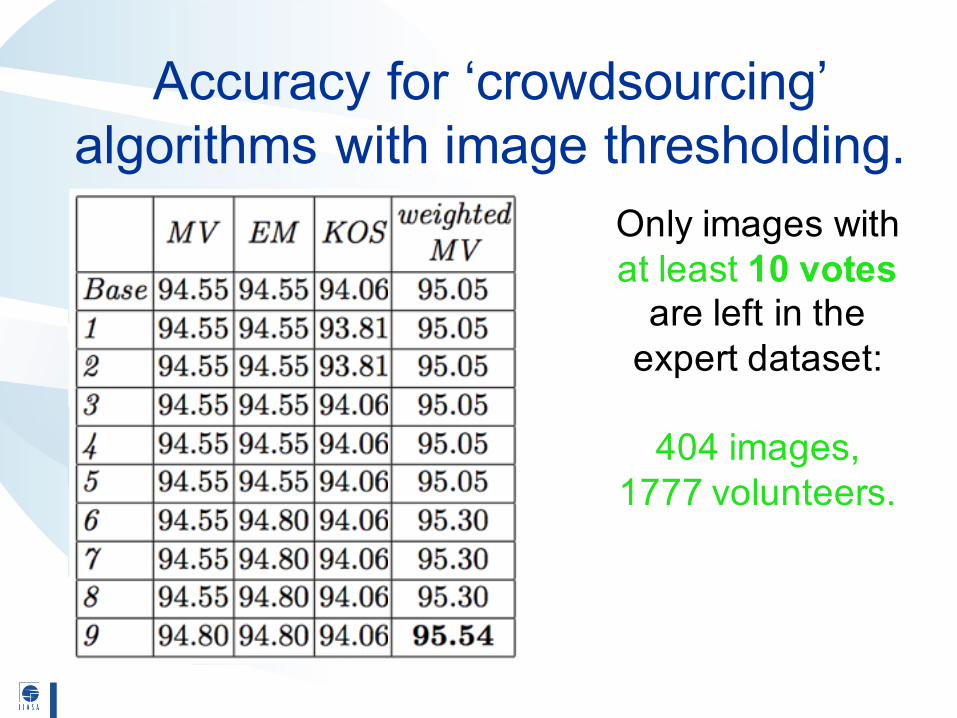
Accuracy for ‘crowdsourcing’ algorithms with image thresholding.
Only images with at least 10 votes are left in the expert dataset:
404 images, 1777 volunteers.

Possible explanations
Spammers
Malicious Annotators
Good Annotators
Biased Annotators
BiasedAnnotators
ROCs for all 1813 volunteers
on the expert dataset
Raykar, V.C.: Eliminating Spammers and Ranking Annotators for CrowdsourcedLabeling Tasks. JMLR 13, 491–518 (2012)

Volunteers’ ROCs
Spammers
Malicious Annotators
Good Annotators
Biased Annotators
BiasedAnnotators
Threshold = 12 votes, 262 volunteers.

Volunteers’ ROCs
Spammers
Malicious Annotators
Good Annotators
Biased Annotators
BiasedAnnotators
Threshold = 100 votes, 24 volunteers.

Accuracy
Due to image processing step• accuracy of MV increased by 2%, • workload decreased by 6 %.
Using threshold for voters and the heuristic, we increase accuracy to 95.5%.

Conclusions • Numerical experiments show that MV performs on a par with all algorithms.
• Possible explanation: high accuracy of frequently voting volunteers coupled with the absence of spammers.
• Image thresholding by number of votes helps to improve the results of all algorithms similarly.
• To summarize, good annotators eliminate any advantages of state of the art algorithms over MV.
• Image preprocessing is the only way to improve accuracy!

Future plans
• Development of theory
• More case studies in this field, hopefully with spammers and malicious voters!
• Elaborate approach to ‘Maybe’ votes


The baselineØ We apply SVD to the whole dataset to reduce dimensionality.
Ø We find an appropriate choice for the number of features: 5, 14, 35.
Ø Transform the feature space of the testing and training subsets accordingly.
Ø On the basis of 10-fold cross-validation of the training subset, we fit parameters for the AdaBoost and Random Forest algorithms. For Linear Discriminant Analysis (LDA), we use default parameters.
Ø The accuracy of the algorithms with fitted parameters was estimated using the testing subset.

Before and after merging of duplicates
Votes per image Unique votesRepetition of images
(average)Before [1 … 269] [1 … 88] 4After [1…6042] [1…942] 13
900 volunteers saw the same image 7 times

Accuracy for ‘crowdsourcing’ algorithms with image thresholding.
Only images with at least 4 votes are left in the expert dataset:
729 images, 1812 volunteers.

Volunteers’ ROCs
Spammers
Malicious Annotators
Good Annotators
Biased Annotators
BiasedAnnotators
Threshold = 44 votes, 52 volunteers.