arterial pulse attenuation prediction using the decaying ... · arterial pulse attenuation...
TRANSCRIPT
Biomech Model Mechanobiol (2018) 17:589–603https://doi.org/10.1007/s10237-017-0980-9
ORIGINAL PAPER
Arterial pulse attenuation prediction using the decaying rateof a pressure wave in a viscoelastic material model
J. Menacho1 · L. Rotllant1,3 · J. J. Molins1 · G. Reyes1 ·A. A. García-Granada1 · M. Balcells1,2 · J. Martorell1
Received: 20 July 2017 / Accepted: 31 October 2017 / Published online: 22 November 2017© The Author(s) 2017. This article is an open access publication
Abstract The present study examines the possibility ofattenuating blood pulses by means of introducing prostheticviscoelastic materials able to absorb energy and damp suchpulses. Vascular prostheses made of polymeric materialsmodify the mechanical properties of blood vessels. Theeffect of these materials on the blood pulse propagationremains to be fully understood. Several materials for medicalapplications, such as medical polydimethylsiloxane or poly-tetrafluoroethylene, show viscoelastic behavior, modifyingthe original vessel stiffness and affecting the propagation ofblood pulses. This study focuses on the propagation of pres-sure waves along a pipe with viscoelastic materials using theMaxwell and theZenermodels.An expression of exponentialdecay has been obtained for theMaxwell material model andalso for lowviscous coefficient values in theZenermodel. Forrelatively high values of the viscous term in the Zener model,the steepest part of the pulse can be damped quickly, leavinga smooth, slowly decaying wave. These mathematical mod-els are critical to tailor those materials used in cardiovascularimplants to the mechanical environment they are confrontedwith to repair or improve blood vessel function.
Electronic supplementary material The online version of thisarticle (https://doi.org/10.1007/s10237-017-0980-9) containssupplementary material, which is available to authorized users.
B M. [email protected]
1 IQS School of Engineering, Universitat Ramon Llull,Via Augusta 390, 08017 Barcelona, Spain
2 IMES – MIT, 77 Massachusetts Av., E25-229, Cambridge,MA 02139, USA
3 Department of Applied Sciences, CBSET, 500 Shire Way,Lexington, MA, USA
Keywords Pressure wave damping · Circulatory system ·Cardiovascular disease · Computational fluid dynamics
1 Introduction
Recent evidence suggests a link between cardiovascularand neurodegenerative diseases. Indeed, changes in pulsatileshear stress provoked by arterial stiffening inherent to theaging process, or indirect flow effects on the immunolog-ical system, can extend to the brain (Benetos et al. 1993;Martorell et al. 2012, 2014; Garcia-Polite et al. 2016), anorgan with low peripheral resistance. This problem is com-mon in hydraulic engineering, where pressure surges aredamped by means of additional pipes or viscoelastic materi-als (Pezzinga andScandura 1995; Pezzinga 2002;Covas et al.2004). Herein, we hypothesize that a polymeric prosthesisimplanted in a stiffened major vessel such as the aorta or thecarotid could attenuate blood pulses. The viscoelastic proper-ties of thematerial should absorb pulsatile energy and smoothsuch pulses to prevent brain damage. Several materials withmedical applications, like polydimethylsiloxane (PDMS, sil-icone) or polytetrafluoroethylene (PTFE), show viscoelasticbehavior (Calvo Aguilar 2013; Mahomed et al. 2015). Thesematerials, widely used in many medical devices, vary thevessel stiffness and affect the propagation of blood pulses.As a first step, the study is focused on evaluating the dampingrate of a pulse moving along a vessel of viscoelastic mate-rial. The aim of this manuscript is to study the mathematicalmodel of a pressure wave propagating along a viscoelastictube for Maxwell-type material models. This paper’s noveltyresides in the design of prostheses able to damp changes inpulsatile flow which may jeopardize the brain microvascula-ture (Garcia-Polite et al. 2016).
123

590 J. Menacho et al.
Mathematical and computational models of the blood cir-culation are nowadays a topic of hard debate and scrutiny dueto the myriad of conditions and pathologies associated withcardiovascular disease. The Windkessel model is a classicone (Keener and Sneyd 2009; Manning et al. 2002; Segerset al. 2003; Olufsen and Nadim 2004; Ellwein et al. 2008).Windkessel-type models account for the impedance to bloodflow of the whole or of a part of the circulatory system.This reduces the whole vessel to a single-point equationand does not allow studying the damping phenomena thatoccurs along the vessel. To study the attenuation of a pulse, apointwise model becomes necessary. One-dimensional mod-els have also been extensively used to study pressure and flowwave propagation in the arteries (Olufsen et al. 2000; Alas-truey et al. 2009; Qureshi et al. 2014;Willemet andAlastruey2015; Alfonso et al. 2016), even coupled to the cerebrospinalfluid system (Martin et al. 2012). These models assume anelastic behavior of the vessels’ walls; therefore, the pressureis considered proportional to the cross-section area of thevessel with no viscoelastic component.
Propagation of a pressure wave in a filled pipe is a classictopic in engineering, with different applications, like waterhammer or nondestructive testing of pipelines (Jiang et al.2011; Liu et al. 2013; Meniconi et al. 2012). When thepipe material is elastic (and the friction effects negligible),the mathematical model leads to the wave equation. Vis-coelastic materials characterization is not a simple task, andmany mathematical models describe different phenomenalike creep, relaxation and recovery. Modeling the viscoelas-tic properties of the arterial wall is not straightforward. Thereare a number of studies that consider different viscoelasticbehaviors of the material of the vessel (Erbay et al. 1992;Demiray 1997; Kudryashov and Chernyavskii 2006; Gualaet al. 2015), including fractional elements (Pérez Zerpa et al.2015; Giusti andMainardi 2016). A general approach using aHook’s Law correctedwith a quadratic termwas deeply stud-ied by Kudryashov and Chernyavskii (2006). Some works(Pezzinga et al. 2014, 2016) present quasi 2-D models, totake into account the viscous friction in the transients. Dif-ferential constitutive models, which present linearity, are aclassic choice for studying a viscoelastic prosthesis (Droz-dov 1996; Bergström and Hilbert 2005). Among them, theKelvin–Voigt material model has been thoroughly studiedand is broadly used in several engineering fields (Meniconiet al. 2012; Apollonio et al. 2014; Kundu et al. 2015; Wardaet al. 2001; Barclay and Moodie 1987; Moodie et al. 1985).Unlike Kelvin–Voigt model, Maxwell and Zener models cansimulate materials that show permanent deformation (Covaset al. 2004) and can be adjusted to the mechanical proper-ties of vascular prostheses (Blaise et al. 2016). In this work,we have explored Maxwell and Zener models to study pres-sure waves’ attenuation when traveling along viscoelasticpipes. The final outcome of this study is explicit formulae
that quantify the decaying rate of pressure waves in vascularviscoelastic prostheses. To the best of our knowledge, thereis not such explicit formula for this class of materials. Wewill exploit these formulae to determine the material prop-erties that fulfill a desired level of attenuation. This will beuseful to choose commercially available materials or designand manufacture our own material to design a prosthesis thatsuits the patient’s attenuation needs.
2 Materials and methods
In this manuscript, we model the transmission of pressurepulses along a straight pipe made of a viscoelastic material,filled with a fluid. This model can be separated in two parts:The first one refers to the dynamic stress/strain behavior ofthe material of the pipe, also known as material model, andthe other one refers to the wave equation governing the pres-sure wave transmission. We have compared this model to aset of experimental strain/stress and strain/time curves andadjusted the parameters for a polymer for medical devices,polydimethylsiloxane.
2.1 Material model
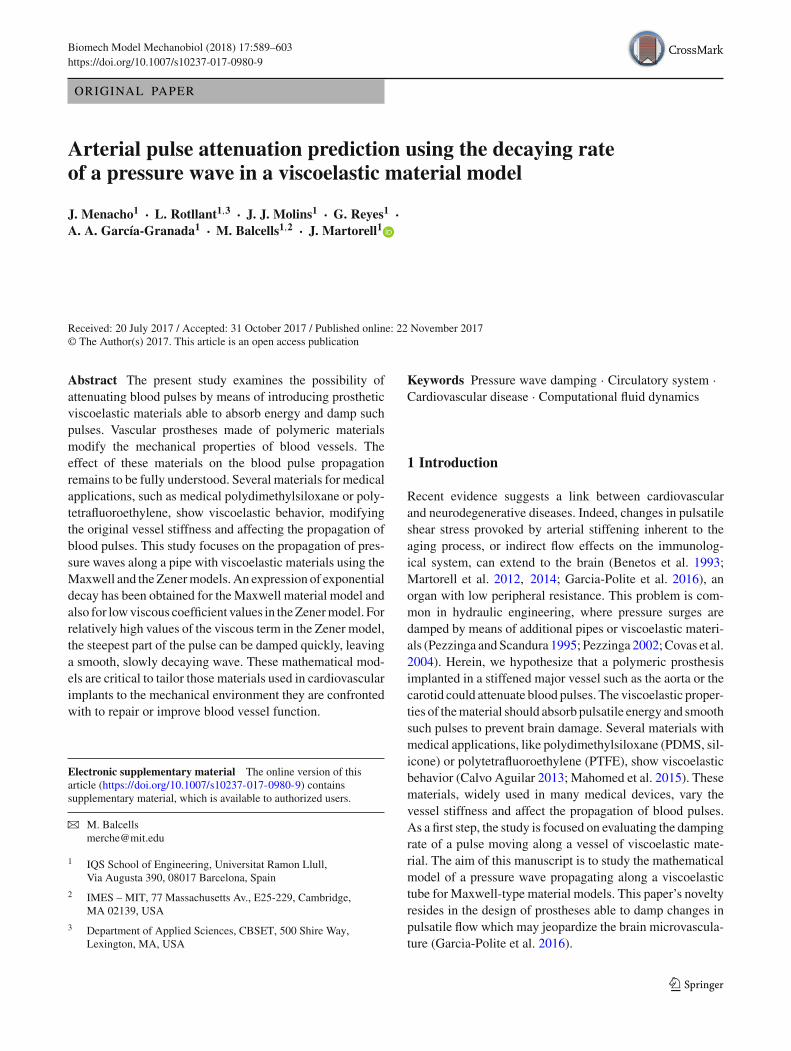
We have used two well-known viscoelastic material model,the Maxwell model (Fig. 1a) and the Zener model (Fig. 1b).The Maxwell model is defined by Eq. (1), where ε is thestrain and σ the stress. E1 and η are the static Young mod-ulus and the viscous factor, respectively. The Zener model(also known as standard linear viscoelastic model or three-parameter model) is defined by Eq. (2), where τ = η/E1.
∂ε
∂t= 1
E1· ∂σ
∂t+ σ
η(1)
∂σ
∂t+ σ
τ= (E0 + E1)
∂ε
∂t+ E0
τε (2)
2.2 Wave equation governing the pressure wavetransmission
The hypotheses assumed for the model are that the fluid isincompressible; the effect of the viscosity of the fluid is neg-ligible; and the deformation of the tube is small related to itsradius. Fluid movement is a plug flow, so the velocity doesnot depend on the radial dimension. In fact, a published studyin which speed was locally measured (Pezzinga et al. 2014)shows fairly flat velocity profiles in the hydraulic transients.However, it should be noted that this study was carried outfor turbulent regimes, whereas flow is usually laminar in thecirculatory system.
For a pipe with wall thickness (e) small compared to theinner radius (r), the relationship between the pressure dif-
123
Arterial pulse attenuation prediction using the decaying rate of a pressure. . . 591
E1 η
E1 η
E0
A B
C D
e
Fig. 1 a Maxwell model for a viscoelastic material. E1 is the elasticmodulus and η the viscous modulus. b Zener model for a viscoelasticmaterial. E0 and E1 are the elastic moduli and η the viscous modulus.
c Sketch of the pipe section. r is the radius, and e is the thickness ofthe pipe. d One-dimensional pressure pulse propagation along a pipe intime and space
ference between the pressure inside and outside the pipe (p)and the tangential stress (σ ) at the pipe wall (Fig. 1c) is:
p · r = σ · e (3)
The continuity equation for a differential volume inside thetube gives:
∂u
∂x= −2
r· ∂r
∂t(4)
In addition, the balance of the momentum gives:
ρ
(∂u
∂t+ u
∂u
∂x
)= −∂p
∂x+ f
πr2(5)
where u is the velocity of the fluid and ρ its density. In thelast term, f is the frictional force per unit length that dependson the viscosity and the shape of the velocity (Willemet andAlastruey 2015). The term of convective acceleration maybe negligible when the velocity is low. In this work, theconvective acceleration and frictional force terms have beenneglected.
2.3 Pressure propagation using the Maxwell model
If the strain is dε = dr/r , combining Eq. (1) with Eq. (4)gives:
∂u
∂x= −2
(1
E1· ∂σ
∂t+ 1
ησ
)(6)
Therefore, Eqs. (5, 6), after cross-derivation, give the uniqueequation:
∂2 p
∂x2= 2ρ
(1
E1· ∂2σ
∂t2+ 1
η· ∂σ
∂t
)(7)
Taking into account (3), if c is the pressure wave velocity,the model results in:
c2 = eE1
2ρr(8a)
∂2 p
∂t2+ 1
τ· ∂p
∂t= c2 · ∂2 p
∂x2(8b)
This is a wave equation with a linear dissipation term. Whenη tends to infinity, τ does too and Eq. (8b) becomes the well-knownequation for (undamped) pressure pulses inside elasticpipes, like in a water hammer.
When the initial and boundary conditions are convenient,Eq. (8b) can be solved by separation of variables and Sturm–Liouville series. For the conditions set in (9), this becomes aneigenvalue problem that allows calculating the decaying rate
123
592 J. Menacho et al.
of the pressure wave. These eigenvalues define the inherentdamping ability of the material.
⎧⎪⎪⎨⎪⎪⎩
p (0, t) = 0p (L , t) = 0p (x, 0) = f (x)∂p∂t (x, 0) = g (x)
(9)
The eigenvalues, which are the spatial frequencies, are: λn =( nπL
)2, n ∈ N, and the formal solution to (8) is:
p (x, t) =∑∞
n=1(C1n exp (μ1nt)
+C2n exp (μ2nt)) sinnπx
L(10)
where μ1n,2n = 12τ ± √
n with the discriminant
n = 1
4τ 2− λnc
2 = E21
4η2− n2π2
L2 · eE1
2ρr(11)
Note that μ1n,2n are always negative. Hence, if the discrimi-nantn is negative, the corresponding term is underdamped.If the discriminant is zero, the corresponding term is criticallydamped. If the discriminant is positive, the correspondingterm is overdamped. Note that the sequence of the valuesof this discriminant (11) is decreasing and unbounded. Inconsequence, there will be infinite negative terms (under-damped). However, for low values of n, the discriminantcould be positive and hence the lowest spatial frequenciesmay be overdamped. This is when
τ 2 <L2
n2π2 · ρr
2eE1(12)
For underdamped cases, the solution to (8) can be written asa function of time and space:
p (x, t) = e− t2τ · φ (x, t) (13a)
p (x, t) = e− xt2τ ·c · φ (x, t) (13b)
where xt = c · t is the position of the pressure pulse andx ∈ [0, L] is the spatial coordinate.
If ωn = √−n,Cn and δn are constants to be determinedfrom the initial conditions, the auxiliary function φ (x, t) isdefined as follows:
φ (x, t) =∑∞
n=1Cn cos (ωnt + δn) sin
nπx
L(13c)
φ (x, t) is an undamped wave, and most importantly a peri-odic function in both time and space. Consequently, it doesnot show any irreversible decay, and therefore, the decay rateof the wave is the negative exponential in (13a) with constantof time 2τ .
For those cases where condition (12) is not fulfilled, anumber of overdamped terms arise. This happens for valuesof n lower than a critical value k, which is L/ (2cπτ). Then,the solution becomes:
p (x, t) =∑k
n=1
[Ane
μ1n t + Bneμ2n t
]+ e− t
2τ∑∞
n=k+1Cn cos(ωnt + δn) sin
nπx
L(14)
Note that μ2n < −1/2τ < μ1n < 0, so the wave will showan overdamped part and an underdamped part. One part ofthe overdamped terms decay faster than the undamped terms,and the other part decays slower. The dominant decay rate ofthe overdamped part is controlled by μ11 > −1/2τ .
2.4 Pressure propagation using the Zener model
Time derivation of the Zener model (2) gives:
∂2σ
∂t2+ 1
τ· ∂σ
∂t= (E0 + E1)
∂2ε
∂t2+ E0
τ· ∂ε
∂t(15)
The continuity Eq. (4) gives:
∂u
∂x= −2 · ∂ε
∂t(16)
And, after time derivation:
∂2u
∂t∂x= −2 · ∂2ε
∂t2(17)
Combining (15) with (16, 17), one has:
(E0 + E1)∂2u
∂t∂x+ E0
τ· ∂u
∂x= −2 · ∂2σ
∂t2− 2
τ· ∂σ
∂t(18)
And, deriving respect to time once again:
(E0 + E1)∂3u
∂t2∂x+ E0
τ· ∂2u
∂t∂x= −2 · ∂3σ
∂t3− 2
τ· ∂2σ
∂t2(19)
The balance of the momentum, assuming no convectiveacceleration and no friction (5) and deriving respect to spacegives:
ρ∂2u
∂t∂x= −∂2 p
∂x2(20)
And deriving again respect to time:
ρ∂3u
∂t2∂x= − ∂3 p
∂t∂x2(21)
123
Arterial pulse attenuation prediction using the decaying rate of a pressure. . . 593
If c20 = E0e2ρr and c21 = E1e
2ρr , one can now combine Eq. (19)with (3, 20 and 21):
c =√c20 + c21 (22a)
c2 · ∂3 p
∂t∂x2+ c20
τ· ∂2 p
∂x2= ∂3 p
∂t3+ 1
τ· ∂2 p
∂t2(22b)
This third-order partial differential equation appears as alinearized model in nonlinear acoustics, under the name ofMoore–Gibson–Thompson equation. Taking the dominantterms (those of third order), this is a wave equation with awave velocity c. We propose the next formal solution, whichis analogous to the one found in (13):
p (x, t) =∑∞
n=1e− t
τn · ψn (x) (23)
where ψ is the solution of the equation:
ψ ′′n (x) + λn · ψn (x) = 0 (24)
and
λn = 1
τ 2n· 1 − τ
τnττn
· (c20 + c21) − c20(25)
When pressure is zero, (25) gives λn = ( nπL
)2 and the func-tion ψ is:
ψn (x) = Cn · sin nπx
L, n ∈ N (26)
where L is the length of the spatial domain andCn every con-stant. From (25) one gets the cubic characteristic equation,for the unknown 1/τn :
1
τ 3n− 1
τ· 1
τ 2n+ λn
(c20 + c21
)· 1
τn− 1
τ· λnc
20 = 0 (27)
This polynomial does not have any negative real root. Usingthe formulae of Cardano, the roots of this polynomial are:
1
τn,1= 1
3τ+ S1 + S2 (28a)
1
τn,2= 1
3τ− S1 + S2
2+
√3
2i (S2 − S1) (28b)
1
τn,3= 1
3τ− S1 + S2
2−
√3
2i (S2 − S1) (28c)
where
S1 = 1
3τ3√R +
√R2 + Q3 ;
S2 = 1
3τ3√R −
√R2 + Q3 (29a)
R = 9
2· τ 2λn
(2c20 − c21
)+ 1 (29b)
Q = 3τ 2λn(c20 + c21
)− 1 (29c)
The lowest value of the real part of 1/τn controls the decayingrate and that is:
1
τn= min
(1
3τ+ S1 + S2,
1
3τ− S1 + S2
2
)(30)
The value of S1 + S2 decreases as n increases and tends to aconstant value depending on the parameters of the materialmodel:
limn→∞ (S1 + S2) = 1
3τ·2c
20 − c21
c20 + c21= 1
3τ·(2 − 3E1
E0 + E1
)
(31)
Therefore, the limiting value of the constant 1/τncan bestated from (30) and (31):
1
τn→∞= min
(1
τ· E0
E0 + E1,1
2τ· E1
E0 + E1
)(32)
This limiting value is known as the “essential spectrum” ofthe problem. Observe in the expression (30) that, for a rangeof cases, the value of τn is almost independent on n and theexponential part of the solution (23) can be taken out of thesum. This limiting value of 1/τn can be approximated by(32), and this is when:
τ 2 · c2 � 1 m2 (33)
The same is true when the pulse width is very short comparedwith the length of the space considered, because the lowestharmonic terms in (23) are very weak.
Note that the imaginary part of (28b,28c) represents theharmonics of an oscillationwith increasing frequency. There-fore, the solution for (23) can be written as a function of timeand space:
p (x, t) = e− t
τeq · ξ (x, t) (34a)
p (x, t) = e− xt
c·τeq · ξ (x, t) (34b)
where xt = c · t is the position of the pressure pulse andx ∈ [0, L] is the spatial coordinate. ξ (x, t) is a boundedfunction which is periodic in both time and space or dampedin time and periodic in space, and τeq can be calculated by(35).
τeq = max
(τ · E0 + E1
E0, 2τ · E0 + E1
E1
)(35)
123
594 J. Menacho et al.
When condition (33) is not fulfilled, the value of τn in Eq. (30)depends on the value of n. In that case, the exponential part ofthe solution (23) can’t be taken out of the sum and the decay-ing rate becomes a weighted sum of n exponential decayslimited by n = 1 (lowest decaying rate) and n → ∞ (high-est decaying rate).
In summary, expressions (13) and (34-35) give the decay-ing rate of a pressure wave along a tube when condition (33)is fulfilled only for the Zener model. Note that both expres-sions refer to the pressure, which is proportional to stressσ (3); therefore, the decaying rate for the stress is the samefor pressure and stress. When (33) is not fulfilled, the decay-ing rate is bounded between the decaying rate calculated forn = 1 and the one calculated for n → ∞ with Eq. (30).
2.5 Numerical simulations
The formulae previously developed are compared to numer-ical one-dimensional simulations. We propose the problemwith a realistic blood pressure pulse arising from a heartbeat.The pressure wave propagates along a straight viscoelasticpipe of length L (Fig. 1d), with pulsatile inlet f (t) as shownin Eq. (36):
f (t) ={ pmax
2
(1 − cos
( 2πT t
)), t ≤ T
0 , t > T(36)
In consequence, for the Maxwell material model, the set ofconditions of the problem are defined in (37) as:
⎧⎪⎪⎪⎪⎪⎨⎪⎪⎪⎪⎪⎩
∂2 p∂t2
+ 1τ
· ∂p∂t = c2 · ∂2 p
∂x2
p (0, t) = f (t)p (L , t) = 0p (x, 0) = 0∂p∂t (x, 0) = 0
(37)
The partial differential equation (PDE) is second order bothin time and in space. It has been solved by the method oflines (Saucez et al. 2004). The space dimension has beendiscretized using finite differences, by centered formulas ofsecond order. This gives a system of ordinary differentialequation (ODE) in time, where h is the space step of thediscretization.
d2 pidt2
+ 1
τ
dpidt
= c2(pi+1 − 2pi + pi−1
h2
), i = 1 . . . N
(38)
To reduce these second-order ODEs to first-order ones, onetakes:
dpidt
(t) = ri (t) (39)
This gives 2N equations:
{ dpidt = ridridt = c2
(pi+1−2pi+pi−1
h2
)− 1
τri
, i = 1 . . . N (40)
And the conditions:
p0 = f (t) ; pN+1 = 0 (41)
The ODE system (40,41) is solved using the Dormand–Prince method (Dormand and Prince 1980), programmed inMATLAB (ode45).
For the Zener model, the set of conditions of the problemare defined in (42), analogous to (37), with the pressure pulsedefined previously in (36):
⎧⎪⎪⎪⎪⎪⎪⎪⎪⎪⎪⎪⎪⎪⎨⎪⎪⎪⎪⎪⎪⎪⎪⎪⎪⎪⎪⎪⎩
(c20 + c21
) ∂3 p∂t∂x2
+ c20τ
· ∂2 p∂x2
= ∂3 p∂t3
+ 1τ
· ∂2 p∂t2
p (0, t) = f (t)
p (L , t) = 0∂2 p∂t∂x (L , 0) = 0
p (x, 0) = 0∂p∂t (x, 0) = 0∂2 p∂t2
(x, 0) = 0
(42)
Taking into account (39) and (42):
∂2 pi∂t2
(t) = ∂ri∂t
(t) = si (t) (43)
The PDE gives the system of 3N ODE (i = 1. . .N):
⎧⎪⎪⎪⎪⎪⎪⎨⎪⎪⎪⎪⎪⎪⎩
dpidt = ri i = 1 . . . Ndridt = sidsidt = c20
τ(h)2· (pi+1 − 2pi + pi−1)
+ c20+c21(h)2
· (ri+1 − 2ri + ri−1) − 1τ
· si(44)
And the boundary conditions give:
p0 = f (t) ; pN+1 = 0; r0 = f ′(t); rN+1 = rN−1 (45)
The ODE system (44,45) is solved using the sameMATLABcode.
2.6 Mechanical testing and model adjustment
The ability to damp pressure waves was tested in poly-dimethylsiloxane (PDMS, Dow Corning, Midland, MI), acommon material used in medical applications. Maxwell
123
Arterial pulse attenuation prediction using the decaying rate of a pressure. . . 595
and Zener models were adjusted to represent the viscoelas-tic behavior of PDMS using a stress/strain experiment.Stress/strain testswere carried out using Instron® ElectroPul-sTM E3000a tensile rig. Force was obtained from load cellsand displacement obtained from grip displacement. Briefly,a uniaxial sinusoidal displacement at 1Hz was applied toa flattened half cylinder of PDMS of 14.28mm diameterand 2.37mm thickness. This tube was cut into slices of10mm width and straightened to a length of 37.38mm. ThePDMS sample was held to the uniaxial test machine allow-ing a length between fixations of 20 mm. (See supplementalVideo 1) Tube flattening provoked a 20% compression on theexterior face and a 20% tension on the interior face. The dis-placement applied deformed the sample up to 7% to obtainstress/time and strain/time curves. Our experiment measuredthe average tensile strength along the tube. We performeda series of simulations to confirm that the significant thick-ness of our pipe (0.166 thickness-to-diameter ratio) wouldnot affect our results. Indeed, we observed that, for ratiosbetween 0.1 and 0.2, the error between theoretical and aver-age stress ranged approximately ± 3%.
The stress/strain experiment was simulated in parallel toestimate the material models’ parameters that fit best theexperimental data. These simulations were run using theDormand–Prince method, with the experimental strain/timecurve as an input and the stress/time curves as an out-put. The error between the experimental and the simulatedstress/time curveswas calculated as the average of the orthog-onal distance from each point of the experimental data tothe simulated curve. This error was minimized using theNelder–Mead simplex method (Lagarias et al. 1998) to findthe material models’ parameters that best represented thematerial behavior.
3 Results
3.1 Formulae validation
This first section is devoted to test and discuss the validityof the models and the formulae developed in the methodssection. These calculations only prove the validity of themathematical model, and do not represent any specific physi-cal condition. That is, these simulations calculate the pressurewave damping for certain values of τ , c, T and L withoutaiming at any particular material.
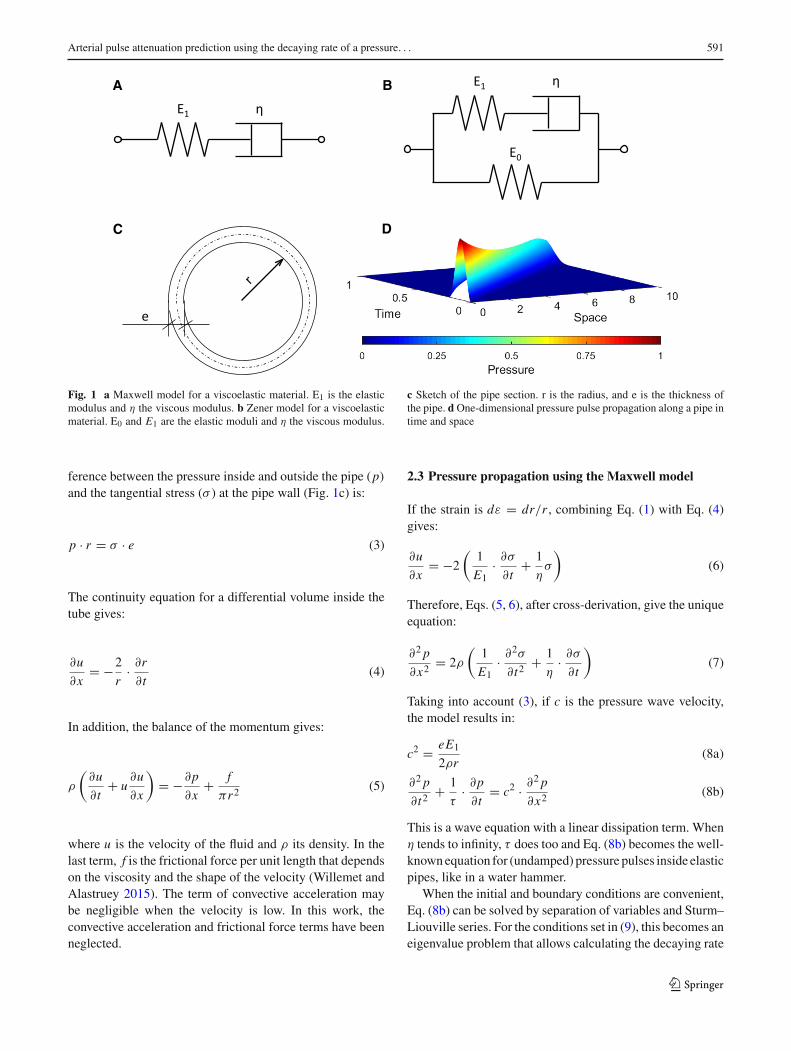
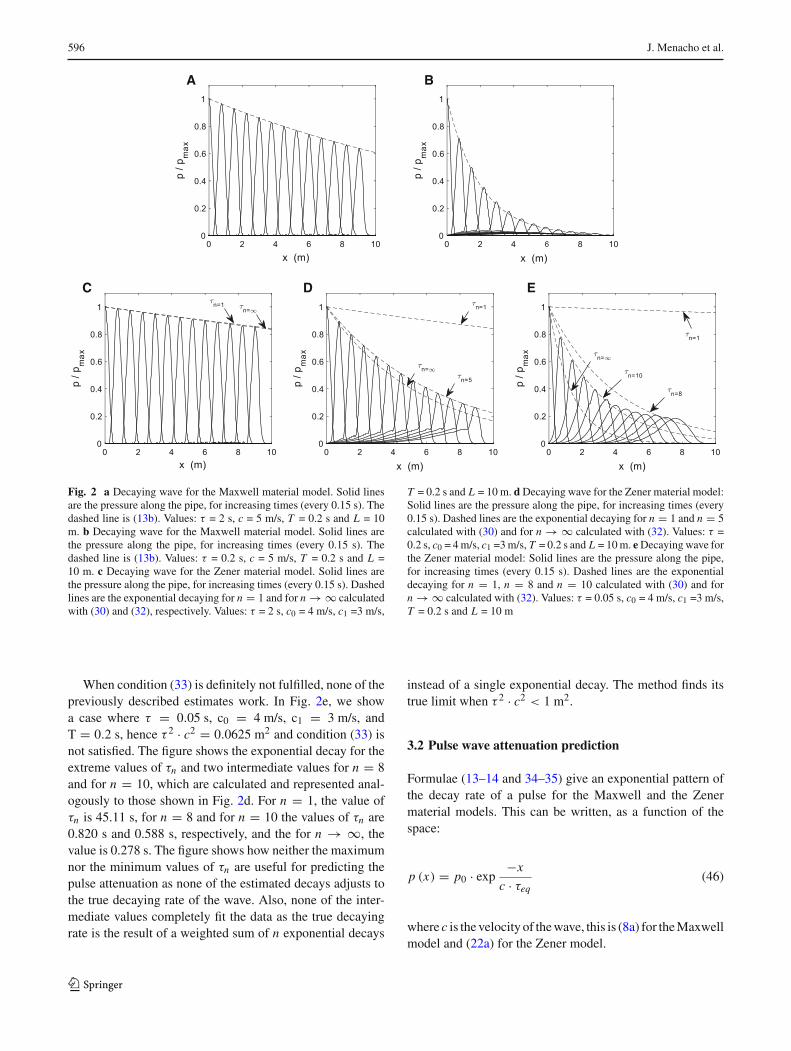
Figure 2a shows the result of a simulation using theMaxwell material model, for a set of values where all fre-quencies are underdamped. In this case, τ = 2 s, c = 5 m/s, T= 0.2 s and L = 10 m. The dashed line shows the exponen-tial decay along the spatial axis, following Eq. (13b). Solidlines represent the pressure pulse along the pipe in incre-ments of 0.15 s in time. The displacement of the pulse has
been simulated before it reaches the end of the pipe, to avoidend-of-pipe reflection effects. The exponential decay adjustsperfectly to the pressure wave damping.
Figure 2b shows the result of a simulation using theMaxwell material model, for a set of values where some fre-quencies are overdamped. In this case, τ = 0.2 s, c = 5 m/s,T = 0.2 s and L = 10 m. The overdamped terms provoke thatthe pressure profiles exceed the exponential. In the solutionshown in Fig. 2b, the smoothwave that develops at the bottomcorresponds to the slow-decaying terms: For these over-damped terms, the dominant term (14) is A1 · exp (μ11 · t),with μ11 = − 0.555 s−1. The higher-frequency terms (thesharp peak of the pressure pulse) disappear faster than thelow-frequency terms (the smooth wave remaining). Theexponential decay adjusts fairly to the pressure wave damp-ing.
Figure 2c shows the result of a simulation using the Zenermaterial model, for a case where E1 < 2 · E0. In this case:τ = 2 s, c0 = 4 m/s, c1 = 3 m/s„ T = 0.2 s and L = 10 m.According to (22a), c = 5 m/s, which is the same valuethat is used in Fig. 2a, b. Solid lines represent the pres-sure pulse along the pipe in increments of 0.15 s in time.Dashed lines show the exponential decay along the spatialaxis, for n = 1 and for n → ∞ calculated with (30) and(32), respectively. The exponential decay is almost indepen-dent of n because condition (33) is fulfilled. The limitingvalue (known as essential spectrum and with highest decay-ing rate) is τ∞ = 11.11 s, only slightly lower than τ1 = 11.59s (lowest decaying rate). In this case then, the decaying ratecan be calculated with Eq. (34b), and therefore, the essentialspectrum given by (35) is a good predictor for the decayingrate.
Figure 2d shows the result of another simulation usingthe Zener material model, for a case where τ = 0.2 s,c0 = 4 m/s, c1 = 3 m/s, T = 0.2 s and L = 10 m. Inthis case, condition (33) is not fulfilled as τ 2 · c2 = 1 m2.The dashed lines show the exponential decay for differentvalues of τn : the extreme values (n = 1 and n → ∞) and anintermediate τn for n = 5, the value of n that best adjusts tothe true decaying rate of the pressure wave . The maximumvalue of τn was calculated using (30) for n = 1 and is 11.606s. The intermediate value was calculated also using (30) forn = 5 and is 1.332 s. The minimum, for n → ∞, is 1.111s, calculated by (32). This last value does not fit properly thedecaying rate but could be used as a first approximation forthe sharpest part of the wave. The exponential decay calcu-lated for n = 5 does fit very well the wave decaying ratebut it is a particular case for these specific conditions; vary-ing the material model parameters or the geometry wouldchange the value of n that best fits the wave decaying rate. Inconclusion, when condition (33) is mildly not fulfilled, thespectrum given by (35) for n → ∞ approximates fairly tothe true decaying rate.
123
596 J. Menacho et al.
B
EDC
A
Fig. 2 a Decaying wave for the Maxwell material model. Solid linesare the pressure along the pipe, for increasing times (every 0.15 s). Thedashed line is (13b). Values: τ = 2 s, c = 5 m/s, T = 0.2 s and L = 10m. b Decaying wave for the Maxwell material model. Solid lines arethe pressure along the pipe, for increasing times (every 0.15 s). Thedashed line is (13b). Values: τ = 0.2 s, c = 5 m/s, T = 0.2 s and L =10 m. c Decaying wave for the Zener material model. Solid lines arethe pressure along the pipe, for increasing times (every 0.15 s). Dashedlines are the exponential decaying for n = 1 and for n → ∞ calculatedwith (30) and (32), respectively. Values: τ = 2 s, c0 = 4 m/s, c1 =3 m/s,
T = 0.2 s and L = 10 m. d Decaying wave for the Zener material model:Solid lines are the pressure along the pipe, for increasing times (every0.15 s). Dashed lines are the exponential decaying for n = 1 and n = 5calculated with (30) and for n → ∞ calculated with (32). Values: τ =0.2 s, c0 = 4m/s, c1 =3m/s, T = 0.2 s and L = 10m. e Decaying wave forthe Zener material model: Solid lines are the pressure along the pipe,for increasing times (every 0.15 s). Dashed lines are the exponentialdecaying for n = 1, n = 8 and n = 10 calculated with (30) and forn → ∞ calculated with (32). Values: τ = 0.05 s, c0 = 4 m/s, c1 =3 m/s,T = 0.2 s and L = 10 m
When condition (33) is definitely not fulfilled, none of thepreviously described estimates work. In Fig. 2e, we showa case where τ = 0.05 s, c0 = 4 m/s, c1 = 3 m/s, andT = 0.2 s, hence τ 2 · c2 = 0.0625 m2 and condition (33) isnot satisfied. The figure shows the exponential decay for theextreme values of τn and two intermediate values for n = 8and for n = 10, which are calculated and represented anal-ogously to those shown in Fig. 2d. For n = 1, the value ofτn is 45.11 s, for n = 8 and for n = 10 the values of τn are0.820 s and 0.588 s, respectively, and the for n → ∞, thevalue is 0.278 s. The figure shows how neither the maximumnor the minimum values of τn are useful for predicting thepulse attenuation as none of the estimated decays adjusts tothe true decaying rate of the wave. Also, none of the inter-mediate values completely fit the data as the true decayingrate is the result of a weighted sum of n exponential decays
instead of a single exponential decay. The method finds itstrue limit when τ 2 · c2 < 1 m2.
3.2 Pulse wave attenuation prediction
Formulae (13–14 and 34–35) give an exponential pattern ofthe decay rate of a pulse for the Maxwell and the Zenermaterial models. This can be written, as a function of thespace:
p (x) = p0 · exp −x
c · τeq(46)
where c is the velocity of thewave, this is (8a) for theMaxwellmodel and (22a) for the Zener model.
123
Arterial pulse attenuation prediction using the decaying rate of a pressure. . . 597
τeq is, for the Maxwell model:
τeq =
⎧⎪⎨⎪⎩2τ, 4τ 2π2 · c2
L2 ≥ 12τ
1−√1−4τ 2π2· c2
L2
> 2τ, 4τ 2π2 · c2
L2 < 1 (47)
And, for the Zener model if τ 2 · c2 � 1m2:
τeq ≈{2τ · E0+E1
E1∈ (2τ, 3τ) , E1 < 2E0
τ · E0+E1E0
≥ 3τ, E1 ≥ 2E0(48)
Note that, for this last model, the time constant is only validfor the steepest part of the pulse.
When the interest is to study the pulse attenuation, thelength is a critical limitation. The desired attenuation a isdefined as the pressure damping between inlet (x = 0, p0)and outlet (x = L, p(L)):
a = 1 − pOUT
pI N= 1 − p (L)
p0(49)
Combining (46) and (49), one can obtain the analyticalexpression of the length L of material required for a certainattenuation a.
L = c · τeq · ln 1
1 − a(50)
3.3 Experimental determination of the material models’parameters
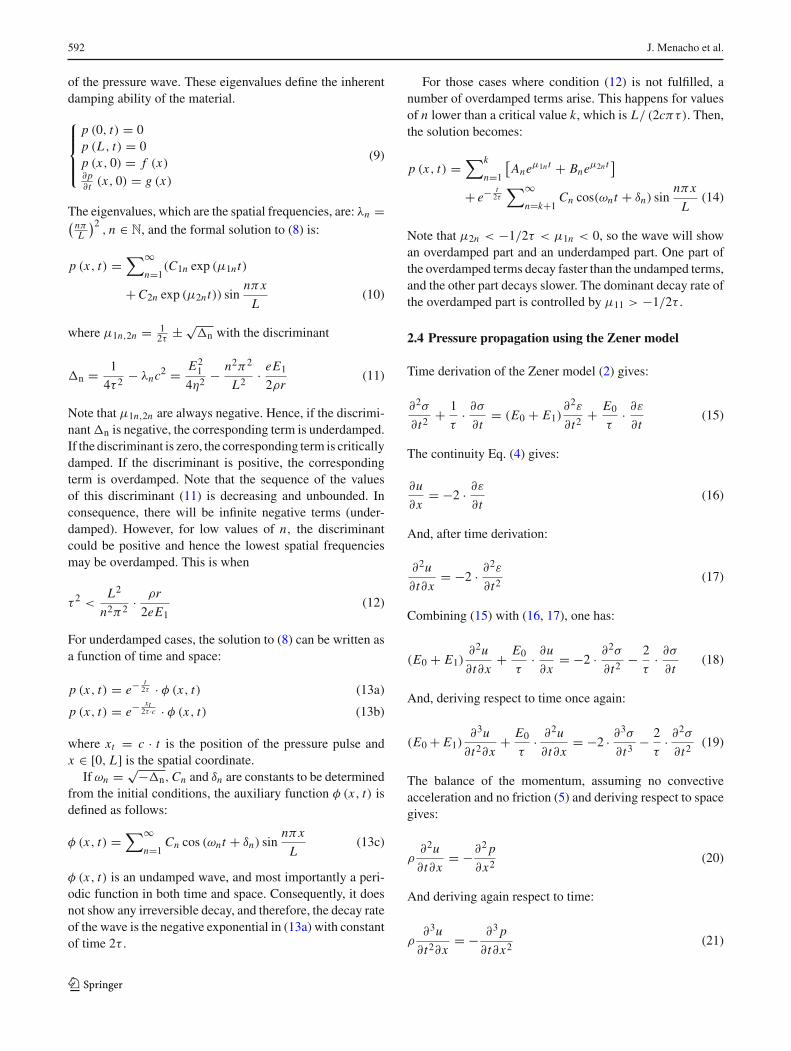
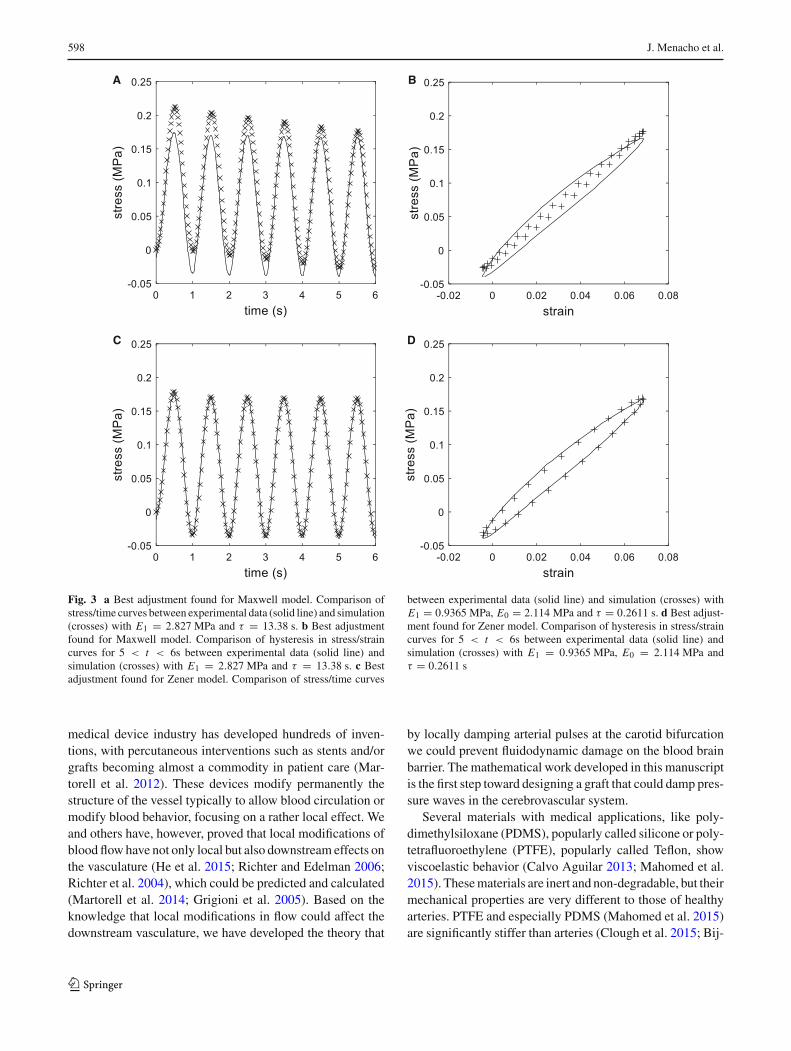
Maxwell and Zener models were used to characterize themechanical behavior of our PDMS samples. As seen inFig. 3a, b, the best fit for the Maxwell poorly adjusted tothe experimental stress/strain and stress/time cycles. Thebest adjustment found for the Maxwell model was E1 =2.827 MPa and τ = 13.38 s. In the first cycle there was anoffset of approximately +0.025 MPa in the lower side of thecycle and of +0.05 MPa in the higher side of the cycle, andalthough these differences decreased in the next cycles, thetendency of the simulation did not fit the experimental curve.On the other hand, the Zener model was able to properlyadjust the stress/strain and stress/time cycles of the PDMSsample. This is shown in Fig. 3c, d. In this case, the best fitwas for the parameters E1 = 0.9365 MPa, E0 = 2.114 MPaand τ = 0.2611 s. The rest of the work was done using theZener model and the parameters obtained.
3.4 Numerical simulations of pressure wave damping byPDMS
Simulations were performed to estimate how a straightPDMS prosthesis would be able to damp a pressure pulse.
The prosthesis was a straight cylinder of 4.0 mm in radiusand 0.5 mm in thickness. The wave velocity c, calculatedwith (22a), was 13.808 m/s, and the fluid density was set at1000 kg/m3. This simulation would correspond to a cylin-drical PDMS device implanted in a straight vessel such asthe common carotid artery, which has an approximate radiusof 4.0 mm. The period of the pulse was set at 0.2 s, whichis the amplitude of a systole, and the simulated length wasenough for the wave to run the entire cylinder. The lengthof the simulation was calculated as the multiplication of thepulse period and the propagation speed c. The results showedthat our PDMSprosthesis would only be able to damp around4% in the first meter of device. This is consistent with theattenuation predicted by formulae (46,48), which matcheswith the results of the numerical simulation.
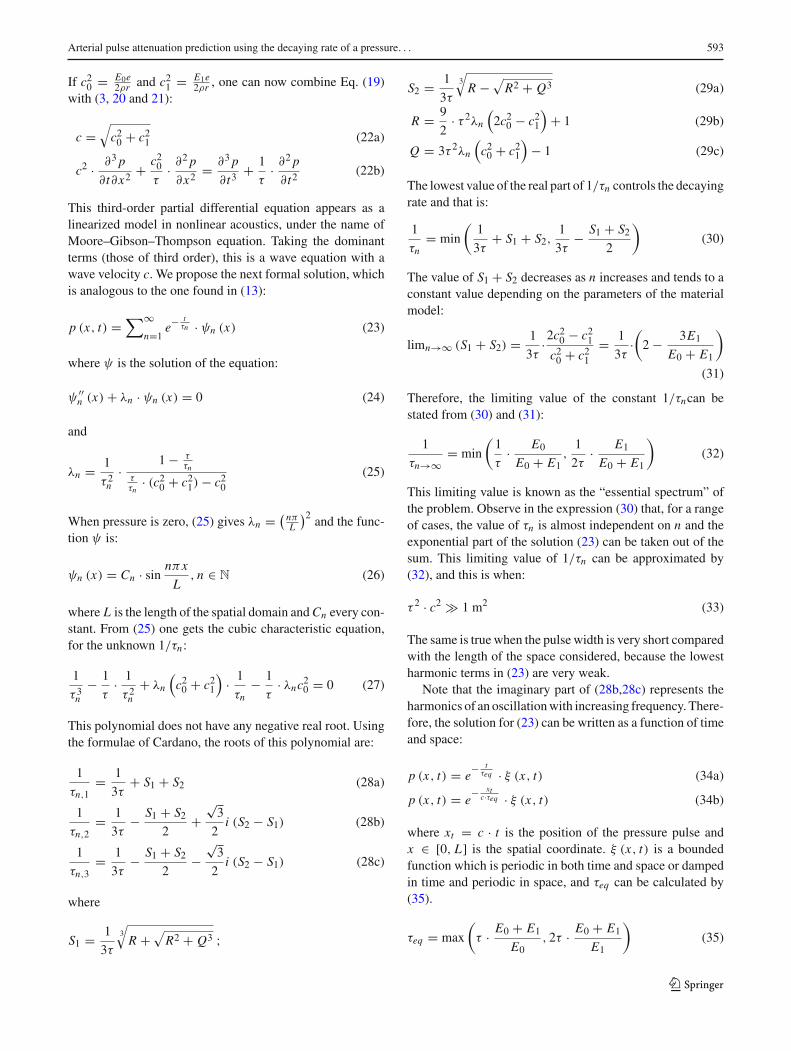
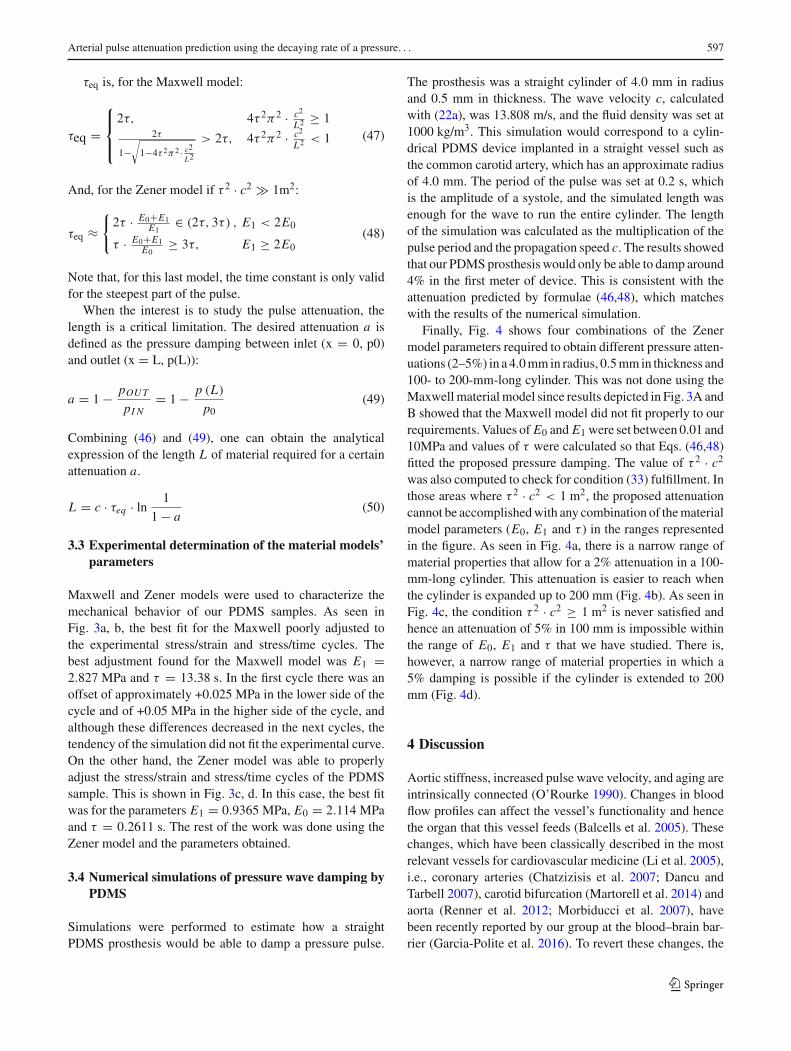
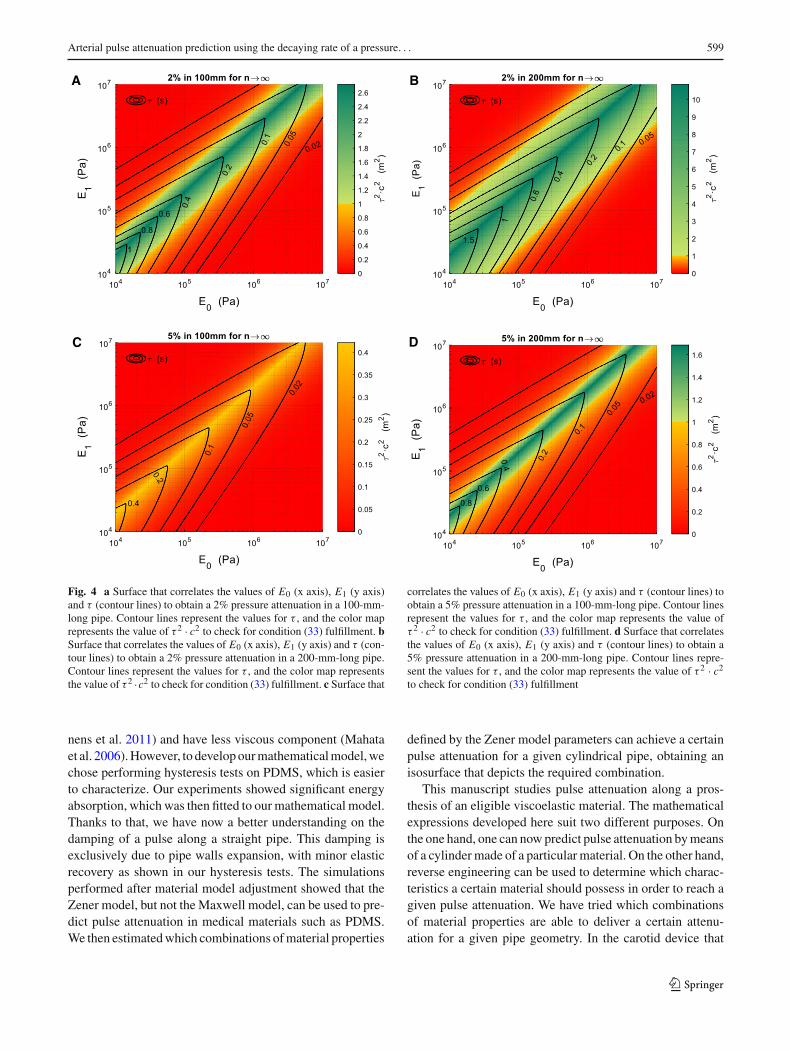
Finally, Fig. 4 shows four combinations of the Zenermodel parameters required to obtain different pressure atten-uations (2–5%) in a 4.0mm in radius, 0.5mm in thickness and100- to 200-mm-long cylinder. This was not done using theMaxwellmaterialmodel since results depicted in Fig. 3A andB showed that the Maxwell model did not fit properly to ourrequirements. Values of E0 and E1 were set between 0.01 and10MPa and values of τ were calculated so that Eqs. (46,48)fitted the proposed pressure damping. The value of τ 2 · c2was also computed to check for condition (33) fulfillment. Inthose areas where τ 2 · c2 < 1 m2, the proposed attenuationcannot be accomplishedwith any combination of thematerialmodel parameters (E0, E1 and τ ) in the ranges representedin the figure. As seen in Fig. 4a, there is a narrow range ofmaterial properties that allow for a 2% attenuation in a 100-mm-long cylinder. This attenuation is easier to reach whenthe cylinder is expanded up to 200 mm (Fig. 4b). As seen inFig. 4c, the condition τ 2 · c2 ≥ 1 m2 is never satisfied andhence an attenuation of 5% in 100 mm is impossible withinthe range of E0, E1 and τ that we have studied. There is,however, a narrow range of material properties in which a5% damping is possible if the cylinder is extended to 200mm (Fig. 4d).
4 Discussion
Aortic stiffness, increased pulse wave velocity, and aging areintrinsically connected (O’Rourke 1990). Changes in bloodflow profiles can affect the vessel’s functionality and hencethe organ that this vessel feeds (Balcells et al. 2005). Thesechanges, which have been classically described in the mostrelevant vessels for cardiovascular medicine (Li et al. 2005),i.e., coronary arteries (Chatzizisis et al. 2007; Dancu andTarbell 2007), carotid bifurcation (Martorell et al. 2014) andaorta (Renner et al. 2012; Morbiducci et al. 2007), havebeen recently reported by our group at the blood–brain bar-rier (Garcia-Polite et al. 2016). To revert these changes, the
123
598 J. Menacho et al.
A
C
B
D
Fig. 3 a Best adjustment found for Maxwell model. Comparison ofstress/time curves between experimental data (solid line) and simulation(crosses) with E1 = 2.827 MPa and τ = 13.38 s. b Best adjustmentfound for Maxwell model. Comparison of hysteresis in stress/straincurves for 5 < t < 6s between experimental data (solid line) andsimulation (crosses) with E1 = 2.827 MPa and τ = 13.38 s. c Bestadjustment found for Zener model. Comparison of stress/time curves
between experimental data (solid line) and simulation (crosses) withE1 = 0.9365 MPa, E0 = 2.114 MPa and τ = 0.2611 s. d Best adjust-ment found for Zener model. Comparison of hysteresis in stress/straincurves for 5 < t < 6s between experimental data (solid line) andsimulation (crosses) with E1 = 0.9365 MPa, E0 = 2.114 MPa andτ = 0.2611 s
medical device industry has developed hundreds of inven-tions, with percutaneous interventions such as stents and/orgrafts becoming almost a commodity in patient care (Mar-torell et al. 2012). These devices modify permanently thestructure of the vessel typically to allow blood circulation ormodify blood behavior, focusing on a rather local effect. Weand others have, however, proved that local modifications ofblood flowhave not only local but also downstream effects onthe vasculature (He et al. 2015; Richter and Edelman 2006;Richter et al. 2004), which could be predicted and calculated(Martorell et al. 2014; Grigioni et al. 2005). Based on theknowledge that local modifications in flow could affect thedownstream vasculature, we have developed the theory that
by locally damping arterial pulses at the carotid bifurcationwe could prevent fluidodynamic damage on the blood brainbarrier. The mathematical work developed in this manuscriptis the first step toward designing a graft that could damp pres-sure waves in the cerebrovascular system.
Several materials with medical applications, like poly-dimethylsiloxane (PDMS), popularly called silicone or poly-tetrafluoroethylene (PTFE), popularly called Teflon, showviscoelastic behavior (Calvo Aguilar 2013; Mahomed et al.2015). Thesematerials are inert and non-degradable, but theirmechanical properties are very different to those of healthyarteries. PTFE and especially PDMS (Mahomed et al. 2015)are significantly stiffer than arteries (Clough et al. 2015; Bij-
123
Arterial pulse attenuation prediction using the decaying rate of a pressure. . . 599
D
B
C
A
Fig. 4 a Surface that correlates the values of E0 (x axis), E1 (y axis)and τ (contour lines) to obtain a 2% pressure attenuation in a 100-mm-long pipe. Contour lines represent the values for τ , and the color maprepresents the value of τ 2 · c2 to check for condition (33) fulfillment. bSurface that correlates the values of E0 (x axis), E1 (y axis) and τ (con-tour lines) to obtain a 2% pressure attenuation in a 200-mm-long pipe.Contour lines represent the values for τ , and the color map representsthe value of τ 2 ·c2 to check for condition (33) fulfillment. c Surface that
correlates the values of E0 (x axis), E1 (y axis) and τ (contour lines) toobtain a 5% pressure attenuation in a 100-mm-long pipe. Contour linesrepresent the values for τ , and the color map represents the value ofτ 2 · c2 to check for condition (33) fulfillment. d Surface that correlatesthe values of E0 (x axis), E1 (y axis) and τ (contour lines) to obtain a5% pressure attenuation in a 200-mm-long pipe. Contour lines repre-sent the values for τ , and the color map represents the value of τ 2 · c2to check for condition (33) fulfillment
nens et al. 2011) and have less viscous component (Mahataet al. 2006).However, to developourmathematicalmodel,wechose performing hysteresis tests on PDMS, which is easierto characterize. Our experiments showed significant energyabsorption, which was then fitted to ourmathematical model.Thanks to that, we have now a better understanding on thedamping of a pulse along a straight pipe. This damping isexclusively due to pipe walls expansion, with minor elasticrecovery as shown in our hysteresis tests. The simulationsperformed after material model adjustment showed that theZener model, but not the Maxwell model, can be used to pre-dict pulse attenuation in medical materials such as PDMS.We then estimatedwhich combinations ofmaterial properties
defined by the Zener model parameters can achieve a certainpulse attenuation for a given cylindrical pipe, obtaining anisosurface that depicts the required combination.
This manuscript studies pulse attenuation along a pros-thesis of an eligible viscoelastic material. The mathematicalexpressions developed here suit two different purposes. Onthe one hand, one can nowpredict pulse attenuation bymeansof a cylindermade of a particularmaterial. On the other hand,reverse engineering can be used to determine which charac-teristics a certain material should possess in order to reach agiven pulse attenuation. We have tried which combinationsof material properties are able to deliver a certain attenu-ation for a given pipe geometry. In the carotid device that
123

600 J. Menacho et al.
we propose, we can predict an attenuation of up to 5% in a200-mm-long cylinder using our mathematical method. Thisattenuation may seem mild, but our preliminary simulationshave shown a significant decrease in shear stress at the blood–brain barrier thanks to this pressure damping. Further in vitroexperiments will validate our initial estimations.
This is the first time, to the best of our knowledge, thata mathematical model for pulse attenuation including vis-coelasticity along a cylindrical pipe has been studied usingtheMaxwell or the Zener material models. No definitive con-stitutive material model has been defined for blood vessels(Fung et al. 1979; Holzapfel et al. 2000; Valdez-Jasso et al.2009;Masson et al. 2011; Sokolis 2013; Smoljkic et al. 2015;Wang et al. 2016; Holzapfel andOgden 2010; Schulze-Bauerand Holzapfel 2003; Stålhand 2009). Recent works considera viscoelastic Voigt (or Kelvin–Voigt) model for the vessel(Alastruey et al. 2012; Wang et al. 2015; Valdez-Jasso et al.2009). The Kelvin–Voigt model cannot, however, representthe behavior of materials that show permanent deformation.Other models lead to non-isotropic and nonlinear models,which are different to those that fit materials for medicalapplications. Understanding fluid dynamics through bloodvessels is a topic of outmost importance (Martorell et al.2014; Garcia-Polite et al. 2016; Morbiducci et al. 2007;Assemat et al. 2014; Frank et al. 2002; García-Herrera andCelentano 2013; Boileau et al. 2015; Blanco et al. 2014). 3Dcalculations are the cornerstone to fully characterize bloodflow behavior, and the fluid–solid coupled problem is nowa-days one of the most exciting challenges in computationalfluid dynamics (Chen et al. 2016; Cebral et al. 2015;Moireauet al. 2012). These models assume solid walls, elastic wallsormore complexmodels.Windkesselmodels reduce the flowresistance of a vascular assembly to one point (Tsanas et al.2009). Finally, 1D simulations, which have improved expo-nentially in recent years, usually assume elastic behavior ofvessel walls. Despite their limitations in terms of spatial res-olution, they have exponentially lower computational costsand can be a powerful tool to guide and constraint furthercalculations.
We have chosen a 1D approach for our model to min-imize computational costs. Our model possesses a uniquesimplification that allows for easy calculations, if the mate-rial properties criteria are fulfilled. Instead of numericallyestimating a solution for a third-order partial derivativesequation, we solve a simple analytical equation along a cer-tain distance, for a certain time. A recent work (Pellicerand Solà-Morales in press) states a set of properties of thesolutions to this equation by means of spectral analysis.The interested reader can find there the general statementsabout orthogonality and completeness of the eigenfunctionsof a more general formulation. Using our simplifications,the attenuation achieved by a cylinder of a given material
becomes a transfer function problem, which can be reducedto a pointwise resistive element.
Due to its simplicity, we are aware that our model haslimitations. First, as already indicated, the model does notconsider the effects of blood viscosity and the effect of stressin the longitudinal direction. In terms of wave propagationstudy, our model is still limited to an isolated pulse alonga straight pipe, without considering bifurcations or arterialcurvature. In this sense, the common carotid artery is one thestraightest and flat vessels in the human body, and the devicewe would design would be a non-compliant cylindrical graft.Our model does not include the reflexive waves coming fromarterial corners and bifurcations, which could indeed inter-act with the forward pulse wave. The overlapping of pressurewaves can have multiple contrary effects as a function of thedownstream geometry. Further research could help us reach-ing additional damping via wave superposition. As explainedearlier, our model is also limited to a certain range of mate-rial properties. When the multiplication of the square wavevelocity by the square time constant τ is inferior to 1 m2, ourmodel is unable to fit a simple exponential decay. This doesnot mean that no materials can achieve the desired attenua-tion, but it means that our simplified equations cannot predictthis attenuation anymore. In those cases, the third-order par-tial derivatives equation must be solved numerically.
5 Conclusions
We have presented a study of the decay of a pressure pulsepropagating along a pipe made of a viscoelastic material.TheMaxwell material model and the Zener model have beenstudied in this scenario, representative of a vascular prosthe-sis like a graft implanted in a blood vessel.
For the Maxwell material model, we have obtained anexpression of exponential decay (46,47). For the Zenermodel, we have obtained an expression (46,48) that can beuseful only for a range of cases. For relatively high valuesof the viscous coefficient, the steepest part of the pulse isdamped quickly, leaving a smooth wave that slowly decays.
This work opens the window to better design vascularprosthesis made of viscoelastic materials for medical appli-cations. In particular, it could lead to vascular devices able tomodify pressure waves that jeopardize organs and structuressensitive to pressure waves like the blood–brain barrier.
Acknowledgements Thiswork has been supported byGrantMINECO(Spain) SAF2013-43302-R, Fundació Empreses IQS and Obra Social“la Caixa.”
Compliance with ethical standards
Conflicts of interest The authors do not have any conflict of interest.
123

Arterial pulse attenuation prediction using the decaying rate of a pressure. . . 601
Open Access This article is distributed under the terms of the CreativeCommons Attribution 4.0 International License (http://creativecommons.org/licenses/by/4.0/), which permits unrestricted use, distribution,and reproduction in any medium, provided you give appropriate creditto the original author(s) and the source, provide a link to the CreativeCommons license, and indicate if changes were made.
References
Alastruey J, Parker KH, Peiró J, Sherwin SJ (2009) Analysing the pat-tern of pulse waves in arterial networks: a time-domain study. JEng Math 64:331–351
Alastruey J, Passerini T, Formaggia L, Peiró J (2012) Physical deter-mining factors of the arterial pulse waveform: theoretical analysisand calculation using the 1-D formulation. J Eng Math 77:19–37
Alfonso M, Cymberknop L, Armentano R, Pessana F, Wray S, LegnaniW (2016)Arterial pulse pressure amplification described bymeansof a nonlinearwavemodel: characterization of human aging. J PhysConf Ser 705:12029
Apollonio C, Covas DIC, deMarinis G, Leopardi A, Ramos HM (2014)Creep functions for transients in HDPE pipes. Urban Water J11:160–166
Assemat P, Armitage JA, Siu KK, Contreras KG, Dart AM, Chin-Dusting JP, Hourigan K (2014) Three-dimensional numericalsimulation of blood flow in mouse aortic arch around atheroscle-rotic plaques. Appl Math Model [Internet]. [cited 2014 May 6];http://linkinghub.elsevier.com/retrieve/pii/S0307904X14000298
Balcells M, Fernández Suárez M, Vázquez M, Edelman ER (2005)Cells in fluidic environments are sensitive to flow frequency. JCell Physiol 204:329–335
Barclay D, Moodie T (1987) Pulse propagation in a viscoelastic tubecontaining a viscous liquid. Appl Math Model 11:215–218
Benetos A, Laurent S, Hoeks AP, Boutouyrie PH, Safar ME (1993)Arterial alterations with aging and high blood pressure. A nonin-vasive study of carotid and femoral arteries. Arterioscler ThrombVasc Biol 13:90–97
Bergström JS,Hilbert LB (2005)A constitutivemodel for predicting thelarge deformation thermomechanical behavior of fluoropolymers.Mech Mater 37:899–913
BijnensB, Rudenick P, EvangelistaA (2011)Assessing aortic strain andstiffness: don’t forget the physics and engineering. Heart 97:339author reply 340
BlaiseA, André S, Delobelle P,MeshakaY, Cunat C (2016) Advantagesof a 3-parameter reduced constitutive model for the measurementof polymers elasticmodulus using tensile tests.MechTimeDependMater 20:553–577
Blanco PJ, Watanabe SM, Dari EA, Passos MAF, Feijóo RA (2014)Bloodflowdistribution in an anatomically detailed arterial networkmodel: criteria and algorithms. Biomech Model Mechanobiol13:1303–1330
Boileau E, Nithiarasu P, Blanco PJ, Müller LO, Fossan FE, HellevikLR, Donders WP, Huberts W, Willemet M, Alastruey J (2015)A benchmark study of numerical schemes for one-dimensionalarterial blood flow modelling. Int J Numer Method Biomed Eng.31(10). https://doi.org/10.1002/cnm.2732
Calvo Aguilar D (2013) Caracterización mecánica de injertos de aortaascendente de Dacron(r)
Cebral JR, VazquezM, SforzaDM,HouzeauxG, Tateshima S, ScrivanoE, Bleise C, Lylyk P, Putman CM (2015) Analysis of hemody-namics and wall mechanics at sites of cerebral aneurysm rupture.J Neurointerv Surg 7:530–536
Chatzizisis YS, CoskunAU, JonasM, Edelman ER, FeldmanCL, StonePH (2007) Role of endothelial shear stress in the natural historyof coronary atherosclerosis and vascular remodeling: molecular,
cellular, and vascular behavior. J AmColl Cardiol [Internet]. [cited2014 Sep 2];49:2379–93. http://www.ncbi.nlm.nih.gov/pubmed/17599600
Chen WW, Gao H, Luo XY, Hill NA (2016) Study of cardiovascularfunction using a coupled left ventricle and systemic circulationmodel. J Biomech 49(12):2445–2454
Clough R, Holub O, Fok H, GaddumN, Alastruey J, Sinkus R (2015) Anewmethod for quantification of aortic stiffness in vivo usingmag-netic resonance elastography (MRE): a translational study fromsequence design to implementation in patients. J CardiovascMagnReson 17:1–2
Covas D, Stoianov I, Ramos H, Graham N, Maksimovic C (2004) Thedynamic effect of pipe-wall viscoelasticity in hydraulic transients.Part I–experimental analysis and creep characterization. J HydraulRes 42:517–532
Covas D, Stoianov I, Ramos H, Graham N, Maksimovic C, Butler D(2004) Water hammer in pressurized polyethylene pipes: concep-tual model and experimental analysis. Urban Water J 1:177–197
DancuMB,Tarbell JM (2007)Coronary endotheliumexpresses a patho-logic gene pattern compared to aortic endothelium: correlation ofasynchronous hemodynamics and pathology in vivo. Atheroscle-rosis [Internet]. [cited 2014 May 6];192:9–14. http://www.ncbi.nlm.nih.gov/pubmed/16806232
Demiray H (1997) Small but finite amplitude waves in a prestressedviscoelastic thin tube filled with an inviscid fluid. Int J Eng Sci35:353–363
Dormand JR, Prince PJ (1980) A family of embedded Runge–Kuttaformulae. J Comput Appl Math 6:19–26
Drozdov AD (1996) Finite elasticity and viscoelasticity. World Scien-tific, Singapore
Ellwein LM, Tran HT, Zapata C, Novak V, Olufsen MS (2008) Sen-sitivity analysis and model assessment: mathematical models forarterial blood flow and blood pressure. Cardiovasc Eng 8:94–108
Erbay HA, Erbay S, Dost S (1992) Wave propagation in fluid fillednonlinear viscoelastic tubes. Acta Mech 95:87–102
Frank AO, Walsh PW, Moore JE (2002) Computational fluid dynamicsand stent design. Artif Organs [Internet]. 26:614–21. http://www.ncbi.nlm.nih.gov/pubmed/22482657
FungY, FronekK, Patitucci P (1979) Pseudoelasticity of arteries and thechoice of its mathematical expression. Am J Physiol 237:H620–H631
García-Herrera CM, Celentano DJ (2013) Modelling and numericalsimulation of the human aortic arch under in vivo conditions.Biomech Model Mechanobiol 12:1143–1154
Garcia-Polite F, Martorell J, Del Rey-Puech P, Melgar-Lesmes P,O’Brien CC, Roquer J, Ois A, Principe A, Edelman ER, BalcellsM (2016) Pulsatility and high shear stress deteriorate barrier phe-notype in brain microvascular endothelium. J Cereb Blood FlowMetab [Internet]. 2016; 0271678X16672482. Available from:http://jcb.sagepub.com/lookup/doi/10.1177/0271678X16672482
Giusti A, Mainardi F (2016) A dynamic viscoelastic analogy for fluid-filled elastic tubes. Meccanica 51:2321–2330
Grigioni M, Daniele C, Morbiducci U, Del Gaudio C, D’Avenio G,BalducciA,BarbaroV (2005)Amathematical description of bloodspiral flow in vessels: application to a numerical study of flow inarterial bending. J Biomech 38:1375–1386
Guala A, Camporeale C, Tosello F, Canuto C, Ridolfi L (2015) Mod-elling and subject-specific validation of the heart-arterial treesystem. Ann Biomed Eng 43:222–237
He H, Yao K, NieWP,Wang Z, Liang Q, Shu C, Dardik A (2015) Mod-ified Petticoat technique with pre-placement of a distal bare stentimproves early aortic remodeling after complicated acute Stanfordtype B aortic dissection. Eur J Vasc Endovasc Surg 50:450–459
Holzapfel GA, Ogden RW (2010) Constitutive modelling of arteries.Proc R Soc A Math Phys Eng Sci 466:1551–1597
123
602 J. Menacho et al.
Holzapfel GA, Gasser TC, Ogden RW (2000) A new constitutiveframework for arterial wall mechanics and a comparative studyof material models. J Elast 61:1–48
Jiang J, Baik K, Leighton TG (2011) Acoustic attenuation, phase andgroup velocities in liquid-filled pipes II: simulation for spalla-tion neutron sources and planetary exploration. J Acoust Soc Am130:695
Keener JP, Sneyd J (2009) Mathematical physiology. Springer, NewYork
Kudryashov NA, Chernyavskii IL (2006) Nonlinear waves in fluid flowthrough a viscoelastic tube. Fluid Dyn 41:49–62
Kundu A, Adhikari S, Friswell MI (2015) Transient response anal-ysis of randomly parametrized finite element systems based onapproximate balanced reduction. Comput Methods Appl MechEng 285:542–570
Lagarias JC, Reeds JA, Wright MH, Wright PE (1998) Convergenceproperties of theNelder–Mead simplexmethod in low dimensions.SIAM J Optim 9:112–147
Li YS, Haga JH, Chien S (2005) Molecular basis of the effects of shearstress on vascular endothelial cells. J Biomech 38:1949–1971
Liu G, Li S, Li Y, Chen H (2013) Vibration analysis of pipelines witharbitrary branches by absorbing transfer matrix method. J SoundVib 332:6519–6536
Mahata K, Mousavi S, Söderström T (2006) On the estimation ofcomplex modulus and Poisson’s ratio using longitudinal waveexperiments. Mech Syst Signal Process 20:2080–2094
Mahomed A, Hukins DWL, Kukureka SN (2015) Effect of acceleratedaging on the viscoelastic properties of a medical grade silicone.Biomed Mater Eng 25:415–423
Manning TS, Shykoff BE, Izzo JL (2002) Validity and reliability ofdiastolic pulse contour analysis (Windkessel model) in humans.Hypertension 39:963–968
Martin BA, Reymond P, Novy J, Baledent O, Stergiopulos N (2012)A coupled hydrodynamic model of the cardiovascular and cere-brospinal fluid system. AJP Hear Circ Physiol 302:H1492–H1509
Martorell J, Santomá P, Kolandaivelu K, Kolachalama VB, Melgar-Lesmes P, Molins JJ, Garcia L, Edelman ER, Balcells M (2014)Extent of flow recirculation governs expression of atheroscleroticand thrombotic biomarkers in arterial bifurcations.Cardiovasc Res[Internet]. [cited 2014 Oct 25];103:37–46. http://www.ncbi.nlm.nih.gov/pubmed/24841070
Martorell J, Santomá P, Molins JJ, García-Granada AA, BeaJA, Edelman ER, Balcells M (2012) Engineered arte-rial models to correlate blood flow to tissue biologicalresponse. Ann N Y Acad Sci [Internet]. [cited 2014 Oct25];1254:51–6. http://www.pubmedcentral.nih.gov/articlerender.fcgi?artid=3342771&tool=pmcentrez&rendertype=abstract
Masson I, Beaussier H, Boutouyrie P, Laurent S, Humphrey JD, Zidi M(2011)Carotid arterymechanical properties and stresses quantifiedusing in vivo data from normotensive and hypertensive humans.Biomech Model Mechanobiol 10:867–882
Meniconi S, Brunone B, Ferrante M (2012) Water-hammer pressurewaves interaction at cross-section changes in series in viscoelasticpipes. J Fluids Struct 33:44–58
Moireau P, Xiao N, Astorino M, Figueroa C a, Chapelle D, Taylor Ca, Gerbeau JF (2012) External tissue support and fluid-structuresimulation in blood flows. Biomech Model Mechanobiol 11:1–18
Moodie TB, Mainardi F, Tait RJ (1985) Pressure pulses in fluid filleddistensible tubes. Meccanica 20:33–37
Morbiducci U, Ponzini R, Grigioni M, Redaelli A (2007) Helical flowas fluid dynamic signature for atherogenesis risk in aortocoronarybypass. J Biomech 40:519–534
OlufsenM, NadimA (2004) On deriving lumpedmodels for blood flowand pressure in the systemic arteries. Math Biosci Eng 1:61–80
Olufsen MS, Peskin CS, Kim WY, Pedersen EM, Nadim A, LarsenJ (2000) Numerical simulation and experimental validation of
blood flow in arteries with structured-tree outflow conditions. AnnBiomed Eng 28:1281–1299
O’Rourke M (1990) Arterial stiffness, systolic blood pressure, and log-ical treatment of arterial hypertension. Hypertension [Internet].[cited 2014 Jul 22];15:339–347. http://hyper.ahajournals.org/cgi/doi/10.1161/01.HYP.15.4.339
Pellicer M, Solà-Morales J (in press) Optimal scalar products in theMoore-Gibson- thompson equation, evolution equations and con-trol theory
Pérez Zerpa JM, Canelas A, Sensale B, Bia Santana D, Armentano RL(2015) Modeling the arterial wall mechanics using a novel high-order viscoelastic fractional element. Appl Math Model 39:4767–4780
PezzingaG (2002) Unsteady flow in hydraulic networks with polymericadditional pipe. J Hydraul Eng 128:238–244
Pezzinga G, Scandura P (1995) Unsteady flow in installations withpolymeric additional pipe. J Hydraul Eng 121:802–811
Pezzinga G, Brunone B, Cannizzaro D, Ferrante M, Meniconi S, BerniA (2014) Two-dimensional features of viscoelastic models of pipetransients. J Hydraul Eng 140:4014036
PezzingaG, Brunone B,Meniconi S (2016) Relevance of pipe period onKelvin–Voigt viscoelastic parameters: 1D and 2D inverse transientanalysis. J Hydraul Eng 142:1–12
Qureshi MU, Vaughan GDa, Sainsbury C, Johnson M, Peskin CS,Olufsen MS, Hill N a (2014) Numerical simulation of blood flowand pressure drop in the pulmonary arterial and venous circulation.Biomech Model Mechanobiol 13:1137–1154
Renner J, Maleki S, Nilsson SFE, Kihlberg J, Bjo HM (2012) Charac-terization of shear-sensitive genes in the normal rat aorta identifiesHand2 as a major flow-responsive transcription factor. PloS one7(12):e5222
Richter Y, Edelman ER (2006) Cardiology is flow. Circulation [Inter-net]. [cited 2014 May 6];113:2679–82. http://www.ncbi.nlm.nih.gov/pubmed/16769924
Richter Y, Groothuis A, Seifert P, Edelman ER (2004) Dynamic flowalterations dictate leukocyte adhesion and response to endovascu-lar interventions. J Clin Invest [Internet]. 113:1607–1614. http://www.jci.org/articles/view/21007
Saucez P, Wouwer AV, Schiesser WE, Zegeling P (2004) Method oflines study of nonlinear dispersive waves. J Comput Appl Math168:413–423
Schulze-Bauer CAJ, Holzapfel GA (2003) Determination of constitu-tive equations for human arteries from clinical data. J Biomech36:165–169
Segers P, Stergiopulos N, Westerhof N, Wouters P, Kolh P, VerdonckP (2003) Systematic and pulmonary hemodynamics assessed witha lumped-parameter heart-arterial interaction model. J Eng Math47:185–199
Smoljkic M, Vander Sloten J, Segers P, Famaey N (2015) Non-invasive,energy-based assessment of patient-specific material properties ofarterial tissue. Biomech Model Mechanobiol 14(5):1045–1056
Sokolis DP (2013) Experimental investigation and constitutive model-ing of the 3D histomechanical properties of vein tissue. BiomechModel Mechanobiol 12:431–451
Stålhand J (2009)Determination of human arterialwall parameters fromclinical data. Biomech Model Mechanobiol 8:141–148
Tsanas A, Goulermas JY, Vartela V, Tsiapras D, Theodorakis G, FisherAC, Sfirakis P (2009) The Windkessel model revisited : a qualita-tive analysis of the circulatory system.Med Eng Phys 31:581–588
Valdez-Jasso D, Banks HT, Haider Ma, Bia D, Zocalo Y, ArmentanoRL, Olufsen MS (2009) Viscoelastic models for passive arterialwall dynamics. Adv Appl Math Mech 1:151–165
Wang X, Fullana J-M, Lagrée P-Y (2015) Verification and comparisonof four numerical schemes for a 1D viscoelastic blood flowmodel.Comput Methods Biomech Biomed Eng 18:1704–1725
123

Arterial pulse attenuation prediction using the decaying rate of a pressure. . . 603
Wang X-F, Nishi S, Matsikawa M, Ghigo A, Lagrée P-Y, Fullana J-M (2016) Fluid friction and wall viscosity of the 1D blood flowmodel. J Biomech 49:565–571
Warda H, Kandil H, Elmiligui A, Wahba E (2001) Modeling pres-sure transients in viscoelastic pipes. In: Emerging technologiesfor fluids, structures and fluid-structure interaction—ASME pres-sure vessels and piping conference. Atlanta: ASME–PVPDivisionSeries
WillemetM,Alastruey J (2015)Arterial pressure andflowwave analysisusing time-domain 1-D hemodynamics. AnnBiomed Eng 43:190–206
123