article affordances and limitations of learning analytics...
TRANSCRIPT
Article
Affordances and limitations of learning analytics for computerassisted language learning: a case study of the VITAL project
Gelan, Anouk, Fastre, Fastre, Verjans, Martine, Martin, Niels, Jansenswillen, Gert, Creemers, Mathijs, Lieben, Jonas and Thomas, Michael
Available at http://clok.uclan.ac.uk/21289/
Gelan, Anouk, Fastre, Fastre, Verjans, Martine, Martin, Niels, Jansenswillen, Gert, Creemers, Mathijs, Lieben, Jonas and Thomas, Michael ORCID: 0000000164514439 (2018) Affordances and limitations of learning analytics for computerassisted language learning: a case study of the VITAL project. Computer Assisted Language Learning . pp. 126. ISSN 09588221
It is advisable to refer to the publisher’s version if you intend to cite from the work./10.1080/09588221.2017.1418382
For more information about UCLan’s research in this area go to http://www.uclan.ac.uk/researchgroups/ and search for <name of research Group>.
For information about Research generally at UCLan please go to http://www.uclan.ac.uk/research/
All outputs in CLoK are protected by Intellectual Property Rights law, includingCopyright law. Copyright, IPR and Moral Rights for the works on this site are retained by the individual authors and/or other copyright owners. Terms and conditions for use of this material are defined in the http://clok.uclan.ac.uk/policies/
CLoKCentral Lancashire online Knowledgewww.clok.uclan.ac.uk

1
Affordances and Limitations of Learning Analytics for Computer-Assisted
Language Learning: A Case Study of the VITAL Project
Gelan, Anouk - Hasselt University - Center Applied Linguistics, Hasselt, Belgium
Fastré, Greet - Hasselt University - Specific Teacher Education, Hasselt, Belgium
Verjans, Martine - Hasselt University - Center Applied Linguistics, Hasselt, Belgium
Martin, Niels - Hasselt University - Business Informatics, Hasselt, Belgium
Janssenswillen, Gert - Hasselt University - Business Informatics, Hasselt, Belgium
Creemers, Mathijs - Hasselt University - Business Informatics, Hasselt, Belgium
Lieben, Jonas - Hasselt University - Business Informatics, Hasselt, Belgium
Depaire, Benoît - Hasselt University - Business Informatics, Hasselt, Belgium
Thomas, Michael - University of Central Lancashire, Preston, UK
Corresponding author: Gelan, Anouk - Hasselt University - Center Applied Linguistics,
[email protected], +32 11 26 86 60

2
Affordances and Limitations of Learning Analytics for Computer-Assisted
Language Learning: A Case Study of the VITAL Project
Abstract
Learning analytics (LA) has emerged as a field that offers promising new ways to support
failing or weaker students, prevent drop-out and aid retention. However, other research suggests
that large datasets of learner activity can be used to understand online learning behaviour and
improve pedagogy. While the use of LA in language learning has received little attention to
date, available research suggests that understanding language learner behaviour could provide
valuable insights into task design for instructors and materials designers, as well as help
students with effective learning strategies and personalised learning pathways. This paper first
discusses previous research in the field of language learning and teaching based on learner
tracking and the specific affordances of LA for CALL, as well as its inherent limitations and
challenges. The second part of the paper analyses data arising from the European Commission
(EC) funded VITAL project that adopted a bottom-up pedagogical approach to LA and
implemented learner activity tracking in different blended or distance learning settings.
Referring to data arising from 285 undergraduate students on a Business French course at
Hasselt University which used a flipped classroom design, statistical and process-mining
techniques were applied to map and visualise actual uses of online learning resources over the
course of one semester.
Results suggested that most students planned their self-study sessions in accordance with the
flipped classroom design, both in terms of their timing of online activity and selection of
contents. Other metrics measuring active online engagement – a crucial component of
successful flipped learning - indicated significant differences between successful and non-
successful students. Meaningful learner patterns were revealed in the data, visualising students’
paths through the online learning environment and uses of the different activity types. The
research implied that valuable insights for instructors, course designers and students can be
acquired based on the tracking and analysis of language learner data and the use of visualisation
and process-mining tools.
Keywords: blended learning; flipped learning; learning analytics; learning dashboards; learning
patterns; self-regulated learning; tracking data
3
Introduction
Although many Higher Education Institutions (HEI) have embraced the use of instructional
technologies and recognised their potential for education, they still do not have a detailed
picture of their students’ uses of the technologies and their learning habits. While 87% of
participants surveyed by the European University Association (EUA) in a study on “E-
learning in European Higher Education”, viewed e-learning1 as a catalyst for change in
teaching methods, there was no consensus about its specific pedagogical merits (Gaebel,
2014). After three decades of e-learning research, it is clear however that an understanding of
the concrete learning behaviour involved in the use of e-courseware and online resources is an
important prerequisite of assessing the quality of autonomous online learning.
High drop-out rates associated with e-learning, for which different degrees of learner
autonomy are often required, remains a challenge for Higher and Continuing Education. From
the perspective of the students, not knowing how well they or their peers are progressing can
contribute to a lack of engagement and motivation, two of the most frequently cited factors
explaining course failure or drop-out (Hart, 2012; Kelly, 2009). Indeed, students involved in
e-learning often have a limited knowledge of their own learning habits and tend to overrate
the effort they spend on learning in online environments. To succeed in autonomous learning,
however, a high level of self-regulation is required, as is an awareness of how their own
qualities and shortcomings can help them to overcome potential hurdles and improve their
planning and monitoring skills (Butler & Winne, 1995). Learning Analytics (LA) may be
useful in this respect as techniques have recently been developed to collect, store and analyse
large amounts of data that in previous stages in the history of e-learning would have been
impossible due to technical limitations.
LA is most often defined as “the measurement, collection, analysis and reporting of data
about learners in their context, for purposes of understanding and optimizing learning and the
environment in which it occurs” (Long, Siemens, Conole, & Gasevic, 2011). Whereas past
educational research relied to a large extent on students’ self-reported data about how they
learn in self-study or small-scale observation studies, the recent evolution of web-based
learning involving automatic data collection of entire student cohorts has made it easier to
track students’ online behaviour. By recording a learner’s digital footprint in online learning
environments, patterns in their learning habits can be identified which may be of didactic
value to support staff, instructors, and students themselves.
Learning Analytics needs to be distinguished from two other related domains: Academic
Analytics and Educational Data Mining (EDM). Academic Analytics is the application of
business intelligence in education and emphasizes the political and economic challenge of
improving learning at institutional, regional, and international levels (Ferguson, 2012; Long &
Siemens, 2011), whereas LA focuses on the educational challenge and the learning process
(which includes analysing the relationship between learner, content, institution, and
instructor) (Long & Siemens, 2011). EDM is a field with a strong data-driven foundation and
although it has always had a strong emphasis on learning and teaching, it is focused on the
4
technical challenge of extracting value from big sets of learning-related data (Ferguson,
2012).
To inform and improve educational practice, key researchers have underlined the need for LA
to be rooted in research on learning and teaching (Gašević, Dawson, & Siemens, 2015).
Beginning with the design phase of LA projects, it is crucial to select data and indicators that
are pedagogically meaningful to students and instructors. Indeed, several past LA projects
have ultimately led to limited pedagogically informed feedback and actionable outputs (e.g.
identifying a pedagogical intervention based on specific gaps in students’ knowledge) when
LA was implemented with other objectives in mind, such as detecting underperforming
students at risk of dropping out (Gaşević, Dawson, & Siemens, 2015). When informed about
the pedagogical design of the learning context under analysis, LA has the potential to deliver
useful feedback to students, instructors and course designers (Nguyen, Rienties & Toetenel,
2017). As Colpaert (2016) puts it, LA can help to validate the design hypothesis of the
learning environment by comparing what instructors intended with what learners actually did.
Turning to the research literature in more detail, the first section of this paper describes how
previous LA techniques and objectives have been used in the past to inform language teaching
and research based on a ‘small data’ approach and how ‘big data’ and LA can contribute to
computer-assisted language learning (CALL) in the future. In this respect, some important
constraints and challenges associated with LA are discussed. The second section introduces
the European Commission (EC)-funded VITAL project, describing the way it approached
several of the identified affordances and challenges of LA, prior to analysing research
findings from Hasselt University, the project’s coordinator. The paper concludes with a
description of VITAL’s future research agenda, linking this to trends in the wider field of LA
in CALL.
Affordances of Learning Analytics for Computer-Assisted Language Learning
Previous CALL Studies that tracked Learner Behaviour
While the use of Learning Analytics for CALL is relatively new, learner tracking data,
whether script-based or collected by means of screen recording software, has been used for
several decades to answer specific research questions in the field of second language learning
(Fischer, 2007, 2012; Hwu, 2013). A study by Debski (2003) which analysed 91 CALL
research articles published between 1980–2000 in seven English language journals found that
the use of computer-based tracking methods evolved from 0% in 1984-1988 to 25 % in 1990-
1994 and 15.94 % in 1996-2000; the other main methods were questionnaire/survey (36.23
%), document examination (34.78 %), interview, observation, think aloud protocols, and
language tests.
When considering the collection and analysis of learner tracking data, it is important to
distinguish between human-human interactions via the computer (e.g., Computer-Mediated
5
Communication (CMC)) and Human-Computer Interactions (HCI) (e.g., mouse clicks,
keystrokes, and all entries made by a learner) (Chun, 2013; Fischer, 2012). When the
computer is used as a tool or tutor for learning, artefacts created by learners interacting with
each other can be analysed to inform second language acquisition. For example, computer
logs of human-computer interactions reflecting a learner’s actions in a dedicated learning
program include a lot of diverse data about the use of tools and resources (Fischer, 2012).
According to Fischer (2007), this kind of “empirical evidence in support of the value of
pedagogical features built into CALL programs […] is fundamental to the advancement of
knowledge in the field of CALL” (p. 414).
Most examples of CALL studies that have collected learner-tracking data concern glossary
use for reading comprehension and vocabulary retention. In those cases, the words clicked by
students, the numbers of clicks, and other keyboard activities, were automatically logged.
Student behavioural data such as time on task and navigation patterns could be derived from
the raw data (Hwu, 2013) and the effect of the glossary consultation behaviour was checked
against vocabulary or reading competence (Chun & Payne, 2004; Hulstijn, 2000; Laufer,
2000; Lomicka, 1998). Indeed, even if human-computer interactions were often reported
quantitatively (e.g., how many lookups, time spent, etc.), the clicking and typing behaviour
could also be analysed with a view to identifying online learning strategies and navigational
patterns (Chun, 2013). In some cases, the tracking data were combined with other data
collection methods such as screen recording, think aloud protocols or self-reporting
questionnaires for a more fine-grained overview of the learning process.
CALL researchers’ preoccupation with tracking actual learning behaviour often resulted from
the observation that learners did not use the instructional material as intended by the course
developer or instructor (Chapelle, 1989; Chun, 2013; Fischer, 2007). In task-based language
teaching, for example, researchers have examined the difference between the task-as-
workplan (the lesson plan outlining how the instructor intended the students to complete a
series of tasks), versus the task-as-process (the way students actually completed the tasks)
(Samuda & Bygate, 2008). To ascertain to what extent students use desirable strategies while
learning, researchers have found new strategies to observe students’ actual learning behaviour
(Chapelle, 1989; Hegelheimer & Chapelle, 2000), particularly as the use of student
questionnaires alone was not a reliable source of information (Fischer, 2012). Computer-
documented data indicating the processes through which learners complete a task were found
to deliver the most reliable basis for empirical evidence for hypotheses from Second
Language Acquisition (SLA), such as the noticing hypothesis or most effective types of
learner feedback (Hegelheimer & Chapelle, 2000).
A pilot-study on a Spanish language course (Hwu, 2003), for example, reported on how
learning data extracted from a Learning Management System (LMS) tracking system enabled
the researchers to understand the extent to which learner behaviour diverged from the
instructor's or program designer's intentions. It also led to the identification of learning
patterns for a small group of students based on the resources used and their order of use.
These patterns correlated strongly with students’ knowledge gain through post-test scores and
some of the variables (e.g., hits on explanation pages) also had predictive power for learning
6
outcomes. Fischer’s analysis of CALL research using tracking data (2012), however,
concludes that there is so far little evidence for the relation between specific program uses and
student performance. Ma (2013) confirms that an effective tracking system could prove to be
useful for understanding CALL contexts but further research is needed to identify how key
user actions are associated with learning outcomes.
While tracking technologies have shown potential in previous CALL research, a surprisingly
large portion of studies still do not report on tracking data to any great extent (Chun, 2013).
Among the reasons cited to explain this situation is the fact that the data were not very
accessible and the collection, processing and interpretation of data in non-CMC learning
environments was very time-consuming or required a lot of technical resources (Fischer,
2007, 2012). Supporting instructors and course designers to collect and process behavioural
data arising from CALL contexts will require the development of more intuitive and easy-to-
use tools as well as a wider variety of relevant functions.
The Potential of LA for CALL
The recent emphasis on ‘big data’ and the renewed interest in behavioural data may provide
new opportunities for CALL researchers to investigate the uses of language learning resources
based on larger language learners datasets and data mining techniques. To date however
Educational Data Mining has typically been dominated by computer scientists (Dawson,
Gasevic, Siemens, & Joksimovic, 2014), and it has only gradually shifted to a focus on
pedagogy to understand and improve learning (Ferguson, 2012; Gašević et al., 2015).
Recent publications on LA for CALL (Hwu, 2013; Yu & Zhao, 2015) underline the research
potential of online student behaviour data to lead to more accurate quantitative analysis since
modern tracking technologies allow for data collection on all subjects (and not just a sample)
in real (rather than experimental) learning situations. Since learners are not always aware of
the data collection taking place, more spontaneous and authentic learning behaviour can be
observed on a larger scale. Research on these data can provide researchers with new insights
into learning behaviour by making invisible data patterns more transparent. An important
aspect of big data for language learning, then, is the possibility of automatically collecting and
analysing large learner corpora of student artefacts on a more significant scale and carrying
out error analysis or discourse analysis (the latter lying within the scope of ‘social learning
discourse analytics’) on these corpora or analysing relationships between students, instructors
and resources in online social learning networks, e.g. participant roles in online discussions
(typically referred to as ‘social learning network analytics’) (Ferguson & Buckingham Shum,
2012).
Big data also offer possibilities for the personalisation of learning (NMC, 2015; Twyman,
2014) through the recommendation of learning tasks and resources based on a learner’s
distinctive behavioural profile (Yu & Zhao, 2015). As a learner completes a series of tasks,
his/her profile is distilled and continuously updated from former learning progress and
performance data, e.g., on speaking or writing assignments. For this to work, a bottom-up
approach focused on the interests of the learner as the main driving force is important. In the
7
context of Intelligent CALL, E-Tutor, a web-based tutorial program designed for L2 learners
of German developed by Heift (2013), is a good example of how the collection and analysis
of student data could benefit students in this way. The program keeps track of a learner’s
performance and provides comparative views of past users’ performance averages. It provides
error-specific and context-sensitive feedback to the student based on a learner corpus of 5,000
previous users. As part of a continuous cycle, the newly generated data allow for further
research and a data-driven evaluation of the tools.
When implementing LA, results from the data analysis can be disseminated to educational
stakeholders in the form of dashboards. LA dashboards can be defined as a visualised and
intuitive display of data for the purpose of supporting improvements in student learning and
performance (Yoo, Lee, Jo, & Park, 2015). Indeed, when capturing and storing huge amounts
of data from students, it is important that students profit from this process and that they
acquire access to their own data. For students to become self-regulated learners, they should
become responsible for their own learning as soon as possible (Nieweg, 2004). Since
beginner-level students are often unable to take full responsibility for their own learning and
development, external feedback on their performance and progress may be used to support
them in acquiring the necessary skills to monitor their own learning (Fastré, van der Klink,
Sluijsmans, & van Merriënboer, 2013).
Based on the research presented above, it is clear that LA offers potentially new perspectives
on CALL research and practice. On the other hand, arising from an understanding of the
history of language learning technologies and the overly optimistic tone that has often been
adopted, it is also important to consider the limitations and challenges linked to using LA for
CALL.
Challenges to using LA in CALL
As Yu and Zhao (2015) have argued, LA is still in its early stages and a range of
improvements are necessary if it is to have a more sustained impact on CALL. These include
developing a more fine-grained approach to data collection that is relevant to pedagogical
design (e.g., navigation patterns, interaction intensity, links to external resources, glossary use
(Hwu, 2013)), and easier data aggregation techniques need to consider the importance of
learner activities inside as well as outside the typical LMS environments. Moreover, the use
of learning standards could contribute to a more effective collection and platform-independent
comparison of educational data. The call by Hwu and Tzseng (2013) for the creation of a
‘Standard Taxonomy Interface’ or specification by the CALL community based on all
previously defined research questions answered with tracking data is very interesting in this
sense. Such a standard could trigger developments in the educational technology industry for
tracking APIs2 and the creation of tools for analysis that are more accessible to researchers
without a technical background.
In the same way as the use of technology in education has increased the need for new digital
skills for instructors (Godwin-Jones, 2015), they will also need clear guidelines on how to
extract and interpret meaningful information from educational data and how to design
8
appropriate interventions (Yu & Zhao, 2015). A recent study by Herodotou et al. (2017) tested
the actual use of predictive LA data by 240 teachers at the OU-UK in 10 distance learning
modules and found that teachers reacted in diverse ways to the availability of predictions
flagging students at risk. Most of them engaged irregularly and infrequently with the
predictive data and many struggled to find ways to undertake interventions and provide
support to students. The implementation of LA might also be hindered by instructors’
resistance to change, perceived extra workload (Macfadyen & Dawson, 2012) or wariness of
systematic data logging if perceived as a control or surveillance mechanism rather than as a
tool for greater pedagogical support.
The same equally applies to students who may be misled by the simplicity of visualisation
tools that reduce the complexity of their learning process to the number of times they log into
an LMS, access the library or use specific resources (Yu & Zhao, 2015). Indeed, in many
language-learning contexts, the online language learning components for which learning data
can be collected represent only a part of a more complex and heterogeneous learning process.
In this respect, Greller and Drachsler (2012) strongly emphasise that “data not included in the
respective LA approach, is equally if not more important than the dataset that is included. To
judge a learner’s performance merely on, e.g., LMS quantitative data, is like looking at a
single puzzle piece” (p. 52).
Finally, it is vital that everyone involved in learning analytics is aware of the potential for
unethical misuse. As an example, a student’s profile based on her online use of the learning
tools should not lead to implicit or explicit discrimination (Slade & Prinsloo, 2013), e.g.,
influencing the summative evaluation by her teacher or any other unequal treatment. A New
Media Consortium (NCM) Horizon report (2015) warns that more work is needed to structure
appropriate policies to protect student privacy and there is a growing concern that ethical and
privacy considerations are not advancing as quickly as LA practice.
When implementing LA, it is therefore important to plan ahead in terms of the data collection
process and to be guided from the beginning by a framework that combines ethical uses of
learning data with the protection of individuals’ privacy (Yu & Zhao, 2015, Hegelheimer &
Chapelle, 2000). All stakeholders involved in and concerned by the LA process, not only
students and instructors but also all actors at an institutional level, should be considered in all
phases. One of the crucial ethical principles of implementing LA “is that higher education
institutions should be transparent regarding the purposes for which data will be used and
under which conditions, who will have access to data and the measures through which
individuals’ identity will be protected” (Slade & Prinsloo, 2013) (p. 14). Indeed, the literature
review by Sclater (2016) of the ethical and legal issues that educational institutions may
encounter in their deployment of LA, underlines the need for institutions to create trust by
pre-empting such concerns by protecting privacy and subscribing to clear principles about the
ethical uses of data.
The VITAL Project: A Case Study of Learning Analytics in CALL

9
Background
The EC Erasmus+ VITAL project (Visualisation Tools and Analytics to monitor Online
Language Learning & Teaching) took place between October 2015 and September 2017 and
was established to investigate the application of LA to CALL. Focused on 4 different
language and mathematics blended or distance learning courses from Hasselt University in
Belgium, the University of Central Lancashire in the United Kingdom and the University of
Amsterdam in the Netherlands, VITAL explored the use of a bottom-up LA approach starting
from the perspective of the learning process.
The data subjects in the project were HE students and instructors and students were the main
data clients (Greller & Drachsler, 2012). The focus was on the uses of the courses and the
students’ learning trails inside the courses. Based on an exploratory and descriptive research
design that made use of process mining techniques, VITAL measured real uses of
instructional contents by groups of students in the partner universities and investigated
learning patterns and indicators of successful or less successful learning behaviour.
The aim was to explore how empirical data about students’ behaviour could help to verify the
findings in the literature, namely, that a) students do not always use instructional materials as
intended by the course designers or instructors, and b) that instructions are needed to inform
students – and especially students at the start of their studies – about effective learning
strategies.
Methodology
A tracking design for each of the courses was produced to describe both the technical aspects
of logging student activities in the learning platforms and the pedagogical priorities for the
selection of most relevant indicators of online learning engagement. This process was further
informed by an international needs analysis carried out among students and instructors.
To enable cross-platform compatibility and comparative analysis across the three institutions
a common format for the learning data was needed. The project chose the new Experience
API specification because of possible interoperability with other learning environments (e.g.,
mobile apps, games) and reporting tools. The Experience API (or xAPI, formerly known as
Tin Can API) is a new e-learning specification considered as the new generation of Scorm,
developed by ADL (Advanced Distributed Learning, US ministry of Defense) and Rustici
software. It provides an interoperable data model for storing data about students’ learning
experience and an API for sharing data among systems for learning and analysis. All kinds of
formal and informal learning tools, inside or independent of an LMS, that are xAPI
compatible can send information about the learning experience to a Learning Record Store
(LRS), either synchronously or asynchronously. An LRS is a central data warehouse that can
receive, store and share learning data with other learning environments or reporting and data
visualisation tools (Del Blanco, Serrano, Freire, Martinez-Ortiz, & Fernandez, 2013) for more
flexible analysis and comparison. Learning activities are recorded as activity statements
consisting of a standardised format: <actor> <verb> <object> (with <result> in <context>),

10
e.g., learner x completed exercise a (with result 80%); learner y posted comment b (in
discussion thread i, in reply to learner z). The verbs and objects thus enable a wide range of
learning actions and objects to be identified and coded.
The use of this new specification thus enabled the collection of fine-grained data that could be
combined into indicators of students’ engagement with the contents and functionalities of the
learning tools at course level. The availability and granularity of data goes beyond the scope
of data usually collected by universities using an LMS.
To anticipate ethical and legal issues that could hinder the execution of the LA project, an
action plan was established that clearly described the ethical and legal aspects of collecting,
analysing and reporting on student learning data and communicated to each university’s legal
department. This action plan was based on JISC’s3 code of practice (Sclater, 2016) and
compliant with the EU data protection directive.
In the main project phases, learner data from 4 student cohorts in the 3 universities (Hasselt,
Central Lancashire, and Amsterdam) were collected during one full semester lasting
approximately 12 weeks. These anonymised learning data were collected in a central
repository, an open source Learning Record store called ‘Learning Locker’, and exported for
analysis.
The results reported in this paper derive from the data analysis of a single course at Hasselt
University during semester 1 of 2016-2017 entitled, ‘Economisch & Zakelijk Frans 1’/
‘Business French 1’, which was part of the curriculum of 5 different study programs in the
faculty of Business Economics: 1st BA and 2 BA Applied Economics (TEW), 2nd BA
Commercial Sciences (HW), 2nd BA Business Engineering (BI) and 2nd BA Commercial
Engineering (HI). Following a flipped classroom design, the course consisted of two thirds
(57 hours) of individual self-study with one third (24 hours) of F2F sessions (‘werkzittingen’).
The flipped classroom is referred to as in the Bischop & Verleger (2013) definition of ”an
educational technique that consists of two parts: interactive group learning activities inside the
classroom, and direct computer-based individual instruction outside the classroom” (p. 5).
The activities that “traditionally have taken place in the classroom, now take place outside the
classroom and vice versa” (Lage, Platt & Tregua, 2000, p 32) and students are required “to
complete assigned activities prior to attending class (i.e. face-to-face sessions with the
instructor)” (Jovanovic et al., 2017a, p. 1). Central to this idea is that students prepare for
class autonomously and actively to acquire basic knowledge and skills, to be prepared to
engage actively in the class activities.
Outside class Inside class
Can be automated through computer
technology
Requires human interaction
Individual self-study using instructional e-
learning modules
Collaborative learning in the form of Q&A
sessions or learning conversations
(‘responsiecolleges’) and
working sessions (‘werkzittingen’)
Teacher-centered Student-centered
11
practice exercises
theory pages
dictionary
automatic correction & feedback
simulations
role-play
discussion
presentations
performance feedback by coach
Receptive and reproductive skills using LSP
vocabulary in various communicative
situations (oral + written), frequent
grammatical structures of Business French,
discursive elements and cultural
characteristics influencing communication)
Elaborate course contents, develop correct
communicative competence, practise free
production (transfer), intonation &
pronunciation, discursive elements (nuances,
connectors, negotiation), register, non-verbal
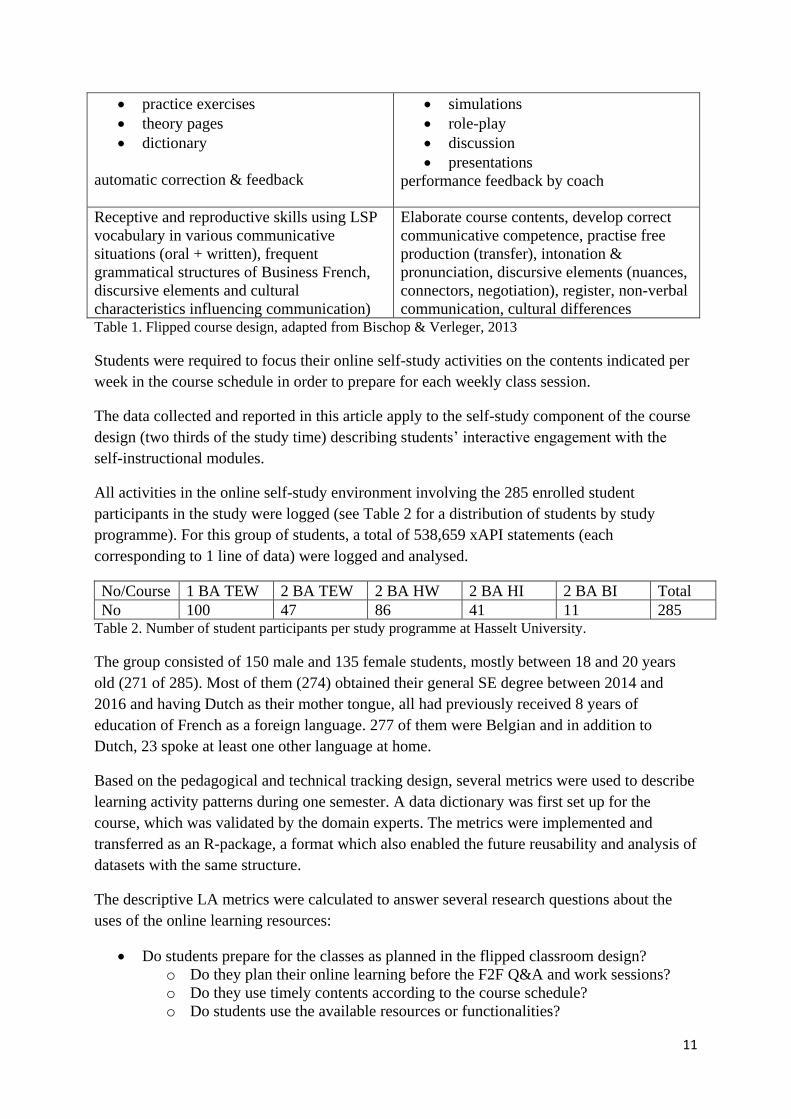
communication, cultural differences Table 1. Flipped course design, adapted from Bischop & Verleger, 2013
Students were required to focus their online self-study activities on the contents indicated per
week in the course schedule in order to prepare for each weekly class session.
The data collected and reported in this article apply to the self-study component of the course
design (two thirds of the study time) describing students’ interactive engagement with the
self-instructional modules.
All activities in the online self-study environment involving the 285 enrolled student
participants in the study were logged (see Table 2 for a distribution of students by study
programme). For this group of students, a total of 538,659 xAPI statements (each
corresponding to 1 line of data) were logged and analysed.
No/Course 1 BA TEW 2 BA TEW 2 BA HW 2 BA HI 2 BA BI Total
No 100 47 86 41 11 285 Table 2. Number of student participants per study programme at Hasselt University.
The group consisted of 150 male and 135 female students, mostly between 18 and 20 years
old (271 of 285). Most of them (274) obtained their general SE degree between 2014 and
2016 and having Dutch as their mother tongue, all had previously received 8 years of
education of French as a foreign language. 277 of them were Belgian and in addition to
Dutch, 23 spoke at least one other language at home.
Based on the pedagogical and technical tracking design, several metrics were used to describe
learning activity patterns during one semester. A data dictionary was first set up for the
course, which was validated by the domain experts. The metrics were implemented and
transferred as an R-package, a format which also enabled the future reusability and analysis of
datasets with the same structure.
The descriptive LA metrics were calculated to answer several research questions about the
uses of the online learning resources:
Do students prepare for the classes as planned in the flipped classroom design?
o Do they plan their online learning before the F2F Q&A and work sessions?
o Do they use timely contents according to the course schedule?
o Do students use the available resources or functionalities?

12
o Do successful students display different patterns of engagement with the
resources than non-successful students?.
Which activity types do students use most and how do they navigate between these
activity types?
Examples of indicators included number of sessions4, duration of sessions, timeliness of
sessions, comparison of sessions with course schedule, performance summaries per exercise,
average scaled score per exercise, evolution of scores per exercise, exercise and theory page
duration, number or takes and retakes of exercises and theory pages, exercise-to-theory and
theory-to-exercise navigation, use of audio files, use of the recording feature and number of
lookups in the dictionary application.
To answer the research questions, the metrics calculated on the activity log dataset were
combined with course metadata and class schedules as well as students’ demographic and
academic performance data (such as examination scores).
Findings and Discussion
In the following, results are described and discussed based on a selection of descriptive LA
metrics analysed for the course and the part of the process-mining analysis that focused on the
students’ use and order of use of different activity types.
Descriptive LA metrics
A ‘timeliness of sessions’ function implemented in R checked each session for which chapter
was accessed to determine whether this corresponded to the content planned in the course
schedule. The course’s main chapter levels ‘Media’ (by phone), ‘Knowledge of culture’, ‘In
the margin of commercial transactions’ (informal and formal communication, appointments,
first F2F contacts), ‘Company presentation’ and ‘Media’ (by letter and mail) were chosen to
represent the chronological order of contents students had to follow in order to prepare for the
classes. When the visited chapter corresponded to the course schedule, the session was
labelled ‘on time’, if not, it was labelled ‘too late’. Sessions that were separated by more than
two weeks from the course schedule were ignored by default in order to avoid including
activities that took place during the examination period as sessions labelled ‘too late’.
The results indicated that a large majority of the students focused on the chapters scheduled
for a particular week in preparation for their classes. By relating the timeliness of sessions to
students’ examination scores, it was observed that the relative frequency of ‘on time’ sessions
was slightly higher for students who succeeded in the course (obtained at least half of the
marks on the oral examination) (85.11%) than for students who failed (82.1%). The relative
frequency of ‘too late’ sessions was slightly lower for passing students (9.11%) than for
failing students (11%). This observation held for students from all five study programmes. A
significant difference was found for the timeliness of sessions when comparing successful and
non-successful students, 𝜒2(2, 𝑁 = 3917) = 6.7945, 𝑝 = 0.03347.
13
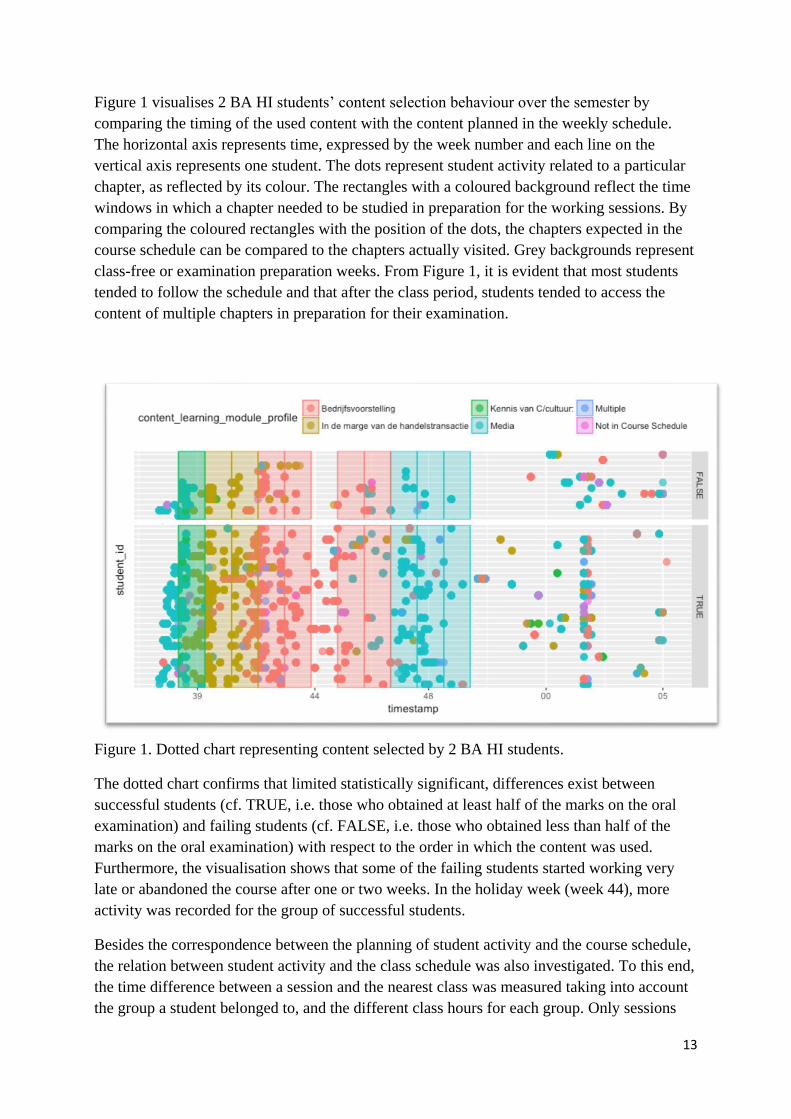
Figure 1 visualises 2 BA HI students’ content selection behaviour over the semester by
comparing the timing of the used content with the content planned in the weekly schedule.
The horizontal axis represents time, expressed by the week number and each line on the
vertical axis represents one student. The dots represent student activity related to a particular
chapter, as reflected by its colour. The rectangles with a coloured background reflect the time
windows in which a chapter needed to be studied in preparation for the working sessions. By
comparing the coloured rectangles with the position of the dots, the chapters expected in the
course schedule can be compared to the chapters actually visited. Grey backgrounds represent
class-free or examination preparation weeks. From Figure 1, it is evident that most students
tended to follow the schedule and that after the class period, students tended to access the
content of multiple chapters in preparation for their examination.
Figure 1. Dotted chart representing content selected by 2 BA HI students.
The dotted chart confirms that limited statistically significant, differences exist between
successful students (cf. TRUE, i.e. those who obtained at least half of the marks on the oral
examination) and failing students (cf. FALSE, i.e. those who obtained less than half of the
marks on the oral examination) with respect to the order in which the content was used.
Furthermore, the visualisation shows that some of the failing students started working very
late or abandoned the course after one or two weeks. In the holiday week (week 44), more
activity was recorded for the group of successful students.
Besides the correspondence between the planning of student activity and the course schedule,
the relation between student activity and the class schedule was also investigated. To this end,
the time difference between a session and the nearest class was measured taking into account
the group a student belonged to, and the different class hours for each group. Only sessions

14
within 14 days of a class were considered. When the obtained time difference was negative, it
meant that the session took place before a class.
As shown in Figure 2, there was a clear peak in student activity before classes, most notably
the day before a class (1,296 sessions) and the day of the class itself (1,360 sessions); results
represent all 5 study programmes.
Figure 2. Student activity compared to timing of classes.
The time difference between student activity and classes was not found to be statistically
different for students who passed the oral examination than for students who didn’t (Z = 6322,
p = 0.2078).
Starting from the theoretical assumption that students being prepared for the interactive group
learning activities in class is crucial for the success of a flipped learning design, it is clear that
these different metrics provide interesting opportunities to monitor and evaluate students’
state of preparedness. Detailed information on the timing and planning of activities was
obtained showing that students adapted their behaviour well to the flipped classroom principle
of the course by preparing actively for the classes. A qualitatively selective use of contents
and clear peaks of online engagement could be observed following characteristics of the
course design. This finding corresponds with former LA research indicating that instructors’
design decisions strongly influence and steer students’ online engagement. Research by
Rienties and Toetenel (2016) linked the learning designs of 151 modules of the Open
University UK with LMS engagement, satisfaction and retention and tested empirically that

15
learning design can explain and strongly predict learner behaviour and outcomes in blended
and distance learning environments. The design of weekly learning design activities also
significantly predicted LMS engagement in a study on 74 first-level undergraduate modules at
the OU, explaining up to 69% of variation, and assessment activities were associated with
more time spent in the online learning platform (Nguyen, Rienties, Toetenel, Ferguson &
Whitelock, 2017). Rogers et al. (2016) even suggest LA visualisations can reflect the learning
design and be used to evaluate the instructors’ expectations concerning their students’
learning activity. The presented visualisations indeed reflect the flipped learning design of the
course and by aggregating the data to specific student profiles or by week, deviations from the
expected flow can help to flag students potentially at risk or disengagement for specific
course contents.
To answer the question about real uses of resources and functionalities, several other
indicators to measure online engagement in the course were analysed and the behaviour of
students passing and those failing for the course was compared. Since the data were not
normally distributed for each of the variables, the non-parametric Wilcoxon t-test was used.
A first measure of online engagement is the number of times students log in to the online
learning platform and start a learning session during one semester4. Successful students
undertook significantly more online sessions (M=32.65, SD=17.41) than non-successful
students (M=23.13, SD=15.03), Z = 6652, p < 0.001, showing higher regularity in interacting
with the online self-study material.
The total time spent on the platform was also markedly longer for successful students. On
average, they worked 1695.04 minutes (SD=1067.64), compared to 1127.62 minutes
(SD=888,34) for non-successful students, Z = 6534, p < 0.001.
Considering the course’s focus on interactive exercises with automatic correction, actions on
exercises were a second important indicator of online engagement. A distinction is made
between attempts on exercises (exercises include up to 3 attempts within one take) and
completed exercises. When a student completes an exercise, a score for his or her final
attempt is presented together with the correct answers, contrasted to the student’s most recent
input. Successful students appeared to have attempted ánd completed more exercises. On
average, they attempted more exercises (M=435.2, SD=324.78) than non-successful students
(M=235.4, SD=253.29), Z = 5560, p < 0.001) and they also completed more exercises
(M=376.8, SD=314.66 vs. M=195.3, SD=215.59; Z = 5654, p < 0.001). The average scaled
and average raw scores obtained for exercises however did not correlate with final exam
scores.
Third, for students who passed their oral examination, more audio plays were registered,
indicating higher engagements with listening practise in the online platform. The number of
audio plays for non-successful students amounted to 321.2 on average (SD=356.98), while the
mean was 570.9 (SD=511.53) for successful students, Z = 5788, p < 0.001. Speaking
activities including recording one’s own voice appeared to be a functionality underused by the
students and among the few students who did use it, no significant differences between

16
successful and non-successful students could be observed.
Finally, successful students were found to revisit both exercises and theory pages more
frequently. On average, they retook 269.59 exercises (SD=297.27) and 51.5 theory pages
(SD=37.01). Conversely, non-successful students only retook 153.45 exercises (SD=217.99)
and 42.91 theory pages (SD=42.54). While the difference for exercises was statistically
significant (Z = 5987, p < 0.001), it was not for theory pages (Z = 7085, p = 0.002). It should
be noted that the learning platform allows students to print theory pages (pdf view), a
functionality that was used quite frequently by students (average of 20.12 prints per student).
These findings illustrate how new tracking technologies allow to calculate more fine-grained
metrics about online engagement selected specifically for their relevance in the pedagogical
context of the course under analysis. This focused approach to data collection called for by
(Hwu, 2013) can indeed provide valuable insights for CALL materials designers and
instructors. Much more detailed data about students’ behaviour in the online learning
environment than the kind of data traditionally available through typical LMS trace data
collection could be analysed. Moreover, the various measurements of online engagement
could be linked to study success. We can therefore conclude that in contrast with previous
CALL research (Chapelle, 1989; Chun, 2013; Fischer, 2007), most students did use the online
learning material as planned in this flipped classroom design and engaged in online learning
so as to be prepared for taking an active role in the group sessions. Bivariate Pearson
correlations of .29 to .38 (significant at the 0.01 level) between the variables and the oral
examination result confirmed that more online engagement correlated positively with study
success.
Process-mining analysis
To gain more insight into the order in which students performed learning activity types,
visualisations were created using Disco5. Figure 3 reveals the order in which students
executed different types of learning activities during a learning session and which navigation
patterns between activity types they followed. It shows that most sessions started with an
exercise (4,159 sessions),8 indicating that most students used the learning module following
an inductive approach, as they started to practise and used the direct link to the related theory
page when they felt the need to. In contrast, 920 sessions started with a theory page. The
deductive approach (start by studying the theory and practise per theme clicking through to
the related exercises) was thus less frequent. Finally, 11 sessions started with an interaction
with the dictionary application. The numbers in the boxes indicate the number of times that
this learning activity type took place, while the number between brackets indicates the
number of sessions to which they were related. For instance, 74,198 exercises were opened in
4,632 sessions (on average 16 exercises per session) and 16,762 theory pages in 3,278
sessions (around 5 per session).

17
Figure 3. Process mining visualisation expressing the order of activity types in a learning
session.
The rectangles in Figure 3 with the darkest colours reflect the most used activity types. The
numbers on the full arrows indicate the number of times a transfer was made between two
learning activity types. For instance, an exercise was followed by a theory page on 6,076
occasions and this occurred in 2,452 sessions. When a box is connected with itself, this
indicates that a learning activity of a particular type was followed by another learning activity
of the same type. The thickness of the exercise arrow illustrates that the most frequent
navigation went from one exercise to another. Most students tended to open exercise after
exercise and follow the didactic progression (possibly skipping items however). Navigating
from one to another theory page happened only about one sixth of the time when students
navigated from an exercise to another exercise. This corresponded to the proportion of the two
activity types in the course design. Even though students had the choice in the learning
environment to either start practising and visit theory links whenever needed or rather start to
study the theory and use practicing exercises directly linked to that theory, most students
appeared to follow the inductive exercise-to-exercise and exercise-to-theory navigation
through the course. Students visited the dictionary mostly when they were doing exercises
(525 times) as opposed to 56 times when they were studying a theory page. They usually
returned to an exercise after looking up a word in the dictionary. Finally, Figure 3 shows that
students most often stopped a session after doing an exercise (3,467 times), or after a theory
page (1,584 times).
The LA metrics provided additional quantitative insights into the navigation patterns of
different student groups. Comparing the different study programs, the exercise-to-theory
strategy (i.e. students take up the suggestion to view the related theory) was used a lot on

18
average by 2nd BA Business Engineering students (45.36 times) and 2nd BA Applied
Economics students (45.26), and the least by 1st BA Applied Economics students (36.89).
Table 3 shows that the exercise-to-theory pattern was applied much more by successful
students than by non-successful students for all programs, except for the 2nd BA students
(Applied Economics).
1 BA TEW* 2 BA TEW 2 BA HW 2 BA HI* 2 BA BI*
M SD M SD M SD M SD M SD
pass 44.37 31.05 45.88 24.44 47.34 28.55 50.10 31.18 52.11 29.93
fail 33.21 31.01 44.14 27.96 37.74 30.16 23.6 27.87 15 7.07
N 91 39 78 39 11 Table 3. Exercise-to-theory navigation by successful and non-successful students, per study
programme.
* Difference between passing and failing students is significant.
Comparing first-year to second-year students, the mean difference noted for this learning
strategy was non-significant; Z = 8200, p=0.075) but the opposite strategy, theory to learning,
was; Z = 10806, p < 0.04). No other significant differences between first-year and second-
year students could however be found for the indicators measuring online engagement
described above. The hypothesis that students new to the flipped learning model use
suboptimal learning strategies (Jovanovic et al., 2017) could therefore not be confirmed.
These results confirm that descriptive LA metrics and process-mining analysis can indeed
offer empirical evidence to support CALL design (Fischer, 2007) with a view to identifying
meaningful online learning strategies and navigational patterns (Chun, 2013). They help to
understand how students approach and manage their learning in a flipped learning model
requiring much autonomy and self-regulation (Jovanovic et al., 2017). In relation to the first
research question (whether the students used online learning resources as planned in the
flipped classroom design), the processes reflected by the behavioural data of Hasselt
University students corresponded to the work plan and objectives of the learning design
(Bygate & Samuda, 2008). By comparing learners’ actual learning behaviour with the course
design, the design hypothesis of the flipped learning course could thereby be validated
(Colpaert, 2016). Differences in online behaviour were observed between groups of students.
Comparing the learning behaviour of successful and non-successful students, it is clear that,
as indicated by earlier research (Fischer 2012; Hwu, 2013), it is important to train certain
learners to become more efficient users of learning tools. Previous research has demonstrated
that training students in advance on the intended use of the learning resources appeared not to
be sufficient (Hwu, 2013). Therefore, using objective data monitoring students’ behaviour and
showing it to them early in the course can be an important new method to incentivise students
displaying poor performance in order to modify their learning patterns. At the same time, the
data may also indicate to instructors which instructional activities need to be improved to
make the learning process more effective.
Preliminary process-mining analysis has been successfully applied to map which activity
types students used most and which navigation patterns in the learning module could be

19
identified. It is possible to carry out process mining analysis at lower levels of aggregation,
for example, by looking at specific contents and their order of use. However, students’
navigation options in the learning modules were so diverse that the process model quickly
gets overly complex and challenging to interpret. Consequently, targeted research questions
should guide the analyses at a lower level of granularity (Hwu & Tzseng, 2013) so that deeper
insights into learner patterns of successful and non-successful students can be obtained.
It is important to state that there are limits as to what the behavioural data can reveal about the
actual learning process, since cognitive processes can only be derived from behaviour. As
Fischer (2007, p. 430) put it, we ‘should not use tracking in isolation because while it clearly
shows what students do, it does not explain why they do what they do’ [emphasis added].
Former LA research has shown that basic LMS trace data such as number of clicks or time
spent in the platform had limited power to predict study success (Tempelaar, Rienties &
Giesbers, 2015; Gaşević et al., 2015) and could explain only a limited proportion of the
variability in academic performance. A combination of many other indicators e.g. referring to
formative assessment data, more static data such as prior knowledge or learning disposition
data as well as more sophisticated and timely tracking data from various sources would be
required for more accurate predictive models (Tempelaar et al., 2015).
However, building a model to predict learner success was not the objective of the current
exploratory study. By collecting and analysing fine-grained tracking data informative of the
diverse elements of course design and by linking these to contextual course and student
metadata it was possible to compare learning strategies and patterns of successful and non-
successful students and to identify correlations between variables (what is happening?) rather
than identify the specific causes of learning success (why does something happen?). This new
knowledge offered insights that can support decisions in educational practice and research
(Mayer-Schönberger & Cukier, 2014) but may not fully supplant the role of the teacher in
interpreting them in the context of a particular learning environment. This kind of actionable
feedback supports educational practice from different perspectives including the optimisation
of the course design, adaptation of teaching and coaching of students according to their
observed online learning progress and performance and providing students with monitoring
tools and tips in support of their self-regulation skills as autonomous online learners. As
Jovanovic et al. (2017b) put it, patterns of learning behaviour and learning strategies can
inform instructors about the effectiveness of the flipped learning design and its’ ability to
keep students engaged and to prepare them for active participation in class. Students can be
incentivised to become more aware of their learning strategies and adapt their learning
accordingly. In this respect, the research outputs informed the development of accessible
learning dashboards by the VITAL project visualising online learning behaviour to students
and their instructors and providing recommendations informed by the learning behaviour of
former successful students.

20
Conclusions and Future Research
While this paper began by demonstrating that the basic principle of collecting and analysing
learner tracking data is not new in CALL research, it is evident that new possibilities linked
with the field of learning analytics have emerged as a result of the recent interest in ‘big data’.
Affordances emerge in the fields of data collection, processing and storage as well as data
analysis and interpretation, pattern detection and the visualisation of learning. Several ways in
which LA can contribute to research and practices in the field of language learning and
teaching have been described, including new empirical methods for quantitative research that
allow for greater insights into autonomous learning processes, the collection and analysis of
large learner corpora, the personalisation of learning and learning dashboards.
Several constraints and challenges linked to LA have also been identified, such as ethical and
legal issues. The VITAL project addressed this challenge by elaborating a plan of action that
involved identifying and communicating a clear strategy on ethics with all stakeholders from
the commencement of the project.
The research has contributed to the field by demonstrating how modern tracking technologies
based on the new Experience API specification and the availability of entire cohorts’ learning
data, have led to more accurate quantitative analysis of online language learning behaviour
(Hwu, 2013; Yu & Zhao, 2015). The statistical and process-mining analysis of these data
helped to answer important research questions related to the flipped learning design. It
revealed that the majority of the students did use the online learning resources as suggested by
the course designers in terms of how they planned and timed their online learning and used
available resources to prepare for the class activities. By linking online learning behaviour to
learning outcomes, patterns of successful and non-successful students could be compared
(Ma, 2012). Successful students’ learning behaviour characterised by more active online
engagement, expressed in particular through significantly more learning sessions throughout
the semester, more ‘on time’ sessions planned towards the class and content schedule, more
total time spent in the platform, more attempted and completed practising exercises, more
played audio files, more retaking of exercises, more clicking-through to theory references
depending on the study program. These indicators have proven their value for the
measurement of active preparation for in-class activities in the flipped learning design. Other
results further indicated that the voice-recording feature for practising speaking skills was
used much less than expected and that the exercise-to-theory navigation was the most frequent
pattern of learning behaviour. Differences between study programmes could be observed but
no significant differences between 1st and 2nd year students could be identified..
The project and its’ exploratory research design have delivered concrete examples of how the
analysis of pedagogically informed trace data and interpretation in the context of the specific
course can lead to actionable feedback directly of use to educational practise. Incentivising
less active students to modify their learning patterns already in the course of the semester is
only one example of possible pedagogical interventions. Learning dashboards have been
implemented in the Business French courses to share the feedback obtained with students and
instructors. They generate visualisations from the analysed past semester datasets but also
from live data of current and future student cohorts.

21
Many paths for further research have been opened. New datasets of student cohorts have been
and are being collected and will help to refine and consolidate the findings for the current
datasets.
Future research will investigate how the dashboards are being used and to what extent
learners and instructors will be able to use them effectively to monitor and adapt their
progress and performance/undertake pedagogical interventions early in the course.
Results from preliminary cluster analysis (not reported) performed on the data to identify
student profiles will be further analysed. Sequence analysis will be applied to study learner
patterns into more detail. When different clusters of students can be identified based on
students’ behaviour in the online learning environment, cluster-specific recommendations and
process feedback can also be formulated (Tempelaar, Rienties &Nguyen, 2017; Jovanovic et
al., 2017) and shared with students and instructors. This information can help to refine the
feedback currently provided by the learning dashboards.
It is clear that the data available through the tracking of students’ online learning behaviour
allow to evaluate only part of the flipped learning design and can not cover the entire learning
process. Further research aims to add additional data from qualitative methods such as
instructor assessment data specifically targeting performance on class-learning activities per
student. One interesting research challenge is to compare the instructors’ in-class study
success predictions per student to predictive models based on the online learning indicators
and new indicators such as dashboard use.
Last but not least, the VITAL project aims to initiate the development of a generic xAPI
specification based model for implementing LA in other interactive language learning tools.
Such a model could be reused in different educational settings, countries, and courses.
Returning to the Hwu and Tzseng (2013) plea for the creation of a ‘Standard Taxonomy
Interface’ or specification to be used by the CALL community, VITAL encourages CALL
researchers to support the development of an ‘xAPI recipe’ or profile describing the tracking
vocabulary specific to the domain of language learning pedagogy. In this way, it could evolve
towards an LA model developed by a community of practice committed to using standardised
datasets to answer CALL research questions. To aid this process, the xAPI recipe, as well as
all technologies, models, R code, reports, guidelines, and recommendations used in the
project, are available for download under open licenses on the VITAL project website
(http://www.project-vital.eu/).
The VITAL project has been funded with support from the European Commission (Project
number: 2015-BE02-KA203-012317). The information in this research reflects the views only
of the authors, and the Commission cannot be held responsible for any use which may be
made of the information contained therein.
Notes
22
1. We use the term e-learning as in Gaebel (2014) who defines it as “a generic expression for all
learning involving the use of information and communication technologies (ICT) to support both
learning and teaching (p. 17).” When used in combination with face-to-face settings (and on-
campus teaching) the term ‘blended learning’ is used; when used to serve geographically distant
learners who do not have access to traditional classroom education, we use the term ‘distance
learning’. In the same study, online learning is defined as ‘a form of educational delivery in
which learning takes place primarily via the Internet” (p. 17). It includes distance learning and
blended learning.
2. Application Programming Interface, “term broadly used throughout the software industry. It
generally refers to a standard library of programming functions that software developers can use
to integrate two or more separate software applications.”, https://www.adlnet.gov/adl-
research/performance-tracking-analysis/experience-api/xapi-architecture-overview/, retrieved on
12-08-2017
3. JISC is the UK’s higher education, further education and skills sectors’ not-for-profit
organisation for digital services and solutions
4. A session typically starts with a login activity and ends with a logout activity, closing of the
window or session timeout (after one hour of inactivity). It is used as an important unit of
analysis generally representing a coherent sequence of learning activities by a student.
5. Disco is a commercial closed-source process-mining tool, but offers academic licenses for
academic research and education. The software can be downloaded at https://fluxicon.com/disco.
6. After importing the dataset, two sliders in the software determine how much detail is shown in
the obtained process model: a path slider and an activity slider. To ensure a good understanding
of the process models, the path slider is set to 0% and the activities slider on 50%. However, this
implies that the visualisations will not cover all behaviour available in the dataset. Consequently,
when numbers are mentioned in the remainder of the discussion of the visualisations, it is
recommended to focus the interpretation on their relative order of magnitude instead of on the
absolute numbers.
References
Bishop, J. L., and Verleger, M. A., The flipped classroom: A survey of the research, Paper presented at
the 120th American Society for Engineering Education Annual Conference and Exposition,
Atlanta, GA, 2013.
Butler, D. L., & Winne, P. H. (1995). Feedback and Self-Regulated Learning: A Theoretical
Synthesis. Review of Educational Research, 65(3), 245-281.
doi:10.3102/00346543065003245

23
Bygate, M., & Samuda, V. (2008). Tasks in Second Language Learning. London: Palgrave.
Chapelle, C. (1989). Student's Strategies with Learner-Controlled CALL. CALICO Journal, 7(2), 25-
47. doi:10.1558/cj.v7i2.25-47
Chun, D. M. (2013). Contributions of Tracking User Behavior to SLA Research (Vol. Learner-
Computer Interaction in Language Education: A Festschrift in Honor of Robert Fischer):
CALICO journal.
Chun, D. M., & Payne, J. S. (2004). What makes students click: working memory and look-up
behavior. System, 32(4), 481-503. doi:http://dx.doi.org/10.1016/j.system.2004.09.008
Colpaert, J. (2016). Big content in an Educational Engineering Approach. Journal of Technology and
Chinese Language Teaching, 7(1), 1-14.
Dawson, S., Gasevic, D., Siemens, G., & Joksimovic, S. (2014). Current state and future trends: a
citation network analysis of the learning analytics field. Paper presented at the Proceedings of
the Fourth International Conference on Learning Analytics And Knowledge, Indianapolis,
Indiana, USA.
Debski, R. (2003). Analysis of research in CALL (1980–2000) with a reflection on CALL as an
academic discipline. ReCALL, 15(2), 177–188. doi:10.1017/S0958344003000429
Del Blanco, A., Serrano, A., Freire, M., Martinez-Ortiz, I., & Fernandez, M., B.. (2013, 13-15 March
2013). E-Learning standards and learning analytics. Can data collection be improved by
using standard data models? Paper presented at the Global Engineering Education Conference
(EDUCON), 2013 IEEE.
Fastré, G. M. J., van der Klink, M. R., Sluijsmans, D., & van Merriënboer, J. J. G. (2013). Towards an
integrated model for developing sustainable assessment skills. Assessment & Evaluation in
Higher Education, 38(5), 611-630. doi:10.1080/02602938.2012.674484
Ferguson, R. (2012). Learning analytics: drivers, developments and challenges. Int. J. Technol.
Enhanc. Learn., 4(5/6), 304-317. doi:10.1504/ijtel.2012.051816
Fischer, R. (2007). How do we Know what Students are Actually Doing? Monitoring Students'
Behavior in CALL. Computer Assisted Language Learning, 20(5), 409-442.
doi:10.1080/09588220701746013
Fischer, R. (2012). Diversity in learner usage patterns Computer-Assisted Language Learning:
Cambridge University Press.
Gaebel, M., Kupriyanova, V., Morais, R., Colucci, E. (2014). E-learning in European Higher
Education Institutions. Retrieved from
Gašević, D., Dawson, S., & Siemens, G. (2015). Let’s not forget: Learning analytics are about
learning. TechTrends, 59(1), 64-71. doi:10.1007/s11528-014-0822-x
Godwin-Jones, R. (2015). The evolving roles of language teachers: Trained coders, local researchers,
global citizens. Language Learning & Technology, 19(1), 10-22.
Greller, W., & Drachsler, H. (2012). Translating Learning into Numbers: A Generic Framework for
Learning Analytics. Educational Technology & Society, 15(3), 42-57.
Hart, C. (2012). Factors Associated With Student Persistence in an Online Program of Study: A
Review of the Literature. Journal of Interactive Online Learning, 11(1).
Hegelheimer, V., & Chapelle, C. (2000). Methodological issues in research on learner-computer
interactions in call. Language Learning & Technology, 4(1), 41-59.
Heift, T. (2013). Clicking for Help. In P. Hubbard, Schulze, M., Smith, B. (Ed.), Learner-Computer
Interaction in Language Education (pp. 187-202).
Herodotou, C., Rienties, B., Boroowa, A., Zdrahal, Z., Hlosta, M., & Naydenova, G. (2017).
Implementing predictive learning analytics on a large scale: the teacher's perspective. Paper
presented at the Proceedings of the Seventh International Learning Analytics & Knowledge
Conference, Vancouver, British Columbia, Canada.
Hulstijn, J. H. (2000). The use of computer technology in experiomental studies of second language
acquisition: a survey of some techniques and some ongoing studies. Language Learning &
Technology, 3(2), 32-43.
Hwu, F. (2003). Learners' Behaviors in Computer-Based Input Activities Elicited Through Tracking
Technologies. Computer Assisted Language Learning, 16(1), 5-29.
doi:10.1076/call.16.1.5.15529

24
Hwu, F. (2013). A review of the use of script-based tracking in CALL research for data sharing:
applications providing meaning aids. Computer Assisted Language Learning, 26(4), 350-370.
doi:10.1080/09588221.2012.678010
Hwu, F., & Tzseng, C. (2013). Challenges and Directions of Script-Based Tracking in Tutorial CALL
(Vol. Learner-Computer Interaction in Language Education: A Festschrift in Honor of Robert
Fischer): CALICO Journal.
Jovanovic, J., Mirriahi, N., Pardo, A., Dawson, S., Gašević, D. (2017).. An Analytics-based
Framework to Support Teaching and Learning in a Flipped Classroom, In: From data and
analytics to the classroom: Translating learning analytics for teachers, Publisher: Routledge,
Oxon, UK, Editors: Jason Lodge, Jared Cooney Horvath, Linda Corrin
Jovanović, J., Gašević, D., Dawson, S., Pardo, A., Mirriahi, N. (2017). Learning analytics to unveil
learning strategiesin a flipped classroom. Internet and Higher Education 33, 74-85
DOI: 10.1016/j.iheduc.2017.02.001
Kelly, D. (2009). Modeling Best Practices in Web-Based Academic Development. In D. Roisin & M.
Fiona (Eds.), Applied E-Learning and E-Teaching in Higher Education (pp. 35-55). Hershey,
PA, USA: IGI Global.
Lage, M. J., Platt, G. J. and Treglia, M., (2000), Inverting the Classroom: A Gateway to Creating an
Inclusive Learning Environment, The Journal of Economic Education, 31, issue 1, p. 30-43,
https://EconPapers.repec.org/RePEc:taf:jeduce:v:31:y:2000:i:1:p:30-43.
Laufer, B. (2000). What lexical information do L2 learners select in a CALL dictionary and how does
it affect word retention? Language Learning & Technology, 3(2), 58-76.
Lomicka, L. (1998). "To gloss or not to gloss": An investigation of reading comprehension online.
Language Learning & Technology, 1(2), 41.
Long, P., & Siemens, G. (2011). Penetrating the Fog: Analytics in Learning and Education. Educause
Review, 46(5), 31-40.
Long, P., Siemens, G., Conole, G., & Gasevic, D. (2011). Proceedings of the 1st International
Conference on Learning Analytics and Knowledge (LAK11). Paper presented at the
International Conference on Learning Analytics and Knowledge (LAK11), Banff, AB,
Canada.
Ma, Q. (2013). Computer Assisted Vocabulary Learning: Framework and Tracking Users’ data (M. S.
P. Hubbard, B. Smith Ed.). San Marcos, TX.
Macfadyen, L. P., & Dawson, S. (2012). Numbers Are Not Enough. Why e-Learning Analytics Failed
to Inform an Institutional Strategic Plan. Educational Technology & Society, 15(3), 149–163.
Mayer-Schönberger, V., & Cukier, K. (2014). Learning With Big Data, The Future of Education.
Boston New York: Eamon Dolan/Houghton Mifflin Harcourt.
Nguyen, Q., Rienties, B., & Toetenel, L. (2017). Mixing and matching learning design and learning
analytics. In P. Zaphris & A. Ioannou (Eds.), Learning and Collaboration Technologies.
Technology in Education: 4th International Conference, LCT 2017, Held as Part of HCI
International 2017, Vancouver, BC, Canada, July 9-14, 2017, Proceedings, Part II (pp. 302-
316). Vancouver, Canada: Springer.
Nguyen, Q., Rienties, B., Toetenel, L., Ferguson, F., & Whitelock, D. (2017). Examining the designs
of computer-based assessment and its impact on student engagement, satisfaction, and pass
rates. Computers in Human Behavior, 76 (November 2017), 703-714. doi:
10.1016/j.chb.2017.03.028
Nieweg, M. R. (2004). Case study: innovative assessment and curriculum redesign. Assessment &
Evaluation in Higher Education, 29(2), 203-214. doi:10.1080/0260293042000188474
NMC. (2015). NMC Horizon Report, 2015 Higher Education Edition. Retrieved from
http://www.nmc.org/publication/nmc-horizon-report-2015-higher-education-edition/
Rienties, B., Toetenel, L. (2016). The impact of learning design on student behaviour, satisfaction
and performance: a cross-institutional comparison across 151 modules. Computers in Human
Behavior, 60, 333–341 doi:http://dx.doi.org/10.1016/j.chb.2016.02.074

25
Rogers, T., Dawson, S. & Gašević, D. (2016). Learning analytics and the imperative for theory-driven
research. In C. Haythornthwaite, R. Andrews & J. Fransman The SAGE Handbook of e-
learning Research (pp. 232-250). 55 City Road, London: SAGE Publications Ltd. doi:
10.4135/9781473955011.n12
Sclater, N. (2016). Developing a Code of Practice for Learning Analytics. Journal of Learning
Analytics, 3(1), 16-42.
Slade, S., & Prinsloo, P. (2013). Learning Analytics: Ethical issues and dilemmas. American
Behavioral Scientist, 57(10), 1510-1529.
Tempelaar, D. T., Rienties, B., & Giesbers, B. (2015). In search for the most informative data for
feedback generation: Learning Analytics in a data-rich context. Computers in Human
Behavior, 47, 157-167. doi: 10.1016/j.chb.2014.05.038
Tempelaar, D. T., Rienties, B., & Nguyen, Q. (2017). Towards actionable learning analytics using
dispositions. IEEE Transactions on Learning Technologies, 1(Jan-March 2017), 6-16. doi:
10.1109/TLT.2017.2662679
Twyman, J. (2014). Leveraging technology to accelerate school turnaround. San Francisco, CA:
WestEd.
Yoo, Y., Lee, H., Jo, I.-H., & Park, Y. (2015). Educational Dashboards for Smart Learning: Review of
Case Studies. In G. Chen, V. Kumar, Kinshuk, R. Huang, & C. S. Kong (Eds.), Emerging
Issues in Smart Learning (pp. 145-155). Berlin, Heidelberg: Springer Berlin Heidelberg.
Yu, Q., & Zhao, Y. (2015). The Value and Practice of Learning Analytics in Computer Assisted
Language Learning. Studies in Literature and Language, 10(2), 90-96. doi:10.3968/6529