article enhancing biopharmaceutical attributes of
TRANSCRIPT

Article
Enhancing Biopharmaceutical Attributes of Phospholipid Complex-loaded Nanostructured Lipidic Carriers of Mangiferin: Systematic Development, Characterization and Evaluation
Khurana, Rajneet Kaur, Bansal, Arvind, Beg, Sarwar, Burrow, Andrea Julie, Katare, O. P, Singh, Kamalinder K and Singh, Bhupinder
Available at http://clok.uclan.ac.uk/17291/
Khurana, Rajneet Kaur, Bansal, Arvind, Beg, Sarwar, Burrow, Andrea Julie, Katare, O. P, Singh, Kamalinder K ORCID: 0000-0001-7325-0711 and Singh, Bhupinder (2017) Enhancing Biopharmaceutical Attributes of Phospholipid Complex-loaded Nanostructured Lipidic Carriers of Mangiferin: Systematic Development, Characterization and Evaluation. International Journal of Pharmaceutics, 518 (1-2). pp. 289-306. ISSN 0378-5173
It is advisable to refer to the publisher’s version if you intend to cite from the work.http://dx.doi.org/10.1016/j.ijpharm.2016.12.044
For more information about UCLan’s research in this area go to http://www.uclan.ac.uk/researchgroups/ and search for <name of research Group>.
For information about Research generally at UCLan please go to http://www.uclan.ac.uk/research/
All outputs in CLoK are protected by Intellectual Property Rights law, includingCopyright law. Copyright, IPR and Moral Rights for the works on this site are retainedby the individual authors and/or other copyright owners. Terms and conditions for useof this material are defined in the policies page.
CLoKCentral Lancashire online Knowledgewww.clok.uclan.ac.uk

Enhancing Biopharmaceutical Attributes of Phospholipid Complex-loaded
Nanostructured Lipidic Carriers of Mangiferin: Systematic Development,
Characterization and Evaluation
Rajneet Kaur Khurana1, Arvind Bansal2, Sarwar Beg1, Andrea Julie Burrow3, OP
Katare1, Kamalinder K Singh3, Bhupinder Singh1,4*
1UGC Centre of Advanced Studies, University Institute of Pharmaceutical Sciences,
Panjab University, Chandigarh 160014, India 2Department of Pharmaceutics, National Institute of Pharmaceutical Education and
Research (NIPER), S.A.S. Nagar, Punjab 160062, India
3School of Pharmacy and Biomedical Sciences, University of Central Lancashire,
Preston, PR1 2HE, UK
4UGC- Centre of Excellence in Applications of Nanomaterials, Nanoparticles and
Nanocomposites (Biomedical Sciences), Panjab University, Chandigarh 160014, India
*To whom correspondence should be addressed
Professor Bhupinder Singh Bhoop
M Pharm, Ph D, D St
Chairman, University Institute of Pharmaceutical Sciences
Coordinator, UGC Centre of Advanced Studies
Coordinator, UGC Center for Excellence in Nano Applications
Panjab University, Chandigarh 160 014, India
E-mail: [email protected], [email protected]
+91 172 2534103, Fax: +91 172 2543101
Abstract

Mangiferin (Mgf), largely expressed out from the leaves and stem bark of Mango, is a
potent antioxidant. However, its in vivo activity gets tremendously reduced owing to
poor aqueous solubility and inconsistent gastrointestinal absorption, high hepatic
first-pass metabolism and high P-gp efflux. The current research work, therefore, was
undertaken to overcome the biopharmaceutical hiccups by developing the Mgf-
phospholipid complex (PLCs) loaded in nanostructured lipidic carriers (NLCs). The
PLCs and NLCs were prepared using refluxing, solvent evaporation and hot
emulsification technique, respectively with various molar ratios of Mgf and
Phospholipon 90 G, i.e., 1:1; 1:2; and 1:3. The complex was evaluated for various
physicochemical parameters like drug content (96.57%), aqueous solubility (25-fold
improved) and oil-water partition coefficient (10-fold enhanced). Diverse studies on
the prepared complex using FTIR, DSC, PXRD and SEM studies ratified the formation
of PLCs at 1:1 ratio. The PLCs were further incorporated onto NLCs, which were
systematically optimized employing a face centered cubic design (FCCD), while
evaluating for particle size, zeta potential, encapsulation efficiency and in vitro drug
release as the CQAs. Caco-2 cell line indicated insignificant cytotoxicity, and P-gp
efflux, bi-directional permeability model and in situ perfusion studies specified
enhanced intestinal permeation parameters. In vivo pharmacokinetic studies revealed
notable increase in the values of Cmax (4.7-fold) and AUC (2.1-fold), respectively, from
PLCs-loaded NLCs vis-à-vis Mgf solution. In a nutshell, the promising results
observed from the present research work signified boosted biopharmaceutical
potential of the optimized PLCs-loaded NLCs for potentially augmenting the
therapeutic efficacy of Mgf.

Keywords: QbD, antioxidants, phytomolecule, molecular docking, P-gp efflux, Caco-
2 bidirectional permeability assay, SPIP
1. Introduction
Of late, mangiferin (Mgf), a polyphenolic C-glycoside has been gaining enormous
recognition in pharmaceutical and food industries for its nutritional and
therapeutic values. It possesses several pharmacological activities like antioxidant
(Rodriguez et al., 2006), anti-inflammatory (Saha et al., 2016), anti-viral (Zheng and
Lu, 1990), analgesic (Dar et al., 2005), immunomodulatory (Leiro et al., 2004; Sarkar
et al., 2004), antidiabetic (Ojewole, 2005), besides other’s. Amongst all these, the
ability of Mgf to act as a potent antioxidant by scavenging free radicals is known
to be of immense importance for preventing the potential DNA damage (Zhang,
2013) and for inhibiting the growth of cancer cells by inducing cellular apoptosis
(Minglin et al., 2016; Takeda et al., 2016).
Despite being a potent phytomolecule, the use of Mgf is restricted due to its low
and variable oral bioavailability (about 1.5 to 5.0%), usually ascribed to its poor
aqueous solubility (0.1 to 0.3 mg/mL), low lipophilicity, high P-gp efflux,
considerable first-pass metabolism and cytochrome P-450 mediated metabolism in
gut enterocytes (Basheer and Kerem, 2015; Khurana et al., 2016). Besides, Mgf
display rapid clearance from the body via glucuronidation of the hydroxyl groups
present at position-6 and 7 of its xanthone moiety, which, in turn, tends to reduce
its potential antioxidant and anticancer activities, due to shorter half-life (van der
Merwe et al., 2011).

Mgf, till date, is marketed in the form of conventional tablets, along with other
antioxidants. However, such formulations exhibit limited fruition for potentiating the
desired therapeutic efficacy of Mgf owing to the aforementioned biopharmaceutical
hiccups. A score of formulation strategies including solid dispersions (Qin et al., 2014),
cyclodextrin inclusion complex (da Rocha Ferreira et al., 2013; Yang et al., 2013), crystal
engineering and salt formation (Teng and Wu, 2012), phospholipid complex (Ma et al.,
2014) and spray-dried encapsulation (Souza et al., 2013) have already been reported in
literature. These systems, however, have yielded limited improvement in the
biopharmaceutical attributes of Mgf, plausibly owing to mere improvement in
solubility and dissolution behavior. Keeping in view of the potential limitations of the
existing formulation techniques, the development of newer and more effective
formulation strategies for Mgf is highly called for.
The phospholipid systems, in this context, have lately been explored for enhancing
the biopharmaceutical performance and therapeutic efficacy of bioactives with poor
hydrophilicity and lipophilicity (Renukuntla et al., 2013). As phospholipids constitute
a major part of the bio-membrane, these hold good biocompatibility and act as a
carrier for delivering drugs across the biological barriers (Renukuntla et al., 2013). The
amphiphilic nature of phospholipids tends to provide enhanced solubility and
permeability of the drugs, thus improving their oral biopharmaceutical performance
(Pichot et al., 2013). Other stellar merits of phospholipidic formulations include ease
of preparation, along with high drug loading capacity and long-term stability. Several,
literature reports suggest that incorporation of drug-phospholipid complexes into the
nanostructured systems can further have remarkable increase in the

biopharmaceutical performance of the drugs (Singh et al., 2012; Rawat et al., 2013; Xia
et al., 2013).
The nanosystems composed of lipids not only enable the increased solubility and
bioavailability of less soluble drugs, but also augment release and permeability of
drugs, along with gastric protection against degradation from luminal enzymes
(Renukuntla et al., 2013). Indeed, nanocarriers such as lipid micelles (Neuberg et al.,
2015), solid lipid nanoparticles (Mukherjee et al., 2009; Bunjes, 2010), nanostructured
lipidic carriers (NLCs) (Khan et al., 2015) and lipid nanocapsules (Sánchez-Moreno et
al., 2012) have already been reported to hold immense promise for oral delivery of
poorly water-soluble bioactives. Amongst these nanocarriers, the NLCs are
considered to be of wider interest owing to their high drug-loading efficiency and
drug stability (Naseri et al., 2015; Shah et al., 2016). Accordingly, the current work on
the proposed novel technology was undertaken, wherein the PLCs of Mgf were
incorporated into NLCs, for further enhancing the biopharmaceutical attributes. The
nature of the intended research work on Mgf has not been reported in literature so far.
The present research work, therefore, involves the investigation of dual formulation
strategies involving the use of PLCs-loaded NLCs for improving the oral
bioavailability of Mgf. In this regard, PLCs were prepared and extensively
characterized through FTIR, DSC, PXRD, SEM, and molecular docking studies for
confirming the formation of complex. Further, intestinal absorption and permeability
studies on the developed formulations have been performed on Caco-2 bidirectional
assay model. Subsequently, intestinal perfusion studies and pharmacokinetic studies

were also performed on Sprague-Dawley (SD) rats for evaluating the improvement in
permeability, bioavailability and absorption parameters.
2. Materials and Methods
Mgf was provided ex-gratis by International Association on Mangiferin Research
(IAMR), Nanning, Guangxi, China. Phospholipon 90 G (PL) (soybean lecithin at 90%
of phosphatidylcholine) was provided as gift sample by M/s Phospholipon GmbH,
Germany. Labrafil M 2125 and Compritol 888 ATO were gifted by M/s Gattefosse,
Cedex, France. All the solvents were procured from Merk Pvt. Ltd., India.
2.1 Defining the quality target product profile (QTPP)
As per the Quality by Design (QbD)-based approach of product development, QTPP
was set-up not only for the development of NLCs of Mgf’s PLCs but for improving
the therapeutic performance for the patients benefit. The QTPP described for
formulating NLCs of Mgf, include key quality characteristics like, dosage form type,
nature, strength, route of administration, pharmacokinetic and stability requirements.
2.2 Determining critical quality attributes (CQAs)
Patient-centric CQAs include both physical and formulation attributes representing
the out-standing features of NLCs as the target drug product. Among the several
quality attributes, the prominent attributes critically influencing the product
performance were selected for the purpose. The selected CQAs include particle size
(i.e., essential for faster drug absorption), zeta potential (i.e., indicative of the stability
of drug product), entrapment efficiency (i.e., indicative of the drug loading potential)
and in vitro percent drug release (i.e., indicative of better absorption from
gastrointestinal milieu).

2.3 Molecular modelling and simulation studies
During complexation process, the role of the molecular modelling and simulation
studies is to analyse and confirm the potential interactions between Mgf and PL. Chem
Draw Ultra 12.0 software was utilized to draw the chemical structure of Mgf. Further,
ChemBio 3D Pro-12.0 software (M/s Cambridgesoft, Cambridge, USA) was employed
to generate the 3D model by minimizing the free energy. Docking studies were
conducted between Mgf and analogue of phospholipid in the human body, i.e.,
phosphatidylcholine transfer protein using MGL tool (Autodock software version
1.5.6) (M/s GNU General Public Licence, CA, USA). For this, protein data bank, i.e.,
PDB 1LN1 was employed. A grid box of center x, y, z = 46.358 Ǻ, 48.638 Ǻ and 19.7 Ǻ
was created around Mgf to wrap it completely (Lee et al., 2013).
2.4 Preparation of the Mangiferin’s Phospholipid Complex (PLCS)
Solvent-evaporation method was used for the preparation of PLCs as per the reported
procedure (Ma et al., 2014). Briefly, the required amount of Mgf and PL in the
stoichiometric ratio 1:1, 1:2 and 1:3 was dissolved in 100 mL of 80% ethanol by
magnetic stirring at room temperature. The mixture was refluxed at 60°C temperature
for 2 h. The ethanol was evaporated at reduced pressure using rotary flask evaporator
at 40 °C. The resultant complex was collected and stored under dried condition in
desiccators.
2.5 Characterization of the prepared PLCs
2.5.1 Drug content determination
The content of Mgf in the PLCs was determined by HPTLC method previously
reported by us (Khurana et al., 2016). Accurately amount of pure Mgf and PLCs (10
mg each), were solubilised in methanol, and diluted simultaneously in the mobile
phase before its application on the silica gel plate. Subsequently, densitometric
scanning of Mgf was performed at λmax of 262 nm at Camag TLC Scanner for
quantifying the drug content through already reported and validated method by us
(Khurana et al., 2016).
2.5.2 Solubility studies and partition coefficient
Excess of Mgf, physical mixture of Mgf and PL, and PLCs were dissolved in 5 mL of
water and n-octanol. Each experiment was conducted in triplicate with continuous
shaking in a shaker for 48 h. Further, centrifugation was performed at 10,000 rpm
(5,590 × g) for a period of 10 min. HPTLC was employed to analyse the supernatant
obtained after filtration (0.22 µm) after apt dilutions.
2.5.3 Powder X-Ray diffraction (PXRD)
The PXRD studies were carried out on Mgf, PL, physical mixture and PLCs, where the
diffraction patterns were recorded under ambient conditions on X-ray powder
diffractometer (D8 Advance, Bruker, Karlsruhe, Germany) using Cu Ka radiation
(=1.54 A˚) at 40 kV, 40 mA passed through nickel filter (Yang et al., 2013).
2.5.4 Differential scanning calorimetry analysis (DSC)
The DSC studies were carried out on 1-2 mg sample of Mgf, PL, their physical mixture,
PLCs and PLCs-NLCs by DSC Q20 (M/s TA Instruments, Detroit, USA) in crimped
aluminium pans, heated from 25 to 250 °C at a scanning rate of 10 °C/min (Ma et al.,
2014).

2.5.5 Fourier-transform infrared (FTIR) spectroscopy
FTIR spectra of Mgf, PL, their physical mixture, PLCs and PLCs-NLCs were obtained
using an FTIR-8300 spectrophotometer (Shimadzu, Japan) as per the procedure
reported by Beg and associates (Beg et al., 2016).
2.5.6 Scanning electron microscopy (SEM)
In order to have better conceptualization and visualization, SEM (JEM-2100F (M/s
Jeol, Tokyo, Japan) studies were performed on Mgf, PL, physical mixture and PLCs
with instrument named. Mgf, PL, physical mixture and PLCs were coated with gold
in a sputter coater and their surface morphology was viewed and photographed (Beg
et al., 2016).
2.6 Development of Nanostructured Lipidic Carriers (NLCs)
2.6.1 Risk assessment studies
To identify the possible critical material attributes (CMAs) and/or critical process
parameters (CPPs) affecting the critical quality attributes (CQAs), risk assessment
studies were carried out by constructing Ishikawa fish-bone diagram, to delineate the
potential cause-and-effect relationship among the product and process variables. Out
of this diagram, key material attributes (MAs)/process parameters (PPs) were
prioritized. Further, for qualitative analysis of low, medium and high-risk(s) related
with each MAs and PPs, the risk estimation matrix (REM) was built.
2.6.2 Screening of the lipids
Various solid and liquid lipids were screened on the basis of their suitability for Mgf.
Fixed quantity of the lipids were taken in the culture flasks and excess amount of Mgf
was added to them. The solid lipids were allowed to melt at 80 °C for 2 h using a

thermostatically controlled water bath (M/s Rivera, Mumbai, India). On the other
hand, the solubility studies for the liquid lipids were carried out at ambient
temperature. After 48 h, an aliquot (100 µL) of the lipids was taken from the
supernatant after centrifugation at 5,000 rpm (1,190 × g), suitably diluted in 7:3 ratio
mixtures of methanol and chloroform to solubilise Mgf, and filtered for analysis using
previously validated and reported HPTLC method at a λmax of 262 nm (Khurana et al.,
2016).
2.6.3 Preparation of the PLCs-NLCs
The NLCs were prepared by hot emulsification and ultrasonication method. The oil
phase, containing a mixture of solid and liquid lipids in the ratio of 90:10 and 70:30,
was heated up to 80°C, followed by addition of PLCs, and subsequently complete
solubilization in the molten lipid phase. Simultaneously, the aqueous phase
containing Tween 80 as surfactant and soy lecithin (50 mg) as stabilizer were mixed in
10 mL of water and heated up to the identical temperature (Zhao et al., 2013). The ratio
of lipid to aqueous phase was kept between 1:10. Using a Ultra-Turrax homogenizer
fixed at 10,000 rpm (5,590 × g), the aqueous phase was mixed with the lipid phase for
30 min. The formed emulsion was further ultra-sonicated using a probe sonicator. This
ultra fine dispersion containing NLCs was cooled down in an ice bath and stored until
use.
2.6.4 Systematic development of the NLCs employing FCCD
The most influential factors identified from REM were employed for systematic
optimization using face centered cubic design (FCCD). A total of thirteen formulations
were prepared as per the FCCD employing two factors, viz. solid lipid concentration

(X1) and surfactant concentration (X2) at three levels of each, including low (-1),
medium (0) and high (+1) levels with quintuplicate studies conducted for the center
point (0, 0) formulation. The CQAs selected for the prepared formulations include,
particle size, zeta potential, encapsulation efficiency and drug release.
2.7 Characterization of the prepared PLCs-NLCs
2.7.1 Particle size and zeta potential
For particle size, polydispersity index (PDI) and zeta potential measurement, the
NLCs prepared as per the experimental design were diluted 100-fold with distilled
water employing Zetasizer ZS 90 instrument (M/s Malvern Instruments,
Worcestershire, UK) based on dynamic light scattering technique.
2.7.2 Entrapment efficiency
As per the generated design matrix, entrapment efficiency of the NLCs-loaded with
PLCs was determined by centrifuging the dispersion at 10,000 rpm (5,590 × g). The
obtained pellet was made to digest by Triton-X-100 (0.1% w/v), followed by
ultrasonication for 15 min to completely remove the drug from nanostructured
systems (Zhao et al., 2013). Mgf was extracted in methanol and filtered (0.45 μm) to
obtain a fine dispersion. The amount of drug entrapped was quantified employing a
previously developed, validated and reported HPTLC method (Khurana et al., 2016).
Eq. 1 was employed to calculate the entrapment efficiency, as follows:
1002
21
D
DDefficiencyionEncapsulat … Eq. 1
where, D1; amount of drug added and D2; unentrapped drug
2.7.3 In vitro drug release studies
Dialysis bag method was employed to study in vitro drug release behaviour from
PLCs-NLCs, in 250 mL of 0.1 N HCl (pH 1.2) for first 2 h, followed by phosphate buffer
(pH 6.8) up to 24 h at 37±0.5 °C; 100 rpm. The PLCs-NLCs, equivalent to 10 mg was
placed in the dialysis bag, and 5 mL of sample was withdrawn at defined time
intervals. In order to maintain the sink conditions, replenishment with an equal
volume of fresh dissolution media was done.
2.7.4 Transmission electron microscopy (TEM)
An aliquot of 1 mL of the optimized PLCs-NLCs formulations were diluted in 250 mL 0.1N
HCl and used for TEM analysis. A drop of the sample was placed on copper grids, stained
with 1% phosphotungstic acid solution for 30s, and visualized under electron microscope
(JEM-2100 F, M/s Jeol, Tokyo, Japan) (Beg et al., 2015).
2.7.5 Mathematical modelling and optimization data analysis
Multiple linear regression analysis (MLRA) with second-order quadratic polynomial
models was employed to carry out DoE-based optimization data analysis. Moreover,
suitability of the selected mathematical model was analyzed using various diagnostic
plots. To understand the relationship amongst various CQAs, CMAs and CPPs,
response surface analysis was conducted employing 3D-reposne surface plots (Singh
et al., 2016).
2.7.6 Search for the optimum formulation and validation studies
Initially, a feasible region was located by assigning the desirable values for each of the
CQAs, followed by narrowing down the constraints to predict the optimum solutions.
Numerical optimization also helps in choosing the best solution with desirability

closer to one. Further, design space within the overlay plot also demarcates the
optimized formulation (Singh et al., 2005).
2.8 Caco-2 cell line studies
2.8.1 Caco-2 cell culture
Caco-2 cell line, Caucasian colon adenocarcinoma (cell passages between 40 to 55),
was procured from European Collection of Authenticated Cell Cultures (ECACC),
Public Health England, Salisbury, England. Cells were grown in EMEM media
containing 2 mM glutamine, 1% (v/v) non-essential amino acid solution (NEAA), 10%
(v/v) foetal bovine serum (FBS), at 37 °C in an atmosphere of 5% CO2 (ESCO, UK) in
the tissue culture flasks (75 cm2; Thermo, USA). Once cells were 90% confluent, 0.1%
trypsin-EDTA solution was employed.
2.8.2 Cell viability assay
For cell viability studies, 1 × 10³ cells/cm2 were seeded on 96 well plates (M/s Thermo
Fischer Scientific, Roskilde, Denmark), and the cytotoxicity was evaluated by
PrestoBlueTM cell viability reagent (Invitrogen, MD, USA). The medium was removed
before the start of each experiment, and 90 μL of 1000 µmol concentration of Mgf,
physical mixture, PLCs and PLCs-NLCs diluted with media were added to their
respective wells. A volume of 10 μL of PrestoBlue was added to each well after 24, 48
and 72 h of treatment, and the fluorescence was measured, after 1 h of incubation
using a microtiter plate reader at excitation/emission 535/612 nm (Tecan, Genios Pro,
Austria).
2.8.3 Bidirectional permeability assay
The cellular permeability of Mgf, physical mixture, PLCs and PLCs-NLCs was studied
in the apical to basolateral (A→B) and basolateral to apical (B→A) directions in Caco-
2 cells. To determine permeability on fully grown monolayer, cells
(2 × 10⁴ cells/cm2) were seeded on polyester sterile membrane, polystyrene plates and
grown for 19-21 days (12 mm diameter inserts, 0.4 μm pore size) (Corning
Incorporated, Costar®, NY, USA). The media was changed every alternate day such
that there is no depletion of nutrients to the cells. Besides, transepithelial electrical
resistance (TEER; Millicell®-ERS-2 Voltohm meter, M/s Millipore Corporation,
Billerica, MA, USA) value was measured in order to monitor the uniform growth of
the Caco-2 monolayer. TEER value is also an indicative of the extent of opening of
cellular tight junctions (Chaurasiya et al., 2012; Sermkaew et al., 2013; Neves et al.,
2015). The experiment was started on 21st day, when the monolayers reached a
constant TEER value, i.e., at about 1700 ohm and equilibrated with pre-warmed HBSS.
Further, on apical side 0.5 mL pre-warmed HBSS containing Mgf, physical mixture,
PLCs and PLCs-NLCs, while 1.5 mL of blank HBSS was added to the basolateral side.
On the similar heels, the same formulations were also added on B side and blank HBSS
was added to the A side of the cells to better evaluate the permeability assay. Post
incubation, 0.2 mL of medium at the B side was withdrawn at a periodic time intervals
of 0.5 h, 1 h, 2 h and 3 h, and replaced with fresh medium to investigate A→B
transport. Similarly, from the apical side, 0.2 mL of medium was withdrawn and
replaced with fresh medium for investigating B→A transport. Drug concentration on
both the sides was determined using HPTLC analytical method (Khurana et al., 2016).
From the linear slope of the plot between drug permeated and time, apparent
permeability coefficient (Papp; cm/s) was determined:
AC
tQPapp
/ ……….. Eq 2
where, ΔQ/Δt is the steady state flux; C0 is the initial drug concentration on apical or
basolateral side; and A is the surface area of the membrane (cm2).
2.8.4 Qualitative and quantitative cellular uptake
Qualitative cellular uptake investigations were conducted by fluorescence microscopy
on Caco-2 cells employing rhodamine-123 (Rh-123) as the tracker dye, loaded onto
blank NLCs (Chaurasiya et al., 2012). Cells (1 ×10⁵ per well) were plated on glass
coverslips in EMEM media and allowed to adhere overnight. Once adhered, the cells
were treated with 0.078 µM Rh-123 loaded NLCs for 1 h and 3h at 37 °C. Subsequently,
the cells were washed thrice with pre-warmed PBS and imaged live under PBS on a
modified Zeiss Cell Observer imaging system using a Zeiss EC Plan-Neofluar 40x/1.3
oil objective. On the other hand, simultaneously another set of cells grown of cover
slips were treated in a similar manner. However, these sets of cells were fixed with
paraformaldehyde and washed thrice with PBS prior to their mounting on
Vectashield® mounting medium with DAPI and were observed on the same
instrument. Rh-123 and DAPI were imaged using a GFP/DAPI filter set at
excitation/emission wavelength of 450-490nm/500-550nm and 335-383nm/420-
470nm, respectively. Analysis of the images was carried out using Zeiss ZEN desk
imaging software. For quantitative measurement, cells (1x10⁵) were seeded in each
well of the 6-well plate and incubated for overnight. Rh-123 loaded NLCs (100 µg/mL)
were added to each well and cells were incubated for different time intervals, as
during qualitative measurement. Medium was removed after incubation for a period
of 1 h and 3 h, subsequently, the cells were washed, tyrpsinized, and re-suspended in
cold PBS for immediate flow cytometry analysis. Rh-123 signals were detected in FL-

1 channel of BD FACSAria flow cytometer. A total of 10,000 events were analysed and
data were analysed on Flowing version 2.5.1 (Pertuu Terho, Turku Centre for
Biotechnology, University of Turko, Finland).
2.8.5 P-gp efflux assay
The overexpression of P-gp efflux proteins in Caco-2 cells has been well documented in
several literature reports (Faassen et al., 2003; Konsoula and Jung, 2009). In Caco-2 cells, P-gp
confers resistance by preventing the absorption of drugs and bioactives through the cells,
thereby inhibiting it to reach systemic circulation (Shugarts and Benet, 2009). For evaluating
the P-gp efflux, the multi-drug resistance dye efflux assay kit (Chemicon International, USA)
was employed (International, 2016). The efflux activity was measured to determine the
intracellular accumulation of two fluorescent dyes viz. Rh-123 and DiOC2, to access the
inhibitory activity of Mgf, PLC, PLCs-NLCs on MDR1 and BCRP transporters, respectively.
Caco-2 pellet containing 2.5 × 10⁵ cells was incubated with Rh-123 alone, Rh-123 with
vinblastine at 37 °C and 4 °C, Rh-123 loaded-PLCs and PLCs-NLCs for 1 h. All the
formulations were suspended in RPMI-1640 medium (Sigma-Aldrich, UK). Likewise, to
investigate the potential of Mgf and the developed formulations to block the activity of BCRP
transporters, DiOC2 dye was employed. Similarly, Caco-2 cells (2.5 × 10⁵) were incubated with
DiOC2 alone, DiOC2 and vinblastine at 37 °C and 4 °C, DiOC2-loaded Mgf, PLCs and PLC-
NLCs for another 1 h. The cells were washed with pre-warmed PBS and the fluorescence
intensity was measured in the presence of Rh-123 and DiOC2-loaded formulations, in a Tecan
fluorescence microplate reader at excitation and emission wavelengths of 485 nm and 530 nm,
respectively.
2.9 In situ single pass intestinal perfusion (SPIP) studies

Unisex wistar rats weighing 250-300 g were fasted for 24 h (Animal approval no.
578/IAEC). Animals were randomly grouped namely, i.e., Group I with Mgf, Group
II Mgf with verapamil (a P-gp efflux inhibitor), Group III with PLCs, and Group IV
with PLCs-NLCs. The study was performed as per the procedure already reported by
our group (Bandyopadhyay et al., 2012). Briefly, on the anaesthized animal, the inlet
and outlet was created on the intestine after incising the abdomen and were further
cannulised to perfuse Kreb’s buffer. After a periodic time interval of 15 min, aliquots
of 1 mL were withdrawn. Permeability parameters viz. effective and wall
permeability, and absorption parameters viz. fraction absorbed and absorption
number were calculated (Daniel, 1991; Singh et al., 2016).
2.10 In vivo pharmacokinetic studies
In vivo pharmacokinetic studies were conducted (Animal approval no. 578/IAEC)
with single dose parallel design study. Each group contained six animals, Group I
were administered with free Mgf solution, Group II were administered with PLCs and
Group III were PLCs-NLCs complex containing Mgf equivalent to 30 mg/Kg by oral
gavage (Lopesa et al., 2013), respectively. About 100 µL of blood was withdrawn at 0.5,
1, 2, 3, 6, 12, 18, 24 and 36 h from the retro-orbital plexus. Heparin coated vials
containing blood were centrifuged at 10,000 rpm (5,590 × g) for 10 min to extract
plasma which was subjected to HPTLC analysis to estimate Mgf. The validation data
of the developed method has already been previously reported by our group
(Khurana et al., 2016). To estimate the pharmacokinetic parameters, data analysis was
carried out using compartmental and noncompartmental modelling options of
WinNonlin software, version 5.0 (M/s Thermo Scientific, USA) (Singh et al., 2009).

3. Results and Discussion
The PLCs was formed employing stoichiometric ratios of 1:1, 1:2, and 1:3 and the
following parameters were estimated to screen the best ratio.
3.1 Systematic optimization of the NLCs
3.1.1 Defining the QTPP
For maximal therapeutic efficacy and patient safety, the objectives of the target
product were defined by summarizing the quality characteristics. Supplementary
Table 1 enlists the QTPP aimed for formulating the NLCs of Mgf. The basic objective
underlying the selection of NLCs can be ascribed to their lipidic nanostructured
nature, which helps in absorption of the drugs through gastrointestinal route.
Although several literature reports (Patil et al., 2015; Singh et al., 2016; Valicherla et al.,
2016) have documented the use of lipidic systems for BCS Class II and IV bioactives
like Mgf, yet the current studies endeavoured at developing the PLCs-loaded with
NLCs systematically for enhance the oral bioavailability.
3.1.2 Identification of the CQAs
The CQAs for NLCs were earmarked to meet the desired QTPP objectives which
include particle size, zeta potential, entrapment efficiency and time required for 80%
of drug release. Selection criterion of the CQAs was based upon the prior literature,
knowledge and experience on the NLCs formulations and enlisted in Supplementary
Table 2 with suitable justifications.
3.2 Molecular docking and simulation:
Docking studies unearth the formation of intermolecular hydrogen bonding between
Mgf and phosphatidylcholine transfer protein. As shown in Figure 1, the docking

patterns indicated two prominent hydrogen bonding, between free hydroxyl groups
of Mgf and NH of TRP 30 and GLN 12, at a distance of 1.982 Ǻ and 2.142 Ǻ,
respectively. The complex formation and thermodynamic stable conformation
between Mgf and protein is primarily due to the meek reduction in the activation
energy. Final docking energy exhibited was –7.9 kcal/mol, indicative of the free –OH
groups on Mgf responsible for the complex formation (Beg et al., 2016).
3.3 Characterization of PLCs
3.3.1 Physical evaluation and drug Content
Mgf (10 mg) and Phosholipon 90G were stoichiometrically mixed in 1:1; 1:2 and 1:3
ratio to prepare the complex. The physical appearance of the complex was found to
be semi-solid in nature, while evaluation content in all the three ratios (i.e., 1:1; 1:2 and
1:3) of complexes was found to be of 96.57% ± 1.02% (1:1), 95.64% ± 0.92% (1:2) and
95.18% ± 1.11%.
3.3.2 Solubility and oil water partition coefficient
All the complexes, prepared in different molar ratios, showed 25-folds higher aqueous
solubility and 10-folds higher oil-water partition coefficient vis-a-vis Mgf alone (Table
1). It could be well inferred from the studies that varying ratios of Mgf and PL during
complex formation caused no significant improvement in the values of solubility and
partition coefficient of the drug. This indicated that 1:1 molar ratio was suitable for
forming the complex between the Mgf and PL, which was selected for further studies.
Table 1: Solubility and oil-water partition coefficient of Mgf, physical mixture and PLCs
Samples Solubility in water (mg/mL) Oil-water partition coefficients
Mgf 1.36 ± 0.25 0.83 ± 0.21

Physical mixture
3.79 ± 1.98 1.23 ± 0.54
PLCs (1:1) 34.25 ± 1.98 8.52 ± 0.98
PLCs (1:2) 33.22 ± 2.75 8.91 ± 1.26
PLCs (1:3) 34.46 ± 1.10 7.90 ± 1.03
Mean ± SD (n=3)
3.3.3 PXRD studies
The PXRD depicted in Figure 2 (A) for Mgf showed sharp peaks, indicating its highly
crystalline nature, while a halo pattern was observed for PL indicating its amorphous
nature (Figure 2 B). Physical mixture of Mgf and PL (Figure 2 C) shows some of the
prominent diffraction peaks of Mgf. On the contrary, diffraction patterns of PLCs
(Figure 2 D) show a halo pattern indicating loss of crystallinity of Mgf in the PLCs.
3.3.4 DSC studies
The DSC heating curve in Figure 3 (A) for Mgf indicated a sharp endothermic peak at
277.08 °C, ostensibly owing to the melting point of crystalline Mgf. Figure 3 (B),
portraying PL, did not exhibit any distinct melting event plausibly due to its non-
crystalline nature, while an endothermic peak at 231.13 °C was observed due to its
possible degradation pattern. However, the physical mixture of Mgf and PL (Figure 3
C) exhibited significant reduction in the melting endotherm of Mgf which could be
due to the miscibility of Mgf and PL. However, PLCs of Mgf shows a prominent
endothermic event at around 140°C which might be attributed to formation of a
characteristic ordered structure for the complex. It also showed disappearance of DSC
events for pure Mgf and phospholipid (Semalty et al., 2012). The results were found to
be in close consonance with those of the results reported by Ma and associates (Ma et
al., 2014).

3.3.5 FTIR Studies
The FTIR studies of Mgf (Figure 4 A) revealed functional groups of peaks at 3368.00
cm−1 (O-Hstr), 2932.88 cm−1 (aliphatic C-Hstr), 1636.75 cm−1 (C=Ostr), 1497.10 cm−1 (CH–
CHstr) and 1253.42 cm−1 (C-Ostr). Peak at 1086.93 cm−1 showed the presence of C–C
stretching in the structure of Mgf. The FTIR spectrum of PL (Figure 4 B) showed peaks
for functional group at 3390.30 cm−1 (O-Hstr,), 2923.39 cm−1 (aliphatic C-Hstr), 1733.16
cm−1 (C=Ostr, COOH) and 1642.48 cm−1 (C=Ostr).
The physical mixture, however, showed characteristic functional peaks (Figure 3 C) at
3369.44 cm−1 (O-Hstr), 2926.75 cm−1 (C-Hstr, aliphatic), 1737.04 cm−1 (C=Ostr, COOH,
phospholipid) and 1640.85 cm−1 (C=Ostr, Mgf), indicating no interaction existing
between Mgf and PL. On the other hand, the complex showed shifting and broadening
of the functional peaks of Mgf (Figure 3 D) from 3390.30 to 3430.87 cm-1 for O-Hstr
indicating presence of weak H-bonding interaction. These results indicated that
phenolic hydroxyl group of Mgf might have been responsible for interaction with the
quaternary amine nitrogen in the PL to form PLCs, while minor shifting in the peaks
and their intensity were observed in the functional peaks from 1638.55 to 1430.91 cm-
1 (Zhao et al., 2013). The results are in consonance with the values reported in literature
(Semalty et al., 2012).
3.3.6 Scanning electron microscopy (SEM)
Figure 5 illustrates the surface morphology of Mgf and its complex. The Figure 5 (A)
shows longitudinal column shaped crystals of Mgf, while Figure 5 (B) shows
amorphous nature of PL. No change in surface morphology was observed in the
physical mixture of Mgf with PL, as depicted in Figure 5 (C). In case of complex

(Figure 5 D), however, the crystallinity of Mgf disappeared ascribable to its
complexation with PL.
As a naturally occurring flavonoid exhibiting poor lipophilicity (log P of -0.36)
(FooDB., 2016) and hydrophilicity (sparingly solubility in water; 0.16 mg/mL) (Acosta
et al., 2016) as well as in lipidic solvents, phospholipids can be considered as potential
carriers to ameliorate these hiccups of Mgf, a BCS Class IV bioactive. Therefore,
phospholipid complex of Mgf i.e., PLCs were prepared first, then incorporated in the
nanostructured lipidic carriers (NLCs) for improved scalability, deliverability through
oral route and handling of drug delivery systems.
3.4 Risk assessment studies
The causes and sub-causes affecting the CQAs were indentified through Fish-bone
diagram constructed in Supplementary Figure 1. Subsequently, the “prominent few”
input variables were identified from the “plausible so many”. These included drug
particle size, type of phospholipid, type of surfactant, amount of solid lipid and liquid
lipid, amount of emulgent as MAs and as the reflux temperature and time,
ultrasonication time and cycles, type of stirring, stirring speed and stirring time,
homogeniser speed and homogenisation time as process parameters (PPs). The
selected MAs and PPs were subjected to risk assessment studies using REM by
assigning them low, medium and high risk levels. These levels were earmarked
keeping in consideration the patient perspectives following the brainstorming
sessions among the team members. Supplementary Table 3 illustrates the REM with
ratio of solid and liquid lipids, and amount of emulgent observed to be the high risk
parameters influencing the formulation CQAs, i.e., particle size, zeta potential,

encapsulation efficiency and in vitro drug release. Further, ultrasonication time and
ultrasonication cycles, stirring speed and stirring time and homogeniser speed and
homogenization time as the PPs were observed to exhibit medium risk levels. The
aforesaid MAs and PPs were therefore, considered as critical CMAs and CPPs, and
were further subjected to systematic formulation optimization studies. However, API
particle size, and types of phospholipid and surfactant were found to exhibit low risks.
Thus, phospholipid and surfactant type were fixed with i.e., Phospholipon 90G and
Tween 80 on the basis of solubility results.
3.5 Selection of the lipids
Equilibrium solubility studies as Mgf were performed on various solid and liquid
lipids. Solubility of drug in solid lipids was found to follow the order of Compritol
888 > stearic acid > isopropyl myristate > cetyl palmitate > glyceryl monostearate >
soy lecithin. Mgf showed maximal solubility in Compritol 888 while minimal
solubility in soy lecithin. Soy lecithin was used in the formulation as an edge activator
which enables the vesicle to deform without losing their structural integrity (Yusuf et
al., 2014). Despite low solubility of the drug in it, many scientific reports on NLCs have
documented the usage of soy lecithin for reducing the particle size and augmenting
absorption characteristics of drug(s) (Andalib et al., 2012; Pezeshki et al., 2014).
Solubility of drug in the liquid lipids and surfactants was found to follow the order,
Labrafil M 2125 > Capmul MCM > Lauroglycol FCC > Capryol 90 and Tween 80>
Tween 40> Cremophor RH 40> Cremophor EL. Hence, Labrafil M 2125 and Tween 80
were chosen as the liquid lipid and surfactant, respectively. Table 2 enlists the design
matrix indicating thirteen experimental runs obtained for the NLCs, along with the

factor levels in coded units and actual form. Prepared complex of Mgf was
incorporated into the nanolipidic carriers through bottom-up approach, where the
lipophilic complex was solubilized in the lipidic vehicle, used for the preparation of
nanocarriers (Li et al., 2013; Beg et al., 2016).
Table 2: Optimization design matrix enlisting the levels employed for CMAs of
NLCs in FCCD
Factors Type Levels
Low (-1) High (+1)
Solid lipid (X1) Numerical 700 mg 900 mg
Tween 80 (X2) Numerical 250 mg 450 mg
Optimization design as per thirteen factors, three level FCCD
Trials Solid lipid (X1) Tween 80 (X2)
F1* 0 0
F2* 0 0
F3 0 1
F4* 0 0
F5 -1 1
F6 0 -1
F7* 0 0
F8 1 1
F9 -1 -1
F10 1 0
F11* 0 0
F12 1 -1
F13 -1 0
3.6 Characterization of the prepared NLCs
3.6.1 Particle size and TEM analysis
The NLCs showed particle size ranging between 151 and 415 nm, which indicate their
nanostructured nature, by and large. The results revealed that particle size was found
to be depending on the combined effect of the solid lipid and concentration of the
surfactant in the prepared formulations. The smaller particle size was observed for the
formulations containing lower concentration of lipids and higher concentration of
emulgents. Figure 6 (A) potrays the particle size and Figure 6 (B) depicts the electron
microscopy analysis of optimized PLCs-NLCs.
3.6.2 Zeta potential
The zeta potential values for NLCs were found to be ranging between -10.41 and
-42.1 mV, indicating negatively charged nature of the prepared formulations. This can
be attributed to the PEG-esters and a glycerides fraction of the lipid and nonionic
nature of the surfactant employed for the preparation of NLCs (Pezeshki et al., 2014).
The observed high values of zeta potential vouched potentially physical stability of
the prepared NLCs.
3.6.3 Encapsulation efficiency
Encapsulation efficiency was found to be in the range of 68% and 87%. High
entrapment was observed with increasing lipid and intermediate levels of surfactant,
attributable to the maximal drug solubilization capacity at this particular combination.
The results revealed that use of intermediate to high concentration of lipids, and
intermediate concentration of surfactant produced maximal entrapment efficiency
values.
3.6.4 In vitro drug release

Figure 7 shows in vitro drug release profile of PLCs-loaded NLCs prepared as per
design matrix and maximal drug release (i.e., >80%) was found to be within 20 h. It
was further observed that faster drug release was from the formulations containing
lower concentration of lipid and higher amount of surfactant. However, the
formulations containing intermediate to lower levels of lipids showed sustained drug
release profile, plausibly owing to the slower diffusion rate of the drug from the
tortuosity of the lipid matrix. Interestingly, the results also construed that the effect of
increase in the levels of liquid lipid was responsible for evaluating drug release rate,
ostensibly owing to loosening of the packing of drug within the lipid matrix (Dhawan
et al., 2010). Mgf’s PLCs-loaded NLCs exhibited sustained drug release profile,
considered to be essential for enhancing the therapeutic response for prolonged
period of time (Fang et al., 2012; Tran et al., 2014).
3.6.5 DSC and FTIR analysis of PLCs-NLCs
PLCs-NLCs showed a sharp new endothermic peak at 116.85°C (Figure 3E) suggesting
the disappearance of DSC events of Mgf, PL and PLCs. FTIR spectra obtained for
PLCs-NLCs revealed peaks at 3433.51 cm-1 (O-Hstr), 2923.69 cm−1 (C-Hstr, aliphatic)
and changing of the intensity of all peaks from 1737.67 to 1105.40 cm−1 suggesting that
PLCs have been incorporated in NLCs.
3.7 Mathematical modelling and optimization
MLRA method was employed to fit in the experimental data obtained as per the
selected design into the second-order quadratic polynomial model. Table 3 enlists the
coefficients obtained for each of the CQAs as per the model Eq. 1, which revealed the

presence of interactions among the studied factors on the CQAs. Further, the model
developed using parameters like higher values of correlation coefficient (R), ranging
from 0.9874 and 0.9988 and insignificant lack of fit revealed aptness of the selected
model.
2
28
2
173163252143322110 XXXXXXXXXXXY …..Eq. 1
where, Y = response variables, β0= intercept, β1 to β3 = coefficients of linear model
terms; β4 to β6 = coefficients of linear interaction terms, β7 to β8 = coefficients of
quadratic terms.
Table 3: Coefficients of polynomial model equations with various statistical
parameters for the response variables of NLCs of mangiferin
Coefficient
code
Polynomial coefficients for responses
Particle
size
Zeta
potential
Entrapment
efficiency
Drug
release
β0 216.20 -25.53 79.00 83.60
β1 -13.50 8.10 1.00 0.50
β2 -45.00 6.19 -6.50 -1.00
β3 62.50 7.15 0.75 -4.75
β4 40.30 -6.87 7.00 4.90
β5 153.80 1.12 -4.50 2.40
β6 93.50 -6.09 5.75 -1.25
β7 74.50 -10.55 -1.75 -0.25
β8 184.30 7.08 0.25 -2.15
R 0.9996 0.9345 0.9240 0.9238
P-value <0.0001 <0.001 <0.001 <0.001

3.7.1 Response surface analysis
The 3D-response surface plots as depicted in Figure 8, revealed the correlation among
selected factors for better product and process understanding.
The said plots for particle size (Figure 8 A) revealed curvilinear relationship with an
initial increasing trend from low to intermediate levels, followed by a declining phase
at higher levels. On the other hand, the effect of Tween 80 was found to be quite linear
on particle size. However, lower concentration of lipids and higher concentrations of
surfactants showed minimum particle size.
In Figure 8 B, solid lipid shows a declining trend, while surfactant, i.e., Tween 80
shows positive influence on zeta potential. At lower levels of Tween 80 with increasing
content of lipid, significant interaction was observed on the values of zeta potential.
Maximal values for zeta potential were observed at higher concentration of lipids and
surfactant.
The response surface plot depicting the influence of entrapment efficiency was found
to be highly pronounced at all the levels of lipids (Figure 8 C). Moreover, the plot
shows an initial declining trend followed by an increasing trend for entrapment
efficiency from low to high levels of lipid, at high levels of surfactant. Maximum
entrapment efficiency was observed both at either low or high solid lipid levels,
coupled with preferably higher levels of surfactant.
The effect of ratio of solid to liquid lipid was found to possess positive influence on
the values of Q16h (Figure 8 D), while the influence of Tween 80 shows a diminishing

trend. Minimum percent drug release exhibiting controlled release profile was
observed at higher lipid concentration and intermediate Tween 80 concentration.
3.7.2 Search for the optimum formulation and validation studies
To attain the desired intents of minimum particle size (<90 nm), higher zeta potential
(>22 mV), higher entrapment efficiency (>80%) and amount of drug released at 20 h
(80 to 90%), various CQAs were trade off. Demarcation of the optimized formulation
was done by making the desirability function close to unity. The concentration of
liquid lipid, Labrafil M2125 was kept as constant, i.e., 230 mg. Figure 9 portrays the
optimum location of NLCs formulation within design space, construing the
formulation composition with Compritol 888 (770 mg) and Tween 80 (365 mg),
exhibiting the particle size of 215 nm, zeta potential of -26.3 mV, entrapment efficiency
of 78% and Q16h of 83.6%, respectively.
3.8 Caco-2 cell lines assays
3.8.1 Cell viability assay
As Caco-2 cells are very well to known possess similarity with the gastrointestinal
epithelial cells, these are commonly used as the model cells for evaluating cytotoxicity,
absorption and permeability of oral formulations (Kowapradit et al., 2010; Ma et al.,
2014). These cells undergo spontaneous enterocytic differentiation and become
polarized, thereby expressing apical and basolateral surfaces exhibiting tight
junctions, therefore used as bidirectional permeability model (Sambuy et al., 2005;
Awortwe et al., 2014). Hence, in the current research work, this cell lines was employed
as an in vitro model to evaluate drug absorption across intestine. Figure 10 (A) depicts
the concentration-dependent percent cell viability at 24 h and Figure 10 (B) shows the

time-dependent percent cell viability at 24 h, 36 h and 48 h at highest concentration,
i.e., 1000 µmol for Mgf, PL, physical mixture, PLCs and PLCs-NLCs. The percent cell
viability data with Presto Blue on Caco-2 cells (Lea et al., 2014) was found to be >95%
(p>0.05) for all the formulations, i.e., upto a maximum of 72 h, thus ratifying their
safety and biocompatibility. Ideally, for better absorption and permeability, the
formulation should not be toxic to the Caco-2 cells. Verily, Muller and associates have
corroborated the safety of lipids on various cell lines in concentration of upto 10%
(Müller et al., 1996; Müller et al., 2005). Indeed, none of the formulations, including
Mgf, itself were found to be nontoxic to Caco-2 cells, and is in consonance with the
literature findings (Caliph et al., 2000). For improved understanding, the control cells
at all the time points have been assumed as 100% and the cell viability for tested
formulations has been calculated accordingly (Coker et al., 2012; Cheah et al., 2014).
3.8.2 Bidirectional permeability assay
Further, it was conferred vital to assess the permeability of the formed PLCs-NLCs
across the intestinal epithelial barrier (Hubatsch et al., 2007). As Mgf is quite prone to
P-gp efflux, the strategy aimed not only to study the A→B permeation but also to
investigate the B→A transport. Mgf was analysed in both the A and B compartments
to calculate the value of Papp (Figure 11). The TEER values were continuously
recorded while performing experiment, showing miniscule reduction (i.e., <10%) in
TEER value on the treated cells wrt the control cells which indicated that there was
slight opening of the tight junctions of Caco-2 cells, signifying paracellular transport
(Sha et al., 2005; Chen et al., 2015; Laksitorini et al., 2015).
The prepared PLCs-NLCs and PLCs showed 10.1 fold (p <0.001) and 9.4 fold (p

<0.001) enhancement, respectively in the permeation (19.2 × 10⁻⁶ cm/sec and 15.4 ×
10–6 cm/sec) parameters in contrast to the plain Mgf solution (1.9 × 10⁻⁶ cm/sec) at 3rd
hour. This indicated that PLCs-NLCs demonstrated enhanced permeability of Mgf,
solely attributable to the lipids and phospholipids employed to prepare the complex
and NLCs (Gursoy et al., 2003; Gursoy and Benita, 2004; Kogan et al., 2008).
The transport and permeability studies in Caco-2 monolayer determine the ability of
a compound and/or formulation to act as a substrate and/or inhibitor of the efflux
transporters of P-gp (Sun and Pang, 2008). Further, increase in the Papp with time
might be due to the capacity of the excipients viz. phospholipids, lipids and
surfactants to block the P-gp efflux mechanism across the intestinal barrier, resulting
in more permeation over increasing time (Chaurasiya et al., 2012).
3.8.3 Qualitative and quantitative cellular uptake
Qualitative analysis made through the images were processed through Zen Pro 2012,
displayed the fluorescent images of Rh-123-loaded NLCs uptake at 1 h and 3 h points,
with the corresponding histograms generated through Flowing software version 2.5.1
(University of Turko, Finland) depict the quantitative data (Figure 12 A). Another set
of images generated after fixation of cells exhibit DAPI stained nucleus of Caco-2 cells
and Rh-123 loaded NLCs uptake at 1 h and 3 h (Fig 12B). Qualitative and quantitative
analysis both made through the FITC value generated for respective time-points
supported the time dependent uptake of 123 loaded NLCs upto 3h. This is in
agreement with an earlier report where glyceryl monostearate lipid nanaoparticles
showed maximum cellular uptake at 3 h (Garanti et al., 2016).

3.8.4 P-gp efflux assay
The P-gp efflux assay revealed that at 37 °C, MDR1 and BCRP transporters were
effluxing dyes, as the fluorescence intensity for both the dyes was observed to be quite
low (Figure 13). On the other hand, incubation at 37 °C with vinblastine showed
higher fluorescence indicating that vinblastine might block both the MRP2 and BCRP
transporters (International, 2016). Meanwhile, incubating dyes-loaded PLCs
(p<0.0001) and PLCs-NLCs (p<0.0001) with Caco-2 showed significantly higher
fluorescence intensity than Mgf alone. Verily, significant difference around 2..1 folds
was found between the fluorescence intensity of PLCs and PLCs-NLCs (p<0.001)
which could be attributable to P-gp inhibition property of phospholipids and lipidic
mixtures. These excipients primarily act as P-gp inhibitors by rendering P-gp
substrate site competition (Roger et al., 2010; Hoosain et al., 2015). In this context,
Tween 80, being a surfactant also seemed to play significant role in inhibiting P-gp,
leading to membrane fluidization and consequently, enhanced permeability (Rege et
al., 2002).
3.9 In situ intestinal perfusion studies
The in situ SPIP study is a well-known model to investigate the absorption and
permeation behaviour of a drug when administered as complex (Singh et al., 2009). As
is evident from Figure 14, the PLCs showed significant improvement (P < 0.001) in he
absorption number (An) by 12-fold (P < 0.001), fraction of drug absorbed (F) by 11-
fold (P <0.001), effective permeability (Peff) by 8-fold (P <0.001) and wall permeability
(Pwall) by 12-fold (P <0.001) vis-à-vis free Mgf or co-administered with verapamil.
Verapamil could bind with the P-gp efflux pumps present on the intestinal

enterocytes, thereby allowing the Mgf to reach systemic circulation (Ishri et al., 2006).
This study indisputably demonstrated the inherent P-gp efflux characteristics of Mgf,
while the formed PLCs could surmount the P-gp efflux (Madan et al., 2005). This can
be attributed to the notable increase in the absorption potential of Mgf, due to
enhanced permeability and absorption parameters by circumventing first-pass effect
(Singh et al., 2011). Besides, the results unrevealed supremacy in permeability
parameters by PLCs possibly due to phospholipids (Song et al., 2006; Zakeri-Milani et
al., 2007).
3.10 In vivo Pharmacokinetic Studies
Statistically significant change in plasma concentration (p <0.001) was observed for
PLCs-NLCs, PLCs than Mgf after peroral administration. The dose administered in
each case, i.e., PLCs-NLCs, PLCs and Mgf, was equivalent to 30 mg/kg (Ma et al.,
2014). The mean plasma and time profiles for each group (n=6) is graphically depicted
in Figure 15, depicting decline in the later part, thus, ratifying the suitability of 2-CBM
kinetics (Bhattacharyya et al., 2013). The values of various pharmacokinetic
parameters of PLCs and Mgf, and the results of post one-way Anova test are shown
in Table 4.
Nearly 4.55- and 1.98-fold increase in Cmax and AUC was recorded by PLCs-NLCs,
while the corresponding PLCs demonstrated 3.61- and 1.78-fold augmentation vs Mgf,
respectively. Moreover, the PLCs-NLCs and NLCs showed nearly 3-fold reduction in
tmax values vs Mgf, therefore, suggested enhanced absorption with faster onset of
action. Drastic increase for Ka, i.e., 5.14-fold, demonstrated increased oral absorption

of PLCs-NLCs. Thus, significant different pharmacokinetic parameters confirm the
better oral absorption of PLCs-NLCs over PLCs and Mgf.
Together lipids, surfactants and absorption enhancers facilitate the increased
bioavailability because of nanostructured NLCs, micellar solubilisation in intestinal
milieu, followed by increased intestinal transport through transcellular and
paracellular pathways (Porter et al., 2007).
Table 4: Pharmacokinetic parameters obtained from plasma level studies after oral administration of PLCs-NLCs, PLCs and Mgf
Treatment Formulations
Pharmacokinetic parameters
Cmax
(ngh-1) AUClast h*ng/ml
Cmax/AUC (h-1)
Ka (h-1)
Tmax (h)
MRT (h)
Cl (mL/h)
Mgf 275.14 ± 42.76
2851.39 ± 238.91
0.096 1.08 ± 2.1
3.02 ± 0.15
9.72 ± 1.27
2331.64 ± 591.71
PLCs 1046.56 ± 166.35
5349.75 ± 311.56
0.196 0.35 ± 0.12
1.05 ± 0.21
12.72 ± 1.87
1445.51 ± 265.12
PLCs-NLCs 1319.12 ± 178.53
5948.72 ± 378.26
0.222 0.21 ± 0.13
1.03 ± 0.36
13.89 ± 1.85
1045.51 ± 291.91
All the data represented as mean ± SD (n=3)
Although PLCs-NLCs did not show much significant improvement over the PLCs in
the pharmacokinetic parameters (only 1.2 folds enhancement), yet the prepared PLCs-
NLCs exhibited quite superior results during inhibition of P-gp efflux activity (2.1
folds), when conducted on Caco-2 cells. This can be ostensibly attributed to the
presence of phospholipids and lipids present in the PLCs-NLCs, which act as P-gp
substrates. Thus, the prepared PLCs-NLCs formulation primarily showed superiority
on P-gp efflux inhibition potential, although not much significant effect on the
pharmacokinetic profile.

4. Conclusions:
A dual formulation strategy was adopted in order to enhance the biopharmaceutical
attributes of a very potent antioxidant, Mgf. A minimum stiochiometric ratio of
Mgf:PL (1:1) was observed to be good enough to form the complex on the basis of
drug content, solubility and oil-water partition coefficient. Higher solubility and
permeability values may lead to increased intestinal uptake and permeability, which
is indeed a big limitation for oral absorption. Hence, the PLCs showed different
morphological properties from Mgf and the physical mixture. Being semisolid in
nature, attempts were made to incorporate Mgf in nanostructured carriers. Hence, a
novel strategy with dual formulation, i.e., PLCs encapsulated in nanostructured
systems was undertaken to improve the physicochemical and biopharmaceutical
attributes of Mgf through in vitro, in situ and in vivo studies. The current research
studies ratified that this drug–phospholipid complex loaded nanostructured dual
system is a novel strategy to formulate BCS Class II and IV drugs.
Declaration of interest
Authors declare no conflict(s) interest.
Acknowledgements
The financial grants received from the University Grant Commission (UGC), New
Delhi, India, to Ms Rajneet Kaur Khurana under the RFMS scheme-F. No. 5-
94/2007(BSR) is deeply acknowledged. Also, the services provided by SEM
department of Central Instrumental Laboratory, Panjab University is highly
appreciable. Use of Biomedical research facilities at University of Central Lancashire

is acknowledged. We are also thankful for the generous supply of hard gelatin
capsules shells ex-gratis by M/s ACG capsules, Pvt. Ltd. India.
References:
Acosta, J., Sevilla, I., Salomón, S., Nuevas, L., Romero, A., Amaro, D., 2016. Determination of mangiferin solubility in solvents used in the biopharmaceutical industry. J. Pharm. Pharmacogn. Res. 4, 49-53. Andalib, S., Varshosaz, J., Hassanzadeh, F., Sadeghi, H., 2012. Optimization of LDL targeted nanostructured lipid carriers of 5-FU by a full factorial design. Adv. Biomed. Res. 1, 45. Awortwe, C., Fasinu, P., Rosenkranz, B., 2014. Application of Caco-2 Cell Line in Herb-Drug Interaction Studies: Current Approaches and Challenges. J Pharm Pharm Sci 17, 1-19. Bandyopadhyay, S., Katare, O.P., Singh, B., 2012. Optimized self nano-emulsifying systems of ezetimibe with enhanced bioavailability potential using long chain and medium chain triglycerides. Colloids. Surf. B. Biointerfaces. 100, 50-61. Basheer, L., Kerem, Z., 2015. Interactions between CYP3A4 and Dietary Polyphenols. Oxid. Med. Cell. Longev. 2015, 854015. Beg, S., Raza, K., Kumar, R., Chadha, R., Katare, O.P., Singh, B., 2016. Improved intestinal lymphatic drug targeting via phospholipid complex-loaded nanolipospheres of rosuvastatin calcium. RSC. Adv. 6, 8173-8187. Beg, S., Sharma, G., Thanki, K., Jain, S., Katare, O.P., Singh, B., 2015. Positively charged self-nanoemulsifying oily formulations of olmesartan medoxomil: Systematic development, in vitro, ex vivo and in vivo evaluation. Int. J. Pharm. 493, 466-482. Bhattacharyya, S., Ahmmed, S.M., Saha, B.P., Mukherjee, P.K., 2013. Soya phospholipid complex of mangiferin enhances its hepatoprotectivity by improving its bioavailability and pharmacokinetics. J Sci Food Agric 94, 1380-1388. Bunjes, H., 2010. Lipid nanoparticles for the delivery of poorly water-soluble drugs. J Pharm Pharmacol. 62, 1637-1645. Caliph, S.M., Charman, W.N., Porter, C.J., 2000. Effect of short-, medium-, and long-chain fatty acid-based vehicles on the absolute oral bioavailability and intestinal lymphatic transport of halofantrine and assessment of mass balance in lymph-cannulated and non-cannulated rats. J. Pharm. Sci. 89, 1073-1084. Chaurasiya, A., Singh, A.K., Jain, G.K., Warsi, M.H., Sublet, E., Ahmad, F.J., Borchard, G., Khar, R.K., 2012. Dual approach utilizing self microemulsifying technique and novel P-gp inhibitor for effective delivery of taxanes. J Microencapsul 29, 583-595. Cheah, K.Y., Howarth, G.S., Bastian, S.E., 2014. Grape seed extract dose-responsively decreases disease severity in a rat model of mucositis; concomitantly enhancing chemotherapeutic effectiveness in colon cancer cells. PLoS One. 9, e85184. Chen, S., Einspanier, R., Schoen, J., 2015. Transepithelial electrical resistance (TEER): a functional parameter to monitor the quality of oviduct epithelial cells cultured on filter supports. Histochem Cell Biol 144, 509-515. Coker, A., Arisan, E.D., Palavan-Unsal, N., 2012. Silencing of the polyamine catabolic key enzyme SSAT prevents CDK inhibitor-induced apoptosis in Caco-2 colon cancer cells. Mol Med Rep. 5, 1037-1042. da Rocha Ferreira, F., Valentim, I.B., Luís Catarí Ramones, E., Salles Trevisan, M.T., Olea-Azar, C., Perez-Cruz, F., de Abreu, F.C., Fonseca Goulart, F.G., 2013. Antioxidant activity of the mangiferin inclusion complex with β-cyclodextrin. LWT - Food Sci and Tech 51, 129-134. Daniel, W.W., 1991. Biostatistics : A foundation for analysis in the health sciences, 5th ed. ed. Wiley & Sons, New York. Dar, A., Faizi, S., Naqvi, S., Roome, T., Zikr-ur-Rehman, S., Ali, M., Firdous, S., Moin, S.T., 2005. Analgesic and antioxidant activity of mangiferin and its derivatives: the structure activity relationship. Biol. Pharm. Bull. 28, 596-600.

Dhawan, S., Kapil, R., Singh, B., 2010. Formulation development and systematic optimization of solid lipid nanoparticles of quercetin for improved brain delivery. J. Pharm. Pharmacol. 63, 342-351. Faassen, F., Vogel, G., Spanings, H., Vromans, H., 2003. Caco-2 permeability, P-glycoprotein transport ratios and brain penetration of heterocyclic drugs. Int J Pharm. 263, 113-122. Fang, M., Jin, Y., Bao, W., Gao, H., Xu, M., Wang, D., Wang, X., Yao, P., Liu, L., 2012. In vitro characterization and in vivo evaluation of nanostructured lipid curcumin carriers for intragastric administration. Int J Nanomedicine 7, 5395-5404. FooDB., 2016. Showing Compound Mangiferin (FDB012803). http://foodb.ca/ compounds/FDB012803. Garanti, T., Stasik, A., Burrow, A.J., Alhnan, M.A., Wan, K.W., 2016. Anti-glioma activity and the mechanism of cellular uptake of asiatic acid-loaded solid lipid nanoparticles. Int. J. Pharm. 500, 305-315. Gursoy, N., Garrigue, J.S., Razafindratsita, A., Lambert, G., Benita, S., 2003. Excipient effects on in vitro cytotoxicity of a novel paclitaxel self-emulsifying drug delivery system. J. Pharm. Sci. 92, 2411-2418. Gursoy, R.N., Benita, S., 2004. Self-emulsifying drug delivery systems (SEDDS) for improved oral delivery of lipophilic drugs. Biomed Pharmacother. 58, 173-182. Hoosain, F.G., Choonara, Y.E., Tomar, L.K., Kumar, P., Tyagi, C., du Toit, L.C., Pillay, V., 2015. Bypassing P-glycoprotein drug ffflux mechanisms: Possible applications in pharmacoresistant schizophrenia therapy. BioMed Res Int Article ID 484963, 1-21. Hubatsch, I., Ragnarsson, E.G., Artursson, P., 2007. Determination of drug permeability and prediction of drug absorption in Caco-2 monolayers. Nat. Protoc. 2, 2111-2119. International, C., 2016. Multidrug Resistance Direct Dye Efflux Assay. Cat. No. ECM910. Ishri, R.K., Menzies, S., Halliday, G.M., 2006. Verapamil induces upregulation of P-glycoprotein expression on human monocyte derived dendritic cells. Immunol. Invest. 35, 1-18. Khan, S., Baboota, S., Ali, J., Khan, S., Narang, R.S., Narang, J.K., 2015. Nanostructured lipid carriers: An emerging platform for improving oral bioavailability of lipophilic drugs. Int. J. Pharm. Investig. 5, 182-191. Khurana, R.K., Rao, S., Beg, S., Katare, O.P., Singh, B., 2016. Systematic Development and Validation of a Thin-Layer Densitometric Bioanalytical Method for Estimation of Mangiferin Employing Analytical Quality by Design (AQbD) Approach. J. Chromatogr. Sci. 54, 829-841. Kogan, A., Kesselman, E., Danino, D., Aserin, A., Garti, N., 2008. Viability and permeability across Caco-2 cells of CBZ solubilized in fully dilutable microemulsions. Colloids. Surf. B. Biointerfaces. 66, 1-12. Konsoula, Z., Jung, M., 2009. Involvement of p-glycoprotein and multidrug resistance associated protein 1 on the transepithelial transport of a mercaptoacetamide-based histone-deacetylase Inhibitor in Caco-2 Cells. Biol Pharm Bull. 32, 74-78. Kowapradit, J., Opanasopit, P., Ngawhirunpat, T., Apirakaramwong, A., Rojanarata, T., Ruktanonchai, U., Sajomsang, W., 2010. In vitro permeability enhancement in intestinal epithelial cells (Caco-2) monolayer of water soluble quaternary ammonium chitosan derivatives. AAPS PharmSciTech. 11, 497-508. Laksitorini, M.D., Kiptoo, P.K., On, N.H., Thliveris, J.A., Miller, D.W., Siahaan, T.J., 2015. Modulation of Intercellular Junctions by Cyclic-ADT Peptides as a Method to Reversibly Increase Blood-Brain Barrier Permeability. J Pharm Sci. 104, 1065-1075. Lea, M.A., Pourat, J., Patel, R., desBordes, C., 2014. Growth inhibition of colon cancer cells by compounds affecting AMPK activity. World. Gastrointest. Oncol. 6, 244-252. Lee, S.J., Wang, S., Borschel, W., Heyman, S., Gyore, J., Nichols, C.G., 2013. Secondary anionic phospholipid binding site and gating mechanism in Kir2.1 inward rectifier channels. Nat. Commun. 4, 2786. Leiro, J., Arranz, J.A., Yanez, M., Ubeira, F.M., Sanmartin, M.L., Orallo, F., 2004. Expression profiles of genes involved in the mouse nuclear factor-kappa B signal transduction pathway are modulated by mangiferin. Int. Immunopharmacol. 4, 763-778.

Li, M., Zheng, Y., Shan, F.Y., Zhou, J., Gong, T., Zhang, Z.R., 2013. Development of ionic-complex-based nanostructured lipid carriers to improve the pharmacokinetic profiles of breviscapine. Acta Pharmacol Sin. 34, 1108-1115. Lopesa, S.C., da Silvaa, A.V.L., Arrudaa, B.R., Moraisa, T.C., Riosc, J.B., Trevisanc, M.T.S., Raoa, V.S., Santos, F.A., 2013. Peripheral antinociceptive action of mangiferin in mouse models of experimental pain: Role of endogenous opioids, KATP-channels and adenosine. Pharmacol. Biochem. Behavior. 110, 19-26. Ma, H., Chen, H., Sun, L., Tong, L., Zhang, T., 2014. Improving permeability and oral absorption of mangiferin by phospholipid complexation. Fitoterapia. 93, 54-61. Madan, J., Chawla, G., Arora, V., Malik, R., Bansal, A.K., 2005. Unbiased membrane permeability parameters for gabapentin using boundary layer approach. AAPS. J. 7, E224-230. Minglin, L., Huili, M., Lixin, Y., Peng, L., 2016. Mangiferin inhibition of proliferation and induction of apoptosis in human prostate cancer cells is correlated with downregulation of B-cell lymphoma-2 and upregulation of microRNA-182. Oncol. 11, 817-822. Mukherjee, S., Ray, S., Thakur, R.S., 2009. Solid Lipid Nanoparticles: A Modern Formulation Approach in Drug Delivery System. Indian J Pharm Sci. 71, 349-358. Müller, R., Maaβen, S., Weyhers, H., Specht, F., Lucks, J., 1996. Cytotoxicity of magnetite-loaded polylactide, polylactide/glycolide particles and solid lipid nanoparticles. Int J Pharm. 138, 85-94. Müller, R.H., Souto, E.B., Göppert, T., Gohla, S., 2005. Production of biofunctionalized solid lipid nanoparticles for site-specific drug delivery. Nanotechnologies for the life sciences biological and pharmaceutical nanomaterials., 291–307. Naseri, N., Valizadeh, H., Zakeri-Milani, P., 2015. Solid Lipid Nanoparticles and Nanostructured Lipid Carriers: Structure. Adv. Bull. 5, 305-313. Neuberg, P., Perino, A., Morin-Picardat, E., Anton, N., Darwich, Z., Weltin, D., Mely, Y., Klymchenko, A.S., Remy, J.S., Wagner, A., 2015. Photopolymerized micelles of diacetylene amphiphile: physical characterization and cell delivery properties. Chem. Commun (Camb). 51, 11595-11598. Neves, A.R., Queiroz, J.F., Costa Lima, S.A., Figueiredo, F., Fernandes, R., Reis, S., 2015. Cellular uptake and transcytosis of lipid-based nanoparticles across the intestinal barrier: Relevance for oral drug delivery. J. Colloid. Interface. Sci. 463, 258-265. Ojewole, J.A., 2005. Antiinflammatory, analgesic and hypoglycemic effects of Mangifera indica Linn. (Anacardiaceae) stem-bark aqueous extract. Methods Find Exp Clin Pharmacol. 27, 547-554. Patil, H., Feng, X., Ye, X., Majumdar, S., Repka, M.A., 2015. Continuous production of fenofibrate solid lipid nanoparticles by hot-melt extrusion technology: A systematic study based on a Quality by Design approach. AAPS J. 17, 194-205. Pezeshki, A., Ghanbarzadeh, B., Mohammadi, M., Fathollahi, I., Hamishehkar, H., 2014. Encapsulation of Vitamin A Palmitate in Nanostructured Lipid Carrier (NLC)-Effect of Surfactant Concentration on the Formulation Properties. Adv. Bull. 4, 563-568. Pichot, R., Watson, R.L., Norton, I.T., 2013. Phospholipids at the Interface: Current Trends and Challenges. Int. Mol. Sci. 14, 11767-11794. Porter, C.J., Trevaskis, N.L., Charman, W.N., 2007. Lipids and lipid-based formulations: optimizing the oral delivery of lipophilic drugs. Nat. Rev. Drug. Discov. 6, 231-248. Qin, L., Yujiang, W., Gang, D., Zhiping, W., Xuejian, L., Wanna, X., Jianjun, H., 2014. Multi-element mangiferin solid dispersion as well as preparation method and application thereof Guangxi University of Traditional Chinese Medicine. CN 104473875 A2014. Rawat, D.S., Thakur, B.K., Semalty, M., Semalty, A., Badoni, P., Rawat, M.S., 2013. Baicalein-phospholipid complex: a novel drug delivery technology for phytotherapeutics. Curr. Drug. Discov. Technol. 10, 224-232. Rege, B.D., Kao, J.P., Polli, J.E., 2002. Effects of nonionic surfactants on membrane transporters in Caco-2 cell monolayers. Eur J Pharm Sci. 16, 237-246. Renukuntla, J., Vadlapudi, A.D., Patel, A., Boddu, S.H.S., Mitra, A.K., 2013. Approaches for Enhancing Oral Bioavailability of Peptides and Proteins. Int. J. Pharm. 447, 75-93.

Rodriguez, J., Di Pierro, D., Gioia, M., Monaco, S., Delgado, R., Coletta, M., Marini, S., 2006. Effects of a natural extract from Mangifera indica L, and its active compound, mangiferin, on energy state and lipid peroxidation of red blood cells. Biochim. Biophys. Acta. 1760, 1333-1342. Roger, E., Lagarce, F., Garcion, E., Benoit, J.P., 2010. Reciprocal competition between lipid nanocapsules and P-gp for paclitaxel transport across Caco-2 cells. Eur J Pharm Sci. 40, 422-429. Saha, S., Sadhukhan, P., Sil, P.C., 2016. Mangiferin: A xanthonoid with multipotent anti-inflammatory potential. Biofactors. 42, 459-474. Sambuy, Y., De Angelis, I., Ranaldi, G., Scarino, M.L., Stammati, A., Zucco, F., 2005. The Caco-2 cell line as a model of the intestinal barrier: influence of cell and culture-related factors on Caco-2 cell functional characteristics. Cell Biol Toxicol. 21, 1-26. Sánchez-Moreno, P., Ortega-Vinuesa, J.L., Martín-Rodríguez, A., Boulaiz, H., Marchal-Corrales, J.A., Peula-García, J.M., 2012. Characterization of Different Functionalized Lipidic Nanocapsules as Potential Drug Carriers. Int. J. Mol. Sci. 13, 2405-2424. Sarkar, A., Sreenivasan, Y., Ramesh, G.T., Manna, S.K., 2004. Beta-D-Glucoside suppresses tumor necrosis factor-induced activation of nuclear transcription factor kappaB but potentiates apoptosis. J. Biol. Chem. 279, 33768-33781. Semalty, A., Semalty, M., Singh, D., Rawat, M.S.M., 2012. Phyto-phospholipid complex of catechin in value added herbal drug delivery. J Incl Phenom Macrocycl Chem. 73, 377. Sermkaew, N., Wiwattanawongsa, K., Ketjinda, W., Wiwattanapatapee, R., 2013. Development, Characterization and Permeability Assessment Based on Caco-2 Monolayers of Self-Microemulsifying Floating Tablets of Tetrahydrocurcumin. AAPS. PharmSciTech. 14, 321-331. Sha, X., Yan, G., Wu, Y., Li, J., Fang, X., 2005. Effect of self-microemulsifying drug delivery systems containing Labrasol on tight junctions in Caco-2 cells. Eur J Pharm Sci. 24, 477-486. Shah, N.V., Seth, A.K., Balaraman, R., Aundhia, C.J., Maheshwari, R.A., Parmar, G.R., 2016. Nanostructured lipid carriers for oral bioavailability enhancement of raloxifene: Design and in vivo study. J. Adv. Res. 7, 423-434. Shugarts, S., Benet, L.Z., 2009. The Role of Transporters in the Pharmacokinetics of Orally Administered Drugs. Pharm Res. 26, 2039-2054. Singh, B., Bandopadhyay, S., Kapil, R., Singh, R., Katare, O., 2009. Self-emulsifying drug delivery systems (SEDDS): Formulation development, characterization, and applications. Crit. Rev. Ther. Drug Carrier Syst. 26, 427-521. Singh, B., Kaur, A., Dhiman, S., Garg, B., Khurana, R.K., Beg, S., 2016. QbD-enabled development of novel stimuli-responsive gastroretentive systems of acyclovir for improved patient compliance and biopharmaceutical performance. AAPS. PharmSciTech. 17, 454-465. Singh, B., Khurana, L., Bandyopadhyay, S., Kapil, R., Katare, O.P., 2011. Development of optimized self-nano-emulsifying drug delivery systems (SNEDDS) of carvedilol with enhanced bioavailability potential. Drug Deliv. 18, 599-612. Singh, B., Kumar, R., Ahuja, N., 2005. Optimizing drug delivery systems using systematic "design of experiments." Part I: fundamental aspects. Crit. Rev. Ther. Drug Carrier Syst 22, 27-105. Singh, D., Rawat, M.S., Semalty, A., Semalty, M., 2012. Rutin-phospholipid complex: an innovative technique in novel drug delivery system- NDDS. Curr. Drug Deliv. 9, 305-314. Song, N.N., Li, Q.S., Liu, C.X., 2006. Intestinal permeability of metformin using single-pass intestinal perfusion in rats. World J. Gastroenterol. 12, 4064-4070. Souza, J.R.R.d., Feitosa, J.P.A., Ricardo, N.M.P.S., Trevisan, M.T.S., Paula, H.C.B.d., Ulrich, C.M., Owen, R.W., 2013. Spray-drying encapsulation of mangiferin using natural polymers. Food Hydrocolloids 33, 10-18. Sun, H., Pang, K.S., 2008. Permeability, transport, and metabolism of solutes in Caco-2 cell monolayers: a theoretical study. Drug Metab Dispos. 36, 102-123. Takeda, T., Tsubaki, M., Kino, T., Yamagishi, M., Lida, M., Itoh, T., Imano, M., Tanabe, G., Muraoka, O., Satou, T., Nishida, S., 2016. Mangiferin induces apoptosis in multiple myeloma cell lines by suppressing the activation of nuclear factor kappa B-inducing kinase. Chem. Biol. Interact. 251, 26-33.

Teng, H., Wu, W., 2012. Mangiferin-berberine salt, manufacturing method and use thereof. PCT/CN2010/000791. Tran, T.H., Ramasamy, T., Truong, D.H., Choi, H.G., Yong, C.S., Kim, J.O., 2014. Preparation and characterization of fenofibrate-loaded nanostructured lipid carriers for oral bioavailability enhancement. AAPS PharmSciTech. 15, 1509-1515. Valicherla, G.R., Dave, K.M., Syed, A.A., Riyazuddin, M., Gupta, A.P., Singh, A., Wahajuddin, Mitra, K., Datta, D., Gayen, J.R., 2016. Formulation optimization of Docetaxel loaded self-emulsifying drug delivery system to enhance bioavailability and anti-tumor activity. Sci. Rep. 6, 26895. van der Merwe, J.D., Joubert, E., Manley, M., de Beer, D., Malherbe, C.J., Gelderblom, W.C., 2011. Mangiferin glucuronidation: important hepatic modulation of antioxidant activity. Food Chem. Toxicol. 50, 808-815. Xia, H.J., Zhang, Z.H., Jin, X., Hu, Q., Chen, X.Y., Jia, X.B., 2013. A novel drug-phospholipid complex enriched with micelles: preparation and evaluation in vitro and in vivo. Int. J. Nanomed. 8, 545-554. Yang, X., Zhao, Y., Chen, Y., Liao, X., Gao, C., Xiao, D., Qin, Q., Yi, D., Yang, B., 2013. Host-guest inclusion system of mangiferin with beta-cyclodextrin and its derivatives. Mater. Sci. Eng. C. Mater. Biol. Appl. 33, 2386-2391. Yusuf, M., Sharma, V., Pathak, K., 2014. Nanovesicles for transdermal delivery of felodipine: Development, characterization, and pharmacokinetics. Int. J. Pharm. Investig. 4, 119-130. Zakeri-Milani, P., Valizadeh, H., Tajerzadeh, H., Azarmi, Y., Islambolchilar, Z., Barzegar, S., Barzegar-Jalali, M., 2007. Predicting human intestinal permeability using single-pass intestinal perfusion in rat. J. Pharm. Pharm. Sci. 10, 368-379. Zhang, B.F., Jun; Chen, Yan, 2013. Antioxidant Effect of Mangiferin and its Potential to be a Cancer Chemoprevention Agent. Lett Drug Des Discov. 10,, 239-244. Zhao, Y., Wang, L., Ma, C., Zhao, K., Liu, Y., Feng, N., 2013. Preparation and characterization of tetrandrine-phospholipid complex loaded lipid nanocapsules as potential oral carriers. Int J Nanomedicine 8, 4169-4181. Zheng, M.S., Lu, Z.Y., 1990. Antiviral effect of mangiferin and isomangiferin on herpes simplex virus. Chin. Med. J (Engl). 103, 160-165.
Figures:

Figure 1: Molecular docking images depicting binding of mangiferin with phosphatidylcholine transfer protein

Figure 2: X-ray diffraction patterns of (A) mangiferin; (B) Phospholipon 90 G; (C); physical mixture of mangiferin and Phospholipon 90 G (D) mangiferin-Phospholipon 90 G complex
1R
Operations: Y Scale Add 8 | Smooth 0.150 | Background 1.000,1.000 | Import
1R - File: 1R.raw - Type: 2Th/Th locked - Start: 4.000 ° - End: 39.984 ° - Step: 0.051 ° - Step time: 5.2 s - Temp.: 25 °C (Room) - Time Started: 6 s - 2-Theta: 4.000 ° - Theta:
Lin
(Cou
nts)
0
10
20
30
40
50
60
70
80
90
100
110
120
130
140
150
160
170
180
190
200
210
220
230
240
250
260
270
280
290
300
310
320
330
340
350
360
370
380
390
400
410
2-Theta - Scale
4 10 20 30 40
d=8.
5064
4
d=7.
3883
9
d=6.
4835
6
d=5.
4595
5
d=5.
1859
2
d=4.
9156
1
d=4.
4631
8
d=4.
2146
4
d=4.
0813
7
d=3.
8532
6
d=3.
6415
1
d=3.
5447
1
d=3.
4331
7
d=3.
3482
2
d=3.
2722
2
d=3.
1161
6
(A)
IIR
Operations: Y Scale Add -38 | Y Scale Add 42 | Y Scale Add 8 | Background 0.000,1.000 | Smooth 0.150 | Import
IIR - File: IIR.raw - Type: 2Th/Th locked - Start: 4.000 ° - End: 39.984 ° - Step: 0.051 ° - Step time: 5.2 s - Temp.: 25 °C (Room) - Time Started: 7 s - 2-Theta: 4.000 ° - Theta:
Lin
(Cou
nts)
0
10
20
30
40
50
60
70
80
90
100
110
120
130
140
150
160
170
180
190
200
210
220
230
240
250
260
270
2-Theta - Scale
4 10 20 30
d=11
.632
51
IIIR
Operations: Y Scale Add 8 | Y Scale Add -42 | Y Scale Add 42 | Background 0.000,1.000 | Smooth 0.150 | Import
IIIR - File: IIIR.raw - Type: 2Th/Th locked - Start: 4.000 ° - End: 39.984 ° - Step: 0.051 ° - Step time: 5.2 s - Temp.: 25 °C (Room) - Time Started: 6 s - 2-Theta: 4.000 ° - Theta
Lin
(Cou
nts)
0
10
20
30
40
50
60
70
80
90
100
110
120
130
140
150
160
170
180
2-Theta - Scale
4 10 20 30
d=12
.043
84
d=8.
3691
0
d=4.
1721
4
IVR
Operations: Y Scale Add -42 | Y Scale Add 42 | Y Scale Add 8 | Background 0.000,0.500 | Smooth 0.150 | Import
IVR - File: IVR.raw - Type: 2Th/Th locked - Start: 4.000 ° - End: 39.984 ° - Step: 0.051 ° - Step time: 5.2 s - Temp.: 25 °C (Room) - Time Started: 14 s - 2-Theta: 4.000 ° - The
Lin
(Cou
nts)
0
10
20
30
40
50
60
70
80
90
100
110
120
130
140
150
160
170
180
190
200
210
220
230
240
250
260
270
280
290
300
310
320
2-Theta - Scale
4 10 20 30
d=11
.555
08
(B)
(D) (C)

Figure 3: DSC thermograms of (A) mangiferin; (B) Phospholipon 90G; (C); physical mixture of mangiferin and Phospholipon 90G (D) Mangiferin-Phospholipon-90G complex (E) Complex loaded nanostructured lipidic systems
(A) (B)
(D) (C)
(E)

Figure 4: FTIR spectra of (A) mangiferin; (B) Phospholipon 90G; (C); Physical mixture of mangiferin and Phospholipon 90G (D) mangiferin Phospholipon 90G complex (E) Complex loaded nanostructured lipidic systems

Figure 5: Scanning electron microscopic pictures of (A) mangiferin, (B) Phospholipon 90G, (C) Physical mixture of mangiferin and Phospholipon 90G (D) mangiferin–Phospholipon 90G complex
A B
C D

Figure 6: Morphological analysis of optimized PLCs-NLCs (A) particle size (B) TEM
Figure 7: Mean percent drug release of mangiferin from various PLCs-NLCs formulations, prepared as per the experimental design.
(A) (B)
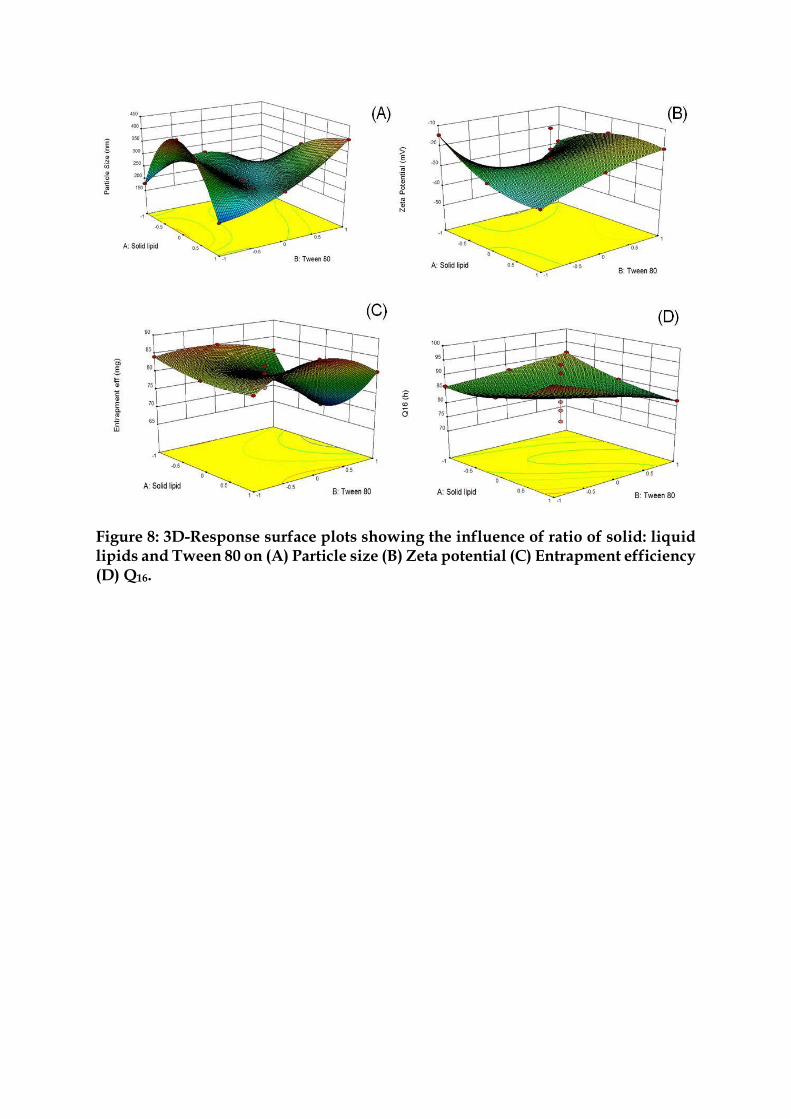
Figure 8: 3D-Response surface plots showing the influence of ratio of solid: liquid lipids and Tween 80 on (A) Particle size (B) Zeta potential (C) Entrapment efficiency (D) Q16.

Figure 9: Overlay plot depicting the design space region and optimized NLCs formulation of mangiferin (flagged).
Figure 10: Bar graphs depicting the Caco-2 cell viability scores with all the treatment formulations viz. Mgf: mangiferin; PL: Phospholipon 90G; PM: physical
(A) (B)
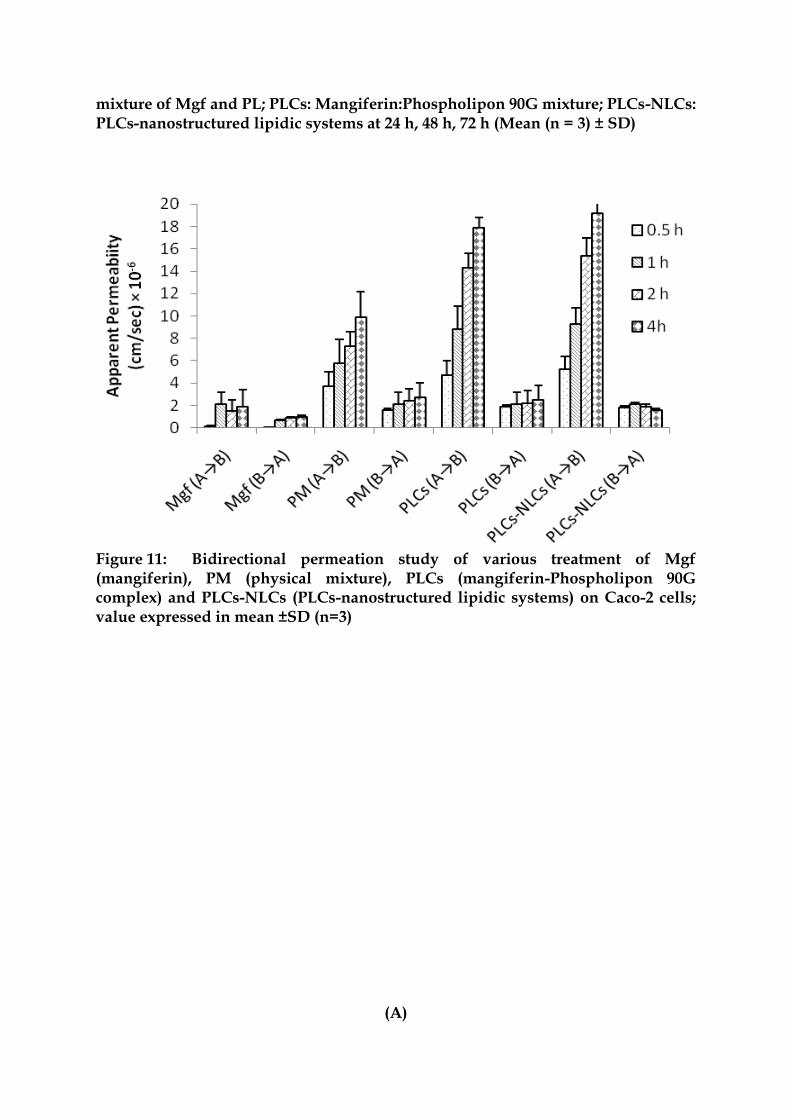
mixture of Mgf and PL; PLCs: Mangiferin:Phospholipon 90G mixture; PLCs-NLCs: PLCs-nanostructured lipidic systems at 24 h, 48 h, 72 h (Mean (n = 3) ± SD)
Figure 11: Bidirectional permeation study of various treatment of Mgf (mangiferin), PM (physical mixture), PLCs (mangiferin-Phospholipon 90G complex) and PLCs-NLCs (PLCs-nanostructured lipidic systems) on Caco-2 cells; value expressed in mean ±SD (n=3)
(A)

(B)
Figure 12: (A) Histograms and fluoescent images observed at 1h and 3 h for Rh-123 loaded NLCs on Caco-2 cells (B) DAPI (Blue fluorscence) indicates the staining of nucleus while Rh-123 (green fluorscence) displays the uptake of NLCs at 1h and 3 h.
1 h
3 h
Rh-123 stained Caco-2 cells
Rh-123 stained Caco-2cells
DIC images of Caco-2cells Histograms

Figure 13: Fluorescence index indicates the inhibition of the MDRI transporters for
Rh-123-loaded formulations and BCRP transporters for DiOC2-loaded
formulations. Each cross bar indicates ±SD (n = 3).
Figure 14: Increase in permeability and absorption paramaeters (in folds) of PLCs-NLCs vis-a-vis Mgf, with and without verapamil across the rat intestine. Each cross
0
10
20
30
40
50
60
70
80
90
100
Flu
oro
sc
en
ce
In
ten
sit
y

bar indicates + 1SD; Peff: effective permeability; Pwall: wall permeability; Fa: fraction of dose absorbed; An: absorption number
Figure 15: Mean plasma concentration-time curve of Mangiferin and Mangiferin-Phospholipon 90 G complex equivalent to 30 mg/mL (n=6), respectively; mean value of ± SD (LOQ obtained for the method in plasma is 36.55 ng/mL).
Supplementary Table 1: QTPP elements for NLCs of Mgf
TPP Elements Target Justification
Dosage form NLCs Selection of the nanostructured lipid-based system helps in augmenting the oral bioavailability
Dosage type Sustained
release
Slower and sustained release characteristics help in superior drug absorption potential
Dosage strength 30 mg Unit dose of the drug recommended for the management of cancer
Route of administration
Oral Recommended route for delivery of Mgf to act as antioxidant

Pharmacokinetics Higher Cmax and
AUC, and extended tmax
Required for achieving higher drug levels into the systemic circulation with enhanced therapeutic action for prolonged period of time
Stability At least 24
months at room temperature
To maintain therapeutic potential of the drug during storage period
Supplementary Table 2: CQAs for the NLCs of Mgf and justifications for them
CQAs Target Is this
a CQA? Justification(s)
Particle size (nm)
< 100 nm Yes
Smaller globule size allows easy penetration of NLCs through gastrointestinal epithelial lining and paracellular pathways; hence was regarded as highly critical.
Zeta potential (mV)
> -15 mV Yes
Optimum value of zeta potential in positive and/or negative sign is desired for maintaining stability of the system, thus considered as critical.
Entrapment efficiency
> 80% Yes
Higher value of entrapment efficiency is desirable for attaining maximal therapeutic response. Hence, it was considered to be highly critical.
Time required for 80% drug release
> 10-12 h Yes
Sustained release characteristic is desired for attaining prolonged drug absorption, hence considered critical for the purpose.

Supplementary Figure 1: Ishikawa fish bone diagram
MPC-loaded NLCs
Measurements Personnel Material
Methods Machines Environment
Log P
Solubility Size
Charge
Drug release
Oil-water partition coefficient
Drug conc. in blood
Formulator
QA Person
QC Person
Chemist
Analyst
Humidity
Temperature
Pressure
Contamination
Heat
Lipid Type
Surfactant Type
Lipid Conc.
Surfactant Conc.
Distilled Water
Drug Purity
Hot emulsification
Cytotoxicity and bidirectional permeability studies
Entrapment Efficiency
Characterization Studies
Pharmacokinetic Studies
UV-Vis Spectro
Reflux condenser
Magnetic Stirrer
Particle Sizer
HPLC Apparatus
Disso
Rota Evaporator Protein-drug interactions
In situ perfusion studies

Supplementary Table 3: Initial risk assessment for MPC-loaded NLCs
CQAs
RISK ESTIMATION MATRIX
API particle
size
Type of phospholipid
Type of surfactant
Amount of solid
lipid
Amount of
emulgent
Reflux temperature
and time
Ultrasonication time and cycles
Type of Stirring
Stirring speed and
time
Homogeniser speed and
time
Assay Low Low Low Low Low Low Low Low Low Low
Particle size (nm)
Low Low Low High High Medium Medium Low Medium Medium
Zeta potential (mV)
Low Low Low High High Medium Medium Low Medium Medium
Encapsulation efficiency
(mg) Low Medium Low High High Medium Medium Low Medium Medium
In vitro drug release (Q16)
Low Low Low High High Low Low Low Low Low
High risk parameter Medium risk parameter Low risk parameter

56
Supplementary Table 4: Optimization studies enlisting the CMAs of NLCs for
their respective low and high levels for employing FCCD
Factors Type Levels
Low (-1) High (+1)
Solid lipid (X1) Numerical 700 mg 900 mg
Tween 80 (X2) Numerical 250 mg 450 mg
Optimization design as per thirteen factors, three level FCCD
Trials Solid lipid Tween 80
F1* 0 0
F2* 0 0
F3 0 1
F4* 0 0
F5 -1 1
F6 0 -1
F7* 0 0
F8 1 1
F9 -1 -1
F10 1 0
F11* 0 0
F12 1 -1
F13 -1 0

57
Supplementary Table 5: Linear regression data for calibration curve of mangiferin in human plasma (n=3)
Parameters Values
Linearity range (ng/band) 50–1000
Regressed equation Y=3.038x + 1062
Correlation coefficient 0.997± 0.0010
Slope± SD 3.04 ± 0.557
LOD 12.01 ng/mL
LOQ 36.46 ng/mL