article in press - lrg.elte.hulrg.elte.hu/oktatas/szubdukcio es kopenyek phd/biro tamas...
TRANSCRIPT
(2006) xxx–xxx
+ MODEL
CHEMGE-15012; No of Pages 22
www.elsevier.com/locate/chemgeo
ARTICLE IN PRESS
Chemical Geology xx
Experimental constraints on element mobility from subductedsediments using high-P synthetic fluid/melt inclusions
Carl Spandler a,⁎, John Mavrogenes a,b, Jörg Hermann a
a Research School of Earth Sciences, Australian National University, Canberra, 0200, Australiab Department of Earth and Marine Sciences, Australian National University, Canberra, 0200, Australia
Accepted 14 October 2006
Editor: S.L. Goldstein
Abstract
A series of hydrothermal piston-cylinder experiments have been performed to determine the composition of representativefluids and fluid/melt/rock interaction in subduction zones. Experiments were conducted under H2O saturated conditions at 2.2 GPaover a temperature range from 600–750 °C. The experiments contained synthetic, trace-element-doped pelitic starting material andfractured quartz chips to trap and preserve synthetic fluid/melt inclusions. Pelite residues from the subsolidus experiments (600–650 °C) consist of an eclogite-facies mineral assemblage including quartz, phengite, epidote, rutile, garnet, amphibole, apatite, andzircon. Coexisting hydrous fluids are expected to be completely buffered for trace elements by this mineral assemblage. At 2.2 GPathe wet solidus for the pelitic starting material is located at approximately 675 °C and hydrous fluid and melt coexist as immisciblephases at least up to 750 °C. Residue phases in the supersolidus experiments (700–750 °C) are garnet, rutile, and zircon, whichsuggest that HREE and HFSE are largely retained in slab residues during very high degrees of H2O saturated melting.
Laser ablation ICPMS analysis and quantification of trapped fluid inclusions from the experiments indicate that subsolidushydrous fluids released from subducted sediments have relatively high LILE contents compared to REE and HFSE, but overall areremarkably dilute. Total solute contents are approximately 5 wt.%, of which N75% is SiO2 and around 15% is Na2O+Al2O3. Theexperimental results are used to show that subducting sedimentary rocks do not undergo significant element loss duringmetamorphic dehydration up to eclogite facies. If these fluids are representative of aqueous fluids released at sub-arc depths thensimple slab dehydration models may be unable to account for element transfer from the slab to arc magmas. Instead, elementrecycling through subduction zones may be a product of complex fluid-melt-rock interaction processes involving multiple slabcomponents.© 2006 Elsevier B.V. All rights reserved.
Keywords: Subduction; Fluid; Melt; Fluid inclusions; Trace elements; LA-ICP-MS
1. Introduction
Volatile and element recycling through subductionzones is fundamental to arc magma-genesis, continental
⁎ Corresponding author. Now at Institute of Geological Sciences,University of Bern, Switzerland. Tel.: +41 31 631 8768.
E-mail address: [email protected] (C. Spandler).
0009-2541/$ - see front matter © 2006 Elsevier B.V. All rights reserved.doi:10.1016/j.chemgeo.2006.10.005
Please cite this article as: Spandler, C. et al. Experimental constraints onfluid/melt inclusions. Chem. Geol. (2006), doi:10.1016/j.chemgeo.2006.10
crust formation and the geochemical evolution of themantle. It is often assumed that hydrous fluids derivedfrom dehydration of the sinking slab not only causemelting of the mantle wedge, but also transport ‘fluidmobile’ elements from the slab to themantle wedge (e.g.,Tatsumi, 2005). By contrast, geochemical and isotopiccriteria are commonly cited as evidence that arc magmascontain multiple slab components including fluid and
element mobility from subducted sediments using high-P synthetic.005
2 C. Spandler et al. / Chemical Geology xx (2006) xxx–xxx
ARTICLE IN PRESS
melt derived from subducted oceanic crust and metase-dimentary rocks (Hawkesworth et al., 1993; Class et al.,2000; Elliott, 2003). In sum, the processes leading tomass transfer from the subducting slab and the nature ofthe transferring agents remain poorly constrained. Adetailed understanding of these processes is crucial fordeveloping accurate geochemical and geophysical mod-els of subduction zones and arc magmatism.
Experimental investigations of subduction-zone pro-cesses have focussed on determining themineral stabilitiesand phase relations of the major rock-types of subductingcrust (Liu et al., 1996; Ono, 1998; Ulmer and Tromms-dorff, 1999; Poli and Schmidt, 2002; Hermann, 2002;Forneris andHolloway, 2003). This information is vital forpredicting release of hydrous fluid from the slab duringsubduction, but as yet there have been very few attempts toexperimentally constrain the nature and composition ofthese fluids. This is primarily due to the technical difficultyof conducting meaningful hydrothermal experiments atconditions relevant to subduction (Kessel et al., 2004;Hack and Mavrogenes, 2006). Critical constraints includeconducting experiments at appropriate pressure (P) andtemperature (T) conditions and ensuring fluids are buf-fered during experiments by a residue with an appropriatehigh-P mineral assemblage. In order to accurately de-termine fluid compositions experiments also need to bedesigned to account for modification of the fluid duringquenching and allow complete separation of fluid andresidue after experiment completion.
Aqueous fluid is regarded as the dominant fluid typeevolved from subducting slabs (Scambelluri and Philip-pot, 2001) and subducted sedimentary rocks areregarded as the principal source of many key elementsthat are enriched in arc magmas (Plank and Langmuir,1993; Elliott, 2003). Therefore, determining accuratesediment-derived fluid and melt compositions at high Pare critical for understanding mass transfer from the slabto mantle wedge. We have conducted a series of high-Phydrothermal piston-cylinder experiments designed toinvestigate the interaction and composition of aqueousfluid, melt, and pelitic sediment during subduction. Theexperiments use large cold-sealed silver capsules, whichallow precise measurement of fluid-rock ratios and re-covery of large volumes of run products for geochemicaland mineralogical analysis. Furthermore, care has beentaken to ensure that appropriate trace-element-bufferingmineral phases were formed in the solid residue duringsubsolidus runs. Fluid compositions and fluid-meltphase relations were determined by analysis of fluidinclusions trapped in quartz during the experiments.Synthetic fluid inclusions trapped during experimentsunder equilibrium conditions represent preserved and
Please cite this article as: Spandler, C. et al. Experimental constraints onfluid/melt inclusions. Chem. Geol. (2006), doi:10.1016/j.chemgeo.2006.1
complete samples of fluids produced at run conditions.Therefore analysis of these inclusions provides unsur-passed information on the nature and composition offluids at elevated P and T. This study is the first to usesynthetic fluid inclusions to quantify representativesubduction-zone fluids.
The experimental results are used to evaluate phaserelations in subducting sedimentary rocks and constrainthe composition of fluids equilibrated with pelitic rocksunder eclogite-facies conditions. These data also placeconstraints on the geochemical evolution of subductingslabs, which has direct consequences for the generationof arc magmatism, global element recycling and theevolution of the mantle and crust.
2. Experimental strategy
To avoid problems associated with recovering andpreserving high-P experimental fluids, we employtechniques of trapping and preserving synthetic fluidinclusions in quartz during piston cylinder experiments.The trapping and subsequent analysis of synthetic fluidinclusions in quartz is routinely used to quantify hydro-thermal fluid compositions and element solubilities atrelatively low P (e.g., Sterner and Bodnar, 1984; Loucksand Mavrogenes, 1999; Simon et al., 2005), but as yethave not been used for high-P experiments. Therefore,we have conducted two preliminary experiments con-taining fractured quartz and water to test the suitabilityof the fluid inclusion technique for modelling subduc-tion-zone conditions. Subsequent experiments alsocontained a pelitic starting material to model fluid-melt-rock interactions under eclogite-facies conditions.Quartz-hosted fluid inclusions recovered from theseexperiments are interpreted to represent quenchedsamples of fluid equilibrated at run conditions. There-fore bulk analysis of these inclusions allows for directquantification of high-P fluids. A significant advantageof this technique is that analytical problems associatedwith modification of the fluid on quenching are largelyavoided.
2.1. Starting material synthesis
Continental-derived materials provide the bulk of thetrace-element budget of subducting sedimentary pilesand hence are most likely to influence the composition ofarc magmas (Rea and Ruff, 1996; Plank and Langmuir,1998). Therefore, for this study a starting material hasbeen synthesized that has a major-element compositionsimilar to average global subducting sediment (GLOSS;Table 1; Plank and Langmuir, 1998) and the average
element mobility from subducted sediments using high-P synthetic0.005

Table 1Composition of the experimental pelite starting material (EPSM), andglobal average subducting sediment (GLOSS)
EPSM GLOSS (P and L)
SiO2 68.35 65.31TiO2 0.66 0.69Al2O3 14.91 13.28FeO 4.63 5.81MnO 0.11 0.36MgO 3.03 2.77CaO 2.41 6.63Na2O 2.57 2.71K2O 2.88 2.27Total 99.55 99.83P 1413 829Sc 56 14.6Ti 3626 4137Mn 802 2788Rb 225 63.8Sr 215 364Y 60 33.2Zr 202 145Nb 57 9.97Cs 241 3.88Ba 1174 865La 163 32.1Ce 68 63.9Nd 60 30.1Sm 66 6.45Eu 61 1.46Gd 58 5.87Dy 55 5.56Er 57 3.26Yb 60 3.08Hf 48 4.53Ta 57 0.70Pb 213 22.2Th 238 7.71U 532 1.87
Note: GLOSS calculated volatile-free from Plank and Langmuir (1998).
3C. Spandler et al. / Chemical Geology xx (2006) xxx–xxx
ARTICLE IN PRESS
upper continental crust (Taylor and McLennan, 1985).The starting material was produced with high levels (50–1500 ppm) of key trace elements using a ‘sol–gel’method (Luth and Ingamells, 1965) in order to eliminateproblems of sluggish reaction of refractory mineralsduring experiments and limitations of analysing lowtrace-element concentrations in run products. Mostmajor elements and all trace elements were combinedas nitrate solutions and mixed with tetraethyl orthosili-cate (Si(C2H5O)4) and slowly dried to a gel. The gel wasthen heated to 1000 °C for 12 hours to drive off thenitrates. The residual powder was then combined withappropriate amounts of Al2O3, TiO2 and MnO powders,finely milled and then fused at 1500 °C and quenched toglass. Multiple analyses of the glass for major elements(by EDS) and trace elements (by LA-ICPMS) indicate
Please cite this article as: Spandler, C. et al. Experimental constraints onfluid/melt inclusions. Chem. Geol. (2006), doi:10.1016/j.chemgeo.2006.10
homogeneity within analytical precision. Iron was thenadded to the glass in the form of synthetic fayalite. Thefayalite and glass mix was ground for 30 min to form afine powder. In order to promote garnet growth in theexperiments, 10–50 μm pyrope seeds from the DoraMaira whiteschists (Hermann, 2003) were added as 2%of the starting mix. The final starting material compo-sition, herein labelled experimental pelite startingmaterial (EPSM), is presented in Table 1.
2.2. Experimental setup
All experimental runs were conducted in a 15.9 mmend-loaded piston cylinder apparatus at the ResearchSchool of Earth Science (RSES), Australian NationalUniversity (ANU). The capsules and experimentalassemblies were specifically designed to investigatehydrothermal conditions under relatively high-P, low-Tconditions. Large silver capsules (Fig. 1) were used inorder to maximize the capsule volume and avoidproblems of H loss and Fe alloying. These capsuleshave an inner volume of around 500 mm3 after sealing,which is an order of magnitude larger than capsulestypically used in a standard 12.7 mm piston-cylinderassembly. The capsules were sealed using a precisely-machined silver lid (Fig. 1) that was cold pressed ontothe capsule using the technique described by Hack andMavrogenes (2006). A specially-designed swaging toolwas used to seal the lid onto the capsule by folding thethin upper walls of the capsule over the outer rim of thelid (Fig. 1). To accommodate the large capsule, anassembly of a talc outer sleeve, graphite heater and thin(0.5 mm) talc inner sleeve was used with pyrophyllitespacers above and below the capsule. Temperature wascontrolled using a type-B thermocouple (Pt94Rh6/Pt70Rh30) and a Eurotherm temperature controller andis accurate to within 5 °C. Care was taken to locate thecapsule within the hotspot of the assembly, although thehigh thermal conductivity of silver and large volume ofsilver and water in the experiments serve to minimize Tgradients across the assembly. Furthermore, the ther-mocouple tip was designed to be in direct contact withthe silver lid in order to minimize the difference betweenmeasured and actual run temperatures. Extensive testingof a similar capsule design by Hack and Mavrogenes(2006) has shown that the Twithin the capsule and at thethermocouple site differs by less than 10 °C. Nonethe-less, examination of run products indicated that slight Tgradients (b10 °C) existed within the capsule duringexperimental runs, as discussed below. Microprobeanalysis of a thermocouple tip after an experiment hasconfirmed that alloying between the thermocouple wire
element mobility from subducted sediments using high-P synthetic.005

Fig. 1. A. Design and specification of the capsule and assembly used in the piston-cylinder experiments. All measurements are in millimetres.B. Expected conditions within the capsule during experimental runs. Note, the slight temperature gradient through the capsule promotes fluidcirculation leading to dissolution and reprecipitation of quartz, and precipitation of crystals (phengite, Na-mica, rutile, apatite) on the capsule walls.C. Capsule after experiment quenching. Note, crystals precipitated during the experiment and during quenching of the experiment are found on thecapsule walls. The quartz has completely re-precipitated at the ends of the capsule and now contains primary fluid/melt inclusions.
4 C. Spandler et al. / Chemical Geology xx (2006) xxx–xxx
ARTICLE IN PRESS
and the silver was insignificant, and therefore does notcompromise the accuracy of the thermocouple. Thedifference between the measured and capsule T isassumed to be 10 °C for all experiments.
Pressure corrections of −10% are commonly as-sumed in talc-assembly piston-cylinder experiments ofshort duration (e.g., Green et al., 1966). However, Boseand Ganguly (1995) demonstrated that nominal Papproaches the actual sample P over time as the cellcompacts and friction is eliminated. In all of our ex-periments the nominal P continually dropped for the first3 to 4 days by a total of around 10%. The P wascontinually adjusted back to starting nominal P andremained steady after 4 days. As talc is not expected todehydrate under the P–T conditions of these experi-ments and all experiments are in excess of 4 days induration, it is expected that all assembly friction waseliminated during the runs. Therefore, no friction cor-rection is applied to the P measurements. Oxygenfugacity was not buffered in the experiments. However,some preliminary experiments were loaded with H2Oand either Ni or NiO. In either case a mixture of Ni andNiO was recovered from these runs, which indicates thatoxygen fugacity conditions were close to the Ni–NiObuffer during the experiments (log fO2 of −18 at650 °C).
All experiments were loaded with 200–330 ml ofMilli-Q® purified water and 240–520 mg of clear
Please cite this article as: Spandler, C. et al. Experimental constraints onfluid/melt inclusions. Chem. Geol. (2006), doi:10.1016/j.chemgeo.2006.1
inclusion-free quartz. In order to promote fluid-inclusionentrapment in healing fractures during the runs, the quartzwas pre-fractured by heating to 350 °C and quenching inwater. To prevent deformation and rupturing of thecapsule during ramping and quenching of the experimen-tal runs, P and T were increased or decreased synchro-nously along the relevant pure-water isochore at a rate of50 °C per min. This procedure also minimizes decrepi-tation of fluid inclusions on quenching.
2.3. Details of experimental runs
Two initial experimental runs containing only waterand quartz were conducted to test trapping and pre-servation of fluid inclusions at run conditions and duringquenching, and to test the P and T calibrations of the cell(Table 2). The masses of the loaded capsules before andafter the runs were very similar, indicating that the cap-sules had not leaked during the runs. All otherexperiments (PFI 2-7) contained approximately 60 mgof the EPSM together with the pre-fractured quartz andwater (Fig. 1). The EPSM was compressed into a secondinner silver capsule, which was only loosely crimpedclosed. Confining the starting powder in the unsealedinner capsule promotes metamorphic mineral growth atrun conditions without limiting the interaction betweenthe fluid and EPSM. Furthermore, separation of theEPSM from the bulk of the fluid avoids significant
element mobility from subducted sediments using high-P synthetic0.005

Table 2Details of experimental runs
Run no. Pressure (GPa) Temperature (°C) Duration (hours) Fluid/EPSM ratio Major phases Accessory phases
Test 1 1.0 650 149 – fTest 2 1.5 650 119 – fPFI 3 2.2 600 452 4.48 ep, phg, cld, Na–Mgsil⁎, tlc, (f ) zrc, ap, gt, rtPFI 2 2.2 650 340 3.72 gt, ep, phg, amp, cld, (f ) zrc, ap, rtPFI 7 2.2 675 310 N1.7 gt, rt, phg, (m, f ) zrc, ep, ky⁎, chdPFI 4 2.2 700 260 4.55 gt, rt, (m, f ) zrc,PFI 6 2.2 750 120 4.06 gt, rt, (m, f ) zrc, mz
Notes: Quartz was present in all runs. ⁎ = possible metastable phases. Mineral abbreviations, f = fluid, m = melt, gt = garnet, rt = rutile, zrc = zircon,ap = apatite, ep = epidote, cld = chloritoid, phg = phengite, Na–Mgsil = Na–Mg sheet silicate, tlc = talc, amp = amphibole, ky = kyanite, mz =monazite. Phases in italics were identified by both SEM and XRD.
5C. Spandler et al. / Chemical Geology xx (2006) xxx–xxx
ARTICLE IN PRESS
contamination of the pelitic residue by phases formedfrom the fluid on quenching of the experiment andallows the EPSM residue to be easily recovered after theexperiment.
Five successful experiments were performed as atemperature series from 600 °C to 750 °C at 2.2 GPa(Table 2). In all of these experiments fluid/rock ratiosexceeded 3:1 in order to retain an aqueous fluid phase atrun conditions. In all experiments except PFI 7 therewas no mass loss from the capsules during the runs,indicating that fluid leakage had not occurred. Somefluid was lost from PFI-7 during the run, as the finalcapsule weight was 100 mg lower than the initial mass.After the experiments, the capsules were pierced bydrilling a small hole through the base of the capsule.Once pierced, fluid was extracted from the capsule witha micro-syringe and then weighed. Fluid volumes ofbetween 50 and 200 mg were extracted for all runs(including PFI 7), confirming that all experiments weresaturated with hydrous fluid. The capsules were thenopened and the EPSM residue and quartz chips re-moved. Material precipitated on the capsule wallsduring quenching was also collected for petrographicanalysis. A small amount of the EPSM residue wasmounted in 25.4 mm diameter epoxy discs for exam-ination and analysis. EPSM residue from the subsolidusrun was also used for XRD analysis. 1 mm-thick slicesof doubly polished quartz chip were prepared for in-clusion analysis.
2.4. Timing of fluid inclusion entrapment
For several experiments thermocouple shearing oc-curred during the first few days, leading to loss oftemperature control. Although these experiments wereimmediately quenched and are regarded as failed ex-periments, the capsule contents were examined in detailto help constrain timing of fluid inclusion formation.The quartz chips from these experiments had not
Please cite this article as: Spandler, C. et al. Experimental constraints onfluid/melt inclusions. Chem. Geol. (2006), doi:10.1016/j.chemgeo.2006.10
experienced significant healing and fluid inclusion en-trapment, even after up to 3 days at run conditions.However, SEM and XRD analysis of the residues ofthese failed experiments indicates that eclogite-faciesminerals such as almandine, phengite, rutile, epidote,and amphibole had already grown. By contrast, theoriginal fractured quartz chips loaded into the successfulexperiments (5–10 days run duration) had completelydissolved and reprecipitated at the top and bottom of thecapsules during these experiments (Fig. 1B,C). We in-terpret this feature to derive from fluid circulation drivenby the slight temperature gradient (b10 °C) across thecapsule. This fluid circulation caused dissolution ofquartz from the central slightly hotter zone of the cap-sule and precipitation at the cooler top and bottom of thecapsule. The quartz recrystallised in this manner con-tains abundant fluid inclusions. Collectively, theseresults verify that fluid inclusion entrapment occurredwhile the fluid composition was buffered by a high Pmineral assemblage. The failed and successful experi-ments were quenched under similar conditions, butwell-formed fluid inclusions were only found in quartzchips from the successful experiments. This observationindicates that most of the inclusions in the successfulexperiments were trapped prior to quenching. Therefore,we are confident that the fluid inclusions preserved inquartz from all successful experiments represent sam-ples of fluid trapped at run conditions and in equilibriumwith high-P mineral assemblage.
3. Analytical techniques
3.1. Fluid inclusion heating/freezing and densitycalculations
Homogenization temperatures of quartz-hosted fluidinclusions were measured using a USGS fluid inclusionheating/freezing stage mounted on a video-equippedoptical microscope at the Department of Earth and
element mobility from subducted sediments using high-P synthetic.005

Table 3LA-ICPMS specifications and operating conditions
Instrument specifications
ArF 193 nm EXCIMER laser interfaced with an Agilent 7500quadrupole ICPMS via a custom-built sample cell and teflon sampletubing
Operating conditions Glass analyses Fluid inclusion analyses
Laser pulse rate 5 Hz 10 HzLaser power 100 mJ 120 mJLaser aperture onsample
70 μm 30–70 μm
Carrier gas flow 0.3 l/s He, 0.95 l/s Ar 0.3 l/s He, 0.95 l/s ArMax. oxideproduction
b0.4% Th0+/Th+ b0.4% Th0+/Th+
Note: Laser aperture for fluid inclusions adjusted based on inclusion size.
6 C. Spandler et al. / Chemical Geology xx (2006) xxx–xxx
ARTICLE IN PRESS
Marine Sciences (DEMS), ANU. Individual inclusionswere heated multiple times to precisely measure thehomogenization temperatures (Th). Temperature wascalibrated against the freezing and critical points of purewater and is accurate to ±1 °C. The density of inclusionswas calculated using the measured Th, the PTV data forpure water from Haar et al. (1984) and the MacFlinCorsoftware program (Brown and Hagemann, 1995). Ef-fects of thermal expansion and contraction of quartz onfluid inclusion densities are expected to be less that 1%at the run conditions (Hack and Mavrogenes, 2006), sothese effects are ignored in fluid density calculations.
3.2. Solution chemistry
Solutions extracted from the capsules were dilutedinto a 2% HNO3 matrix down to a 100:1 concentration.Prior to analysis and dilution, 1000 ppm of In was addedin solution to serve as an internal standard. The solutionswere analysed for In, Al, K, Mg, Ca, and Na usinga Varian Vista Pro axial inductively-coupled plasmaatomic emission spectrometer (ICP-AES) housed atDEMS, ANU. Samples were calibrated against a blankand 10 ppm and 100 ppmmulti-element standards. Threereplicates were collected per sample. All element con-centrations were well above the detection limits of 2–100 ppb.
For trace element (Rb, Sr, Y, In, Cs, Ba, La, U)analyses, samples diluted to 100:1 and 1000:1 concen-tration were run on a Vista Ultramass quadrupole ICPMass Spectrometer at DEMS, ANU. Data was calibrat-ed against a blank and 100 ppb multi-element standard.Five replicates were collected per sample, with 25 scansper replicate and 195 ms scan time. All elements mea-sured were above the detection limits of 0.5–2 ppb,except Y and U in PFI 2. Yttrium and U in PFI 2 arebelow detection limits, so the relevant detection limitsare regarded as maximum concentrations.
3.3. Identification of residual minerals
Due to their very fine grainsize (b30 μm) the EPSMresidues and quenched mineral precipitates from thecapsule walls were examined using a JEOL 6400 scan-ning electron microscope (SEM) housed at the ElectronMicroscope Unit, Research School of BiologicalSciences, ANU. Quantitative major element analysisof garnet and rutile, and qualitative analysis of all otherminerals was conducted using an energy-dispersivespectrometer equipped to the SEM. Accelerating volt-age, beam current, and counting time were set at 15 kV,1 nA and 100 s respectively.
Please cite this article as: Spandler, C. et al. Experimental constraints onfluid/melt inclusions. Chem. Geol. (2006), doi:10.1016/j.chemgeo.2006.1
Residue powders from experiments PFI 2, PFI 3 andPFI 7 were also analysed for major (modeN5%) mineralphases by XRD. The EPSM residue samples were groundin an agate mortar with acetone and applied onto a lowbackground holder (oriented quartz crystal). Powderdiffraction data were collected at room T with a SiemensD501 diffractometer at DEMS, ANU. The diffractometerwas equipped with a curved graphite monochromator, ascintillation detector, andCuKα radiationwas used. Scanswere recorded in one pass from 2° to 70° 2-theta, using astep width of 0.02° and a scan speed of 1° per min. Resultswere interpreted using the Siemens software packageDiffracplus Eva 2000, which uses the PDF database.
3.4. Bulk compositions of residues, quenched melt, andcapsule materials
Approximately 50% of the EPSM residual powdersfrom subsolidus experiments PFI 2 and PFI 3 were fusedwith Li tetraborate (Li2B4O7) flux (flux-sampleratio=3:1) at 1100 °C for 30 min and then quenched.The glasses were thenmounted in epoxy and polished foranalysis. The Li-Borate glasses, together with quenchedmelt in runs PFI 4, PFI 6, and PFI 7 were analysed formajor elements using a defocused beam by EDS using aJEOL 6400 SEM, as described above. Acceleratingvoltage, beam current, and counting time were again setat 15 kV, 1 nA, and 100 s respectively. At least 5 analysesof each sample were conducted to confirm samplehomogeneity.
Trace-element concentrations of the quenched meltand Li-borate glasses were acquired by laser ablation,inductively-coupled plasma mass spectrometry (LA-ICPMS) at the RSES, ANU. Instrument details andoperating conditions are given in Table 3. Counting time
element mobility from subducted sediments using high-P synthetic0.005

Fig. 2. Time resolved LA-ICPMS spectra of a quartz-hosted fluidinclusion analysis from run PFI 2 (650 °C). For graphical purposesonly selected elements are displayed. The first 26 s of the profilerepresents the gas background without the laser on. The laser is fired at26 s, causing elevated element counts for 4 s due to contamination onthe surface of the quartz crystal. Clean quartz is subsequently ablateduntil the inclusion is sampled (grey field) from 35 to 45 s, after whichclean quartz is again ablated. Host subtraction from the inclusion isconducted by extrapolation between the quartz background sampledbefore and after the inclusion.
7C. Spandler et al. / Chemical Geology xx (2006) xxx–xxx
ARTICLE IN PRESS
was 20 s for the background and 60 s for sample anal-ysis. Instrument calibration was against NIST 612 glassusing the reference values tabulated by Spandler et al.(2003). 27Al was employed as the internal standardisotope, based on Al2O3 concentrations previously mea-sured by EDS. At least 4 analyses of each sample wereconducted.
Capsule materials were analysed for a range of ele-ments (Fe, Nb, Ta, Zr, Ti, Al, U, Th, Ag, Pb) both beforeand after experimental runs in order to test for metalalloying with the silver capsule during the runs. Sectionsof capsule material were analysed by LA-ICPMS usinga 32 μm spot size and 107Ag and 109Ag as internalstandard isotopes. The concentrations of all elementsexcept Pb were below detection (b0.05 ppm) in capsulematerials both before and after experimental runsindicating that there was insignificant alloying of thesemetals with the capsule during the experiments. Bycontrast, Pb was found to be enriched by around 25times immediately adjacent to the inner wall of thecapsule and remain elevated compared to starting Pblevels in the capsule at least 200 μm distant from theinner capsule wall. Due to this Pb loss to the capsule, Pbdata presented is only used for calculating solid/fluidpartition coefficients.
3.5. Fluid/melt inclusion geochemistry
Experimental fluid/melt inclusions trapped in quartzwere analysed for 20 elements by LA-ICPMS, as de-scribed in Table 3. Analyses were again standardizedagainst NIST 612 glass. The time resolved spectra ob-tained from ablation of a large fluid inclusion from PFI 2is given in Fig. 2. Spectra of the clean quartz host oneither side of the inclusions were used for host sub-traction during data reduction. Inclusion analyses closeto the quartz surface (b10 μm) were not used due topotential elemental interferences from surface con-tamination (Fig. 2). In order to achieve a sufficientanalytical signal from the inclusions dwell times foreach element (except 29Si) were set to 25 ms. 29Si wascounted for 10 ms in each mass sweep. Consequently,the time for one complete mass sweep was approxi-mately 0.5 s. As ablation of most fluid inclusions pro-duced a short (b5 s) transient signal, these long masssweep and element dwell times may have been insuf-ficient for completely representative sampling of all ofthe analysed inclusions (Pettke et al., 2000). Therefore,at least 30 fluid inclusions were analysed from each ofthe subsolidus experiments (PFI 2 and PFI 3) and at least20 inclusions were analysed from each of the super-solidus experiments (PFI 4 and PFI 6). Analyses of 16
Please cite this article as: Spandler, C. et al. Experimental constraints onfluid/melt inclusions. Chem. Geol. (2006), doi:10.1016/j.chemgeo.2006.10
inclusions from PFI 3 and 12 inclusions from PFI 2produced distinct peaks of elevated element counts thatwere unaffected by surface contamination in the time-resolved spectra (Fig. 2). These inclusions producedrelatively consistent element ratios and were used tocalculate the composition of the fluid in equilibriumwith the EPSM at the experimental run conditions.Details of the internal standardization are presented inthe Results section below. Further details of fluid in-clusion analysis and quantification are discussed inGünther et al. (1998), Heinrich et al. (2003) and Allanet al. (2005).
4. Results
4.1. Test experiments
Experimental run TEST 1 was designed to check theP–T calibration of the experimental setup. Nominal runconditions were set to 1.0 GPa and 650 °C in order totrap pure water fluid inclusions with densities of b1.0 g/cm3. Subsequent Th measurements of these inclusionswere used to calculate the density of the trapped fluidsand hence provide an independent constraint on the P–T
element mobility from subducted sediments using high-P synthetic.005

8 C. Spandler et al. / Chemical Geology xx (2006) xxx–xxx
ARTICLE IN PRESS
conditions of the run. The equation-of-state of water ofBrodholt and Wood (1993) was used to relate fluiddensity to P–T conditions as this equation-of-state isconsistent with P–T–V data from synthetic fluid in-clusions trapped at ≥1.0 GPa (Brodholt and Wood,1994; Withers et al., 2000).
The quartz chip recovered from TEST 1 containednumerous (N100) fluid inclusions. Most inclusionsrange in size from 5 to 30 μm and are clearly isolatedfrom surrounding inclusions. A vapour bubble occupiesaround 10% of the volume of all inclusions at room T(Fig. 3A). Homogenisation temperatures (Th) measuredfor 31 inclusions range from 148.5–160.1 °C, althoughonly three large inclusions had Th of over 155 °C. Thesethree inclusions are expected to have suffered stretchingduring quenching of the run and hence were not used forfluid density calculations. The average Th of the re-maining 28 inclusions is 151 °C, which equates toa fluid density of 0.916 g/cm3. The isochore corre-sponding to this fluid density intersects a pressure valueof 0.99 GPa at 650 °C, which is remarkably consistentwith the nominal run conditions (1.0 GPa, 650 °C). This
Fig. 3. Photomicrographs of synthetic fluid and melt inclusions trapped in qububbles from experiment TEST 1 (1.0 GPa, 650 °C). B. high-density (N1.0 g/C. High-density fluid inclusions from experiment PFI 3 (2.2 GPa, 600 °C).density fluid inclusions from experiment PFI 2 (2.2 GPa, 650 °C). Note, th(2.2 GPa, 675 °C) with abundant large fluid/melt inclusions. F. Cluster of(2.2 GPa, 700 °C). G. Large rectangular fluid/melt inclusion within a trail oflarge vapour bubbles and complex daughter crystals in the inclusions.
Please cite this article as: Spandler, C. et al. Experimental constraints onfluid/melt inclusions. Chem. Geol. (2006), doi:10.1016/j.chemgeo.2006.1
result confirms the accuracy of the P–T calibration of theexperimental setup and indicates that most of the fluidinclusions were trapped at run conditions and survivedquenching without significant modification.
Experiment TEST 2 was designed to trap and pre-serve fluid inclusions of density N1.0 g/cm3. Pure H2Ofluid inclusions trapped under the nominal run condi-tions of 1.5 GPa and 650 °C should have a density of1.03 g/cm3. Quartz chips recovered from the run con-tained numerous fluid inclusions trapped along healedfractures that range in size from 5–50 μm (Fig. 3B).Vapour bubbles are absent from all inclusions at room T,indicating that the inclusions consist of fluid of densitiesN1.0 g/cm3. This result further confirms the accuracy ofthe P–T calibrations and proves the capability fortrapping and preserving primary fluids as inclusions inhigh-P experiments.
4.2. EPSM-bearing experiments
Five successful experiments containing the EPSMwere conducted at 2.2 GPa and temperatures ranging
artz during experiments. A. Pure water inclusions with distinct vapourcm3) pure water inclusions from experiment TEST 2 (1.5 GPa, 650 °C).Note, the distinct daughter crystals in the inclusion in focus. D. High-e cluster of daughter crystals. E. Quartz chip from experiment PFI 7large quasi-rectangular fluid/melt inclusions from experiment PFI 4smaller fluid/melt inclusions from PFI 4 (2.2 GPa, 700 °C). Note, the
element mobility from subducted sediments using high-P synthetic0.005

9C. Spandler et al. / Chemical Geology xx (2006) xxx–xxx
ARTICLE IN PRESS
from 600–750 °C. These experiments allow us to definethe phase relations and fluid-saturated solidus of theEPSM, and have provided samples of fluid and melt (asfluid inclusions or as quenched glass) formed at runconditions. Analysis of these fluid and melt samplesallows us to constrain the composition of representativesubduction-zone fluids and fluid/solid partition coeffi-cients for a range of elements.
4.2.1. Phase relations
4.2.1.1. PFI 3 (600 °C, 2.2 GPa). Due to the finegrainsize (∼1–10 μm), residues of the EPSM extractedfrom run PFI 3 were analysed by XRD and SEM todetermine phase relations. The residue is dominated byquartz and needle-like aggregates of chloritoid, phengite,epidote, and talc. Occasional large (up to 30 μm) bladesof a Na–Mg sheet silicate, close to saponite in com-position, also occur in the mineral aggregates and pre-cipitated on the outer capsule wall. Accessory phasesinclude b5 μm-sized grains of apatite, zircon, and rutile,and possibly submicron grains of U-oxide. However,several grains of euhedral rutile up to 100 μm across werealso found associated with quartz-and phengite-rich ma-terial that precipitated on the walls of the outer capsule.This indicates that significant fluid-assisted mass transferhad occurred within the capsule during the experiment.Only a few of the pyrope grains that were added to thestarting mix to promote garnet growth have observable(∼1–2 μm) discontinuous overgrowths of almandine-rich garnet. Therefore garnet is interpreted to be stableunder these conditions, but garnet growth was inhibitedby the low T of the run.
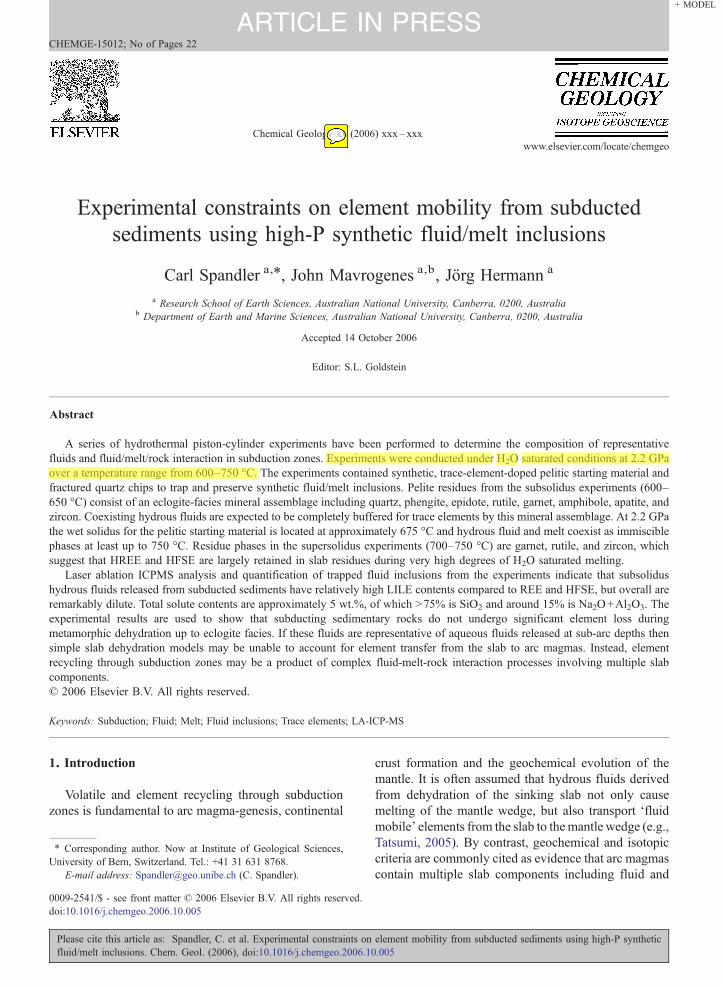
4.2.1.2. PFI 2 (650 °C, 2.2 GPa). There is no evi-dence of melting of the EPSM in run PFI 2, indicatingthat run conditions were subsolidus. However, as in runPFI 3, fluid-driven mass transport had caused precipi-tation of silica spheres with minor phengite and apatiteon the walls of the large outer capsule. Major mineralsof the EPSM residue contained within the inner capsuleinclude quartz, phengite, epidote, amphibole, and chlor-itoid. TheNa–Mg sheet silicate and talc present in run PFI3were not found in PFI 2 andwe suggest that these phasesmay have reacted to form amphibole. Apatite, zircon,rutile and possibly U-oxide are again accessory minerals.All of the pyrope seeds are rimmed with almandine-richgarnet that is easily distinguishable in backscatter electronimages (Fig. 4A). The pronounced growth of garnet iscompensated by a marked decrease in the proportion ofchloritoid compared to run PFI 3, indicating that chlo-ritoid reacts to garnet with increasing T.
Please cite this article as: Spandler, C. et al. Experimental constraints onfluid/melt inclusions. Chem. Geol. (2006), doi:10.1016/j.chemgeo.2006.10
4.2.1.3. PFI 7 (675 °C, 2.2 GPa). Two types of re-sidue were recovered from the inner capsule of runPFI 7. Small amounts of the residue were similar to theresidue from run PFI 2, consisting of quartz, phengite,pyrope seeds with almandine-rich rims, and accessorychloritoid, zircon, epidote, and rutile. These residuematerials have not undergone melting. By contrast, theonly mineral phases present in the remainder of theresidue are garnet (pyrope seeds and almandine-richrims) and accessory kyanite, rutile, and zircon. Thesephases are set within a matrix material that could not beexamined by SEM due to dissolution of the matrixduring sample polishing. Analysis of exposed inclusionsin quartz (see below) reveals that the matrix material islikely to be melt that did not form a stable glass duringquenching. Comparisons of these residues to residuesfrom runs PFI 4 and PFI 6 (Fig. 4) also indicate that thepelitic starting material had undergone partial melting inrun PFI 7.
4.2.1.4. PFI 4 (700 °C, 2.2 GPa) and PFI 6 (750 °C,2.2 GPa). Quenched rhyolitic glass occurs through-out the residue materials from experiments PFI 4 andPFI 6 (Fig. 4C,D,E), confirming that the water satu-rated solidus for the EPSM is below 700 °C at 2.2 GPa.Mineral phases are garnet, rutile, and trace zircon inPFI 4, and garnet, rutile, trace zircon, and trace mon-azite in PFI 6. Garnet grains from both runs includepyrope seed overgrown by thick (up to 20 μm)almandine-rich rims, as well as almandine-rich grainsgrown without a pyrope seed crystal. The almandine-rich garnets occasionally contain clusters of sub-micrometre zircon grains.
4.2.2. Subsolidus fluid compositions
4.2.2.1. Description of inclusions. Quartz from bothPFI 3 (600 °C) and PFI 2 (650 °C) experiments containsabundant fluid inclusions in inclusion trails or as isolatedinclusions (e.g., Fig. 3C,D). Most of the larger inclusions(N50 μm) are dark and contain vapour bubbles of varyingsize, indicating that these inclusions had suffered de-crepitation during quenching. This inclusion type wasavoided during chemical analysis. Most other inclusionsare 5–30 μm in size, translucent, and lack a vapour phase.However, these inclusions usually contain tiny daughtercrystals of unknown composition. The inclusions in PFI 3tend to contain one or more tabular daughter crystals(Fig. 3C), whereas inclusions in PFI 2 contain fineclusters of needle-like daughter crystals that have grownon the inclusion walls (Fig. 3D). These inclusions weretargeted during LA-ICPMS analysis as they are deemed
element mobility from subducted sediments using high-P synthetic.005
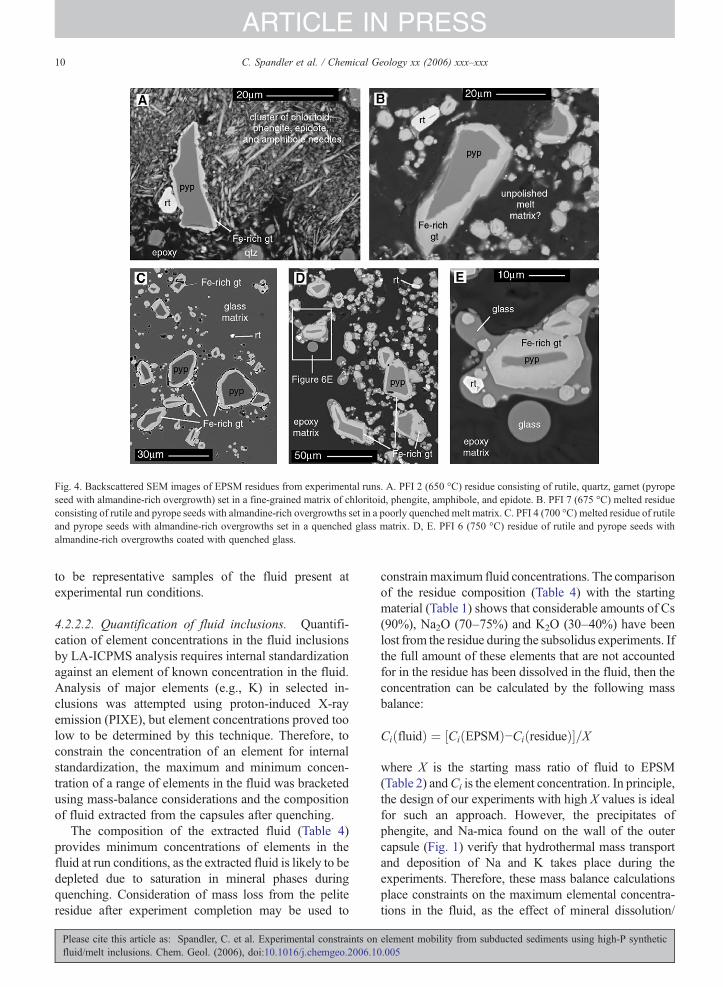
Fig. 4. Backscattered SEM images of EPSM residues from experimental runs. A. PFI 2 (650 °C) residue consisting of rutile, quartz, garnet (pyropeseed with almandine-rich overgrowth) set in a fine-grained matrix of chloritoid, phengite, amphibole, and epidote. B. PFI 7 (675 °C) melted residueconsisting of rutile and pyrope seeds with almandine-rich overgrowths set in a poorly quenched melt matrix. C. PFI 4 (700 °C) melted residue of rutileand pyrope seeds with almandine-rich overgrowths set in a quenched glass matrix. D, E. PFI 6 (750 °C) residue of rutile and pyrope seeds withalmandine-rich overgrowths coated with quenched glass.
10 C. Spandler et al. / Chemical Geology xx (2006) xxx–xxx
ARTICLE IN PRESS
to be representative samples of the fluid present atexperimental run conditions.
4.2.2.2. Quantification of fluid inclusions. Quantifi-cation of element concentrations in the fluid inclusionsby LA-ICPMS analysis requires internal standardizationagainst an element of known concentration in the fluid.Analysis of major elements (e.g., K) in selected in-clusions was attempted using proton-induced X-rayemission (PIXE), but element concentrations proved toolow to be determined by this technique. Therefore, toconstrain the concentration of an element for internalstandardization, the maximum and minimum concen-tration of a range of elements in the fluid was bracketedusing mass-balance considerations and the compositionof fluid extracted from the capsules after quenching.
The composition of the extracted fluid (Table 4)provides minimum concentrations of elements in thefluid at run conditions, as the extracted fluid is likely to bedepleted due to saturation in mineral phases duringquenching. Consideration of mass loss from the peliteresidue after experiment completion may be used to
Please cite this article as: Spandler, C. et al. Experimental constraints onfluid/melt inclusions. Chem. Geol. (2006), doi:10.1016/j.chemgeo.2006.1
constrainmaximum fluid concentrations. The comparisonof the residue composition (Table 4) with the startingmaterial (Table 1) shows that considerable amounts of Cs(90%), Na2O (70–75%) and K2O (30–40%) have beenlost from the residue during the subsolidus experiments. Ifthe full amount of these elements that are not accountedfor in the residue has been dissolved in the fluid, then theconcentration can be calculated by the following massbalance:
CiðfluidÞ ¼ ½CiðEPSMÞ−CiðresidueÞ�=X
where X is the starting mass ratio of fluid to EPSM(Table 2) andCi is the element concentration. In principle,the design of our experiments with high X values is idealfor such an approach. However, the precipitates ofphengite, and Na-mica found on the wall of the outercapsule (Fig. 1) verify that hydrothermal mass transportand deposition of Na and K takes place during theexperiments. Therefore, these mass balance calculationsplace constraints on the maximum elemental concentra-tions in the fluid, as the effect of mineral dissolution/
element mobility from subducted sediments using high-P synthetic0.005

Table 4Major and trace element concentrations of EPSM residues from subsolidus experiments, calculated maximum element concentrations in the fluid andcomposition of extracted from the capsules after run quenching (minimum fluid composition)
Run no. PFI 3 PFI 2 PFI 3 PFI 2 PFI 3 PFI 2
Temp. (°C) 600 650 600 650 600 650
Residue Residue Max. fluid concentration Max. fluid concentration Min. fluid concentration Min. fluid concentration
EDS (wt.%) Calculated (ppm) Solution ICP-AES (ppm)SiO2 73.70 72.87 Si nr nr – –TiO2 0.77 0.75 Ti nr nr – –Al2O3 12.83 13.16 Al 2430 2500 112 30FeO 5.28 4.90 Fe nr nr – –MgO 3.11 2.94 Mg nr 200 20 24CaO 2.29 2.25 Ca 210 290 75 27Na2O 0.77 0.66 Na 3000 3800 1869 2733K2O 1.79 1.96 K 2000 2100 298 450Sum 100.54 99.49
LA ICP-MS (ppm) Calculated (ppm) Solution ICP MS (ppm)In⁎ 1026 1010
P 783 833 P 141 156 – –Sc 50 51 Sc 1.3 1.4 – –Ti 3383 3191 Ti 54 117 – –Mn 624 634 Mn 40 45 – –Rb 74 103 Rb 34 33 1.13 2.08Sr 155 142 Sr 13 20 1.34 0.83Y 54 57 Y 1.3 0.8 0.04 b0.004Zr 199 201 Zr 0.7 0.3 – –Nb 46 48 Nb 2.4 2.4 – –Cs 20 26 Cs 50 58 2.49 4.56Ba 764 933 Ba 92 65 4.41 0.67La 127 131 La 8.0 8.6 0.13 0.03Ce 53 53 Ce 3.4 4.0 – –Nd 47 49 Nd 2.9 3.0 – –Sm 53 59 Sm 3.0 1.9 – –Eu 48 50 Eu 3.0 3.1 – –Gd 48 50 Gd 2.3 2.2 – –Dy 47 49 Dy 1.8 1.6 – –Er 49 52 Er 1.8 1.6 – –Yb 53 56 Yb 1.6 1.2 – –Hf 41 43 Hf 1.7 1.5 – –Ta 51 54 Ta 1.3 0.9 – –Pb 88 73 Pb 28 38 – –Th 211 218 Th 6.0 5.4 – –U 417 428 U 26 28 0.38 b0.01
Notes: See text for details of analytical techniques and calculation of maximum element concentrations in the fluid. Quenched solutions extractedfrom the experiments were diluted 1:100 and 1:1000 for ICPAES and ICP MS analyses respectively. ⁎ Prior to dilution, In was added to the solutionat a nominal level of 1000 ppm to check instrument and dilution accuracy. nr = not resolvable.
11C. Spandler et al. / Chemical Geology xx (2006) xxx–xxx
ARTICLE IN PRESS
precipitation by fluid cycling during the experimentcannot be accounted for. It is worth noting that there is aslight increase in the SiO2 content in the residue whencompared to the starting material, indicating that the re-sidue gained some SiO2 that was likely transported to theinner capsule by quartz solution-precipitation during therun. Immobile element concentrations (e.g., Zr, HREE) inthe bulk residue and the EPSM starting material aresimilar (Tables 1 and 4), which indicates that residuemasswas close to conservative during the experiments (i.e., Si
Please cite this article as: Spandler, C. et al. Experimental constraints onfluid/melt inclusions. Chem. Geol. (2006), doi:10.1016/j.chemgeo.2006.10
addition was closely matched by ‘mobile element’ lossfrom the residue) and hence this process does not sig-nificantly influence the calculation of the maximum fluidconcentration of K, Na, and Cs. Also pelite residues arecontained within the inner silver capsule (Fig. 1), which isopen to fluid interaction. However, only a small fractionof the fluid will be present within the inner capsule at anytime, so contamination of the EPSM residue by crystalsformed from the fluid on quenching is considerednegligible.
element mobility from subducted sediments using high-P synthetic.005

12 C. Spandler et al. / Chemical Geology xx (2006) xxx–xxx
ARTICLE IN PRESS
Fluid major-element concentrations that are con-strained to within an order of magnitude by these maxi-mum and minimum techniques for both PFI 2 and PFI 3are Na and K (Fig. 5). Potassium in the fluid is bufferedby phengite in both experiments and phengite is ex-pected to be stable in pelitic rocks throughout theeclogite-facies (Domanik andHolloway, 1996; Hermannand Green, 2001). The constraints on K contents in thefluid are between 300 and 2000 ppm for PFI 3 andbetween 450 and 2100 ppm for PFI 2 (Table 4). There-fore, we have chosen K concentrations of 1000 ppm and1500 ppm as internal standards to quantify the fluidinclusion analyses in PFI 3 and PFI 2 respectively. Thesevalues are estimates of the K content of fluids, but areconstrained by the calculated range in fluid compositions(Fig. 5) and are consistent with expected K solubilitywith T (Manning, 2004a). Importantly, the ranges ofelement concentrations in fluid inclusions quantified inthis manner almost exclusively fall within the maximumand minimum concentration constraints for the fluidcomposition (Fig. 5), which further supports the Kconcentrations chosen for internal standardization.
4.2.2.3. Fluid compositions. The average fluid inclu-sion compositions are presented in Table 5. Silica con-tents of the fluids were calculated from data on silicasolubility in H2O (Manning, 1994), although these valuesare regarded as minimum values as silica solubility inNa–Al–Si bearing systems is expected to be significantlyhigher (Manning, 2004b). Relative errors for the fluidcompositions are generally around 50% for most ele-ments, although higher standard deviation values (up to
Fig. 5. Multi-element plots of fluid inclusion compositions and fluid compositgrey line represents the maximum fluid composition as constrained from masfluid composition as constrained by the composition of fluids extracted fromrepresents the average fluid inclusion composition using values of 1000 ppmKThe error bars given on each element represents one standard deviation froinclusion analytical reproducibility. The dark grey rectangles for Na and Atransition, based on thermodynamic calculations of Manning (1998).
Please cite this article as: Spandler, C. et al. Experimental constraints onfluid/melt inclusions. Chem. Geol. (2006), doi:10.1016/j.chemgeo.2006.1
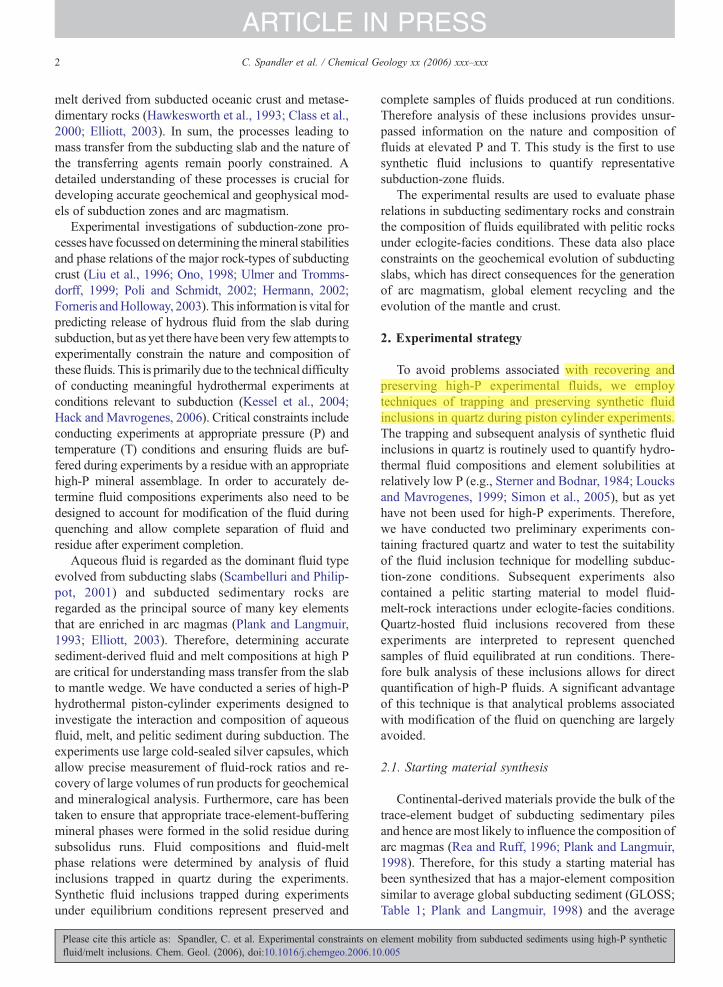
94%) are reported for some elements (e.g., U, Th). Thehigh variance for these elements is largely due to lowconcentrations in the fluid inclusions which areapproaching analytical detection limits, but may also beartefacts of the analytical techniques used, such as usinglong dwell times for measuring the short transient signalproduced by fluid inclusion ablation (Pettke et al., 2000).Nonetheless, even considering all of these uncertaintiesin fluid composition, it is clear that the fluids are rela-tively dilute; a premise consistent with the small pro-portion of daughter phases in the fluid inclusions(Fig. 3C,D). Fluid compositions at 600 °C (PFI 3) and650 °C (PFI 2) contain approximately 4.0 and 5.5 wt.%solutes respectively, most of which (predicted ∼75%) isSiO2. The fluids have similar concentrations for mostelements except the 650 °C fluid contains significantlyhigher large-ion lithophile element (LILE; K, Na, Rb, Sr,Ba, Cs) and Al contents. Garnet-hosting elements Y, Gd,and Yb are higher in the 600 °C fluid, which is probablyan artefact of sluggish garnet growth in the low-T run.Compared to the EPSM, the fluids have relatively highCs and Na contents and very low La, Th, U, and Zrcontents (Fig. 5). Normalized concentrations of Ba aresignificantly lower than other LILE. Relative concentra-tions of Nb are higher than Ti or Ta, (Fig. 6) leading toelevated Nb/Ta in the fluid compared to the EPSM.
4.2.3. Supersolidus fluid and melt compositionsSections of the quartz chips recovered from experi-
ment PFI 7 (675 °C) are crowded with large (∼1 mm)interconnecting inclusions (Fig. 3E). The inclusionsoften contain a vapour bubble of varying size and fine
ion constraints for (A) PFI 3 (600 °C) and (B) PFI 2 (650 °C). The uppers balance calculations and the lower grey line represents the minimumthe capsule after quenching. See text for details. The solid black lineand 1500 ppmK as internal standards for PFI 3 and PFI 2 respectively.
m the calculated fluid inclusion compositions, based on inclusion-to-l represent concentrations in fluid released at the blueschist-eclogite
element mobility from subducted sediments using high-P synthetic0.005

Table 5Average element concentrations (ppm) of fluids from subsolidus experiments and calculated solid/fluid partition coefficients (D)
Fluid composition(ppm)
Fluid composition(ppm)
D (solid/fluid)mass balance
D(solid/fluid)residue
D(solid/fluid)range
D(solid/fluid)mass balance
D(solid/fluid)residue
D(solid/fluid)range
Run no. PFI 3 PFI 2 PFI 3 PFI 3 PFI 3 PFI 2 PFI 2 PFI 2
Temp. (°C) 600 1SD % 650 1SD % 600 600 600 650 650 650
Si⁎ 15,500 22,000Al 1409 41 1930 38 52 48 34–91 37 36 26–62Ca 764 48 772 78 18 21 11–41 19 21 9–98Na 1735 58 2826 57 6.5 3.3 2.1–22 3.0 1.7 0.6–12K 1000 0 1500 0 19 15 15–19 12 11 11–12Ti 29 57 22 71 120 120 74–286 160 150 85–565Rb 4.7 41 7.6 34 43 16 11–77 26 14 10–41Sr 4.0 36 14 44 49 39 28–80 12 10 7–24Y 0.26 59 0.15 85 230 210 131–558 400 380 205–2663Zr 0.38 45 0.41 59 530 520 361–962 490 490 306–1198Nb 0.61 43 0.71 45 89 76 53–159 77 68 47–142Cs 13 44 23 53 14 1.5 1.1–29 6.8 1.1 0.7–19Ba 10 31 15 30 114 77 59–167 75 62 48–108La 0.23 59 0.14 93 700 550 347–1724 1200 930 485–16,700Gd 0.81 43 0.37 79 67 59 41–121 150 134 75–743Yb 0.73 61 0.31 78 78 73 45–206 190 180 101–876Ta 0.37 40 0.32 63 150 140 98–252 170 170 104–478Pb 1.3 57 1.8 63 – 57 36–132 – 49 30–132Th 0.52 83 0.24 94 450 410 222–2688 990 910 468–16,500U 0.35 90 0.44 86 1500 1190 627–15,200 1200 970 523–8633Total solutes ∼4.0 ∼5.5
Notes: Fluid compositions represent the average fluid inclusion composition standardised on the basis of 1000 ppm and 1500 ppm K for PFI 3 and PFI 2 respectively. Errors given are one standarddeviation in percentage. See text for details of method of partition coefficient (D) calculation. Bold values are preferred D values. U and Pb values are regarded as maximum and minimum valuesrespectively, due to the possible formation of U-oxide in the pelite residues and Pb alloying with the silver capsule. ⁎ Si contents were calculated from Manning (1994), but are regarded as mimimumvalues for this system (Manning, 2004a). Total solutes are expressed as wt.% oxides.
13C.Spandler
etal.
/Chem
icalGeology
xx(2006)
xxx–xxx
ARTICLE
INPRESS
Please
citethis
articleas:
Spandler,
C.et
al.Experim
entalconstraints
onelem
entmobility
fromsubducted
sediments
usinghigh-P
syntheticfluid/m
eltinclusions.
Chem
.Geol.
(2006),doi:10.1016/j.chem
geo.2006.10.005
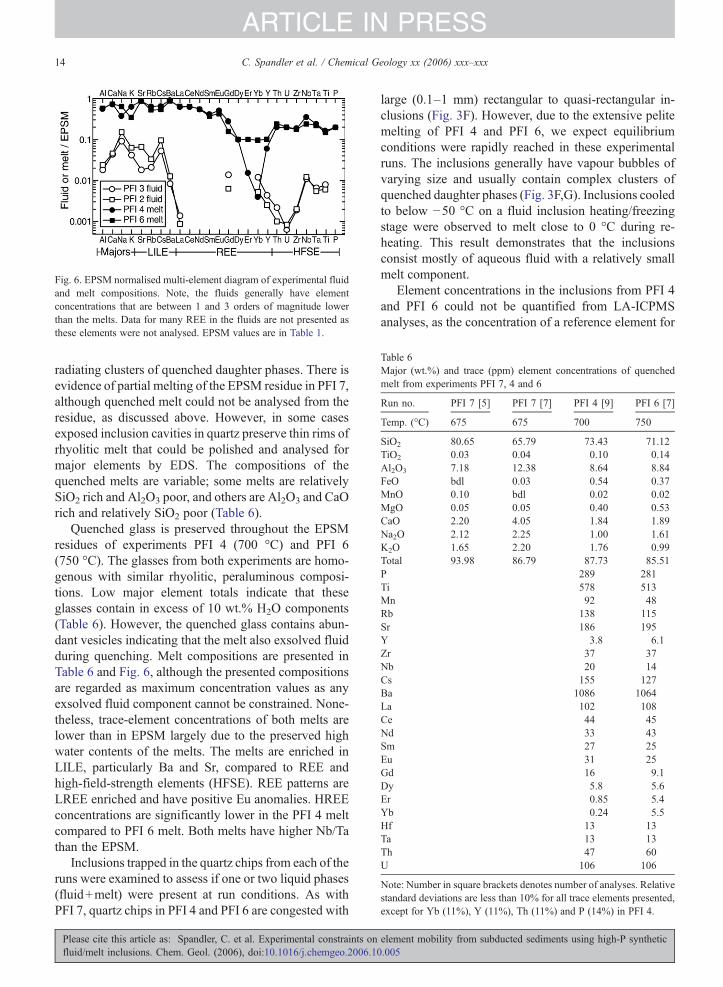
Fig. 6. EPSM normalised multi-element diagram of experimental fluidand melt compositions. Note, the fluids generally have elementconcentrations that are between 1 and 3 orders of magnitude lowerthan the melts. Data for many REE in the fluids are not presented asthese elements were not analysed. EPSM values are in Table 1.
Table 6Major (wt.%) and trace (ppm) element concentrations of quenchedmelt from experiments PFI 7, 4 and 6
Run no. PFI 7 [5] PFI 7 [7] PFI 4 [9] PFI 6 [7]
Temp. (°C) 675 675 700 750
SiO2 80.65 65.79 73.43 71.12TiO2 0.03 0.04 0.10 0.14Al2O3 7.18 12.38 8.64 8.84FeO bdl 0.03 0.54 0.37MnO 0.10 bdl 0.02 0.02MgO 0.05 0.05 0.40 0.53CaO 2.20 4.05 1.84 1.89Na2O 2.12 2.25 1.00 1.61K2O 1.65 2.20 1.76 0.99Total 93.98 86.79 87.73 85.51P 289 281Ti 578 513Mn 92 48Rb 138 115Sr 186 195Y 3.8 6.1Zr 37 37Nb 20 14Cs 155 127Ba 1086 1064La 102 108Ce 44 45Nd 33 43Sm 27 25Eu 31 25Gd 16 9.1Dy 5.8 5.6Er 0.85 5.4Yb 0.24 5.5Hf 13 13Ta 13 13Th 47 60U 106 106
Note: Number in square brackets denotes number of analyses. Relativestandard deviations are less than 10% for all trace elements presented,except for Yb (11%), Y (11%), Th (11%) and P (14%) in PFI 4.
14 C. Spandler et al. / Chemical Geology xx (2006) xxx–xxx
ARTICLE IN PRESS
radiating clusters of quenched daughter phases. There isevidence of partial melting of the EPSM residue in PFI 7,although quenched melt could not be analysed from theresidue, as discussed above. However, in some casesexposed inclusion cavities in quartz preserve thin rims ofrhyolitic melt that could be polished and analysed formajor elements by EDS. The compositions of thequenched melts are variable; some melts are relativelySiO2 rich and Al2O3 poor, and others are Al2O3 and CaOrich and relatively SiO2 poor (Table 6).
Quenched glass is preserved throughout the EPSMresidues of experiments PFI 4 (700 °C) and PFI 6(750 °C). The glasses from both experiments are homo-genous with similar rhyolitic, peraluminous composi-tions. Low major element totals indicate that theseglasses contain in excess of 10 wt.% H2O components(Table 6). However, the quenched glass contains abun-dant vesicles indicating that the melt also exsolved fluidduring quenching. Melt compositions are presented inTable 6 and Fig. 6, although the presented compositionsare regarded as maximum concentration values as anyexsolved fluid component cannot be constrained. None-theless, trace-element concentrations of both melts arelower than in EPSM largely due to the preserved highwater contents of the melts. The melts are enriched inLILE, particularly Ba and Sr, compared to REE andhigh-field-strength elements (HFSE). REE patterns areLREE enriched and have positive Eu anomalies. HREEconcentrations are significantly lower in the PFI 4 meltcompared to PFI 6 melt. Both melts have higher Nb/Tathan the EPSM.
Inclusions trapped in the quartz chips from each of theruns were examined to assess if one or two liquid phases(fluid+melt) were present at run conditions. As withPFI 7, quartz chips in PFI 4 and PFI 6 are congested with
Please cite this article as: Spandler, C. et al. Experimental constraints onfluid/melt inclusions. Chem. Geol. (2006), doi:10.1016/j.chemgeo.2006.1
large (0.1–1 mm) rectangular to quasi-rectangular in-clusions (Fig. 3F). However, due to the extensive pelitemelting of PFI 4 and PFI 6, we expect equilibriumconditions were rapidly reached in these experimentalruns. The inclusions generally have vapour bubbles ofvarying size and usually contain complex clusters ofquenched daughter phases (Fig. 3F,G). Inclusions cooledto below −50 °C on a fluid inclusion heating/freezingstage were observed to melt close to 0 °C during re-heating. This result demonstrates that the inclusionsconsist mostly of aqueous fluid with a relatively smallmelt component.
Element concentrations in the inclusions from PFI 4and PFI 6 could not be quantified from LA-ICPMSanalyses, as the concentration of a reference element for
element mobility from subducted sediments using high-P synthetic0.005

15C. Spandler et al. / Chemical Geology xx (2006) xxx–xxx
ARTICLE IN PRESS
internal standardization could not be constrained. None-theless, element ratios of inclusions were determinedand allow evaluation of fluid and melt proportions basedon comparison with fluid-melt mixing models (Fig. 7).Modelling of fluid-melt mixing was conducted usingelement ratios of the quenched glasses and fluid fromPFI 2 as respective melt and fluid components. Exper-iment PFI 2 was conducted at lower temperatures andunder subsolidus conditions. Therefore, strictly speak-ing the use of the fluid composition from PFI 2 isnot appropriate for modelling fluid compositions at
Fig. 7. Element ratio plots distinguishing fluid and melt components in incluquenched glass and PFI 2 fluid compositions are also plotted with number10=10:90, 5=5:95, and 1=1:99. The scatter of data for the inclusions from Pof fluid and melt. In this case the inclusions represent random mixtures of flurun conditions. See text for further details.
Please cite this article as: Spandler, C. et al. Experimental constraints onfluid/melt inclusions. Chem. Geol. (2006), doi:10.1016/j.chemgeo.2006.10
supersolidus conditions. However, temperature differ-ences between experiment PFI 2 and experiments PFI 4and PFI 6 are only 50 and 100 °C respectively, so for thepurposes of determining fluid phase relations usingelement ratios that vary over several log units (Fig. 7),we regard the PFI 2 fluid composition to be generallyrepresentative of the fluid phases in the supersolidusexperiments. Examining element ratios that are stronglyfractionated by fluid and melt also minimizes uncertain-ties related to the representative modelled compositions.The data for populations of inclusions from both
sions from PFI 4 (700 °C) and PFI 6 (750 °C). Mixing lines betweens corresponding to melt-fluid mixing ratios of 50=50:50, 25=25:75,FI 4 and PFI 6 indicate that the inclusions contain variable proportionsid and melt and hence fluid and melt coexisted as immiscible phases at
element mobility from subducted sediments using high-P synthetic.005

16 C. Spandler et al. / Chemical Geology xx (2006) xxx–xxx
ARTICLE IN PRESS
experiments clearly show that the inclusions havevariable compositions. As discussed above, equilib-rium conditions are expected for these experiments,so these variations are not regarded as artefacts ofnon-equilibrium conditions, Instead, the variations areconsistent with varying proportions of melt and fluid(Fig. 7). The modelled mixing trends indicate thatmost of the inclusions contain in excess of 50%hydrous fluid in PFI 4 and 90% hydrous fluid in PFI 6,which is consistent with the heating/freezing observa-tions. More importantly, these results show that theinclusions represent random mixtures of fluid and meltthat were trapped in quartz during the experiments.Therefore, two coexisting immiscible liquid phases(melt+ fluid) were present at run conditions for bothPFI 4 and PFI 6.
The composition of fluids coexisting with melt inPFI 4 and PFI 6 could not be precisely constrained. How-ever, based on normalised melt compositions (Fig. 6) andelement ratios presented in Fig. 7 the fluids are expected tohave contained relatively high Cs, Rb, Na, and K contents.
4.3. Element partitioning
4.3.1. Solid/fluidElement partitioning between bulk solid residue and
subsolidus fluid was calculated using two methods. Thefirst method, labelled the residue method, is simply theratio of the extrapolated subsolidus fluid composition to
Fig. 8. Calculated solid/fluid partition coefficients for subsolidus fluid from erepresent the total range of partitioning values calculated when including errocalculated by the mass balance and residue method overlap for all elements ecalculated using the residue method are given as error bars. Partitioningrespectively, due to Pb alloying with the capsule and possible formation of U-partition coefficient calculation.
Please cite this article as: Spandler, C. et al. Experimental constraints onfluid/melt inclusions. Chem. Geol. (2006), doi:10.1016/j.chemgeo.2006.1
the analysed EPSM residue composition (Table 4). Par-tition coefficients were calculated by the second method(mass-balance method) using the following formula;
Solid=fluid partition coefficient ðDÞ¼ Ci EPSM−X ðCi fluidÞ
Ci fluid
where X is the starting mass ratio of fluid to EPSM(Table 2) and Ci is the element concentration. As Pballoys with the capsule during the experiments, only theresidue method was used to calculate Pb partitioning.Calculated partition coefficients are given in Table 5.
Partition coefficients calculated using the residuemethod are potentially inaccurate, as this method doesnot account for mineral precipitation on the capsulewalls during the experiments. The precipitated alkalisheet silicates on the capsule walls of both PFI 3 and PFI2 explains the significantly lower partition coefficientscalculated for Na, Rb, and Cs using the residue method(Table 5, Fig. 8). Nonetheless, the partition coefficientsproduced using the two methods are remarkably similarfor all other elements, indicating that most elements arenot significantly affected by fluid transport andprecipitation during the experiments. Furthermore, thecorrespondence of the datasets reinforces the overallaccuracy of the methods used to quantify fluid com-positions and hence the calculated partitioning values.In particular, the close correspondence of immobile
xperiments (A) PFI 2 (600 °C) and (B) PFI 3 (650 °C). The grey fieldsrs on the determined fluid compositions (Table 5). The ranges of valuesxcept Rb, Cs and Pb. Therefore separate error ranges for Rb, Cs and Pbdata for Pb and U are regarded as maximum and minimum valuesoxides in the pelite residues. See text for details on the methods used for
element mobility from subducted sediments using high-P synthetic0.005

17C. Spandler et al. / Chemical Geology xx (2006) xxx–xxx
ARTICLE IN PRESS
element partitioning values (e.g., Zr) supports our as-sumption of mass conservation in the pelite residue forconstraining fluid compositions (see ‘Quantification offluid inclusions’). Partition coefficients calculated usingthe mass-balance method are preferred (Table 5). Itshould be noted that the solid/fluid partitioning data forU is regarded as a maximum value, as U-oxides are mostlikely present in the residue of the subsolidus experi-ments. These U-oxides probably form due to the highinitial U content of the EPSM starting material (Table 1)and hence, U content of the fluid remained bufferedduring the experiments.
Examination of the partitioning data reveals that allelements preferentially partition into the solid residuerather than the fluid at subsolidus conditions (Table 5;Fig. 8). The effect of T over the range of investigatedexperimental conditions does not dramatically change thepartitioning behaviour, although the solid/fluid par-titioning of Cs, Rb, Na, and Sr decreases slightly withincreasing T. In particular, Sr solubility increases withrespect to other elements with increasing T. Overall, Naand Cs are the most fluid compatible elements, followedby K, Ca, Rb, and Sr. Elements that strongly partition intothe solid residue are La, Th, and Zr. Partition coefficientsfor the garnet-hosting elements Gd, Yb, and Y are con-sidered to be minimum values due to the sluggish garnetgrowth in the ESPM residues. Barium and Pb have similarpartition coefficient to Nb, Ti, and Ta, and hence are muchmore compatible in the solid than other LILE. Niobium isslightly more compatible in the fluid than Ti or Ta.
4.3.2. Melt/fluid partitioningDespite the recognition that fluid and melt coexisted
in experiments PFI 4 and PFI 6, the fluid compositionsfrom these runs could not be quantified and hence pre-cise melt/fluid partition coefficients cannot be calculat-ed. From petrographic observations, it is likely that theEPSM underwent extensive (∼90%) melting to leave aresidue of only garnet, rutile, and accessory zircon(±monazite). Therefore, rough constraints on partition-ing for some elements can be made using the compo-sition and proportion of melt and starting material andthe volume of the fluid phase. Estimated partition coef-ficients for melt/fluid are likely to be 5–10 for K, Rb,and Cs, and ∼50 for Sr and Ba.
5. Discussion
5.1. Phase relations in subducted pelitic rocks
It is well recognized that accurate experimentalmodelling of phase relations under subduction-zone
Please cite this article as: Spandler, C. et al. Experimental constraints onfluid/melt inclusions. Chem. Geol. (2006), doi:10.1016/j.chemgeo.2006.10
conditions is difficult to accomplish (e.g., Forneris andHolloway, 2003). The relatively low T conditions inhibitgrowth of equilibrium mineral assemblages and mayallow persistence of metastable phases. The experimentsconducted in this study were designed to minimize meta-stable mineral growth by using a synthetic homogenousstarting material, using pyrope crystals to seed garnetgrowth, using high fluid/solid ratios, and conducting longduration runs. The mineral assemblage formed in theexperiments (garnet, quartz, phengite, epidote, chloritoid,zircon, rutile, apatite, ±talc, ±amphibole) is comparablewith mineral assemblages predicted by phase equilibriaand found in natural samples of eclogite-facies pelites(Poli and Schmidt, 2002; Spandler et al., 2003). Anexception is the Na–Mg sheet silicate (saponite) in PFI 3(600 °C), which, based on textural and geochemicalgrounds, is expected to be metastable and probablyreacted out to form stable amphibole at higher T (650 °C).Na-rich sheet silicates of similar composition have beendescribed from Na-amphibole synthesis studies con-ducted under similar P–Tconditions (e.g., Pawley, 1992).
Recent work has shown that the trace-element in-ventory of eclogite-facies pelitic rocks is controlled bygarnet (HREE, Y), rutile (Nb, Ta), epidote (REE, Sr, Th,Pb), zircon (Zr, Hf), phengite (LILE), and apatite (REE,P, Sr) (Hermann and Green, 2001; Spandler et al., 2003).All of these phases are present in the subsolidus ex-periments, so the trace-element composition of the fluidsin the subsolidus experiments was controlled by anequilibrium mineral assemblage. The sluggish growth ofgarnet in experiment PFI 3 (600 °C) may be the cause ofthe high Yb, Gd, and Y contents (relative to La) of thefluids analysed from this experiment.
The presence of melt and melted residue together withunmelted residue in experiment PFI 7 indicate that con-ditions were close to the water-saturated (wet) solidus. Theheterogeneous nature of the EPSM residue in PFI 7may bedue to slight (b10 °C) T gradients that may have existed inthe capsule. Therefore, the wet solidus at 2.2 GPa isinterpreted to be at 675 °C (±10 °C). The variable com-position of the melt in the melted residue indicates thatmelting was non-equilibrium. Similar heterogeneities inmelt compositions from close to the wet solidus were alsofound in an experimental study of high-P pelite melting byNichols et al. (1996). The kyanite in the melted residue issuggested to be a product of incongruent melting of alu-minous minerals such as phengite or epidote. By contrast,melt and residues produced in experiments at 700 and750 °C are homogenous.
Nichols et al. (1994) defined the wet solidus fornatural red clay at close to 650 °C at 2.0 GPa. Theseconditions are consistent with our results and the
element mobility from subducted sediments using high-P synthetic.005
18 C. Spandler et al. / Chemical Geology xx (2006) xxx–xxx
ARTICLE IN PRESS
experimentally determined wet solidus for granitic rocks(Stern and Wyllie, 1973; Huang and Wyllie, 1981). Bycontrast, Johnson and Plank (1999) determined the wetsolidus of metalliferous pelagic clay to be 775 °C at2.0 GPa. This difference in the location of the solidus islikely to be due to differences in bulk compositions ofthe starting materials used (Nichols et al., 1996), andpossible lack of detection of melt or loss of fluid fromthe low T experiments of Johnson and Plank (1999), assuggested by Schmidt et al. (2004). The starting materialused in this study was modelled on the composition ofterrestrial sediments, which are the major source of traceelements in subducting sedimentary columns (Plank andLangmuir, 1998). Therefore, the determined position ofthe wet solidus is important for understanding elementrecycling through subduction zones.
A fundamental advantage of the experimental tech-nique employed in this study is that samples of ex-perimental fluids are trapped and isolated as inclusionsin quartz at run conditions. Subsequent observation andanalysis of these inclusions in the supersolidus experi-ments (PFI 4 and 6) has confirmed that coexisting fluidand melt were present at least 75 °C above the wetsolidus at 2.2 GPa. It is noteworthy that the scatter inelement ratios measured from the supersolidus inclu-sions (Fig. 7) decreases with increasing T. This featuremay be a consequence of the progressive merging offluid and melt compositions with increasing T approach-ing the closing of the two-phase field (Bureau andKeppler, 1999). Nonetheless, the presented data indicatethat the second critical end-point for pelitic rocks is wellabove 2.2 GPa.
The high fluid/EPSM ratio used in our experiments(Table 2) produced very high degrees (∼90%) of meltingin runs conducted above the wet solidus. The meltsexamined in this study were not completely mineralbuffered (e.g., no epidote or mica in the residue) and thusmay have limited applicability to conditions of sedimentmelting in subduction zones. However, the EPSM hassimilar major element and Ti and Zr contents to peliticsediments (Table 1), so the presence of rutile, zircon andgarnet in the residue demonstrates that these phases mayremain stable in subducted sedimentary rock even underextreme melting conditions. Rutile, zircon and garnet arethe primary hosts for Ti, Nb, Ta, Zr, Hf, and HREE inhigh-P rocks (Hermann, 2002; Zack et al., 2002; Rubattoand Hermann, 2003; Spandler et al., 2003), whichaccounts for the relatively low HREE and HFSE contentof the melt from PFI 4 and PFI 6 (Fig. 6). Consequently,high degrees of melting in the slab are likely to causepronounced trace-element fractionation leaving anHFSE- and HREE-enriched residue.
Please cite this article as: Spandler, C. et al. Experimental constraints onfluid/melt inclusions. Chem. Geol. (2006), doi:10.1016/j.chemgeo.2006.1
5.2. Composition of subsolidus fluid in subduction zones
It is often assumed that aqueous fluid released fromsubducting rocks have an important role in elementalrecycling through subduction zones, but as yet thecompositions of such fluids are poorly known. Theaccuracy of our determined fluid compositions can beevaluated by comparison with expected fluid composi-tions determined from previous experimental and ther-modynamic studies and from data from natural samples.The Na and Al contents of eclogite facies fluid cal-culated from thermodynamic properties (Manning,1998) are remarkably similar to the Na and Al contentsof our experimental fluids, as shown in Fig. 5. TheLREE, Ti and Zr content of the fluids are also consistentwith the expected low Ce contents (0.43 ppm) ofallanite-saturated fluids at 600 °C (Hermann, 2002), andcalculated Ti and Zr contents of eclogite-facies fluids(Fig. 9; Green and Adam, 2003; Rubatto and Hermann,2003; Audétat and Keppler, 2005). In particular, the Tidata correspond very well with the expected Ti sol-ubility in albite-bearing hydrous fluid, as reported byAntignano and Manning (2005) and Audétat andKeppler (2005). Collectively, these data comparisonsconfirm the accuracy of the internal standardization ofthe fluid inclusion data. Our fluid compositions havelow solute contents (∼5 wt.%), and it is expected thatfluids derived from mafic rocks at similar P–T con-ditions in the slab will be similarly dilute (e.g., Greenand Adam, 2003; Manning, 2004a)
All of our EPSMexperiments contain residual rutile andzircon, so the Ti and Zr contents of the fluids and melts canbe directly compared to data from other rutile and zirconsaturated experiments (Fig. 9). The Ti and Zr contents ofthe supersolidus melts are consistent with concentrationsexpected for low-T rhyolite. Ti solubility in pure H2O isaround an order ofmagnitude lower than for solute-bearingaqueous fluids, whereas the Ti contents of rutile-saturatedmelts are about an order of magnitude higher than aqueousfluids at the same temperature. A similar trend is observedfor Zr contents of zircon saturated melts and fluids.
Our partitioning data indicate that all trace elementsare more compatible in eclogite-facies pelite than in acoexisting hydrous fluid phase. This result conflictswith data obtained from diamond trap experiments ofJohnson and Plank (1999), who reported many elementspartitioning in favour of the fluid phase. Johnson andPlank (1999) conducted experiments under similar Pand T conditions to our experiments, but reported solid/fluid partition coefficients for a range of elements thatare between 1 and 3 orders of magnitude lower than thepartition coefficients reported in this study. We attribute
element mobility from subducted sediments using high-P synthetic0.005
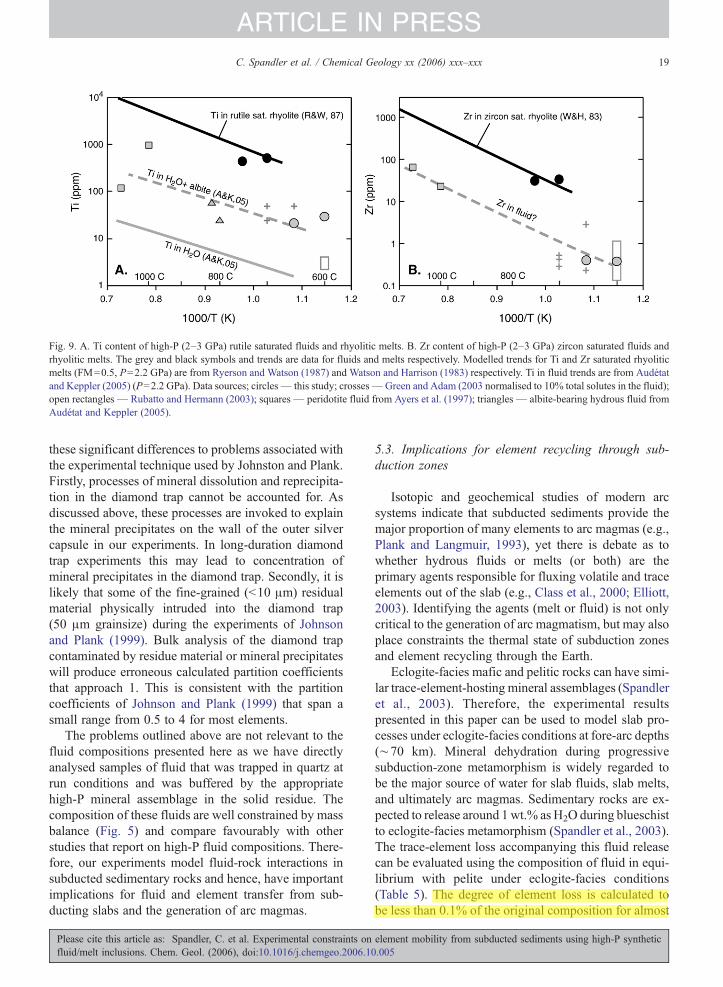
Fig. 9. A. Ti content of high-P (2–3 GPa) rutile saturated fluids and rhyolitic melts. B. Zr content of high-P (2–3 GPa) zircon saturated fluids andrhyolitic melts. The grey and black symbols and trends are data for fluids and melts respectively. Modelled trends for Ti and Zr saturated rhyoliticmelts (FM=0.5, P=2.2 GPa) are from Ryerson and Watson (1987) and Watson and Harrison (1983) respectively. Ti in fluid trends are from Audétatand Keppler (2005) (P=2.2 GPa). Data sources; circles— this study; crosses—Green and Adam (2003 normalised to 10% total solutes in the fluid);open rectangles— Rubatto and Hermann (2003); squares— peridotite fluid from Ayers et al. (1997); triangles— albite-bearing hydrous fluid fromAudétat and Keppler (2005).
19C. Spandler et al. / Chemical Geology xx (2006) xxx–xxx
ARTICLE IN PRESS
these significant differences to problems associated withthe experimental technique used by Johnston and Plank.Firstly, processes of mineral dissolution and reprecipita-tion in the diamond trap cannot be accounted for. Asdiscussed above, these processes are invoked to explainthe mineral precipitates on the wall of the outer silvercapsule in our experiments. In long-duration diamondtrap experiments this may lead to concentration ofmineral precipitates in the diamond trap. Secondly, it islikely that some of the fine-grained (b10 μm) residualmaterial physically intruded into the diamond trap(50 μm grainsize) during the experiments of Johnsonand Plank (1999). Bulk analysis of the diamond trapcontaminated by residue material or mineral precipitateswill produce erroneous calculated partition coefficientsthat approach 1. This is consistent with the partitioncoefficients of Johnson and Plank (1999) that span asmall range from 0.5 to 4 for most elements.
The problems outlined above are not relevant to thefluid compositions presented here as we have directlyanalysed samples of fluid that was trapped in quartz atrun conditions and was buffered by the appropriatehigh-P mineral assemblage in the solid residue. Thecomposition of these fluids are well constrained by massbalance (Fig. 5) and compare favourably with otherstudies that report on high-P fluid compositions. There-fore, our experiments model fluid-rock interactions insubducted sedimentary rocks and hence, have importantimplications for fluid and element transfer from sub-ducting slabs and the generation of arc magmas.
Please cite this article as: Spandler, C. et al. Experimental constraints onfluid/melt inclusions. Chem. Geol. (2006), doi:10.1016/j.chemgeo.2006.10
5.3. Implications for element recycling through sub-duction zones
Isotopic and geochemical studies of modern arcsystems indicate that subducted sediments provide themajor proportion of many elements to arc magmas (e.g.,Plank and Langmuir, 1993), yet there is debate as towhether hydrous fluids or melts (or both) are theprimary agents responsible for fluxing volatile and traceelements out of the slab (e.g., Class et al., 2000; Elliott,2003). Identifying the agents (melt or fluid) is not onlycritical to the generation of arc magmatism, but may alsoplace constraints the thermal state of subduction zonesand element recycling through the Earth.
Eclogite-facies mafic and pelitic rocks can have simi-lar trace-element-hosting mineral assemblages (Spandleret al., 2003). Therefore, the experimental resultspresented in this paper can be used to model slab pro-cesses under eclogite-facies conditions at fore-arc depths(∼70 km). Mineral dehydration during progressivesubduction-zone metamorphism is widely regarded tobe the major source of water for slab fluids, slab melts,and ultimately arc magmas. Sedimentary rocks are ex-pected to release around 1wt.% asH2O during blueschistto eclogite-facies metamorphism (Spandler et al., 2003).The trace-element loss accompanying this fluid releasecan be evaluated using the composition of fluid in equi-librium with pelite under eclogite-facies conditions(Table 5). The degree of element loss is calculated tobe less than 0.1% of the original composition for almost
element mobility from subducted sediments using high-P synthetic.005
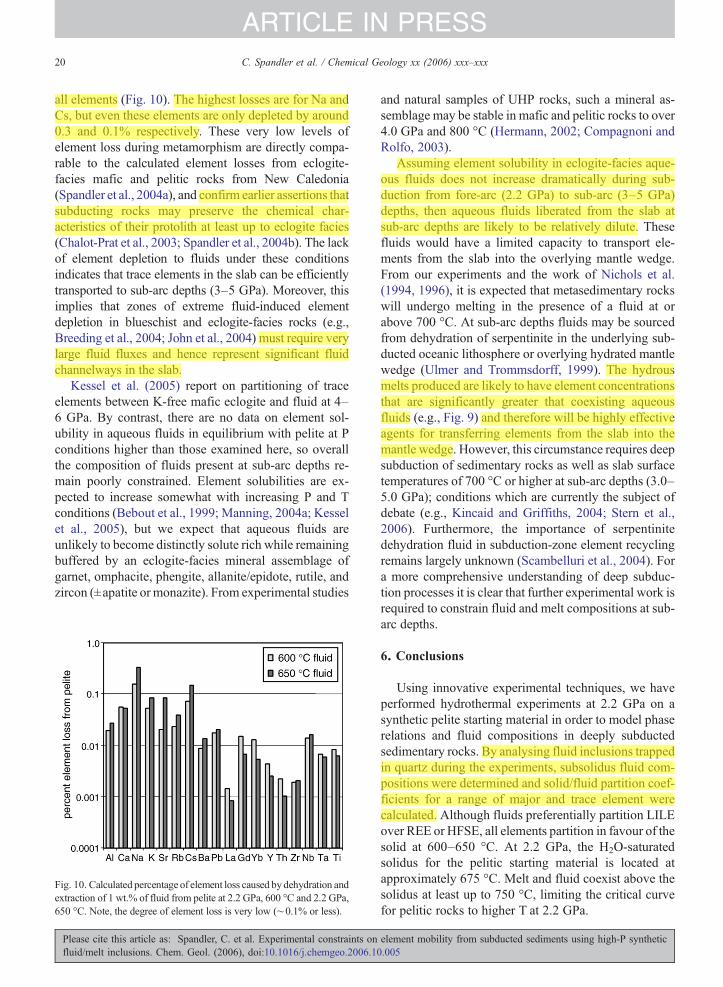
20 C. Spandler et al. / Chemical Geology xx (2006) xxx–xxx
ARTICLE IN PRESS
all elements (Fig. 10). The highest losses are for Na andCs, but even these elements are only depleted by around0.3 and 0.1% respectively. These very low levels ofelement loss during metamorphism are directly compa-rable to the calculated element losses from eclogite-facies mafic and pelitic rocks from New Caledonia(Spandler et al., 2004a), and confirm earlier assertions thatsubducting rocks may preserve the chemical char-acteristics of their protolith at least up to eclogite facies(Chalot-Prat et al., 2003; Spandler et al., 2004b). The lackof element depletion to fluids under these conditionsindicates that trace elements in the slab can be efficientlytransported to sub-arc depths (3–5 GPa). Moreover, thisimplies that zones of extreme fluid-induced elementdepletion in blueschist and eclogite-facies rocks (e.g.,Breeding et al., 2004; John et al., 2004) must require verylarge fluid fluxes and hence represent significant fluidchannelways in the slab.
Kessel et al. (2005) report on partitioning of traceelements between K-free mafic eclogite and fluid at 4–6 GPa. By contrast, there are no data on element sol-ubility in aqueous fluids in equilibrium with pelite at Pconditions higher than those examined here, so overallthe composition of fluids present at sub-arc depths re-main poorly constrained. Element solubilities are ex-pected to increase somewhat with increasing P and Tconditions (Bebout et al., 1999; Manning, 2004a; Kesselet al., 2005), but we expect that aqueous fluids areunlikely to become distinctly solute rich while remainingbuffered by an eclogite-facies mineral assemblage ofgarnet, omphacite, phengite, allanite/epidote, rutile, andzircon (±apatite or monazite). From experimental studies
Fig. 10. Calculated percentage of element loss caused bydehydration andextraction of 1 wt.% of fluid from pelite at 2.2 GPa, 600 °C and 2.2 GPa,650 °C. Note, the degree of element loss is very low (∼0.1% or less).
Please cite this article as: Spandler, C. et al. Experimental constraints onfluid/melt inclusions. Chem. Geol. (2006), doi:10.1016/j.chemgeo.2006.1
and natural samples of UHP rocks, such a mineral as-semblage may be stable in mafic and pelitic rocks to over4.0 GPa and 800 °C (Hermann, 2002; Compagnoni andRolfo, 2003).
Assuming element solubility in eclogite-facies aque-ous fluids does not increase dramatically during sub-duction from fore-arc (2.2 GPa) to sub-arc (3–5 GPa)depths, then aqueous fluids liberated from the slab atsub-arc depths are likely to be relatively dilute. Thesefluids would have a limited capacity to transport ele-ments from the slab into the overlying mantle wedge.From our experiments and the work of Nichols et al.(1994, 1996), it is expected that metasedimentary rockswill undergo melting in the presence of a fluid at orabove 700 °C. At sub-arc depths fluids may be sourcedfrom dehydration of serpentinite in the underlying sub-ducted oceanic lithosphere or overlying hydrated mantlewedge (Ulmer and Trommsdorff, 1999). The hydrousmelts produced are likely to have element concentrationsthat are significantly greater that coexisting aqueousfluids (e.g., Fig. 9) and therefore will be highly effectiveagents for transferring elements from the slab into themantle wedge. However, this circumstance requires deepsubduction of sedimentary rocks as well as slab surfacetemperatures of 700 °C or higher at sub-arc depths (3.0–5.0 GPa); conditions which are currently the subject ofdebate (e.g., Kincaid and Griffiths, 2004; Stern et al.,2006). Furthermore, the importance of serpentinitedehydration fluid in subduction-zone element recyclingremains largely unknown (Scambelluri et al., 2004). Fora more comprehensive understanding of deep subduc-tion processes it is clear that further experimental work isrequired to constrain fluid and melt compositions at sub-arc depths.
6. Conclusions
Using innovative experimental techniques, we haveperformed hydrothermal experiments at 2.2 GPa on asynthetic pelite starting material in order to model phaserelations and fluid compositions in deeply subductedsedimentary rocks. By analysing fluid inclusions trappedin quartz during the experiments, subsolidus fluid com-positions were determined and solid/fluid partition coef-ficients for a range of major and trace element werecalculated. Although fluids preferentially partition LILEover REE or HFSE, all elements partition in favour of thesolid at 600–650 °C. At 2.2 GPa, the H2O-saturatedsolidus for the pelitic starting material is located atapproximately 675 °C. Melt and fluid coexist above thesolidus at least up to 750 °C, limiting the critical curvefor pelitic rocks to higher T at 2.2 GPa.
element mobility from subducted sediments using high-P synthetic0.005

21C. Spandler et al. / Chemical Geology xx (2006) xxx–xxx
ARTICLE IN PRESS
Our data are used to show that subsolidus fluidsreleased during subduction-zone metamorphism up toeclogite-facies are too dilute to significantly alter thetrace element content of subducting pelite. This premiseallows efficient transport of trace elements to sub-arcdepths. Such aqueous fluids are not likely to be effectiveagents for transporting trace elements, which indicatesthat element recycling through subduction zones mayinvolve highly complex fluid-rock interaction processesincluding fluid flux melting of metasedimentary rocks.
Acknowledgements
This research was supported by the AustralianResearch Council. We thank Bill Hibberson and DeanScott for technical support. Reviews by Craig Manningand Stefano Poli and comprehensive editorial work byThomas Pettke greatly improved the manuscript.
References
Allan, M.M., Yardley, B.W.D., Forbes, L.J., Shmulovich, K.I., Banks,D.A., Shepherd, T.J., 2005. Validation of LA-ICP-MS fluid inclusionanalysiswith synthetic fluid inclusions.Am.Mineral. 90, 1767–1775.
Antignano, A., Manning, C.E., 2005. Rutile solubility in H2O–NaAlSi3O8 fluids at high T and P: implications for HSFE mobilityin subduction zones. Eos Trans. AGU 86 (52) (Fall. Meet. Suppl.,Abstract V31C-0620).
Audétat, A., Keppler, H., 2005. Solubility of rutile in subduction zonefluids, as determined by experiments in the hydrothermal diamondanvil cell. Earth Planet. Sci. Lett. 232, 393–402.
Ayers, J.C., Dittmer, S.K., Layne, G.D., 1997. Partitioning of elementsbetween peridotite and H2O at 2.0–3.0 GPa and 900–1100 °C, andapplication to models of subduction zone processes. Earth Planet.Sci. Lett. 150, 381–398.
Bebout, G.E., Ryan, J.G., Leeman, W.P., Bebout, A.E., 1999.Fractionation of trace elements by subduction-zone metamor-phism; effect of convergent-margin thermal evolution. EarthPlanet. Sci. Lett. 171, 63–81.
Bose, K., Ganguly, J., 1995. Quartz-coesite transition revisited:Reversed experimental determination at 500–1200 °C andretrieved thermochemical properties. Am. Mineral. 80, 231–238.
Breeding, C.M., Ague, J.J., Bröcker, M., 2004. Fluid-metasedimentaryrock interactions in subduction-zone mélange: Implications for thechemical composition of arc magmas. Geology 32, 1041–1044.
Brodholt, J.P., Wood, B.J., 1993. Simulations of the structure andthermodynamic properties of water and high pressures andtemperatures. J. Geophys. Res. 98, 519–536.
Brodholt, J.P., Wood, B.J., 1994. Measurement of the PVT propertiesof water to 25 kbars and 1600 °C from synthetic fluid inclusions incorundum. Geochim. Cosmochim. Acta 58, 2143–2148.
Brown, P.E., Hagemann, S.G., 1995. MacFlinCor and its application tofluids in Archean lode-gold deposits. Geochim. Cosmochim. Acta59, 3943–3952.
Bureau, H., Keppler, H., 1999. Complete miscibility between silicatemelt and hydrous fluids in the upper mantle: experimentalevidence and geochemical implications. Earth Planet. Sci. Lett.165, 187–196.
Please cite this article as: Spandler, C. et al. Experimental constraints onfluid/melt inclusions. Chem. Geol. (2006), doi:10.1016/j.chemgeo.2006.10
Chalot-Prat, F., Ganne, J., Lombard, A., 2003. No significant elementtransfer from the oceanic plate to the mantle wedge duringsubduction and exhumation of the Tethys lithosphere (WesternAlps). Lithos 69, 69–103.
Class, C., Miller, D.M., Goldstein, S.L., Langmuir, C.H., 2000.Distinguishing melt and fluid subduction and components inUmnak volcanics, Aleutian Arc. Geochem. Geophys. Geosyst. 1(Art. no. 1999GC000010).
Compagnoni, R., Rolfo, F., 2003. UHPM units in the Western Alps. In:Carswell, D.A., Compagnoni, R. (Eds.), Ultrahigh PressureMetamorphism. EMU Note. Min., vol. 5. Eötvös UniversityPress, Budapest, pp. 13–49.
Domanik, K.J., Holloway, J.R., 1996. The stability and composition ofphengitic muscovite and associated phases from 5.5 to 11 GPa;implications for deeply subducted sediments. Geochim. Cosmo-chim. Acta 60, 4133–4150.
Elliott, T., 2003. Tracers of the slab. In: Eiler, J. (Ed.), Inside theSubduction Factory. Geophys. Mon., vol. 138. American Geo-physical Union, Washington, DC, pp. 23–45.
Forneris, J.F., Holloway, J.R., 2003. Phase equilibria in subductingbasaltic crust: implications for H2O release from the slab. EarthPlanet. Sci. Lett. 214, 187–201.
Green, T.H., Adam, J., 2003. Experimentally-determined trace elementcharacteristics of aqueous fluid from partially dehydrated maficoceanic crust at 3.0 GPa, 650–700°C. Eur. J. Mineral. 15,815–830.
Green, T.H., Ringwood, A.E., Major, A., 1966. Friction effects andpressure calibration in a piston-cylinder apparatus at high pressureand temperature. J. Geophys. Res. 71, 3589–3594.
Günther, D., Audétat, A., Frischknecht, R., Heinrich, C.A., 1998.Quantitative analysis of major, minor and trace elements in fluidinclusions using laser ablation-inductively coupled plasma massspectrometry. J. Anal. At. Spectrom. 13, 263–270.
Haar, L., Gallagher, J.S., Kell, G.S., 1984. NBS/NRC Steam Tables,Thermodynamic and Transport Properties and Computer Programsfor Vapour and Liquid States of Water in SI Units. HemispherePublishing, New York.
Hack, A.C., Mavrogenes, J.A., 2006. A cold-sealing capsule design forfluid inclusion synthesis and other hydrothermal experiments in apiston-cylinder apparatus. Am. Mineral. 91, 203–210.
Hawkesworth, C.J., Gallagher, K., Hergt, J.M., McDermott, F., 1993.Mantle and slab contributions in arc magmas. Annu. Rev. EarthPlanet. Sci. 21, 175–204.
Heinrich, C.A., Pettke, T., Halter, W.E., Aigner-Torres, M., Audétat,A., Günther, D., Hattendorf, B., Bleiner, D., Guillong, M., Horn, I.,2003. Quantitative multi-element analysis of minerals, fluid andmelt inclusions by laser-ablation inductively-coupled-plasmamass-spectrometry. Geochim. Cosmochim. Acta 67, 3473–3497.
Hermann, J., 2002. Allanite: thorium and light rare earth elementcarrier in subducted crust. Chem. Geol. 192, 289–306.
Hermann, J., 2003. Experimental evidence for diamond-faciesmetamorphism in the Dora–Maira massif. Lithos 70, 163–182.
Hermann, J., Green, D.H., 2001. Experimental constraints on highpressure melting in subducted crust. Earth Planet. Sci. Lett. 188,149–168.
Huang, W.L., Wyllie, P.J., 1981. Phase relationships of S-type granitewith H2O to 35 kbar: muscovite granite from Harney Peak, SouthDakota. J. Geophys. Res. 86, 10515–10529.
John, T., Scherer, E.E., Haase, K., Schenk, V., 2004. Trace elementfractionation during fluid-induced eclogitization in a subductingslab: trace element and Lu–Hf–Sm–Nd isotope systematics. EarthPlanet. Sci. Lett. 227, 441–456.
element mobility from subducted sediments using high-P synthetic.005

22 C. Spandler et al. / Chemical Geology xx (2006) xxx–xxx
ARTICLE IN PRESS
Johnson, M.C., Plank, T., 1999. Dehydration and melting experimentsconstrain the fate of subducted sediments. Geochem. Geophys.Geosyst. 1 (Art. no. 1999GC000014).
Kessel, R., Ulmer, P., Pettke, T., Schmidt, M.W., Thompson, A.B.,2004. A novel approach to determine high-pressure high-temperature fluid and melt compositions using diamond-trapexperiments. Am. Mineral. 89, 1078–1086.
Kessel, R., Schmidt, M.W., Ulmer, P., Pettke, T., 2005. Trace elementsignature of subduction-zone fluids, melts and supercritical liquidsat 120–180 km depth. Nature 437, 724–727.
Kincaid, C., Griffiths, R.W., 2004. Variability in flow and temperaturewithin mantle subduction zones. Geochem. Geophys. Geosyst. 5(Art. no. Q06002).
Liu, J., Bohlen, S.R., Ernst, W.G., 1996. Stability of hydrous phases insubducting oceanic crust. Earth Planet. Science Lett. 143,161–171.
Loucks, R.R., Mavrogenes, J.A., 1999. Gold solubility in supercriticalhydrothermal brines measured in synthetic fluid inclusions.Science 284, 2159–2163.
Luth, W.C., Ingamells, O., 1965. Gel preparation of starting materialsfor hydrothermal experimentation. Am. Mineral. 50, 255–258.
Manning, C.E., 1994. The solubility of quartz in the lower crust andupper mantle. Geochim. Cosmochim. Acta 58, 4831–4839.
Manning, C.E., 1998. Fluid composition at the blueschist-eclogitetransition in the model system Na2O–MgO–Al2O3–SiO2–H2O–HCl. Swiss Bull. Mineral. Petrol. 78, 225–242.
Manning, C.E., 2004a. The chemistry of subduction-zone fluids. EarthPlanet. Sci. Lett. 223, 1–16.
Manning, C.E., 2004b. Polymeric silicate complexing in aqueousfluids at high pressure and temperature, and its implications forwater–rock interaction. In: Wanty, R.B., Seal II, R.R. (Eds.),Water–Rock Interaction. Proc. 11th Int. Symp. Water-rock Int.,London, pp. 45–49.
Nichols, G.T., Wyllie, P.J., Stern, C.R., 1994. Subduction zone meltingof pelagic sediments constrained by melting experiments. Nature371, 785–788.
Nichols, G.T., Wyllie, P.J., Stern, C.R., 1996. Experimental meltingof pelagic sediment, constraints relevant to subduction. In: Bebout,G.E., Scholl, D.H., Kirby, S.P., Platt, J. (Eds.), Subduction: Top toBottom. . Geophys. Mon., vol. 96. American Geophysical Union,Washington, DC, pp. 293–298.
Ono, S., 1998. Stability limits of hydrousminerals in sediment andmid-ocean ridge basalt compositions; implications for water transport insubduction zones. J. Geophys. Res. 103, 18253–18267.
Pawley, A.R., 1992. Experimental study of the compositions andstabilities of synthetic nyböite and nyböite–glaucophane amphi-boles. Eur. J. Mineral. 4, 171–192.
Pettke, T., Heinrich, C.A., Cioccan, A.C., Günther, D., 2000.Quadrupole mass spectrometry and optical emission spectrometry:detection capabilities and representative sampling of short transientsignals from laser ablation. J. Anal. At. Spectrom. 15, 1149–1155.
Plank, T., Langmuir, C.H., 1993. Tracing trace elements from sedimentinput to volcanic output at subduction zones. Nature 362, 739–743.
Plank, T., Langmuir, C.H., 1998. The chemical composition ofsubducting sediment and its consequences for the crust and mantle.Chem. Geol. 145, 325–394.
Poli, S., Schmidt, M.W., 2002. Petrology of subducted slabs. Annu.Rev. Earth Planet. Sci. 30, 207–235.
Rea, D.K., Ruff, L.J., 1996. Composition and mass flux of sedimententering the world's subduction zones: implications for globalsediment budgets, great earthquakes, and volcanism. Earth Planet.Sci. Lett. 140, 1–12.
Please cite this article as: Spandler, C. et al. Experimental constraints onfluid/melt inclusions. Chem. Geol. (2006), doi:10.1016/j.chemgeo.2006.1
Rubatto, D., Hermann, J., 2003. Zircon formation during fluidcirculation in eclogites (Monviso, Western Alps): implicationsfor Zr and Hf budget in subduction zones. Geochim. Cosmochim.Acta 67, 2173–2187.
Ryerson, F.J., Watson, E.B., 1987. Rutile saturation in magmas:implications for Ti–Nb–Ta depletion in island-arc basalts. EarthPlanet. Sci. Lett. 86, 225–239.
Scambelluri, M., Philippot, P., 2001. Deep fluids in subduction zones.Lithos 55, 213–227.
Scambelluri, M., Fiebig, J., Malaspina, N., Müntener, O., Pettke, T.,2004. Serpentinite subduction: implications for fluid processes andtrace element recycling. Int. Geol. Rev. 46, 595–613.
Schmidt, M.W., Vielzeuf, D., Auzanneau, E., 2004. Melting anddissolution of subducted crust at high pressures: the key role ofwhite mica. Earth Planet. Sci. Lett. 228, 65–84.
Simon, A.C., Frank, M.R., Pettke, T., Candela, P.A., Piccoli, P.M.,Heinrich, C.A., 2005. Gold partitioning in melt-vapor-brinesystems. Geochim. Cosmochim. Acta 69, 3321–3335.
Spandler, C.J., Hermann, J., Arculus, R.J., Mavrogenes, J.A., 2003.Redistribution of trace elements during prograde metamorphismfrom lawsonite blueschist to eclogite facies; implications for deepsubduction-zone processes. Contrib. Mineral. Petrol. 146, 205–222.
Spandler, C.J., Hermann, J., Arculus, R.J., Mavrogenes, J.A., 2004a.Reply to comments on “Redistribution of trace elements duringprograde metamorphism from lawsonite blueschist to eclogitefacies: implications for deep subduction zone processes”. Contrib.Mineral. Petrol. 148, 506–509.
Spandler, C.J., Hermann, J., Arculus, R.J., Mavrogenes, J.A., 2004b.Geochemical heterogeneity and element mobility in deeplysubducted oceanic crust; insights from high-pressure mafic rocksfrom New Caledonia. Chem. Geol. 206, 21–42.
Stern, C.R., Wyllie, P.J., 1973. Water-saturated and undersaturatedmelting relations of a granite to 35 kilobars. Earth Planet. Sci. Lett.18, 163–167.
Stern, R.J., Kohut, E., Bloomer, S.H., Leybourne, M., Fouch, M.,Vervoort, J., 2006. Subduction factory processes beneath theGuguan cross-chain, Mariana Arc; no role for sediments, areserpentinites important? Contrib. Mineral. Petrol. 151, 202–221.
Sterner, S.M., Bodnar, R.J., 1984. Synthetic fluid inclusions in naturalquartz; 1, Compositional types synthesized and applications toexperimental geochemistry. Geochim. Cosmochim. Acta 48,2659–2668.
Tatsumi, Y., 2005. The subduction factory; how it operates in theevolving Earth. GSA Today 15–7, 4–10.
Taylor, S.R., McLennan, S.M., 1985. The Continental Crust: ItsComposition and Evolution. Blackwell, Oxford, p. 312.
Ulmer, P., Trommsdorff, V., 1999. Phase relations of hydrous mantlesubducting to 300 km. In: Fei, Y., Bertka, N., Mysen, B.O. (Eds.),Mantle Petrology: Field Observations and High Pressure Exper-imentation. Geochem. Soc. Spec. Pub., vol. 6, pp. 259–281.
Watson, E.B., Harrison, T.M., 1983. Zircon saturation revisited,temperature and composition effects in a variety of crustal magmatypes. Earth Planet. Sci. Lett. 64, 295–304.
Withers, A.C., Kohn, S.C., Brooker, R.A., Wood, B.J., 2000. A newmethod for determining the P–V–T properties of high-density H2Ousing NMR: results at 1.4–4.0 GPa and 700–1100 °C. Geochim.Cosmochim. Acta 64, 1051–1057.
Zack, T., Kronz, A., Foley, S.F., Rivers, T., 2002. Trace elementabundances in rutiles from eclogites and associated garnet micaschists. Chem. Geol. 184, 97–122.
element mobility from subducted sediments using high-P synthetic0.005