article in press - technical analysis
TRANSCRIPT

ARTICLE IN PRESS
Stock selection strategies in emerging markets
Jaap van der Harta, Erica Slagterb, Dick van Dijkc,*
aEmerging Markets Team, Robeco Group, P.O. Box 973, 3000 AZ Rotterdam, The NetherlandsbDepartment of Quantitative Research, Robeco Group, P.O. Box 973, 3000 AZ, Rotterdam, The Netherlands
cEconometric Institute, Erasmus University Rotterdam, P.O. Box 1738, NL-3000 DR Rotterdam, The Netherlands
Abstract
We examine the profitability of a broad range of stock selection strategies in 32 emerging markets
over the period 1985–1999. Value, momentum and earnings revisions strategies are most successful
and generate significant excess returns, in contrast to strategies based on size, liquidity and mean
reversion. The performance of the strategies can be enhanced by selecting stocks on multiple
characteristics and by incorporating country selection, although the latter bears the cost of increased
risk. We do not find a pronounced effect of financial market liberalization on the performance of the
strategies. There is no evidence that global risk factors can account for the excess returns of selection
strategies. Finally, we document that the strategies can be implemented successfully in practice by a
large institutional investor, facing a lack of liquidity and substantial transaction costs.
D 2002 Elsevier Science B.V. All rights reserved.
JEL classification: G11; G15
Keywords: Value; Momentum; Earnings revisions; Market frictions; Risk; Behavioral models; Overreaction;
Underreaction
1. Introduction
The success of quantitative stock selection strategies in developed markets is well
documented. Portfolios formed on the basis of earnings-to-price (E/P), book-to-market (B/
M), price momentum or earnings revisions have been found to earn significant excess
returns across developed markets.1 For emerging markets, however, only few studies that
0927-5398/02/$ - see front matter D 2002 Elsevier Science B.V. All rights reserved.
PII: S0927 -5398 (02 )00022 -1
* Corresponding author.
E-mail addresses: [email protected] (J. van der Hart), [email protected] (E. Slagter),
[email protected] (D. van Dijk).
www.elsevier.com/locate/econbase
1 Most research in this area has concentrated on US stocks. A nonexhaustive list of studies that consider data
from international developed equity markets includes Capaul et al. (1993), Haugen and Baker (1996),
Arshanapalli et al. (1998), Bauman et al. (1998, 1999), Fama and French (1998), Rouwenhorst (1998) and Baytas
and Cakici (1999).
Journal of Empirical Finance 194 (2002) 1–28

ARTICLE IN PRESS
investigate individual stock selection exist, which, moreover, have rendered conflicting
results. For example, whereas Claessens et al. (1998) find evidence for a premium for large
firms and growth stocks, Fama and French (1998), Patel (1998), Rouwenhorst (1999) and
Barry et al. (2002) report a premium for small firms and value stocks. Claessens et al.
(1998) also document a premium for beta and turnover, but Rouwenhorst (1999) finds no
evidence for either of those. Whereas the aforementioned studies consider only a limited
number of strategies, Achour et al. (1998, 1999a,b,c) examine a much broader range of
trading strategies based on firm characteristics, but their sample includes stocks from only
three emerging markets (Malaysia, Mexico and South Africa). They find that several
strategies earn significant excess returns, including strategies based on analysts’ earnings
revisions.
In this paper, we further examine the performance of stock selection strategies in
emerging markets. Compared to the above-mentioned studies, we consider an extensive set
of strategies across a broader range of countries. Besides value and momentum strategies,
we also include strategies based on short-term and long-term mean reversion, analysts’
earnings revisions, size and liquidity. In addition, we consider multivariate strategies, which
rank stocks according to indicators of value, momentum and earnings revisions jointly.
Finally, we compare local and global selection strategies, and thus contrast the profits that
arise from stock selection within countries with those that arise from country selection. Our
research can be regarded as complementary to Harvey (1995), who, using countrywide
indices, documents that emerging equity market returns appear to be predictable in the time-
series dimension. Here we will investigate whether this also holds in the cross-sectional
dimension, using a broad sample of individual firms from all emerging markets.
Our results can be summarized as follows. Using internationally diversified (but
country-neutral) portfolios, we find that high E/P and B/M (value) stocks outperform
low E/P and B/M (growth) stocks, and stocks with positive analysts’ earnings revisions
outperform stocks with negative revisions. The success of momentum strategies depends
on the type of investment strategy that is used. A conventional ‘‘zero-cost’’ strategy,
consisting of a long position in the winners portfolio and an offsetting short position in the
losers portfolio, generates significant excess returns. The average return from a strategy
consisting of a long position in the winners portfolio only, however, is not significantly
different from the return on an equally weighted portfolio of all stocks. We find no
evidence for short-term or long-term mean reversion, nor do we find that returns are
systematically related to size or liquidity. Combining value, momentum and earnings
revisions indicators into a multivariate strategy improves the overall performance. The
results for individual countries are much less significant than for internationally diversified
portfolios. The benefits of geographical diversification, due to the low correlations
between the stock selection strategies across countries, are already noticeable at the
regional level, but it is best to apply the strategies globally. Finally, stock selection and
country selection contribute about equally to the returns from global strategies.
Many emerging countries experienced financial market liberalizations during the late
1980s and early 1990s, opening up their stock markets to foreign investors. Recent studies2
2 See Bekaert and Harvey (2000b), Henry (2000), Kim and Singal (2000), Bekaert et al. (2001, 2002), Chari
and Henry (2001), and Kaminsky and Schmukler (2001), among others.
J. van der Hart et al. / Journal of Empirical Finance 194 (2002) 1–282

ARTICLE IN PRESS
suggest that these liberalizations have had pronounced macroeconomic and financial
effects. For example, liberalizations are associated with decreases in the cost of capital
and increases in economic growth. We examine whether financial market liberalizations
also have affected the performance of our stock selection strategies, but find that generally
this is not the case.
To study whether the excess returns of the selection strategies in emerging markets can
be interpreted as compensation for risk, we use a four-factor model including global
market, book-to-market, size and momentum factors. We find, however, that the return
premiums cannot be explained by exposures to these risk factors.
A natural question to ask is whether the stock selection strategies are profitable if
applied in practice by a large investor. Relevant factors in emerging markets that may
prevent successful implementation are a lack of liquidity, outliers in stock returns, an
implementation delay, and transaction costs. To address this issue, we evaluate the
selection strategies under different circumstances, accounting for each of these aspects
in turn. We find that the excess returns of the best-performing strategies remain significant
when the sample is restricted to stocks with the largest market capitalizations, after
correcting for outliers, after allowing for a 1-month implementation delay, and after taking
into account transaction costs. In addition, we find that the multivariate strategies have no
tendency to select stocks with a high emerging market risk or with low liquidity.
The plan of the paper is as follows. Section 2 describes the data and stock selection
strategies, while Section 3 documents their profitability. Section 4 examines the effect
of market liberalizations on the performance of the stock selection strategies. Section 5
explores whether the excess returns of the strategies can be attributed to exposure to
global risk factors. Section 6 examines how the performance of the trading strategies is
affected when taking into account various implementation issues. Finally, Section 7
concludes.
2. Methodology
2.1. Data
Stock prices and relevant firm characteristics are taken from the Emerging Markets
Database (EMDB) of the International Finance Corporation (IFC). Monthly total returns in
US dollars are calculated using stock prices, dividends and capital adjustment factors (cf.
Rouwenhorst, 1999). Some apparent data errors due to wrongly calculated stock split ratios
were corrected. The firm characteristics that we use are earnings-to-price and book-to-
market ratios, dividends, number of shares traded and number of shares outstanding. The
sample period runs from January 1982 until May 1999, although the earnings and book
value data are available from January 1985 onwards only. We therefore consider portfolios
formed every month starting at the beginning of January 1985 for all selection strategies.
The data from the IFC EMDB are supplemented with data on analysts’ earnings
forecasts from the Institutional Brokers Estimate System (IBES). This database contains
data on firms in emerging markets starting in January 1987. The earnings forecasts are used
to calculate ‘‘forward’’ earnings-to-price ratios as the ratio of the median earnings forecast
J. van der Hart et al. / Journal of Empirical Finance 194 (2002) 1–28 3

ARTICLE IN PRESS
and the current stock price, and earnings revisions. Following Achour et al. (1998), we
define earnings revisions as the number of analysts with upward revisions minus the
number of analysts with downward revisions divided by the total number of analysts
providing an earnings forecast in a particular month. As analyst coverage was rather low
initially, we consider portfolios formed on the basis of forward E/P ratios and earnings
revisions from May 1988 onwards only.
At the end of our sample period, the EMDB contains data on 2851 firms from 32
emerging markets. Not all of these are included in our sample, however, for several
reasons. First, the IFC database contains survivorship bias, as data (returns in particular)
are backfilled when IFC starts constructing data for a particular country. We avoid this
survivorship bias by using at any time only stocks from countries that are included in the
IFC Composite index (cf. Fama and French, 1998; Rouwenhorst, 1999). See Harvey
(1995) for a detailed discussion of this feature of the EMDB. Second, at each month
during the sample period, we include only stocks with market capitalization in excess of a
minimum level, which is set equal to US$100 million in December 1998 and deflated by
10% annually.3 This eliminates stocks that are too small for large institutional investors
and alleviates potential problems due to low-priced stocks. Note that, as this selection is
made afresh at the beginning of each month, it does not create survivorship bias. Finally,
we omit countries with less than four stocks and countries for which the data necessary for
the particular selection strategy is available for less than 30% of the stocks. We omit these
‘‘small’’ countries because the selection strategies construct local return factor portfolios
from the top and bottom 15% stocks in each country separately.
The impact of each of the data screens on the size of the sample or ‘‘universe’’ of
stocks can be seen from Fig. 1, which shows the quarterly average number of stocks
3 The EMDB itself already contains a selection bias towards larger stocks, as market capitalization is one of
the criteria used by the IFC to select stocks for its indices.
Fig. 1. Quarterly average number of securities in the universe of stocks from countries that are included in the IFC
Composite index and in the samples for value, momentum and earnings revisions strategies.
J. van der Hart et al. / Journal of Empirical Finance 194 (2002) 1–284

ARTICLE IN PRESS
from countries that are included in the IFC Composite index, and the number of stocks
in the samples available for the value, momentum and earnings revisions strategies
(details of which are discussed below). The original IFC Composite universe consists of
about 350 stocks in 10 countries in January 1985, gradually expanding to approximately
1900 stocks in 32 countries in May 1999. These numbers are reduced to 200 and 1200,
respectively, by applying the market capitalization selection. Omitting countries with less
than four stocks and countries for which the data on the ranking variable is available for
less than 30% of the stocks mainly affects the strategies based on earnings revisions, for
which the numbers of securities at the beginning and end of the sample period are equal
to approximately 100 and 1000, respectively.
2.2. Stock selection strategies
We test several stock selection strategies based on indicators of value, momentum,
earnings revisions, size and liquidity. As measures of value, we use the earnings-to-price
ratio, the book-to-market ratio, the dividend yield (D/P) and the forward E/P ratios for
the current fiscal year (E/P FY1) and for the next fiscal year (E/P FY2). For the
momentum strategies, we use the average return over the previous 1, 3, 6, 9, 12 and 36
months (denoted as kMR, with k the number of months). Earnings revisions are measured
by the past 3-month average earnings revisions for the current fiscal year (ER FY1) and
for the next fiscal year (ER FY2). Size is taken to be the market capitalization of the
stock at the end of the previous month. Finally, we follow Rouwenhorst (1999) in
measuring liquidity by the turnover ratio, defined as the number of shares traded during
the previous month divided by the total number of shares outstanding at the beginning of
the month.
All strategies are applied without a delay between the ranking period and the moment of
portfolio formation. As the IFC and IBES databases contain data as published, all sorting
characteristics would have been available to investors at the time of ranking, and, hence, the
selection strategies do not use any forward information. Apart from worries about the
timely availability of the sorting variables, another reason to implement momentum
strategies with a delay (usually 1 month) is to attenuate the effects of bid-ask bounce
(see Achour et al., 1998; Rouwenhorst, 1999, among others). Because of the minimum
capitalization requirement that we impose, the smallest, and probably least liquid, stocks are
not included in our sample, and, hence, bid-ask bounce is less important at the monthly
frequency. Therefore, we also implement the momentum strategies without delay, such that,
for example, the 6-month momentum factor that is used to rank the stocks at the beginning
of month t is based on the average return from the beginning of month t� 6 to the end of
month t� 1. As a robustness test, we test all selection strategies with a 1-month
implementation lag in Section 6.
At the beginning of each month, we rank the stocks by country on each of the
above characteristics or ‘‘return factors’’ in descending order. The rankings based on
the past 1- and 36-month return variables are in ascending order, such that we
effectively test short-term and long-term mean reversion (cf. Jegadeesh, 1990; Leh-
mann, 1990; and De Bondt and Thaler, 1985, 1987, respectively). The rankings based
on size and liquidity also are in ascending order, such that the smallest stocks and
J. van der Hart et al. / Journal of Empirical Finance 194 (2002) 1–28 5

ARTICLE IN PRESS
stocks with the lowest turnover ratio, respectively, are the top ranked ones. For each
country in the sample, an equally weighted portfolio is formed from the top 15%
ranked stocks or ‘‘winners’’. These country portfolios are, in turn, combined into an
internationally diversified portfolio, in which each stock receives an equal weight. The
stocks are selected in each country separately to avoid any implicit country allocation,
but we return to this point in Section 3.4. Each month, a new portfolio is constructed,
which is held for a period of 6 months. After formation, the portfolio is not
rebalanced, except for stocks that leave the IFC index. These stocks exit the portfolio
and the weights of the remaining stocks are adjusted proportionally. Using the same
procedure, an equally weighted portfolio of ‘‘losers’’ is constructed from the bottom
15% ranked stocks in each country. As we construct new portfolios every month and
use a 6-month holding period, at any point in time, the strategies effectively hold six
portfolios of, for example, the top 15% stocks, each formed 1 month apart. To handle
the problems concerned with overlapping returns, we calculate monthly returns as the
average of the six similar portfolios (cf. Jegadeesh and Titman, 1993, 2001; Rouwen-
horst, 1998).
The performance of stock selection strategies is usually measured as the return on a
‘‘zero-investment’’ strategy, involving a long position in the winners portfolio and an
offsetting short position in the losers portfolio, as in the work of Fama and French (1998)
and Rouwenhorst (1999), among many others. However, it might be questioned whether
these returns can actually be realized in practice, as short-selling constraints may prevent
implementation of such a zero-investment strategy (see Alexander, 2000 for discussion).
Short-selling restrictions are particularly relevant for emerging markets (see Bekaert and
Urias, 1996, 1999; De Roon et al., 2001). For this reason, we primarily compare the
average return of the winners portfolio with an equally weighted index (EWI) consisting of
all stocks in the relevant universe. To facilitate comparison of our results with those of
Fama and French (1998) and Rouwenhorst (1999), we also provide some results on a zero-
cost strategy, by computing the excess return of the winners portfolio over the losers
portfolio. As noted by Achour et al. (1998), even if the losers portfolio cannot be used in a
trading strategy, it still provides important information regarding which stocks are to be
avoided. Furthermore, as pointed out by the referee, the excess return of the winners
portfolio over the losers portfolio can alternatively be interpreted as the excess return
generated by a strategy where winners are overweighted and losers are underweighted
versus their benchmark weights.
3. Profitability of stock selection strategies
In this section, we evaluate the performance of the various stock selection strategies.
We consider results for ‘‘univariate’’ strategies, which rank stocks according to a single
return factor, and for ‘‘multivariate’’ strategies, which combine measures of value,
momentum and/or earnings revisions to produce the stock ranking. We also present
results for individual countries and geographical regions to explore whether the strategies
are successful on smaller samples of stocks. Finally, we examine the benefits from using
the strategies for country selection in addition to stock selection.
J. van der Hart et al. / Journal of Empirical Finance 194 (2002) 1–286

ARTICLE IN PRESS
3.1. Univariate strategies
Table 1 summarizes the average monthly returns during the 6-month holding period for
the winners portfolio, the equally weighted index and the losers portfolio formed on the
basis of a single return factor. Of the different value strategies considered, the earnings-to-
price strategy generates the highest average excess return. This holds irrespective of
whether excess returns are measured relative to the equally weighted index (TMI, Top-
Minus-Index) or relative to the losers portfolio (TMB, Top-Minus-Bottom). The return on
the E/P winners portfolio exceeds the return on the EWI benchmark by 0.53% per month
on average, whereas high E/P stocks have outperformed low E/P stocks by 1.02% per
month. These excess returns are strongly statistically significant, with t statistics of 4.45
and 5.46, respectively. Excess returns from the B/M strategy are only slightly lower, and
close to the average excess returns reported by Rouwenhorst (1999). Selecting stocks
based on their dividend yields in the previous month does not generate significant excess
Table 1
Returns of univariate stock selection strategies
Factor No. of Stocks Top EWI Bottom TMI t (TMI) TMB t (TMB)
E/P 685 1.89 1.35 0.88 0.53 4.45 1.02 5.46
B/M 684 1.83 1.33 1.00 0.49 2.99 0.83 3.18
D/P 625 1.76 1.67 1.34 0.09 0.81 0.42 2.52
E/P FY1 593 0.87 0.69 0.63 0.18 1.42 0.25 1.06
E/P FY2 579 0.72 0.58 0.49 0.14 0.90 0.24 0.91
1MR 696 1.41 1.52 1.45 � 0.11 � 1.32 0.00 0.01
3MR 694 1.63 1.54 1.29 0.09 0.96 0.37 2.26
6MR 692 1.69 1.55 1.24 0.14 1.41 0.48 2.63
9MR 689 1.77 1.59 1.27 0.18 1.68 0.52 2.67
12MR 685 1.81 1.62 1.45 0.19 1.55 0.38 1.84
36MR 625 1.72 1.64 1.52 0.08 0.49 0.20 0.93
ER FY1 584 0.76 0.45 0.22 0.31 3.43 0.56 4.22
ER FY2 543 0.94 0.62 0.31 0.32 3.28 0.65 4.51
Size 697 1.41 1.52 1.60 � 0.11 � 0.85 � 0.19 � 0.88
Liquidity 684 1.06 1.25 1.24 � 0.18 � 1.04 � 0.19 � 0.75
At the beginning of each month between January 1985 and May 1999, all stocks for which the necessary
information is available are ranked by country in descending order according to the value of the factor indicated in
the first column. E/P is the earnings-to-price ratio; B/M is the book-to-market ratio; D/P is the dividend yield; E/P
FY1 and E/P FY2 are the forward E/P ratios for the current and next fiscal year, respectively; kMR, with k = 1, 3,
6, 9, 12 and 36, is the average return over the previous k months; ER FY1 and ER FY2 are the past 3-month
average earnings revisions for the current and next fiscal year, respectively; size is the market capitalization of the
stock at the beginning of the month; and liquidity is equal to the number of shares traded during the previous
month divided by the total number of outstanding shares at the beginning of the month. The rankings according to
1MR, 36MR, size and liquidity are in ascending order. For each country, equally weighted portfolios are formed
from the top and bottom 15% of stocks, which are combined into equally weighted internationally diversified
portfolios (Top and Bottom). EWI is the equally weighted portfolio of all stocks in the sample. Positions are held
for six months and are not rebalanced. Monthly, nonoverlapping returns are computed as the average return of the
six similar portfolios that are held during each month. Column 2 reports the average number of stocks in the
different samples. Columns 3–5 report the average returns of the Top, EWI and Bottom portfolios, expressed as
percentage per month. Columns 6–7 and 8–9 report the average excess returns and the corresponding t statistics
of the TMI portfolio and the TMB portfolio, respectively.
J. van der Hart et al. / Journal of Empirical Finance 194 (2002) 1–28 7

ARTICLE IN PRESS
returns relative to the EWI. However, because the average return of the portfolio of stocks
with very low dividend yields is much smaller than the average benchmark return, the
return of the TMB portfolio is significant, albeit it is only half as large as the excess returns
on the E/P and B/M strategies. The strategies based on forward E/P ratios also generate
modest excess returns, but these are not significantly different from zero.
The results from the momentum strategies based on past 3-, 6-, 9-and 12-month returns
are very similar. Excess returns for the TMB portfolios are between 0.4% and 0.5% per
month and statistically significant. As the winners portfolios have (statistically insignificant)
excess returns versus the EWI between 0.1% and 0.2% per month only, the profitability of
the TMB portfolios is, however, mainly due to underperformance of the losers portfolios.
Consequently, the profits from a zero-investment strategy based on the TMB portfolio would
mostly come from the sell side. Because of short sales restrictions in emerging markets, the
momentum strategy is in practice mostly relevant for avoiding low momentum stocks. The
average excess return of the TMB portfolio based on prior 6-month returns is similar to the
excess return reported by Rouwenhorst (1999), even though his winners and losers
portfolios include stocks from the top and bottom 30% of the prior return distribution.4
The momentum returns in emerging markets found here are notably smaller than
returns of comparable momentum portfolios for developed markets reported by Jegadeesh
and Titman (1993) and Rouwenhorst (1998), which average approximately 1% per month.
Admittedly, in these studies, the winners and losers portfolios contain only stocks from the
top and bottom 10% of the prior return distributions compared to 15% in our strategies, but
it is difficult to imagine that this small methodological difference can explain the large
difference in excess returns completely. Also note that the excess returns of the TMB
portfolios increase gradually as the length of the formation period increases from 3 to 9
months, but is slightly lower for the 12-month strategy. This pattern corresponds to the
findings of Jegadeesh and Titman (1993), Rouwenhorst (1998) and Lee and Swaminathan
(2000) for developed markets, albeit the differences between excess returns for different
formation periods found in those studies are more pronounced.
The excess returns of strategies based on short-term and long-term mean reversion
(1MR and 36MR, respectively), size and liquidity do not differ substantially from zero. In
fact, the returns of smaller and less liquid stocks are somewhat lower than the returns of
larger and more liquid stocks, although the differences are not significant. Our findings for
the liquidity strategy are similar to Rouwenhorst (1999), but the results for the size strategy
are quite different from Fama and French (1998), Patel (1998) and Rouwenhorst (1999),
who report evidence for a premium for small firms in emerging markets. This contra-
dictory result can be attributed to differences in methodology, in particular, the minimum
capitalization requirement that we impose. When we examine the performance of the size
strategy on the sample of stocks that results without imposing this requirement, we do find
a premium for small stocks, in accordance with previous studies.5 This corresponds with
4 The fact that excess returns nevertheless are of similar magnitude might (partly) be due to the fact that the
cross-sectional return distributions in emerging markets are far from normal and in particular have much fatter
tails, as documented by Bekaert et al. (1998).5 The excess return of small caps versus the complete universe is 0.48% with a t statistic of 2.04, while the
excess return versus large caps equals 0.60% with a t statistic of 1.77.
J. van der Hart et al. / Journal of Empirical Finance 194 (2002) 1–288
ARTICLE IN PRESS
the findings of Barry et al. (2002), who report that the size premium is not robust to the
removal of extreme returns (which generally occur for the smallest stocks).
The strategies based on analysts’ earnings revisions prove to be quite successful.
Relative to the EWI, the top portfolios generate statistically significant excess returns of
0.3% per month, irrespective of whether revisions for the current or for the next fiscal year
are used. Excess returns for the TMB portfolios also are strongly significant and equal
about 0.6% per month. Our results concerning the usefulness of earnings revisions for
emerging markets confirm the findings of Achour et al. (1998) for the much larger set of
countries considered here.
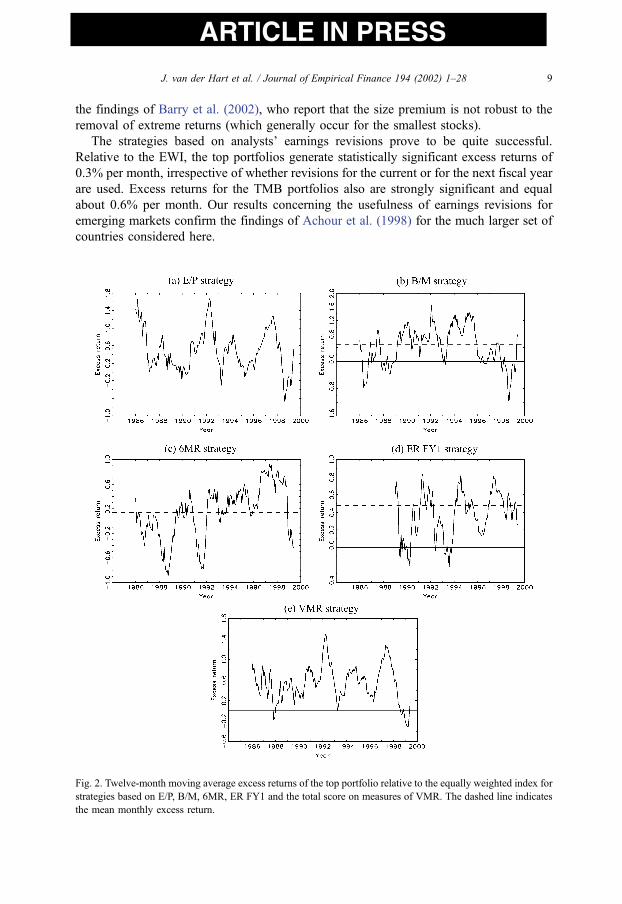
Fig. 2. Twelve-month moving average excess returns of the top portfolio relative to the equally weighted index for
strategies based on E/P, B/M, 6MR, ER FY1 and the total score on measures of VMR. The dashed line indicates
the mean monthly excess return.
J. van der Hart et al. / Journal of Empirical Finance 194 (2002) 1–28 9

ARTICLE IN PRESS
The performance of the strategies based on E/P, B/M, 6-month momentum (6MR) and
earnings revisions for the current fiscal year (ER FY1) over time is shown in Figs. 2 and 3,
which plot 12-month moving average excess returns and cumulative excess returns,
respectively, of the winners portfolios relative to the EWI. For three of these four strategies,
the performance improves considerably over time. Over the period from January 1985 until
December 1990, the average monthly excess returns from the B/M, 6MR, and ER FY1
strategies are equal to 0.41%, � 0.03% and 0.02 11.%, respectively, which increase to
0.55%, 0.27% and 0.40% over the period January 1991–May 1999. Notably, this is not the
case for the E/P strategy, for which the monthly excess return is equal to 0.53% in both
subperiods. Finally, the E/P and B/M strategies were clearly affected by the Asia crisis in
1997–1998 during which they underperformed relative to the EWI, although by 1999, the
cumulative returns from these strategies had rebounced to precrisis level. By contrast, the
performance of the earnings revisions strategy did not deteriorate during this period.
3.2. Multivariate strategies
Ranking firms on a single indicator can easily lead to misclassification of stocks. For
example, value stocks with temporarily depressed earnings that might be expected to
recover quickly can nevertheless drop out of the winners portfolio or even be assigned to
the losers portfolio if firms are ranked on E/P only. Following Lakonishok et al. (1994) and
Chan et al. (1996), among others, we therefore consider multivariate strategies that rank
stocks on multiple indicators. However, our methodology differs slightly from these
studies, which combine independent rankings based on two or more factors.
We consider multivariate strategies based on value, momentum and earnings revisions
indicators, in particular E/P and B/M (value), past 6- and 12-month returns (momentum)
and earnings revisions for the current and next fiscal year (revisions). These variables are
selected because they have been found to be the most successful strategies in developed
Fig. 3. Cumulative excess return of the top portfolio relative to the equally weighted index for strategies based on
E/P, B/M, 6MR, ER FY1 and the total score on measures of VMR.
J. van der Hart et al. / Journal of Empirical Finance 194 (2002) 1–2810

ARTICLE IN PRESS
markets. Note that these strategies also are among the best-performing univariate strategies
in emerging markets, as shown in Table 1.
All six variables are normalized by subtracting the cross-sectional median and dividing
by the median absolute deviation. We use the median and median absolute deviation instead
of the mean and standard deviation to limit the influence of outliers. The effect of outliers is
further reduced by trimming the normalized variables at values of F 3. The ‘‘score’’ for the
multivariate strategy then is obtained as the sum of the relevant normalized variables. For
example, to obtain the score of a stock for the ‘‘value and momentum’’ strategy, we add the
normalized values for E/P, B/M and 6- and 12-month returns. Based on the ranking
according to this overall score, the top and bottom 15% of stocks are combined into equally
weighted winners and losers portfolios, as in the univariate strategies.
Table 2 summarizes the results of the multivariate strategies. It is seen that combining
different characteristics leads to higher (excess) returns in all cases. The winners portfolio
of the strategy based on value and revisions (VR) generates the highest average excess
returns, equal to 0.62% and 1.31% relative to the EWI and the losers portfolio,
respectively. Adding momentum to this strategy lowers these excess returns slightly to
0.56% and 1.19%. However, because the volatility of the excess returns decreases more
than proportionally, the corresponding t statistics are actually higher than for the VR
strategy. A possible explanation for this effect is the negative correlation between the
excess returns of the momentum strategy and the excess returns of the value and earnings
revisions strategies, which are equal to � 0.32 and � 0.20, respectively.6
Table 2
Returns of multivariate stock selection strategies
Strategy Top EWI Bottom TMI t (TMI) TMB t (TMB)
Value 1.99 1.37 0.77 0.60 4.45 1.22 4.97
Momentum 1.72 1.55 1.29 0.17 1.60 0.44 2.23
Revisions 0.78 0.48 0.19 0.30 3.14 0.61 4.40
VM 2.02 1.50 0.92 0.51 5.04 1.11 5.87
VR 1.97 1.35 0.67 0.62 4.76 1.31 5.86
MR 1.81 1.55 1.28 0.26 2.64 0.54 3.02
VMR 2.07 1.50 0.88 0.56 5.79 1.19 6.85
At the beginning of each month between January 1985 and May 1999, normalized values of E/P and B/M (value),
past 6- and 12-month returns (momentum), and earnings revisions for the current and next fiscal year (revisions)
are computed by subtracting the cross-sectional median and dividing by the median absolute deviation, and
trimming the normalized values at F 3. The sum of the normalized values of the relevant variables gives the score
for the different multivariate strategies: VM denotes the value and momentum strategy, VR value and revisions,
MR momentum and revisions, and VMR value, momentum and revisions. All stocks for which the relevant score
is available are ranked by country in descending order. Equally weighted portfolios are formed from the top and
bottom 15% of stocks, which are combined into equally weighted internationally diversified portfolios (Top and
Bottom). EWI is the equally weighted portfolio of all stocks in the sample. Positions are held for 6 months and are
not rebalanced. Monthly, nonoverlapping returns are computed as the average return of the six similar portfolios
that are held during each month. Columns 2–4 report the average returns of the Top, EWI and Bottom portfolios,
expressed as percentage per month. Columns 5–6 and 7–8 report the average excess returns and the
corresponding t statistics of the TMI portfolio and the TMB portfolio, respectively.
6 The correlation between the excess returns of the value and revisions strategies is equal to 0.22.
J. van der Hart et al. / Journal of Empirical Finance 194 (2002) 1–28 11

AR
TIC
LE
IN P
RE
SS
Table 3
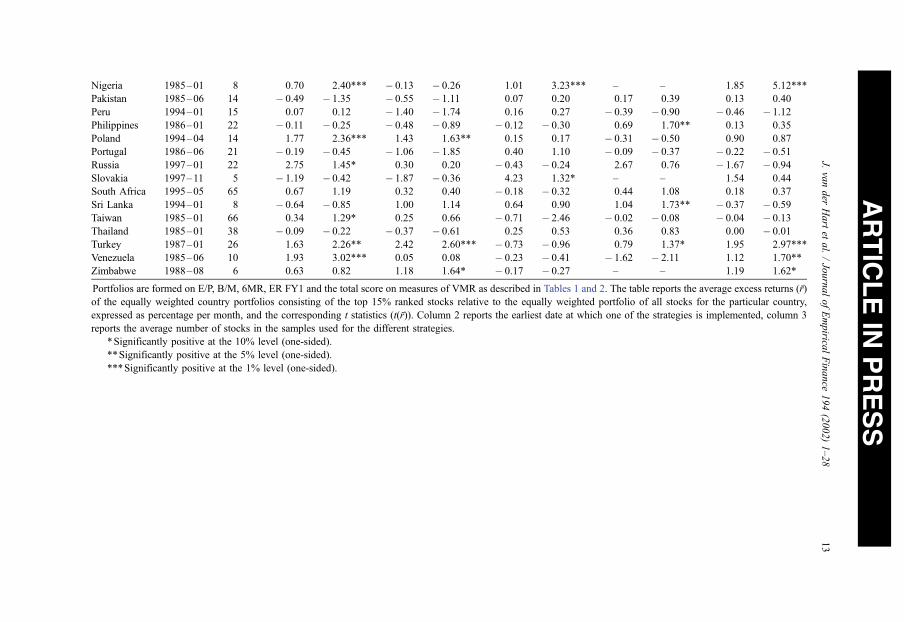
Excess returns of stock selection strategies by country
Country Starting Average E/P B/M 6MR ER FY1 VMR
date no. of
stocksr̄ t(r̄) r̄ t(r̄) r̄ t(r̄) r̄ t(r̄) r̄ t(r̄)
Argentina 1985–01 19 0.66 1.59* � 0.09 � 0.18 � 0.15 � 0.35 0.90 1.85** 0.39 0.88
Brazil 1985–06 36 0.78 1.04 1.29 1.63* � 0.29 � 0.41 � 0.58 � 1.32 0.22 0.28
Chile 1985–01 31 0.37 1.37* 0.68 2.16** 0.65 2.45*** 0.47 1.49* 0.69 2.58***
China 1995–10 140 0.37 0.36 0.12 0.10 0.27 0.51 – – 0.49 0.76
Colombia 1986–09 14 � 0.06 � 0.12 � 1.02 � 1.70 � 0.31 � 0.85 0.43 0.69 � 0.05 � 0.11
Czech Rep. 1996–01 20 � 0.13 � 0.14 � 1.05 � 1.05 0.42 0.47 1.69 2.78*** 0.67 0.92
Egypt 1997–01 27 0.36 0.40 0.10 0.17 0.15 0.24 – – 0.19 0.27
Greece 1986–12 23 0.34 0.96 0.63 1.05 0.91 2.30** 0.94 2.92*** 0.73 2.28**
Hungary 1994–04 8 0.50 0.58 1.14 1.20 0.91 1.44* 1.17 1.59* 2.48 4.31***
India 1985–01 65 � 0.40 � 1.30 � 0.38 � 0.98 0.67 2.83*** 0.62 2.80*** 0.21 0.80
Indonesia 1989–12 32 � 0.05 � 0.10 � 0.01 � 0.02 � 0.15 � 0.38 0.72 1.48* 0.20 0.50
Israel 1997–11 44 0.15 0.20 0.70 1.14 � 0.19 � 0.27 � 0.09 � 0.19 0.41 0.86
Jordan 1985–01 6 � 0.27 � 0.80 � 0.72 � 1.54 0.29 0.94 – – � 0.21 � 0.66
Korea 1985–01 82 0.67 2.26** 0.81 2.65*** � 0.30 � 0.95 0.52 2.76*** 0.57 1.84**
Malaysia 1985–01 70 0.50 1.76** 0.68 1.84** � 0.09 � 0.27 0.10 0.43 0.45 2.09**
Mexico 1985–01 49 0.42 1.09 � 0.05 � 0.10 0.28 0.96 0.42 1.71** 0.35 0.97
Morocco 1997–01 13 0.12 0.26 � 0.81 � 1.43 0.43 0.74 – – � 0.30 � 0.70
J.vander
Hartet
al./JournalofEmpirica
lFinance
194(2002)1–28
12
AR
TIC
LE
IN P
RE
SS
Nigeria 1985–01 8 0.70 2.40*** � 0.13 � 0.26 1.01 3.23*** – – 1.85 5.12***
Pakistan 1985–06 14 � 0.49 � 1.35 � 0.55 � 1.11 0.07 0.20 0.17 0.39 0.13 0.40
Peru 1994–01 15 0.07 0.12 � 1.40 � 1.74 0.16 0.27 � 0.39 � 0.90 � 0.46 � 1.12
Philippines 1986–01 22 � 0.11 � 0.25 � 0.48 � 0.89 � 0.12 � 0.30 0.69 1.70** 0.13 0.35
Poland 1994–04 14 1.77 2.36*** 1.43 1.63** 0.15 0.17 � 0.31 � 0.50 0.90 0.87
Portugal 1986–06 21 � 0.19 � 0.45 � 1.06 � 1.85 0.40 1.10 � 0.09 � 0.37 � 0.22 � 0.51
Russia 1997–01 22 2.75 1.45* 0.30 0.20 � 0.43 � 0.24 2.67 0.76 � 1.67 � 0.94
Slovakia 1997–11 5 � 1.19 � 0.42 � 1.87 � 0.36 4.23 1.32* – – 1.54 0.44
South Africa 1995–05 65 0.67 1.19 0.32 0.40 � 0.18 � 0.32 0.44 1.08 0.18 0.37
Sri Lanka 1994–01 8 � 0.64 � 0.85 1.00 1.14 0.64 0.90 1.04 1.73** � 0.37 � 0.59
Taiwan 1985–01 66 0.34 1.29* 0.25 0.66 � 0.71 � 2.46 � 0.02 � 0.08 � 0.04 � 0.13
Thailand 1985–01 38 � 0.09 � 0.22 � 0.37 � 0.61 0.25 0.53 0.36 0.83 0.00 � 0.01
Turkey 1987–01 26 1.63 2.26** 2.42 2.60*** � 0.73 � 0.96 0.79 1.37* 1.95 2.97***
Venezuela 1985–06 10 1.93 3.02*** 0.05 0.08 � 0.23 � 0.41 � 1.62 � 2.11 1.12 1.70**
Zimbabwe 1988–08 6 0.63 0.82 1.18 1.64* � 0.17 � 0.27 – – 1.19 1.62*
Portfolios are formed on E/P, B/M, 6MR, ER FY1 and the total score on measures of VMR as described in Tables 1 and 2. The table reports the average excess returns (r̄)
of the equally weighted country portfolios consisting of the top 15% ranked stocks relative to the equally weighted portfolio of all stocks for the particular country,
expressed as percentage per month, and the corresponding t statistics (t(r̄)). Column 2 reports the earliest date at which one of the strategies is implemented, column 3
reports the average number of stocks in the samples used for the different strategies.
*Significantly positive at the 10% level (one-sided).
**Significantly positive at the 5% level (one-sided).
***Significantly positive at the 1% level (one-sided).
J.vander
Hartet
al./JournalofEmpirica
lFinance
194(2002)1–28
13

ARTICLE IN PRESS
The (cumulative) outperformance of the value, momentum and revisions (VMR)
strategy is shown in Figs. 2 and 3. The excess return is approximately constant over time
(equal to 0.55% and 0.57% per month during the pre- and post-1991 periods), which
obviously is due to the inclusion of E/P as one of the characteristics. Note that the
cumulative profits remained roughly stable during the last 2 years of the sample period.
Apparently, the negative performance of the value strategies canceled out against the
positive performance of the earnings revisions strategy during the Asia crisis.
3.3. Profitability by country and region
The results presented so far concern internationally diversified (but country-neutral)
portfolios. Table 3 summarizes the excess returns of the winners portfolios in the E/P, B/M,
6MR, ER FY1 and VMR strategies for the individual countries in our sample. Excess
returns in this case are measured relative to the local equally weighted index. We
concentrate on these strategies in the following as they were the most successful ones
for the international portfolio.
For the univariate strategies, only few countries have significantly positive excess
returns. In fact, for the B/M and 6MR strategies, excess returns actually are negative for
almost half of the countries. The results do not improve notably for the multivariate VMR
strategy. Our findings again correspond with Rouwenhorst (1999), who finds very few
significant excess returns of winners minus losers portfolios for individual countries for
different value and momentum strategies.
The combined results in Tables 1–3 clearly demonstrate the benefits from international
diversification for investing in emerging markets. The small number of stocks in most
countries, together with the high volatility of returns, prevents successful implementation
of the stock selection strategies in individual markets. Because of the (unreported) low
correlations between the returns in different countries, applying the trading strategies
globally reduces portfolio risk considerably, such that significant excess returns can be
gained. This corresponds with the findings of Serra (2000), who documents that country
effects are important factors in the behavior of emerging markets’ returns.
Panel (a) of Table 4 shows that aggregating to a regional level is sufficient in principle,
although not all strategies work equally well in all regions. The E/P and B/M value
strategies earn significant excess returns in all regions, the 6-month momentum strategy
outperforms the EWI in Europe/Middle East/Asia (EMEA) and Latin America but not in
Asia, whereas the excess return of the ER FY1 revisions strategy is significant in Asia but
not in EMEA and Latin America. The combined value, momentum and revisions strategy
generates outperformance against the EWI in all three regions.
3.4. Stock selection versus country selection
The strategies considered above are country-neutral, in the sense that by selecting the
top and bottom 15% ranked stocks by country, the resulting international portfolios do not
take a net position in any country (relative to the EWI). The excess returns of these
strategies thus purely derive from stock selection. By contrast, most research on trading
strategies in emerging markets has focused on country selection and, in fact, the same
J. van der Hart et al. / Journal of Empirical Finance 194 (2002) 1–2814

ARTICLE IN PRESS
return factors that are found useful for individual stock selection here have been found
useful for country selection (see Harvey, 1995; Bekaert et al., 1997, among others).7
We investigate whether country selection can add to the profitability of the stock
selection strategies by ranking stocks globally and forming an equally weighted portfolio
consisting of the top 15% stocks in this alternative ranking. This procedure implicitly
Table 4
Excess returns of country-neutral stock selection strategies by region, of global selection strategies and of stock
selection strategies for nonliberalized and liberalized countries
Region E/P B/M 6MR ER FY1 VMR
r̄ t(r̄) r̄ t(r̄) r̄ t(r̄) r̄ t(r̄) r̄ t(r̄)
Base case 0.53 4.45 0.49 2.99 0.14 1.41 0.31 3.43 0.56 5.79
Panel (a): excess returns by region
Asia 0.38 1.99 0.32 2.08 0.065 0.48 0.35 2.38 0.40 3.29
EMEA 1.08 3.64 0.59 2.13 0.44 1.68 0.23 0.83 0.99 3.77
Latin America 0.77 2.79 0.65 2.72 0.32 1.57 0.41 1.02 0.64 2.86
Panel (b): excess returns of global selection strategies
Global 1.12 3.52 0.96 3.37 0.61 1.67 0.58 2.36 1.45 4.67
Country selection 0.49 1.88 0.46 1.79 0.57 1.74 0.31 1.33 0.95 3.61
Stock selection 0.63 5.16 0.50 5.12 0.042 0.36 0.27 2.87 0.50 4.69
Panel (c): excess returns for liberalized and nonliberalized countries
Nonliberalized (BH) 0.54 2.09 � 0.25 � 0.73 0.15 0.88 0.43 2.19 0.51 2.54
Liberalized (BH) 0.47 3.62 0.51 2.43 0.25 1.61 0.23 1.90 0.43 3.59
Nonliberalized (BEW) 0.29 1.86 0.49 2.45 0.23 1.61 0.22 1.81 0.39 3.57
Liberalized (BEW) 0.55 4.19 0.62 3.40 0.25 2.01 0.38 3.99 0.59 5.31
Noninvestables 0.63 2.96 0.45 1.77 0.45 2.73 0.66 2.72 0.68 3.91
Investables 0.37 2.54 0.62 3.58 0.23 1.54 0.26 2.09 0.55 4.93
Portfolios are formed on E/P, B/M, 6MR, ER FY1 and the total score on measures of VMR as described in Tables
1 and 2. The row labelled ‘‘Base case’’ repeats the results from Tables 1 and 2 for equally weighted country-
neutral portfolios. Panel (a) reports results from applying country-neutral selection strategies per region. Asia
includes China, India, Indonesia, Korea, Malysia, Pakistan, Philippines, Sri Lanka, Taiwan and Thailand; EMEA
includes Czech Republic, Egypt, Greece, Hungary, Israel, Jordan, Morocco, Nigeria, Poland, Portugal, Russia,
Slovakia, South Africa, Turkey and Zimbabwe; Latin America includes Argentina, Brazil, Chile, Colombia,
Mexico, Peru and Venezuela. Panel (b) reports results for portfolios for global selection strategies, which are
formed by ranking stocks globally. The table reports the average excess returns (r̄) of the equally weighted
portfolios consisting of the top 15% ranked stocks relative to the equally weighted portfolio of all stocks in the
region or size segment, expressed as percentage per month, and the corresponding t statistics (t(r̄)). The final two
rows of panel (b) show the decomposition of the total excess return of the global strategies into parts due to
country selection and stock selection. Panel (c) reports results from applying country-neutral selection strategies
to liberalized and nonliberalized countries separately. Rows labelled (BH) use the official liberalization dates
reported by Bekaert and Harvey (2000a,b) to determine when an emerging country liberalized its financial
market. Rows labelled (BEW) use the measure for the level of foreign ownership restrictions from Bekaert (1995)
and Edison and Warnock (2001) to determine the degree of liberalization. For the final two rows, the universe
consists of stocks which are included in the IFC Investable index or not.
7 The same appears to be true for developed equity markets (see Asness et al., 1997; Richards, 1997; Chan et
al., 2000, among others).
J. van der Hart et al. / Journal of Empirical Finance 194 (2002) 1–28 15

ARTICLE IN PRESS
allows the winners and losers portfolios to take net positions in the different emerging
market countries (relative to the EWI). Panel (b) of Table 4 shows the monthly excess
returns of global strategies. It is seen that including country selection doubles the excess
returns of the E/P, B/M and E/R FY1 strategies and even quadruples the excess return of
the 6-month momentum strategy. However, at the same time, the volatility of the excess
returns increases proportionally, such that the t statistics of the global strategies are of
comparable magnitude or even smaller than for the country-neutral strategies.
We decompose the excess returns of the global selection strategies into parts that are
due to country selection and due to stock selection. The second and third rows of panel (b)
of Table 4 show that for the E/P, B/M and ER FY1 strategies, country and stock selection
contribute roughly equally to the total excess returns. The excess returns due to country
selection are, however, much more volatile than the excess returns due to stock selection.
Finally, it is noteworthy that the outperformance of the global 6-month momentum
strategy is almost entirely due to country selection.
4. Stock selection and financial market liberalization
The analysis presented in the previous section implicitly assumes that all stocks in the
IFC Emerging Markets Database were accessible to foreign investors historically. This,
however, generally is not the case. Many emerging countries reformed their financial
systems only during the late 1980s and early 1990s, where to a large extent these reforms
were aimed at opening the stock market to foreign investors. Bekaert (1995) and Bekaert
and Harvey (2000a,b) provide detailed chronologies of these financial market liberaliza-
tions. As noted in Section 1, several recent studies document that these liberalizations have
had substantial effects on key macroeconomic and financial variables, such as economic
growth and the cost of capital. Financial market liberalizations may also have affected the
profitability of stock selection strategies, although the impact is not known a priori. On the
one hand,8 liberalization may lead to more openness and efficiency of asset prices, hence
reducing the scope for selection strategies such as the ones considered here. On the other
hand, it sometimes is argued that imperfections are more prevalent in international (and
integrated) capital markets than in domestic (and segmented) markets, due to more severe
asymmetric information problems. In this case, stock selection strategies may become
more profitable following financial market liberalization.
We explore this issue in several different ways. First, we form universes of stocks from
nonliberalized and liberalized countries using the official liberalization dates from Bekaert
and Harvey (2000a,b) to decide upon the status of each emerging market at each point in
8 If wip and wi
b denote the weights of country i in the portfolio and the (equally weighted index) benchmark,
respectively, and rip and ri
b denote the corresponding country returns, the total excess return of the global portfolio
is given byP
iðwpi r
pi � wb
i rbi Þ. This can be written as
Piðw
pi r
pi � wb
i rbi Þ ¼
Piðw
pi w
bi Þrbi þ
Piðr
pi r
bi Þw
pi . The first
term on the right-hand side then measures the contribution of country selection to the total excess return, and the
second term measures the contribution of stock selection. Note that the stock selection contribution is not exactly
equal to the country-neutral results due to variations in the country weights and in the percentage of stocks
selected in each country.
J. van der Hart et al. / Journal of Empirical Finance 194 (2002) 1–2816

ARTICLE IN PRESS
time.9 The ‘‘liberalized’’ universe is empty until July 1986 (which is the official
liberalization date for Portugal) and gradually expands over time. The ‘‘nonliberalized’’
universe, initially consisting of all countries in our data set, shrinks over time until it
becomes empty in August 1995.10 We apply the country-neutral stock selection strategies
to these two universes separately, constructing winners and losers portfolios as before. The
first two lines in panel (c) of Table 4 show that the effect of liberalization on the
profitability of the selection strategies is ambiguous: For the strategies based on E/P and
earnings revisions and the multivariate strategy, the average return is somewhat lower
when applied to stocks from liberalized countries, but for the B/M and 6MR strategies, it is
higher. In fact, for none of the strategies, we can reject the null hypothesis that the average
excess returns in liberalized and nonliberalized countries are equal. Also note that, even
though the average returns of the E/P and VMR strategies are lower in liberalized
countries, the corresponding t statistics actually increase, suggesting that the risk of these
strategies is reduced more than proportionally.
Using official liberalization (or any other) dates to determine the accessibility of
emerging stock markets implies a rather rigorous view on financial market liberalization as
a one-time event constituting an instantaneous and complete opening to foreign investors.
However, it is widely recognized that most emerging market liberalizations have been
gradual processes, with restrictions on foreign investment being removed in several rounds
of liberalization measures (see Henry, 2000; Edison and Warnock, 2001, among others).
Hence, designating a specific point in time as the moment of financial liberalization may
be problematic (see also Bekaert et al., 2002). Therefore, as a second test of the effects of
liberalization on the performance of stock selection strategies, we follow Bekaert (1995)
and Edison and Warnock (2001) in using their measure of the intensity of capital controls
as an indicator of the ‘‘degree of liberalization’’ of a particular emerging market. This
measure, denoted as FORi,t, is defined as one minus the ratio of the market capitalizations
of the IFC Investables and IFC Global indices of country i at time t.11 As the name
suggests, stocks that are included in the IFC Investables index are ‘‘investable’’, in the
sense that they can be bought and sold by foreign investors. On the other hand, the IFC
Global index is intended to represent the stock market as a whole. Hence, FORi,t being
9 We assume that those countries in our data set for which Bekaert and Harvey (2000a,b) do not provide an
official liberalization date were liberalized for the complete sample period. The results are not sensitive to this
assumption.10 Because the liberalized universe contains a very small number of stocks during the first few years of the
sample period and because the IFC Investables index (to be discussed below) is available from December 1988
onwards only, all results reported in this section relate to the period January 1989–May 1999.11 To remove the effects of asymmetric price shocks, we smooth the measure by dividing the market
capitalizations by the respective price indices (cf. Edison and Warnock, 2001), that is, the measure of the level of
country i’s foreign ownership restrictions at time t is given by
FORi;t ¼ 1�MCIFCI
i;t =PIFCIi;t
MCIFCGi;t =PIFCGi;t
;
where MCi,t and Pi,t are the market capitalization and level, respectively, of country i’s IFC Investable (IFCI) or
Global (IFCG) price indices at time t.
J. van der Hart et al. / Journal of Empirical Finance 194 (2002) 1–28 17

ARTICLE IN PRESS
equal to 0 (1) implies that a market is fully open (closed) to foreign investors. From the
country-neutral selection strategies applied to the universe consisting of all stocks, we coin
a fraction FORi,t of the returns for the portfolios of country i at time t as ‘‘nonliberalized’’
return, whereas the remainder is regarded as ‘‘liberalized’’ return. These returns are
aggregated across countries to obtain returns on internationally diversified portfolios. The
results from this exercise are shown in the third and fourth rows of panel (c) in Table 4. We
now find that liberalization actually enhances the performance not only for the B/M and
momentum strategies, but also for the E/P, ER FY1 and VMR strategies, although, again,
we cannot reject equality of the average excess returns in the two universes for all
strategies.
The previous analysis only gives a rough indication of the profitability of the stock
selection strategies when accounting for restrictions on foreign ownership, as we do not
explicitly incorporate information on which individual stocks are available to foreign
investors. To perform such a test more directly, we consider the performance of the
selection strategies on universes consisting of stocks that are included in the IFC
Investables index and of stocks that are not. The final two rows of panel (c) in Table 4
show that all strategies except the one based on B/M perform slightly better when
applied to noninvestable stocks. Note, however, that the outperformance of all strategies
except 6MR is still statistically significant when selection is restricted to investable
stocks only. Furthermore, the null hypothesis that the average excess returns for
investable and noninvestable stocks are equal cannot be rejected for any of the
strategies.
In sum, the results in this section convincingly suggest that financial market liberaliza-
tion has not affected the performance of the stock selection strategies. Irrespective of the
way in which liberalization is measured, the selection strategies earn significant excess
returns in both liberalized and nonliberalized markets.
5. Stock selection and global risk factors
There is an ongoing debate concerning the appropriate interpretation of the profitability
of value, momentum and revisions strategies. Roughly speaking, the competing explan-
ations can be grouped under the headings ‘‘compensation for risk’’ on the one hand and
‘‘market inefficiency’’, due to under- or overreaction of investors to newly arriving
information, on the other.12 Here, we test whether the success of the selection strategies in
emerging markets can be attributed to exposure to global risk factors by using the four-
factor regression model developed by Fama and French (1993, 1996) and Carhart (1997).
This model explains portfolio returns in excess of the risk-free rate (Rp,t�Rf,t) by
sensitivities to the excess return on the market portfolio (RM,t�Rf,t) and the difference
between the returns on portfolios of stocks with high and low book-to-market values
(RHML,t, High-Minus-Low), on portfolios of stocks with small and large market capital-
12 See Barberis and Thaler (in press) for a recent survey of this literature on ‘‘behavioral finance’’ and Fama
(1998) for a critical evaluation.
J. van der Hart et al. / Journal of Empirical Finance 194 (2002) 1–2818

ARTICLE IN PRESS
ization (RSMB,t, Small-Minus-Big), and on portfolios of stocks with high and low
momentum (RUMD,t, Up-Minus-Down). That is, the model is given by
Rp;t � Rf ;t ¼ a þ bMðRM;t � Rf ;tÞ þ bHMLRHML;t þ bSMBRSMB;t þ bUMDRUMD;t þ et:
ð1Þ
The returns on the (equally weighted)13 global market index and global HML, SMB and
UMD factors are constructed using the methodology described in detail by Fama and
French (1998).14 The four-factor model is estimated with Rp,t being the returns on the top
and bottom portfolios in the different strategies, the corresponding universes of emerging
market stocks, and the TMI and TMB excess returns. As these excess returns can be
interpreted as the returns on zero-investment strategies, the risk-free interest rate is not
included on the left-hand side of Eq. (1) in those cases.
The estimation results in Table 5 show a number of interesting features. First, the
estimates of bM are significantly less than 1 for all top and bottom portfolios and universes
of emerging market stocks, except for the earnings revisions strategy. This finding can
probably be attributed to the fact that the emerging markets were not completely
liberalized and integrated with global equity markets during the first part of our sample
period. This is also suggested by the estimates of betas for portfolios in the E/R strategy,
for which the sample starts only in 1988.15 Note that for all selection strategies, the betas
for the top portfolio are not significantly higher than the betas for the corresponding
universe and bottom portfolio. The resulting estimates of beta when the excess returns of
the winners portfolio relative to the universe or losers portfolio are used as dependent
variable therefore are close to zero for all selection strategies considered. Second, the
emerging market portfolios are virtually insensitive to the global HML, SMB and UMD
factors. For the top and bottom portfolios and universes, the estimates of bSMB and bUMD
are never significant, while the estimates of bHML are significant only for a few cases in the
E/P, B/M and VMR strategies. Furthermore, the sensitivities of the TMI and TMB excess
returns are never significantly different from zero, except for the HML and UMD factors in
case of the E/P and momentum strategies, respectively. Third, and most important, the
estimated intercepts a for the TMI and TMB excess returns are significantly different from
zero for all strategies, and they are very close to the raw excess returns reported in Tables 1
13 Using a value-weighted global market index and risk factors based on value-weighted portfolios leads to
similar conclusions. Detailed results are available on request.14 The SMB and HML factor returns are constructed as follows. Using a database of global stocks (which is
constructed using the same data screens as applied to the universe of emerging market stocks, see Section 2.1 for
details) we form two portfolios based on monthly rankings according to size (measured by market capitalization)
and three portfolios based on monthly rankings according to book-to-market by country. The size break-point is
the (local) median market capitalization, while the B/M break-points are the (local) 30th and 70th percentiles.
Taking the intersection of these independent rankings, we obtain six portfolios for each country, which, in turn,
are combined into equally weighted global portfolios. The SMB factor return is the average return (in US dollars)
on the three ‘‘small’’ portfolios minus the average return on the three ‘‘big’’ portfolios. The HML factor return is
the average return on the two value portfolios minus the average return on the two growth portfolios. The UMD
factor is constructed using a similar procedure, but using the prior 6-month return instead of B/M.15 Estimating Eq. (1) with a 5-year rolling sample confirms this explanation, in the sense that the estimates of
bM show a tendency to increase over time.
J. van der Hart et al. / Journal of Empirical Finance 194 (2002) 1–28 19

ARTICLE IN PRESS
and 2. Hence, global book-to-market, size and momentum risk factors cannot explain the
outperformance of stock selection strategies in emerging markets. This corroborates the
results obtained by Rouwenhorst (1999) using a two-factor model with only the HML
factor included next to the market portfolio return.
Table 5
Four-factor regressions for winners and losers portfolios in stock selection strategies using global factor portfolios
Portfolio a t(a) bM t(bM[� 1]) bHML t(bHML) bSMB t(bSMB) bUMD t(bUMD) R̄2
E/P Top 0.99 2.33 0.72 � 3.02 0.83 2.47 0.30 0.80 0.06 0.25 0.29
EWI 0.52 1.28 0.71 � 3.21 0.59 1.84 0.32 0.89 0.03 0.11 0.29
Bottom 0.13 0.29 0.67 � 3.35 0.54 1.54 0.27 0.69 � 0.02 � 0.09 0.23
TMI 0.47 3.59 0.01 0.19 0.24 2.33 � 0.02 � 0.15 0.04 0.46 0.02
TMB 0.86 4.20 0.05 1.04 0.29 1.79 0.03 0.16 0.09 0.71 0.00
B/M Top 1.05 2.24 0.76 � 2.33 0.61 1.65 0.38 0.92 � 0.15 � 0.51 0.27
EWI 0.51 1.26 0.71 � 3.26 0.57 1.76 0.32 0.90 0.03 0.11 0.29
Bottom 0.15 0.34 0.70 � 3.16 0.68 1.99 0.19 0.51 0.14 0.52 0.26
TMI 0.54 2.96 0.05 1.27 0.05 0.32 0.06 0.36 � 0.18 � 1.57 0.03
TMB 0.90 3.07 0.06 0.90 � 0.06 � 0.27 0.19 0.72 � 0.28 � 1.58 0.01
6MR Top 0.90 2.31 0.72 � 3.22 0.33 1.09 0.42 1.22 0.04 0.17 0.30
EWI 0.77 2.04 0.72 � 3.33 0.38 1.28 0.49 1.48 � 0.07 � 0.32 0.33
Bottom 0.48 1.18 0.73 � 3.00 0.43 1.35 0.52 1.45 � 0.24 � 0.95 0.32
TMI 0.12 1.13 0.00 0.11 � 0.05 � 0.58 � 0.08 � 0.81 0.11 1.70 0.03
TMB 0.42 2.14 � 0.01 � 0.18 � 0.10 � 0.63 � 0.10 � 0.58 0.28 2.30 0.06
ER FY1 Top 0.13 0.28 0.96 � 0.35 0.42 1.13 � 0.10 � 0.25 � 0.22 � 0.80 0.43
EWI � 0.16 � 0.35 0.95 � 0.44 0.47 1.24 � 0.02 � 0.05 � 0.30 � 1.04 0.42
Bottom � 0.35 � 0.72 0.94 � 0.48 0.43 1.09 0.04 0.08 � 0.32 � 1.10 0.40
TMI 0.29 2.76 0.01 0.44 � 0.05 � 0.61 � 0.08 � 0.85 0.08 1.19 0.02
TMB 0.47 3.08 0.02 0.48 � 0.01 � 0.08 � 0.14 � 0.98 0.10 1.11 � 0.00
VMR Top 1.22 3.09 0.74 � 3.00 0.49 1.57 0.35 1.00 � 0.02 � 0.10 0.32
EWI 0.69 1.84 0.72 � 3.32 0.49 1.63 0.45 1.37 � 0.04 � 0.17 0.34
Bottom 0.11 0.29 0.70 � 3.64 0.55 1.81 0.37 1.11 � 0.12 � 0.52 0.33
TMI 0.53 4.90 0.01 0.54 0.01 0.09 � 0.10 � 1.08 0.02 0.24 � 0.01
TMB 1.11 5.86 0.04 1.01 � 0.05 � 0.35 � 0.02 � 0.12 0.10 0.83 � 0.01
The table presents coefficient estimates and t statistics from the four-factor model
Rp;t � Rf ;t ¼ a þ bMðRM;t � Rf ;tÞ þ bHMLRHML;t þ bSMBRSMB;t þ bUMDRUMD;t þ et ;
where Rf,t is the 1-month US T-bill return, RM,t is the global market return and RHML,t (High-Minus-Low), RSMB,t
(Small-Minus-Big) and RUMD,t (Up-Minus-Down) are returns on global book-to-market, size and momentum
factor portfolios. See Footnote 14 for details on the construction of these factors. Rp,t is the return on the winners
or losers portfolio in a particular strategy (rows labelled ‘‘Top’’ and ‘‘Bottom’’, respectively), the corresponding
universe of emerging market stocks (EWI), or the excess return on the top portfolio relative to the equally
weighted index (TMI) or bottom portfolio (TMB). The risk-free interest rate is not included on the left-hand side
in regressions involving the TMI and TMB excess returns. t(.) is the t statistic for the regression coefficients.
t(bM[� 1]) is the t statistic of bM minus 1 for the regressions with Rp,t being the return on the winners or losers
portfolio or the equally weighted index; t(bM[� 1]) is the t statistic of bM for the regressions involving the TMI
and TMB excess returns. The regression R̄2 is adjusted for degrees of freedom.
J. van der Hart et al. / Journal of Empirical Finance 194 (2002) 1–2820
ARTICLE IN PRESS
A few qualifications regarding the above results are in order. First, we have assumed
that the factor loadings in Eq. (1) are constant. As shown by Ferson and Harvey (1999),
this assumption is unrealistic even for portfolios of stocks from developed markets.
Indeed, in the rolling sample regressions mentioned in Footnote 15, not only did we find
that bM tends to increase over time, but also that the exposures to the other factors in the
model, as well as the intercept a, show substantial variation. However, there are no easily
discernible patterns. For example, it generally is not the case that a gradually declines over
time or becomes insignificant.
Second, the use of global risk factors in Eq. (1) implicitly assumes that emerging
markets were fully integrated with world capital markets during the complete sample
period. As argued in Section 4, this surely has not been not the case. Estimating the four-
factor model for returns on portfolios consisting of stocks from liberalized or non-
liberalized countries only, however, we do not find significant differences for these two
sets of portfolios.16 A more thorough investigation of these issues, using models that allow
the factor loadings to vary with conditioning variables, as in the work of Ferson and
Harvey (1999), or that allow for time-varying integration, as in the study by Bekaert and
Harvey (1995, 1997), is left for future research. The same holds for behavioral
explanations of the excess returns of the selection strategies in terms of investors’ under-
or overreaction.
6. Profitability in practice
The results presented in Section 3 suggest that various stock selection strategies
generate significant excess returns in emerging markets. A natural question to ask is
whether these strategies are still profitable if applied in practice by a large investor. Apart
from restrictions on foreign ownership as discussed in Section 4, factors that may prevent
successful implementation are lack of liquidity, occurrence of outliers, implementation lag
and presence of substantial transaction costs. We address this issue by evaluating the
selection strategies under different circumstances, which account for each of these aspects
in turn.
For a large investor, it is important that the stocks in the strategy portfolio have
sufficient size and liquidity. Even though from the outset, we have excluded the very
smallest stocks, with market capitalization below an equivalent of 100 million in
December 1998 US dollars (see Section 2.2), this might still be a cause for concern if
the excess returns of the strategies were mainly due to the smallest stocks that are included
in our universe or if the strategies tend to select the smallest or least liquid stocks. We
examine the role of size and liquidity in two different ways. First, we examine the
performance of the strategies for different size segments. All stocks in the sample are
divided according to market capitalization into three equally sized segments, which we call
small, mid and large caps. In addition, we also report results for the stocks that were
excluded at the outset of our analysis (mini caps).
16 To conserve space, detailed estimation results are not shown here, but they are available on request.
J. van der Hart et al. / Journal of Empirical Finance 194 (2002) 1–28 21

ARTICLE IN PRESS
Panel (a) of Table 6 shows that the E/P and B/M strategies generate the highest excess
returns for the larger size segments, whereas the 6-month momentum strategy seems to
work best for the excluded mini caps. The earnings revisions strategy attains the best
results for the small and mid cap stocks, but it has a negative excess return for the excluded
mini caps. The latter result can be explained by the low analyst coverage for the smallest
stocks. For the multivariate strategy, the excess returns are significant for all size segments
although they are negatively related to size. In sum, the profitability of the selection
strategies is not limited to a certain size segment.
Second, we compare the median market capitalization and the median turnover ratio for
the top and bottom portfolios and the equally weighted index of all stocks. Recall that the
turnover ratio is defined as the number of shares traded each month divided by the number
Table 6
Excess returns of modified stock selection strategies
Test E/P B/M 6MR ER FY1 VMR
r̄ t(r̄) r̄ t(r̄) r̄ t(r̄) r̄ t(r̄) r̄ t(r̄)
Base case 0.53 4.45 0.49 2.99 0.14 1.41 0.31 3.43 0.56 5.79
Panel (a): excess returns and market capitalization
Mini caps 0.33 1.54 0.61 2.38 0.48 2.43 � 0.17 � 0.53 0.43 2.39
Small caps 0.26 1.22 0.13 0.57 0.33 1.53 0.78 2.42 0.64 3.35
Mid caps 0.84 4.30 0.74 2.76 0.03 0.13 0.69 2.20 0.50 2.26
Large caps 0.48 2.64 0.60 2.04 0.07 0.34 0.20 1.81 0.43 2.60
Panel (b): excess returns, outliers and implementation delays
Median returns 0.30 2.97 � 0.06 � 0.47 0.28 3.24 0.38 4.70 0.47 5.71
Implementation lag 0.42 3.36 0.42 2.45 0.16 1.60 0.28 3.31 0.47 4.66
Panel (c): excess returns and transaction costs
Transaction costs 1% 0.35 2.93 0.34 2.08 � 0.13 � 1.31 0.05 0.59 0.35 3.55
Transaction costs 1.5% 0.26 2.16 0.27 1.62 � 0.27 � 2.64 � 0.08 � 0.87 0.24 2.45
Transaction costs 2% 0.17 1.41 0.19 1.16 � 0.41 � 3.97 � 0.22 � 2.29 0.13 1.35
Panel (d): excess returns and value-weighted portfolios
Value weighted I 0.39 1.93 0.56 2.21 � 0.09 � 0.51 0.17 0.97 0.46 2.61
Value weighted II 0.67 4.48 0.65 3.70 0.33 2.81 0.48 3.07 0.66 5.27
Portfolios are formed on E/P, B/M, 6MR, ER FY1 and the total score on measures of VMR as described in Tables
1 and 2. The row labelled ‘‘Base case’’ repeats the results from Tables 1 and 2 for equally weighted country-
neutral portfolios. Panel (a) shows results from applying the selection strategies in different size segments, where
all stocks in the sample are divided according to market capitalization into three equally sized segments, denoted
as Small, Mid and Large caps. Mini caps are stocks with market capitalization smaller than US$100 million in
December 1998 (deflated at 10% annually). For the row labelled ‘‘Median returns’’, portfolio returns are
measured as the median return of the stocks in the portfolio. The row labelled ‘‘Implementation lag’’ contains
results when a 1-month delay between the ranking period and moment of portfolio formation is allowed. The row
labelled ‘‘Transaction costs 1% (1.5%, 2%)’’ contains results when transaction costs of 1% (1.5%, 2%) for each
sale or purchase of stocks are assumed. The row ‘‘Value weighted I’’ is based on value-weighted portfolios and
value-weighted benchmarks. The row ‘‘Value weighted II’’ is based on portfolios with equal overweights
compared to a value-weighted benchmark, as described in the text. The table reports the average excess returns (r̄)
of the portfolios consisting of the top 15% ranked stocks relative to the benchmark portfolio of all stocks in the
sample, expressed as percentage per month, and the corresponding t statistics t(r̄).
J. van der Hart et al. / Journal of Empirical Finance 194 (2002) 1–2822

ARTICLE IN PRESS
of outstanding shares. Table 7 shows that the B/M and, to a lesser extent, the E/P strategies
tend to select smaller stocks, whereas the 6MR, ER FY1 and VMR strategies select larger
stocks on average. The turnover ratio for all winners portfolios is equal to or higher than
the turnover ratio for the complete sample of stocks. Concluding, liquidity may be lower
for value stocks, but it is higher for stocks selected by the momentum, earnings revisions
and multivariate strategies.
Related to the size and liquidity of the portfolios involved in the stock selection
strategies is their riskiness. If the strategies tend to select stocks with high sensitivity to
overall movements in emerging equity markets, their excess returns may only be a reward
for this additional risk. To consider this possibility, we use the regression
Rp;t � Rf ;t ¼ a þ bMðRM;t � Rf ;tÞ þ et; ð2Þ
where Rp,t is the monthly return of the equally weighted winners or losers portfolio in a
particular strategy, RM,t is the corresponding benchmark return on the equally weighted
index consisting of all emerging market stocks in our universe, and Rf,t is the 1-month US
T-bill return.
The estimation results presented in Table 8 show that for all strategies, the betas of the
winners and losers portfolios are close to 1. Only the winners portfolio of the B/M strategy
appears to bear higher ‘‘emerging market risk’’, as its beta is significantly greater than 1.
Note that the opposite is found for the top portfolio of the earnings revisions strategy. The
excess returns after correcting for market risk, as measured by the intercept a, remain
statistically significant for all portfolios except the winners portfolio in the momentum
strategy and, in fact, are very close to the ‘‘raw’’ excess returns reported in Tables 1 and 2.
Hence, the excess returns are not simply a reward for additional emerging market risk.
Outliers are often considered to be a serious problem in emerging markets data. Several
measures can be taken to guard against the possible influence of such anomalous
observations. For example, Rouwenhorst (1999) excludes the extreme 5% of the past 6-
month return distribution when forming momentum portfolios, while Barry et al. (2002)
omit observations with returns in the upper and lower 1% tails of the returns distribution.
Our results so far are based on the entire sample of stocks, without accounting for the
Table 7
Liquidity of stock selection strategies
Strategy Market capitalization Turnover ratio
Top EWI Bottom Top EWI Bottom
E/P 248 277 211 2.03 2.01 2.32
B/M 177 274 419 2.02 2.04 2.01
6MR 335 272 191 2.82 2.16 2.01
ER FY1 548 415 425 3.33 3.15 3.17
VMR 283 272 227 2.54 2.14 2.01
The table reports averages of monthly median values of the market capitalization (in millions of US$) and
turnover ratio for stocks in the winners and losers portfolios and in the universe of stocks. Turnover ratio is
defined as the number of shares traded in each month divided by the total number of outstanding shares,
expressed as percentage.
J. van der Hart et al. / Journal of Empirical Finance 194 (2002) 1–28 23

ARTICLE IN PRESS
presence of outliers in any way (except in the multivariate strategies, as discussed in
Section 3.2). We examine to what extent our results are driven by aberrant observations in
the stock returns by evaluating the profitability of the different strategies when portfolio
returns are measured by the median return of the stocks in the portfolio (instead of the
mean return). This drastically limits the influence of return outliers. The first row in panel
(b) of Table 6 shows that, except for the B/M strategy, all strategies perform well for
median returns. Hence, we conclude that the profitability of the selection strategies is not
due to return outliers.
Institutional restrictions, such as delays in the decision-making process, may prevent a
timely implementation of the stock selection strategies. Therefore, we test the strategies
with a 1-month implementation delay, that is, winners and losers portfolios are formed 1
month after the stocks’ ranking. The results of this robustness test are shown in the second
row in panel (b) of Table 6. Although the magnitude and significance of the excess returns
diminish somewhat, except for the momentum strategy, the results are largely similar to
the results without an implementation lag.
Transaction costs in emerging equity markets can be substantial (see Bekaert et al.,
1997) and may seriously erode profits from trade-intensive strategies such as the ones
considered here. The first row in panel (c) in Table 6 shows excess returns from the
selection strategies when transaction costs of 1% for each sale or purchase of stocks are
taken into account.17 As expected, the profitability of the strategies weakens considerably,
Table 8
Emerging market risk of winners and losers portfolios in stock selection strategies
Strategy Portfolio a t(a) bM t(bM[� 1]) R̄2
E/P Top 0.54 4.39 1.01 0.38 0.93
Bottom � 0.48 � 3.91 1.02 0.94 0.93
B/M Top 0.46 2.69 1.08 2.78 0.89
Bottom � 0.31 � 2.16 0.99 � 0.55 0.91
6MR Top 0.17 1.64 0.98 � 1.26 0.94
Bottom � 0.33 � 2.81 1.03 1.46 0.94
ER FY1 Top 0.32 3.37 0.96 � 2.46 0.97
Bottom � 0.21 � 2.44 1.01 0.51 0.98
VMR Top 0.52 5.15 1.01 0.60 0.95
Bottom � 0.54 � 4.62 0.97 � 1.68 0.93
The table presents coefficient estimates and t statistics from the regression
Rp;t � Rf ;t ¼ a þ bMðRM;t � Rf ;tÞ þ et ;
where Rp,t is the monthly return of the equally weighted winners (top) or losers (bottom) portfolio, RM,t is the EWI
benchmark return and Rf,t is the 1-month US T-bill return. t(a) is the t statistic of (a), and t(bM[� 1]) is the t
statistic of bM minus 1. The regression R̄2 is adjusted for degrees of freedom.
17 The estimates of actual transaction costs by Bekaert et al. (1997) show that transaction costs vary
substantially among emerging markets. The assumption of identical transaction costs in all countries, thus,
obviously, is an abstraction from reality. Note, however, that the assumed transaction costs of 1% is quite close to
the mean of the estimates reported by Bekaert et al. (1997). Similarly, Domowitz et al. (in press) report that during
the second half of the 1990s, one-way total (i.e. the sum of explicit and implicit costs) trading costs in emerging
markets ranged between 100 and 150 basis points, on average.
J. van der Hart et al. / Journal of Empirical Finance 194 (2002) 1–2824

ARTICLE IN PRESS
such that the excess return of the momentum strategy becomes negative and the excess
return of the earnings revisions strategy is no longer significant. However, the excess
returns of the E/P and B/M strategies and the multivariate strategy remain positive and
statistically significant. The fact that the momentum and revisions strategies suffer more
from transaction costs than the E/P, B/M and multivariate strategies is caused by the fact
that the former strategies are considerably more trade intensive and have very high
turnover.18 Also included in panel (c) of Table 6 are results with transaction costs equal to
1.5 and 2% per trade. Obviously, higher transaction costs further erode the strategies’
profits. With 1.5% transaction costs, only the excess returns of the E/P and the multivariate
strategies remain statistically significant, and when transaction costs are increased further
to 2%, none of the strategies generates a significant outperformance.19 Still, even with
high transaction costs, the strategies have practical relevance in case an investor has to
trade anyway, for example, due to cash in- or outflow.
The portfolios that we have constructed so far are equally weighted. In practice, an
investor usually is evaluated against a value-weighted benchmark, with benchmark and
portfolio weights for the included stocks proportional to their market capitalization.
Furthermore, results of stock selection strategies for value-weighted and equally weighted
portfolios are sometimes found to differ considerably (see Achour et al., 1998 for
example). When implementing the strategies with value-weighted winners portfolios
and benchmarks on our sample of emerging market stocks, the selection strategies appear
to be somewhat less successful. The results in the first row in panel (d) of Table 6 show
that the excess return for the revisions strategy is no longer significant, and the excess
return for the momentum strategy even becomes negative. This finding is consistent with
the results for size segments, as the momentum and revisions strategies have lower excess
returns for large caps than for the other size segments. However, the B/M and VMR
strategies retain their significant outperformance in the value-weighted test, although the t
statistic corresponding to the excess return for the multivariate strategy declines substan-
tially, from 5.79 to 2.61.
A caveat in the value-weighted test as implemented above is that it creates large stock-
specific risk, which may heavily influence the results. The excess returns are strongly
dependent on the returns of a few large caps, as the portfolio has large under- or
overweights versus the benchmark for these stocks, while under- or overweights for small
caps are relatively small. In practice, an investor may rather prefer equal relative weights
versus the benchmark for stocks that are equally attractive. To examine the performance of
the selection strategies under this alternative weighting scheme, we construct value-
weighted portfolios as follows. First, all stocks outside the top 15% rankings with
benchmark weights larger than 1% enter the portfolio with weights equal to their
benchmark weights minus 1%. Stocks outside the top 15% with a benchmark weight less
18 For the 6-month holding period, the average turnover of the winners portfolios in the selection strategies
based on E/P, B/M, momentum, earnings revisions is equal to 56.8%, 46.7%, 85.9% and 81.6%, respectively.
Average turnover of the multivariate strategy is equal to 67.2%.19 With 2% transaction costs, the average excess returns of the univariate value strategies and the multivariate
strategy are still positive, though. The break-even transactions for the E/P, B/M and VMR strategies are equal to
2.93%, 3.29% and 2.62%, respectively.
J. van der Hart et al. / Journal of Empirical Finance 194 (2002) 1–28 25

ARTICLE IN PRESS
than 1% are not included in the portfolio. Second, all stocks within the top 15% rankings
are equally overweighted compared to the benchmark.20 The second row in panel (d) of
Table 6 shows that in this case the results are very similar to the results involving equally
weighted portfolios, indicating that the strategies can be translated successfully to value-
weighted investments.
7. Conclusions
In this paper, we have confirmed the profitability of trading strategies based on value
and momentum in emerging markets. In addition, a selection strategy based on analysts’
earnings revisions was also found to outperform an equally weighted index of all stocks.
The performance of the univariate strategies can be enhanced by combining value,
momentum and revisions into a multivariate strategy. The benefits from geographical
diversification are substantial due to the low correlations between returns in different
countries, such that the strategies can best be applied simultaneously in all emerging
markets. Using the strategies for country selection as well increases profitability consid-
erably, but at the cost of higher risk.
We do not find evidence that financial market liberalizations in emerging countries have
affected the performance of the strategies, as we find that all strategies generate significant
excess returns in both liberalized and nonliberalized markets.
The apparent profitability of the selection strategies cannot be regarded as compensa-
tion for (time-invariant) exposures to global market, book-to-market, size and momentum
risk factors. The excess returns remain significant after adjusting for these factors. A
deeper investigation of the appropriate interpretation of the profitability of the selection
strategies in emerging markets, using, for example, asset pricing models with time-varying
exposures and behavioral models, is left for future research.
The results from various robustness tests show that the trading strategies can be
implemented successfully in practice by a large investor. The profits of most strategies
remain significant if applied to stocks with large market capitalization only, after allowing
for an implementation delay, after correcting for outliers and after incorporating moderate
transaction costs. We do not find evidence that the selection strategies have a tendency to
trade stocks with lower liquidity or higher emerging market risk.
Acknowledgements
We thank Angelien Kemna, Ronald Wuijster, the editors of this Special Issue, Geert
Bekaert, Campbell Harvey and an anonymous referee for useful comments and
suggestions. Any remaining errors are ours.
20 Hence, the portfolio weight for a stock in the top 15% rankings is equal to its benchmark weight plus an
equal overweight, which is equal to (100%� total portfolio weight of all included stocks outside the top
15%� total benchmark weight of all top 15% stocks)/total number of stocks in the top 15% rankings.
J. van der Hart et al. / Journal of Empirical Finance 194 (2002) 1–2826

ARTICLE IN PRESS
References
Achour, D., Harvey, C.R., Hopkins, G., Lang, C., 1998. Stock selection in emerging markets: portfolio strategies
for Malaysia, Mexico and South Africa. Emerging Markets Quarterly 2 (Winter), 38–91.
Achour, D., Harvey, C.R., Hopkins, G., Lang, C., 1999a. Stock selection in Malaysia. Emerging Markets
Quarterly 3 (Spring), 54–91.
Achour, D., Harvey, C.R., Hopkins, G., Lang, C., 1999b. Stock selection in Mexico. Emerging Markets Quarterly
3 (Fall), 1–38.
Achour, D., Harvey, C.R., Hopkins, G., Lang, C., 1999c. Firm characteristics and investment strategies in Africa:
the case of South Africa. African Finance Journal 1, 1–39.
Alexander, G.J., 2000. On back-testing ‘‘zero-investment’’ strategies. Journal of Business 73, 255–278.
Arshanapalli, B., Coggin, T.D., Doukas, J., 1998. Multifactor asset pricing analysis of international value invest-
ment strategies. Journal of Portfolio Management 24, 10–23.
Asness, C.S., Liew, J.M., Stevens, R.L., 1997. Parallels between the cross-sectional predictability of stock and
country returns—striking similarities in the predictive power of value, momentum and size. Journal of
Portfolio Management 23, 79–87.
Barberis, N., Thaler, R.H., 2002. Behavioural issues in asset pricing. In: Constantinides, G., Harris, M., Stulz, R.
(Eds.), Handbook of the Economics of Finance. North-Holland, Amsterdam. In press.
Barry, C.B., Goldreyer, E., Lockwood, L., Rodriguez, M., 2002. Robustness of size and value effects in emerging
markets, 1985–2000. Emerging Markets Review 3, 1–30.
Bauman, W.S., Conover, C.M., Miller, R.E., 1998. Growth stocks versus value stocks and large versus small cap
stocks in international markets. Financial Analysts Journal 54, 75–89.
Bauman, W.S., Conover, C.M., Miller, R.E., 1999. Investor overreaction in international stock markets—value
stocks outperform outside the US. Journal of Portfolio Management 25, 102–111.
Baytas, A., Cakici, N., 1999. Do markets overreact: international evidence. Journal of Banking and Finance 23,
1121–1144.
Bekaert, G., 1995. Market integration and investment barriers in emerging equity markets. World Bank Economic
Review 9, 75–107.
Bekaert, G., Harvey, C.R., 1995. Time-varying world market integration. Journal of Finance 50, 403–444.
Bekaert, G., Harvey, C.R., 1997. Emerging equity market volatility. Journal of Financial Economics 43, 29–77.
Bekaert, G., Harvey, C.R., 2000a. Capital flows and the behavior of emerging market equity returns. In: Edwards,
S. (Ed.), Capital Flows and the Emerging Economies: Theory, Evidence and Controversies. University of
Chicago Press, Chicago, pp. 159–194.
Bekaert, G., Harvey, C.R., 2000b. Foreign speculators and emerging equity markets. Journal of Finance 55,
565–614.
Bekaert, G., Urias, M.S., 1996. Diversification, integration, and emerging market closed-end funds. Journal of
Finance 51, 835–870.
Bekaert, G., Urias, M.S., 1999. Is there a free lunch in emerging market equities? In some markets, but investors
need to be more selective going forward. Journal of Portfolio Management 25, 83–95.
Bekaert, G., Erb, C.B., Harvey, C.R., Viskanta, T.E., 1997. What matters for emerging equity market investments.
Emerging Markets Quarterly 1, 17–46.
Bekaert, G., Erb, C.B., Harvey, C.R., Viskanta, T.E., 1998. Distributional characteristics of emerging market
returns and asset allocation. Journal of Portfolio Management 24, 102–116.
Bekaert, G., Harvey, C.R., Lundblad, C., 2001. Emerging equity markets and economic development. Journal of
Development Economics 66, 465–504.
Bekaert, G., Harvey, C.R., Lumsdaine, R.L., 2002. Dating the integration of world equity markets. Journal of
Financial Economics 65, 203–249.
Capaul, C., Rowley, J., Sharpe, W.F., 1993. International value and growth stock returns. Financial Analyst
Journal 49, 27–41.
Carhart, M.M., 1997. On persistence in mutual fund performance. Journal of Finance 52, 57–82.
Chan, L.K.C., Jegadeesh, N., Lakonishok, J., 1996. Momentum strategies. Journal of Finance 51, 1681–1713.
Chan, K., Hameed, A., Tong, W., 2000. Profitability of momentum strategies in the international equity markets.
Journal of Financial and Quantitative Analysis 35, 153–172.
J. van der Hart et al. / Journal of Empirical Finance 194 (2002) 1–28 27

ARTICLE IN PRESS
Chari, A., Henry, P.B., 2001. Stock market liberalizations and the repricing of systematic risk. NBER Working
Paper No. 8265.
Claessens, S., Dasgupta, S., Glen, J., 1998. The cross section of stock returns: evidence from emerging markets.
Emerging Markets Quarterly 2, 4–13.
De Bondt, W.F.M., Thaler, R.H., 1985. Does the stock market overreact? Journal of Finance 40, 793–805.
De Bondt, W.F.M., Thaler, R.H., 1987. Further evidence on investor overreaction and stock market seasonality.
Journal of Finance 42, 557–581.
De Roon, F.A., Nijman, Th.E., Werker, B.J.M., 2001. Testing for mean–variance spanning with short sales
constraints and transaction costs: the case of emerging markets. Journal of Finance 56, 721–742.
Domowitz, I., Glen, J., Madhavan, A., 2002. Liquidity, volatility, and equity trading costs across countries and
over time. Journal of International Finance (in press).
Edison, H.J., Warnock, F.E., 2001. A simple measure of the intensity of capital controls. International Finance
Discussion Paper No. 708, Federal Reserve Board.
Fama, E.F., 1998. Market efficiency, long-term returns and behavioral finance. Journal of Financial Economics
49, 283–306.
Fama, E.F., French, K.R., 1993. Common risk factors in the returns on stocks and bonds. Journal of Financial
Economics 33, 3–56.
Fama, E.F., French, K.R., 1996. Multifactor explanations of asset pricing anomalies. Journal of Finance 51,
55–84.
Fama, E.F., French, K.R., 1998. Value versus growth: the international evidence. Journal of Finance 53,
1975–1999.
Ferson, W.E., Harvey, C.R., 1999. Conditioning variables and the cross section of stock returns. Journal of
Finance 54, 1325–1360.
Harvey, C.R., 1995. Predictable risk and return in emerging markets. Review of Financial Studies 8, 773–816.
Haugen, R.A., Baker, N.L., 1996. Commonality in the determinants of expected stock returns. Journal of
Financial Economics 41, 401–439.
Henry, P.B., 2000. Stock market liberalization, economic reform, and emerging market equity prices. Journal of
Finance 55, 529–564.
Jegadeesh, N., 1990. Evidence of predictable behavior of security returns. Journal of Finance 45, 881–898.
Jegadeesh, N., Titman, S., 1993. Returns to buying winners and selling losers: implications for stock market
efficiency. Journal of Finance 48, 65–91.
Jegadeesh, N., Titman, S., 2001. Profitability of momentum strategies: an evaluation of alternative explanations.
Journal of Finance 56, 699–720.
Kaminsky, G.L., Schmukler, S.L., 2001. On booms and crashes: financial liberalizations and stock market cycles.
Mimeo, World Bank.
Kim, E.H., Singal, V., 2000. Stock market openings: experience of emerging economies. Journal of Business 73,
25–66.
Lakonishok, J., Shleifer, A., Vishny, R.W., 1994. Contrarian investment, extrapolation and risk. Journal of
Finance 49, 1541–1578.
Lee, C.M.C., Swaminathan, B., 2000. Price momentum and trading volume. Journal of Finance 55, 2017–2069.
Lehmann, B.N., 1990. Fads, martingales and market efficiency. Quarterly Journal of Economics 60, 1–28.
Patel, S.A., 1998. Cross-sectional variation in emerging markets equity returns, January 1988–March 1997.
Emerging Markets Quarterly 2, 57–70.
Richards, A.J., 1997. Winner– loser reversals in national stock market indices: can they be explained? Journal of
Finance 52, 2129–2144.
Rouwenhorst, K.G., 1998. International momentum strategies. Journal of Finance 53, 267–284.
Rouwenhorst, K.G., 1999. Local return factors and turnover in emerging stock markets. Journal of Finance 54,
1439–1464.
Serra, A.P., 2000. Country and industry factors in returns—evidence from emerging markets’ stocks. Emerging
Markets Review 1, 127–151.
J. van der Hart et al. / Journal of Empirical Finance 194 (2002) 1–2828