article open integrative genomics analyses … genomics...intragenic single-nucleotide polymorphisms...
TRANSCRIPT

ARTICLE OPEN
Integrative genomics analyses unveil downstream biologicaleffectors of disease-specific polymorphisms buried in intergenicregionsHaiquan Li1,2,3,4,5,17,18, Ikbel Achour1,2,3,17,18, Lisa Bastarache6,18, Joanne Berghout1,2,3, Vincent Gardeux1,2,3,17, Jianrong Li1,2,3,4,5,17,Younghee Lee4,5,17, Lorenzo Pesce7, Xinan Yang4,5,8,17, Kenneth S Ramos2, Ian Foster7,9,10, Joshua C Denny6, Jason H Moore11,12
and Yves A Lussier1,2,3,4,5,7,13,14,15,16,17
Functionally altered biological mechanisms arising from disease-associated polymorphisms, remain difficult to characterise whenthose variants are intergenic, or, fall between genes. We sought to identify shared downstream mechanisms by which inter- andintragenic single-nucleotide polymorphisms (SNPs) contribute to a specific physiopathology. Using computational modelling of2 million pairs of disease-associated SNPs drawn from genome-wide association studies (GWAS), integrated with expressionQuantitative Trait Loci (eQTL) and Gene Ontology functional annotations, we predicted 3,870 inter–intra and inter–intra SNP pairswith convergent biological mechanisms (FDRo0.05). These prioritised SNP pairs with overlapping messenger RNA targets orsimilar functional annotations were more likely to be associated with the same disease than unrelated pathologies (OR412). Weadditionally confirmed synergistic and antagonistic genetic interactions for a subset of prioritised SNP pairs in independent studiesof Alzheimer’s disease (entropy P= 0.046), bladder cancer (entropy P= 0.039), and rheumatoid arthritis (PheWAS case–controlPo10− 4). Using ENCODE data sets, we further statistically validated that the biological mechanisms shared within prioritised SNPpairs are frequently governed by matching transcription factor binding sites and long-range chromatin interactions. These resultsprovide a ‘roadmap’ of disease mechanisms emerging from GWAS and further identify candidate therapeutic targets amongdownstream effectors of intergenic SNPs.
npj Genomic Medicine (2016) 1, 16006; doi:10.1038/npjgenmed.2016.6; published online 27 April 2016
INTRODUCTIONThe abundance of newly discovered disease-associated poly-morphisms now enables inquiries about their summative andinteractive effects.1 Since 2005, genome-wide association studies(GWAS) have reported 415,000 single-nucleotide polymorphisms(SNPs) associated with over 1,200 complex diseases and traits.2
From these studies, we have learned that half of the disease-associated SNPs reside within poorly characterised intergenicregions. Although downstream effects of missense and nonsensecoding SNPs can be investigated straightforwardly in cellularand animal models, effects arising from intergenic SNPs remainlargely uncharacterised and are often challenging to validateexperimentally using in vitro and in vivo assays.Computational biology can potentially bridge the mechanistic
gap between detecting disease-associated SNPs and providingbiological interpretations of how different risk loci contribute to
disease incidence and prevalence. We and others have shown thatsystematically integrating studies of protein–protein interactionwith experimentally verified disease-associated coding SNPsenables discovery of new disease-gene candidates and testableassociations between biological pathways and disease.3–7 Otherdisease-mechanism-based methods have prioritised GWAS signalsby leveraging prior biological knowledge inferred from thephysical proximity of SNPs to gene loci8–11 or from expressionquantitative loci (eQTL) associations.12–17 Recent high-throughputgenomics projects such as The Encyclopedia of DNA Elements(ENCODE) have extended quantitative measures of biologicalactivity into intergenic regions.18,19 These projects led tointegrative genomic analyses and systemic mapping of disease-associated SNPs to regulatory elements, including enhancers,transcription factor (TF) binding sites or chromatin accessibilitymarks.20–25 Nonetheless, analysis of how downstream disease
1BIO5 institute, University of Arizona, Tucson, AZ, USA; 2Department of Medicine, University of Arizona, Tucson, AZ, USA; 3Department of Medicine, University of Illinois atChicago, IL, USA; 4Section of Genetic Medicine, Department of Medicine, University of Chicago, Chicago, IL, USA; 5Center for Biomedical Informatics, Department of Medicine,University of Chicago, Chicago, IL, USA; 6Departments of Biomedical Informatics and Medicine, Vanderbilt University, TN, USA; 7Computation Institute, Argonne NationalLaboratory and University of Chicago, IL, USA; 8Department of Pediatrics, University of Chicago, Chicago, IL, USA; 9Mathematics and Computer Science Division, Argonne NationalLaboratory, Chicago, IL, USA; 10Department of Computer Science, University of Chicago, Chicago, IL, USA; 11Department of Genetics, Institute for Quantitative BiomedicalSciences, Geisel School of Medicine, Dartmouth College, Hanover, NH, USA; 12Penn Institute for Biomedical Informatics & Department of Biostatistics and Epidemiology &Department of Genetics, Perelman School of Medicine, The University of Pennsylvania, PA, USA; 13Institute for Genomics and Systems Biology, Argonne National Laboratory &University of Chicago, IL, USA; 14University of Arizona Cancer Center, University of Arizona, Tucson, AZ, USA; 15Section for Bioinformatics, Department of Bioengineering,University of Illinois at Chicago, IL, USA and 16Department of Biopharmaceutical Sciences, University of Illinois at Chicago, IL, USA.Correspondence: JC Denny ([email protected]) or JH Moore ([email protected]) or YA Lussier ([email protected])17This work was conducted in part at the University of Chicago and the University of Illinois.18These authors contributed equally to this work.Received 16 November 2015; revised 2 February 2016; accepted 8 March 2016
www.nature.com/npjgenmedAll rights reserved 2056-7944/16
© 2016 Center of Excellence in Genomic Medicine Research/Macmillan Publishers Limited

mechanisms emerge from intergenic SNPs located in biologicallyactive regulatory genomic regions remains elusive.We hypothesised that the mechanisms by which polymorph-
isms contribute to disease risk can be unveiled by systematicallyanalysing their downstream transcriptomic effects. The functionalconvergence of intergenic SNPs with intragenic ones mayinfluence the course of disease via the same mechanisms.Building on eQTL and ENCODE data, we approached thishypothesis by identifying shared molecular and biologicalmechanisms by which two SNPs (irrespective of their genomiclocation but not in linkage disequilibrium) are associated with thesame disease. We developed a computational method focused onascertaining and quantifying disease mechanisms of SNPs withknown disease relationships from the National Human GenomeResearch Institute (NHGRI) GWAS catalogue (e.g., Lead SNPs),which are also associated with altered messenger RNA (mRNA)expression levels via eQTL studies. We first devised a systematicmethod to identify overlap and similarity of biological activitiesshared between every two SNPs (e.g., mRNA expression, inferredmolecular function and biological processes). Second, in supportof the predicted shared mechanisms between SNPs associatedwith the same disease, we provided additional independentevidence by: (i) exploring non-additive synergetic and antagonis-tic SNP–SNP interactions in GWAS of bladder cancer, Alzheimer’sdisease and rheumatoid arthritis (RA), and (ii) utilising ENCODE-derived data to identify Lead SNP pairs located in similarregulatory regions that might explain their shared downstreambiological mechanisms. We focused our investigation on Lead SNPpairs comprised of at least one intergenic SNP.
RESULTSApproach overviewTo determine intergenic SNPs’ contribution to disease risk,we computationally imputed biological mechanisms that arecommon to more than one intergenic Lead SNP associated withthe same disease. We analysed Lead SNPs associated with any ofthe 467 diseases in the NHGRI GWAS catalogue2 that had at leastone eQTL association in the SCAN database,26 derived fromlymphoblastoid cell lines. This yielded 2,358 Lead SNPs(Supplementary Data S1; 1,092 intergenic) and each was paired
across all possible combinations. Any pairs of SNPs that were inlinkage disequilibrium with each other at r2⩾ 0.8 using HapMapdata for the CEU population were removed from our analysis(see details in Materials and Methods section). Lead SNP pairswere categorised into three groups based on assertions by dbSNP(Build 138):27 intergenic–intergenic (inter–inter) pairs when bothSNPs are at least 2,000 bp 5ʹ and 500 bp 3ʹ of protein-coding genecoordinates, intergenic–intragenic (inter–intra) pairs when oneSNP is intergenic and the other is within gene coordinates, andintragenic–intragenic (intra-intra) pairs in cases where both SNPswere found within or near gene coordinates. This study focusedon pairs of Lead SNPs comprised of at least one intergenic SNP(inter–inter or inter–intra), which left two million pairwisecombinations (Figure 1a and Supplementary Figure S1a,b). Foreach Lead SNP, we determined the mRNA transcripts that wereassociated by eQTL (median 2 transcripts per SNP) and retrievedtheir biological processes (GO–BP) and molecular function(GO–MF) annotations from the Gene Ontology (GO 5/19/200928).These annotations allowed us to prioritise SNP pairs (inter–interand inter–intra) on the basis of having the same or similarfunctional biological mechanisms, even when the exact mRNAtarget is distinct (e.g., receptor-ligand, signalling pathway andprotein complexes). These data were then overlapped betweeneach SNP comprising an inter–inter or inter–intra Lead SNPpair.28,29
To evaluate the significance of imputed biological mechanisms,we developed stringent prioritisation methods by mRNA overlap,GO–MF similarity and GO–BP similarity controlled empirically withscale-free networks3,30 and applied these systematically to the twomillion surveyed Lead SNP pairs. Pairs exhibiting sufficient overlapand/or similarity at FDRo0.05 were termed ‘prioritised Lead SNPpairs’ (Figure 1b and Supplementary Figure S1c). Computationallyintensive empirical calculations were required owing to randomdistributions being anticonservative. We then performed enrich-ment analyses to assess whether shared biological mechanismsare more likely to be found among Lead SNP pairs related to thesame disease rather than across distinct diseases. LeveragingENCODE data, we evaluated shared regulatory properties andmolecular mechanisms at play that relate prioritised Lead SNPpairs to the same disease. Finally, using genome-wide associationsin independent data sets, we determined that prioritised Lead
Intergenic Intragenic
Intr
agen
ic In
terg
enic
Lead SNPsassociated with mRNAs (eQTLs)and diseases
BiologicalKnowledge base (GO)
Pairwise analysisLead SNP pairs
Prioritised Lead SNP pairsNon-prioritised Lead SNP pairs
Prioritised inter-inter & inter-intra SNP pairs by overlap and/orsimilarity of:
Prioritisation of Lead SNP pairs(Shared biological mechanisms)
mRNA
and/or
Biological process
and/or
Molecular function
ENCODEValidation
Validation of prioritisation(Shared genetic & molecular mechanisms)
Enrichement analysis
High-throughput computing
Lead SNP pairs:Intergenic - IntergenicIntergenic - intragenic
Geneticinteractionvalidation
Figure 1. Schematic of Lead SNP pair prioritisation methods. (a) Lead SNP pairs analysed in this study contain at least one intergenic SNP andare associated with one or more of 467 diseases in the NHGRI GWAS catalogue and with gene expression levels (6,301 mRNAs) derived from alymphoblastoid cell line eQTL study. Although computed, pairs consisting of two intragenic SNPs were not the main focus of this study (blankin matrix). (b) Lead SNP pairs were prioritised and controlled with empirical scale-free networks to yield significant Lead SNP pairs sharing atleast one of the three imputed biological mechanisms (blue highlighted squares). Biological knowledge bases refer to eQTL associations andgene ontology annotations of molecular functions and biological process. (c) Prioritised inter–inter and inter–intra Lead SNP pairs were furthervalidated for genetic interaction using three independent association studies (GWAS and PheWAS), and for shared TFs and interactingregulatory elements using ENCODE-derived data sets.
Shared biology from intergenic GWAS disease SNPsH Li et al
2
npj Genomic Medicine (2016) 16006 © 2016 Center of Excellence in Genomic Medicine Research/Macmillan Publishers Limited
SNP pairs in rheumatoid arthritis, bladder cancer and Alzheimer'sdisease show non-additive synergetic genetic interactions, andthat long-range interactions may explain converged biologicaleffects of inter–inter and inter–intra Lead SNPs (Figure 1c andSupplementary Figure S1d).
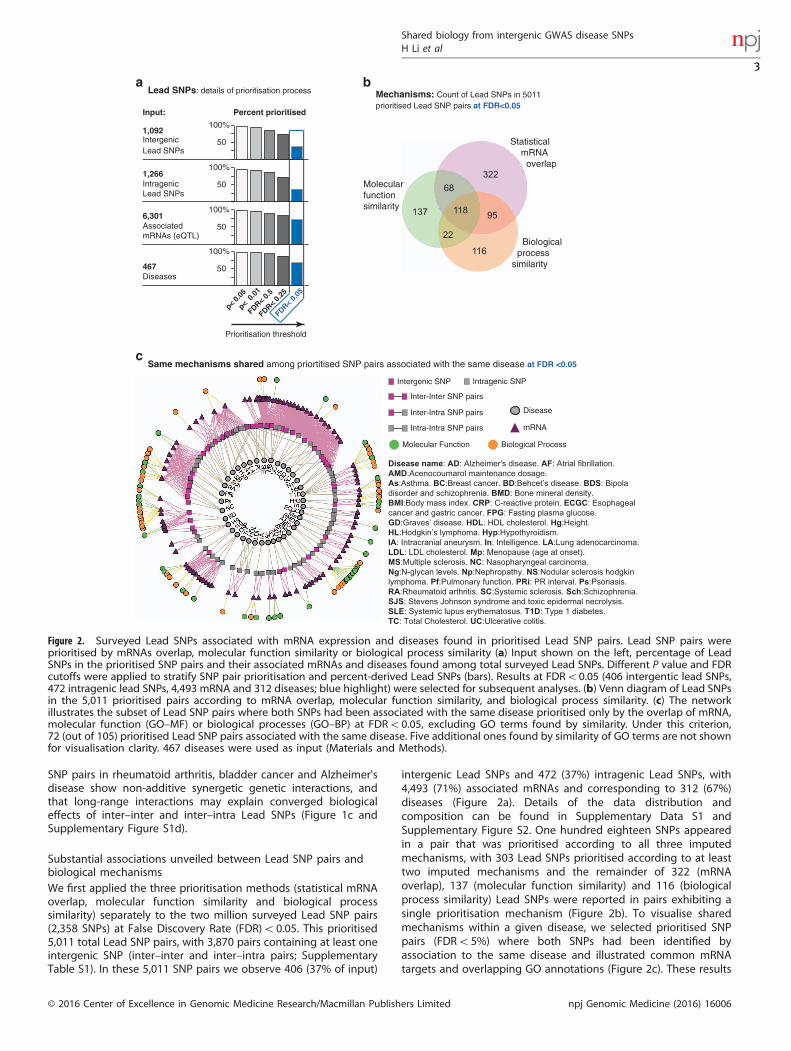
Substantial associations unveiled between Lead SNP pairs andbiological mechanismsWe first applied the three prioritisation methods (statistical mRNAoverlap, molecular function similarity and biological processsimilarity) separately to the two million surveyed Lead SNP pairs(2,358 SNPs) at False Discovery Rate (FDR)o0.05. This prioritised5,011 total Lead SNP pairs, with 3,870 pairs containing at least oneintergenic SNP (inter–inter and inter–intra pairs; SupplementaryTable S1). In these 5,011 SNP pairs we observe 406 (37% of input)
intergenic Lead SNPs and 472 (37%) intragenic Lead SNPs, with4,493 (71%) associated mRNAs and corresponding to 312 (67%)diseases (Figure 2a). Details of the data distribution andcomposition can be found in Supplementary Data S1 andSupplementary Figure S2. One hundred eighteen SNPs appearedin a pair that was prioritised according to all three imputedmechanisms, with 303 Lead SNPs prioritised according to at leasttwo imputed mechanisms and the remainder of 322 (mRNAoverlap), 137 (molecular function similarity) and 116 (biologicalprocess similarity) Lead SNPs were reported in pairs exhibiting asingle prioritisation mechanism (Figure 2b). To visualise sharedmechanisms within a given disease, we selected prioritised SNPpairs (FDRo5%) where both SNPs had been identified byassociation to the same disease and illustrated common mRNAtargets and overlapping GO annotations (Figure 2c). These results
1,092Intergenic Lead SNPs
100%
1,266Intragenic Lead SNPs
6,301AssociatedmRNAs (eQTL)
467Diseases
p< 0.0
5
p< 0.
01
FDR< 0.5
FDR< 0.2
5
FDR< 0.
05
50
100%
50
100%
50
100%
50
Input:
322
118
68
137
116
95
22
Mechanisms: Count of Lead SNPs in 5011 prioritised Lead SNP pairs at FDR<0.05
Biologicalprocess
similarity
StatisticalmRNA
overlap
Molecularfunctionsimilarity
Lead SNPs: details of prioritisation process
Prioritisation threshold
Inter-Inter SNP pairs
mRNA
Molecular Function Biological Process
Disease
Same mechanisms shared among priortitised SNP pairs associated with the same disease at FDR <0.05
Disease name: AD: Alzheimer's disease. AF: Atrial fibrillation.
AMD:Acenocoumarol maintenance dosage.
As:Asthma. BC:Breast cancer. BD:Behcet’s disease. BDS: Bipola
disorder and schizophrenia. BMD: Bone mineral density.
BMI:Body mass index. CRP: C-reactive protein. ECGC: Esophageal
cancer and gastric cancer. FPG: Fasting plasma glucose.
GD:Graves’ disease. HDL: HDL cholesterol. Hg:Height.
HL:Hodgkin’s lymphoma. Hyp:Hypothyroidism.
IA: Intracranial aneurysm. In: Intelligence. LA:Lung adenocarcinoma.
LDL: LDL cholesterol. Mp: Menopause (age at onset).
MS:Multiple sclerosis. NC: Nasopharyngeal carcinoma.
Ng:N-glycan levels. Np:Nephropathy. NS:Nodular sclerosis hodgkin
lymphoma. Pf:Pulmonary function. PRi: PR interval. Ps:Psoriasis.
RA:Rheumatoid arthritis. SC:Systemic sclerosis. Sch:Schizophrenia.
SJS: Stevens Johnson syndrome and toxic epidermal necrolysis.
SLE: Systemic lupus erythematosus. T1D: Type 1 diabetes.
TC: Total Cholesterol. UC:Ulcerative colitis.
Inter-Intra SNP pairs
Intergenic SNP Intragenic SNP
Intra-Intra SNP pairs
Percent prioritised
Figure 2. Surveyed Lead SNPs associated with mRNA expression and diseases found in prioritised Lead SNP pairs. Lead SNP pairs wereprioritised by mRNAs overlap, molecular function similarity or biological process similarity (a) Input shown on the left, percentage of LeadSNPs in the prioritised SNP pairs and their associated mRNAs and diseases found among total surveyed Lead SNPs. Different P value and FDRcutoffs were applied to stratify SNP pair prioritisation and percent-derived Lead SNPs (bars). Results at FDRo0.05 (406 intergentic lead SNPs,472 intragenic lead SNPs, 4,493 mRNA and 312 diseases; blue highlight) were selected for subsequent analyses. (b) Venn diagram of Lead SNPsin the 5,011 prioritised pairs according to mRNA overlap, molecular function similarity, and biological process similarity. (c) The networkillustrates the subset of Lead SNP pairs where both SNPs had been associated with the same disease prioritised only by the overlap of mRNA,molecular function (GO–MF) or biological processes (GO–BP) at FDRo0.05, excluding GO terms found by similarity. Under this criterion,72 (out of 105) prioritised Lead SNP pairs associated with the same disease. Five additional ones found by similarity of GO terms are not shownfor visualisation clarity. 467 diseases were used as input (Materials and Methods).
Shared biology from intergenic GWAS disease SNPsH Li et al
3
© 2016 Center of Excellence in Genomic Medicine Research/Macmillan Publishers Limited npj Genomic Medicine (2016) 16006
included 43 diseases, but for visual clarity five GWAS phenotypes(Crohn’s disease, immunoglobulin A levels, anorexia nervosa,prostate cancer and metabolic levels) which had highly similar butnon-identical GO terms are not illustrated, although these areincluded in later analyses (Supplementary Data S3 and S4). Thesefindings suggest that the three prioritisation methods werecomplementary and illustrate how genetic risk of disease arises,at least in part, from systems biology properties of sharedmechanisms.
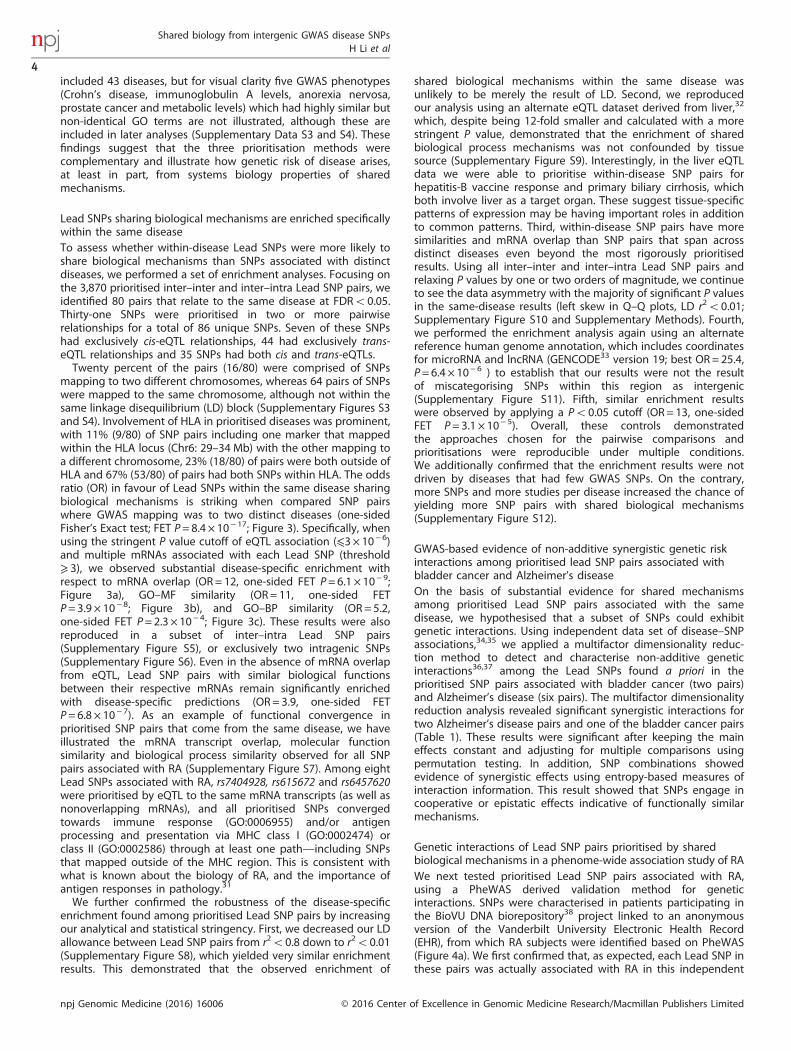
Lead SNPs sharing biological mechanisms are enriched specificallywithin the same diseaseTo assess whether within-disease Lead SNPs were more likely toshare biological mechanisms than SNPs associated with distinctdiseases, we performed a set of enrichment analyses. Focusing onthe 3,870 prioritised inter–inter and inter–intra Lead SNP pairs, weidentified 80 pairs that relate to the same disease at FDRo0.05.Thirty-one SNPs were prioritised in two or more pairwiserelationships for a total of 86 unique SNPs. Seven of these SNPshad exclusively cis-eQTL relationships, 44 had exclusively trans-eQTL relationships and 35 SNPs had both cis and trans-eQTLs.Twenty percent of the pairs (16/80) were comprised of SNPs
mapping to two different chromosomes, whereas 64 pairs of SNPswere mapped to the same chromosome, although not within thesame linkage disequilibrium (LD) block (Supplementary Figures S3and S4). Involvement of HLA in prioritised diseases was prominent,with 11% (9/80) of SNP pairs including one marker that mappedwithin the HLA locus (Chr6: 29–34 Mb) with the other mapping toa different chromosome, 23% (18/80) of pairs were both outside ofHLA and 67% (53/80) of pairs had both SNPs within HLA. The oddsratio (OR) in favour of Lead SNPs within the same disease sharingbiological mechanisms is striking when compared SNP pairswhere GWAS mapping was to two distinct diseases (one-sidedFisher’s Exact test; FET P= 8.4 × 10− 17; Figure 3). Specifically, whenusing the stringent P value cutoff of eQTL association (⩽3 × 10− 6)and multiple mRNAs associated with each Lead SNP (threshold⩾ 3), we observed substantial disease-specific enrichment withrespect to mRNA overlap (OR= 12, one-sided FET P= 6.1 × 10− 9;Figure 3a), GO–MF similarity (OR= 11, one-sided FETP= 3.9 × 10− 8; Figure 3b), and GO–BP similarity (OR = 5.2,one-sided FET P= 2.3 × 10− 4; Figure 3c). These results were alsoreproduced in a subset of inter–intra Lead SNP pairs(Supplementary Figure S5), or exclusively two intragenic SNPs(Supplementary Figure S6). Even in the absence of mRNA overlapfrom eQTL, Lead SNP pairs with similar biological functionsbetween their respective mRNAs remain significantly enrichedwith disease-specific predictions (OR= 3.9, one-sided FETP= 6.8 × 10− 7). As an example of functional convergence inprioritised SNP pairs that come from the same disease, we haveillustrated the mRNA transcript overlap, molecular functionsimilarity and biological process similarity observed for all SNPpairs associated with RA (Supplementary Figure S7). Among eightLead SNPs associated with RA, rs7404928, rs615672 and rs6457620were prioritised by eQTL to the same mRNA transcripts (as well asnonoverlapping mRNAs), and all prioritised SNPs convergedtowards immune response (GO:0006955) and/or antigenprocessing and presentation via MHC class I (GO:0002474) orclass II (GO:0002586) through at least one path—including SNPsthat mapped outside of the MHC region. This is consistent withwhat is known about the biology of RA, and the importance ofantigen responses in pathology.31
We further confirmed the robustness of the disease-specificenrichment found among prioritised Lead SNP pairs by increasingour analytical and statistical stringency. First, we decreased our LDallowance between Lead SNP pairs from r2o0.8 down to r2o0.01(Supplementary Figure S8), which yielded very similar enrichmentresults. This demonstrated that the observed enrichment of
shared biological mechanisms within the same disease wasunlikely to be merely the result of LD. Second, we reproducedour analysis using an alternate eQTL dataset derived from liver,32
which, despite being 12-fold smaller and calculated with a morestringent P value, demonstrated that the enrichment of sharedbiological process mechanisms was not confounded by tissuesource (Supplementary Figure S9). Interestingly, in the liver eQTLdata we were able to prioritise within-disease SNP pairs forhepatitis-B vaccine response and primary biliary cirrhosis, whichboth involve liver as a target organ. These suggest tissue-specificpatterns of expression may be having important roles in additionto common patterns. Third, within-disease SNP pairs have moresimilarities and mRNA overlap than SNP pairs that span acrossdistinct diseases even beyond the most rigorously prioritisedresults. Using all inter–inter and inter–intra Lead SNP pairs andrelaxing P values by one or two orders of magnitude, we continueto see the data asymmetry with the majority of significant P valuesin the same-disease results (left skew in Q–Q plots, LD r2o0.01;Supplementary Figure S10 and Supplementary Methods). Fourth,we performed the enrichment analysis again using an alternatereference human genome annotation, which includes coordinatesfor microRNA and lncRNA (GENCODE33 version 19; best OR= 25.4,P= 6.4 × 10− 6 ) to establish that our results were not the resultof miscategorising SNPs within this region as intergenic(Supplementary Figure S11). Fifth, similar enrichment resultswere observed by applying a Po0.05 cutoff (OR = 13, one-sidedFET P= 3.1 × 10− 5). Overall, these controls demonstratedthe approaches chosen for the pairwise comparisons andprioritisations were reproducible under multiple conditions.We additionally confirmed that the enrichment results were notdriven by diseases that had few GWAS SNPs. On the contrary,more SNPs and more studies per disease increased the chance ofyielding more SNP pairs with shared biological mechanisms(Supplementary Figure S12).
GWAS-based evidence of non-additive synergistic genetic riskinteractions among prioritised lead SNP pairs associated withbladder cancer and Alzheimer’s diseaseOn the basis of substantial evidence for shared mechanismsamong prioritised Lead SNP pairs associated with the samedisease, we hypothesised that a subset of SNPs could exhibitgenetic interactions. Using independent data set of disease–SNPassociations,34,35 we applied a multifactor dimensionality reduc-tion method to detect and characterise non-additive geneticinteractions36,37 among the Lead SNPs found a priori in theprioritised SNP pairs associated with bladder cancer (two pairs)and Alzheimer’s disease (six pairs). The multifactor dimensionalityreduction analysis revealed significant synergistic interactions fortwo Alzheimer’s disease pairs and one of the bladder cancer pairs(Table 1). These results were significant after keeping the maineffects constant and adjusting for multiple comparisons usingpermutation testing. In addition, SNP combinations showedevidence of synergistic effects using entropy-based measures ofinteraction information. This result showed that SNPs engage incooperative or epistatic effects indicative of functionally similarmechanisms.
Genetic interactions of Lead SNP pairs prioritised by sharedbiological mechanisms in a phenome-wide association study of RAWe next tested prioritised Lead SNP pairs associated with RA,using a PheWAS derived validation method for geneticinteractions. SNPs were characterised in patients participating inthe BioVU DNA biorepository38 project linked to an anonymousversion of the Vanderbilt University Electronic Health Record(EHR), from which RA subjects were identified based on PheWAS(Figure 4a). We first confirmed that, as expected, each Lead SNP inthese pairs was actually associated with RA in this independent
Shared biology from intergenic GWAS disease SNPsH Li et al
4
npj Genomic Medicine (2016) 16006 © 2016 Center of Excellence in Genomic Medicine Research/Macmillan Publishers Limited
data set (Po0.01). Using logistic regression incorporating the ratioof ORs for genetic interaction (RORi), we further identified bothSNP–SNP synergy and antagonism among the RA-associatedprioritised Lead SNP pairs (Figure 4b,c). For example, the Lead SNPpair comprised of rs6457617 and rs9268853 exhibited synergisticgenetic interaction (RORi = 1.16; P= 0.021; Figure 4b). For theseSNPs, we observed increased risk of RA (OR= 3.4, P= 6.6 × 10− 14)when we compared the diametric extreme ORs of their alleles
(Figure 4b). In contrast, the genetic interaction of LeadSNPs rs6457617 and rs9272219 displayed an antagonistic effect(RORi = 0.74; P= 2.6 × 10− 5; Figure 4c). Because of the antagonism,the homozygous major alleles for rs9272219 alternatively increaseor decrease the risk of RA when, respectively, combined witheither the minor or major alleles for rs6457617 (OR of diametricextremes = 3.2, P= 2.2 × 10− 16; Figure 4c). The homozygous majoralleles for rs9272219 are associated with increased RA risk in the
Prioritised SNP pairs byBiological Process similarity
Prioritised SNP pairs by Molecular Function similarity
Enr
ichm
ent (
odds
rat
io)
0
2
4
6
8
10
12
0
2
4
6
8
10
12
0
1
2
3
4
5
6
7
10−4 10−5 10−6 10−4 10−5 10−6 10−4 10−5 10−6
SNP(1)
SNP(2)
mRNA mRNAMF MF
SNP(1)
SNP(2)
mRNA mRNA
Baseline (odds ratio=1, NS)
≥ 3 ≥ 5 ≥ 1
Threshold of mRNAsassociated to each SNP
mRNA overlapGO-MF similarityGO-BP similarity
p−value cutoffs for eQTL association (Log scale)
Prioritised SNP pairs byStatistical mRNA overlap
BP BP
SNP(1)
SNP(2)
mRNA mRNA
PRKCB1
Rheumatoid arthritis
rs7404928rs615672
MICB
natural killercell lectin-likereceptor binding
MICA
gamma-deltaTcell activation
chr 16chr 6
Antigen processingpresentation
HLA-C HLA-B
HLA-DRB 5HLA-DRB 4HLA-DRB 1HLA-DRB 3HLA-DQB1
rs6457620chr 6
rs6
antigen processing and presentationof peptide or polysaccharide antigenvia MHC class II
Lead SNP inPrioritisedSNP pairs
Host gene
mRNA
Biologicalprocess
LEGEND
Disease
Molecularfunction
Similarity
Figure 3. Enrichment of shared biological mechanisms among inter–inter and inter–intra Lead SNP pairs associated with the same disease.Three biological mechanisms were imputed for each Lead SNP-pair: mRNA overlap (a), similarity of molecular functions (b), and similarity ofbiological processes (c). Prioritised inter–inter and inter–intra Lead SNP pairs (100,000 permutation resampling; FDRo0.05) were significantlyenriched when SNPs were prioritised in same disease versus across distinct diseases regardless of the P value cutoffs for eQTL association(x axis). ORs for inter–inter and inter–intra Lead SNP pairs ranged from 2.9 to 12.8 (1.3 × 10− 12⩽ P⩽ 6.5 × 10− 4), 2.3 to 12.0(3.3 × 10− 11⩽ P⩽ 6.5 × 10− 4) and 2.6 to 7.2 (8.4 × 10− 17⩽ P⩽ 0.01) (a–c, respectively). (d) Subset of rheumatoid arthritis (RA) prioritiseddisease network. Among the 34 surveyed RA-associated Lead SNPs via GWAS and 138 mRNAs via eQTL (Po10− 4), eight Lead SNPs wereidentified that related to 15 mRNAs, 14 GO–MF, and 23 GO–BP. Three of the eight Lead SNPs shared the same mRNAs and/or similar functionalmechanisms. Full network appears in Supplementary Figure S7, only prioritised SNP pairs at FDRo0.05 and with significant SNP–GO–SNPassociations (FDRo0.05) are shown. r2= 0.004 between rs6457620 and rs615672 (HapMap Phase 3).
Shared biology from intergenic GWAS disease SNPsH Li et al
5
© 2016 Center of Excellence in Genomic Medicine Research/Macmillan Publishers Limited npj Genomic Medicine (2016) 16006

presence of the minor alleles for rs6457617 (OR= 2.16 versusOR≈1; Figure 4c), but they are associated with the lowest risk of RAin the presence of the major alleles for rs6457617 (OR= 0.55,P= 7.2 × 10− 9; Figure 4c).
Interacting TFs and regulatory elements from ENCODE corroborateconverged mechanisms prioritised between Lead SNPsWe further hypothesised that intergenic disease-SNPs located ingenomic regions surveyed for DNA–protein interactions and
cis-element activities would enable us to identify and characterisethe molecular regulation of prioritised biological mechanisms. Weincorporated ENCODE-derived biochemical assays18 into our studyto explore three regulatory properties that Lead SNPs within eachpair may share: (i) distinct SNP regions harbouring the same TFs(ChIP-seq; Figure 5a), (ii) SNP regions with distinct interacting TFs(ChIP-seq and protein–protein interaction; Figure 5b) or (iii) SNPregions that physically interact via specific proteins (ChIA–PET;Figure 5c). Using RegulomeDB,39 we also extended the study of
Table 1. Non-additive genetic interaction of prioritised inter–inter and inter–intra Lead SNP pairs validated in independent GWAS studies
Disease Prioritised SNP pairs SNPs with synergistic effects Entropy P-value
Alzheimer’s rs4509693–rs753129(chr10, inter) (chr4, inter)rs7081208*–rs9331888*(chr10, FRMD4A) (chr8, CLU, MIR6843)
rs4509693–rs753129–rs7081208* 0.046
Bladder cancer rs8102137–rs1014971(chr19, inter) (chr22, inter)
rs8102137–rs1014971 0.039
Abbreviations: eQTL, expression quantitative trait loci; SNP, single-nucleotide polymorphism.Entropy-based P values correspond to the observed statistical pattern of epistasis. SNP rs4509693 was associated with both cis and trans-eQTLs, but all othereQTL relationships were trans. Asterisks are used to indicate intragenic SNPs with host gene listed below.
Case of RA
n = 1,115
Controls
n = 24,169
CTGAGAACTTCA
EHR records
Specific SNP loci
Validation of geneticinteractions
PheWAS
SNP (1) X SNP (2)
+
Synergy ofPrioritised Lead
SNP pairs
Antagony ofPrioritised Lead
SNP pairs
SNP (1) SNP (2)
rs6457617
Effect size [95% CI]
rs9268853 RORi=1.16 [1.02 - 1.32]
p-value
2.1x10 -2
rs6457617 OR=1.53 [1.41 - 1.67] 1.2x10 -21n.a
OR=1.26 [1.16 - 1.38] 2.3x10 -7n.a
rs6457617SNP (1)
SNP (2)rs9268853
rs9268853
T/T
T/C
C/CC/C
C/T
T/T
rs6457617 rs9272219 RORi=0.74 [0.64 - 0.85] 2.6x10 -5
rs6457617 OR=1.53 [1.41 - 1.67] 1.2x10 -21n.a
OR=0.88 [0.79 - 0.97] 9.7x10 -3n.a rs9272219
0.66 [0.56 - 0.77]
0.53 [0.40 - 0.69]
0.71
0.85 [0.75 - 0.97]
0.99
0.94
1.23 n.s
1.56 [1.37 - 1.78]
1.96 [1.65 - 2.33]
rs6457617SNP (1)
SNP (2)rs9272219
T/T
T/C
C/CT/T
T/G
G/G 0.55 [0.46 - 0.67] 0.982.16 [1.95 - 2.40]
0.69 [0.55 - 0.86] 0.87 [0.76-0.99] 1
0.780.871.33
% population: 1-6 7-12 19-2413-18
SNP (1) SNP (2) Effect size [95% CI] p-value
25-30
n.s.
n.s.
n.s.
n.s.
n.s.n.s.n.s.
n.s.
; OR = Odds Ratio
Minor/Minor ; Minor/Major ; Major/MajorROR = Ratio of ORs of the interaction
Alleles:i
# Diametric extreme RA risk of allelic interaction
Combinations of alleles:
OR [95% CI]
Combinations of alleles:
OR [95% CI]
Figure 4. PheWAS illustrates genetic interactions in prioritised inter–inter Lead SNP pairs associated with rheumatoid arthritis. Non-additivegenetic interaction of prioritised inter–inter Lead SNP pairs was confirmed in an independent population of 1,115 RA cases and 24,169controls. (a) Overview of the PheWAS and genetic interaction validation process. (b) A synergistic effect was observed between unlinked(r2= 0) SNP(1) rs6457617 and SNP(2) rs9268853. (c) An antagonistic effect was observed between almost unlinked (r2= 0.017) SNP(1) rs6457617and SNP(2) rs9272219. The upper parts of b, c provide insight into the effect size parameters of the logistic regression model. For example,genetic interaction is measured between two SNPs when the Ratio of OR of the interaction (RORi) differs significantly from the value 1.Synergy corresponds to an increased RORi, whereas antagony relates to its decrease. The combination of effect size parameters of each SNPtaken alone (odds ratio; OR) with those of the interaction (RORi) is required to estimate the OR associated with a specific set of minor andmajor alleles of both polymorphisms. The lower tables of b, c provide a systematic view of the specific OR and populations associated witheach allelic combination of these interacting polymorphisms.
Shared biology from intergenic GWAS disease SNPsH Li et al
6
npj Genomic Medicine (2016) 16006 © 2016 Center of Excellence in Genomic Medicine Research/Macmillan Publishers Limited
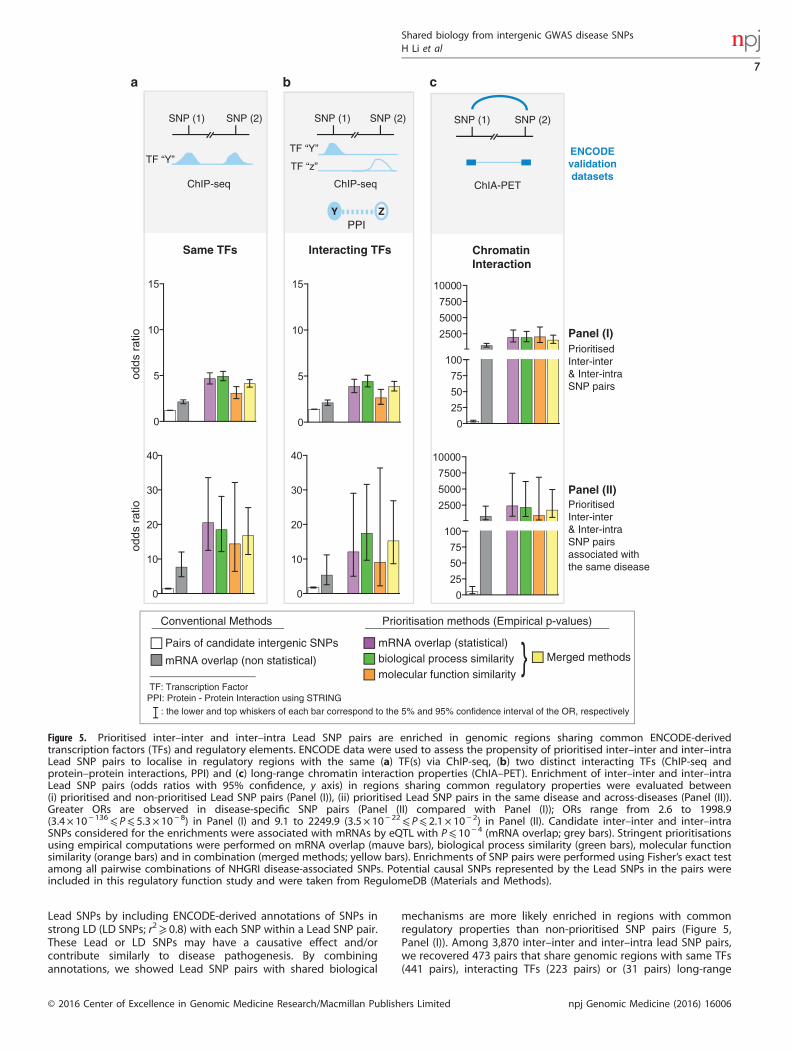
Lead SNPs by including ENCODE-derived annotations of SNPs instrong LD (LD SNPs; r2⩾ 0.8) with each SNP within a Lead SNP pair.These Lead or LD SNPs may have a causative effect and/orcontribute similarly to disease pathogenesis. By combiningannotations, we showed Lead SNP pairs with shared biological
mechanisms are more likely enriched in regions with commonregulatory properties than non-prioritised SNP pairs (Figure 5,Panel (I)). Among 3,870 inter–inter and inter–intra lead SNP pairs,we recovered 473 pairs that share genomic regions with same TFs(441 pairs), interacting TFs (223 pairs) or (31 pairs) long-range
od
ds r
atio
o
dd
s r
atio
PrioritisedInter-inter & Inter-intra SNP pairs
Prioritised Inter-inter & Inter-intra SNP pairs associated withthe same disease
SNP (1) SNP (2) SNP (1) SNP (2)SNP (1) SNP (2)
ChIP-seq ChIP-seq ChIA-PET
TF: Transcription FactorPPI: Protein - Protein Interaction using STRING
Pairs of candidate intergenic SNPs
mRNA overlap (non statistical)
mRNA overlap (statistical)biological process similaritymolecular function similarity
Merged methods
Prioritisation methods (Empirical p-values)Conventional Methods
Panel (I)
Panel (II)
ZYPPI
TF “Y”TF “Y”
TF “z”
ENCODEvalidationdatasets
: the lower and top whiskers of each bar correspond to the 5% and 95% confidence interval of the OR, respectively
Interacting TFs Same TFs ChromatinInteraction
0
5
10
15
0
5
10
15
0
25
50
75
100
2500
5000
7500
10000
0
10
20
30
40
0
10
20
30
40
0
25
50
75
100
2500
5000
7500
10000
Figure 5. Prioritised inter–inter and inter–intra Lead SNP pairs are enriched in genomic regions sharing common ENCODE-derivedtranscription factors (TFs) and regulatory elements. ENCODE data were used to assess the propensity of prioritised inter–inter and inter–intraLead SNP pairs to localise in regulatory regions with the same (a) TF(s) via ChIP-seq, (b) two distinct interacting TFs (ChIP-seq andprotein–protein interactions, PPI) and (c) long-range chromatin interaction properties (ChIA–PET). Enrichment of inter–inter and inter–intraLead SNP pairs (odds ratios with 95% confidence, y axis) in regions sharing common regulatory properties were evaluated between(i) prioritised and non-prioritised Lead SNP pairs (Panel (I)), (ii) prioritised Lead SNP pairs in the same disease and across-diseases (Panel (II)).Greater ORs are observed in disease-specific SNP pairs (Panel (II) compared with Panel (I)); ORs range from 2.6 to 1998.9(3.4 × 10− 136⩽ P⩽ 5.3 × 10− 8) in Panel (I) and 9.1 to 2249.9 (3.5 × 10− 22⩽ P⩽ 2.1 × 10− 2) in Panel (II). Candidate inter–inter and inter–intraSNPs considered for the enrichments were associated with mRNAs by eQTL with P⩽ 10− 4 (mRNA overlap; grey bars). Stringent prioritisationsusing empirical computations were performed on mRNA overlap (mauve bars), biological process similarity (green bars), molecular functionsimilarity (orange bars) and in combination (merged methods; yellow bars). Enrichments of SNP pairs were performed using Fisher’s exact testamong all pairwise combinations of NHGRI disease-associated SNPs. Potential causal SNPs represented by the Lead SNPs in the pairs wereincluded in this regulatory function study and were taken from RegulomeDB (Materials and Methods).
Shared biology from intergenic GWAS disease SNPsH Li et al
7
© 2016 Center of Excellence in Genomic Medicine Research/Macmillan Publishers Limited npj Genomic Medicine (2016) 16006
interactions. Moreover, we demonstrated that the surveyedregulatory properties were enriched among 26 prioritised inter–inter and inter–intra SNP pairs associated with the same disease,but not across distinct diseases (Figure 5, Panel (II)).We observed substantial enrichment of prioritised inter–inter
and inter–intra Lead SNP pairs in regulatory and interactinggenomic regions across the three imputed biological mechanismspredicted by our methods when compared with conventionalapproaches, with one exception out of 12 comparisons (95%interval whiskers, Figure 5, Panel (I)). Conventional eQTL-relatedmethods involved identifying (i) any pair of Lead SNPs with atleast one associated mRNA (P⩽ 10− 4) or (ii) straightforward(non-statistical) overlap of mRNA(s) associated with each LeadSNP of a pair. Notably, the enrichment was generally morepronounced for prioritised SNP pairs associated with the samedisease, as indicated when comparing the whiskers of eachprioritisation method in Panel (I) to its counterpart in Panel (II)(nonoverlapping whiskers, Figure 5). We observed at least athreefold increase in the OR for prioritised Lead SNP pairsassociated with the same disease using the ENCODE ChIP-seq oftranscription factors (Figure 5a,b). In addition, ChIA–PET-basedanalysis revealed further enrichment (OR42,500) of SNPs co-localising with genomic regions undergoing long-range interac-tions mediated by chromatin-modelling DNA binding proteinsof CTCF or catalysers of DNA transcription, such as RNApolymerase II.40,41 This remarkable increased enrichment is relatedto the nature of the ChIA-PET assays, which capture the regulatorynetwork of transcriptional and chromatin structural activities thatmirror many putative regulatory associations computed from SNPswith expressed quantitative traits (Figure 5c). The ORs improvedacross every prioritisation method and each of the ENCODEvalidation data sets when computed at an eQTL cutoff of P⩽ 10− 6
(OR49,000, one-sided FET P= 1.2 × 10− 11), rather than using afixed eQTL cutoff of P⩽ 10− 4 as performed in our initialenrichment analysis illustrated in Figure 5. In addition, ORs remainsignificant but slightly less when prioritising the Lead SNP pairs atthe anticonservative nominal Po0.05 (OR = 896.7, one-sided FETP= 3.5 × 10− 11). An even more stringent LD cutoff of r2o0.01(Supplementary Figure S13) yielded comparable ORs to thosefrom LD r2o0.8, suggesting that the convergent regulatorymechanisms between prioritised SNPs were unlikely to be theresult of linkage disequilibrium. These results support the notionthat SNPs related to the same disease that affect same geneexpression and similar biological mechanisms are often correlatedwith similar functional cis- and/or trans-regulatory elements thatoften engage in long-range chromatin interactions such asenhancer–promoter and enhancer–enhancer interactions.
DISCUSSIONHere we developed a computational method that combinesdifferent levels of genomic information (GWAS, eQTL andENCODE) and knowledge base of gene annotations (GO) toimpute biological effectors of SNPs derived from their sharedbiological downstream mechanisms. We showed that intergenicand intragenic SNPs predisposing an individual to the samedisease most likely affect expression of the same mRNAs, mRNAsinvolved in similar biological pathways or governed by similarregulatory mechanisms. Among the 2 million surveyed SNPs, andat stringent cutoff of FDRo0.05, our prioritisation methodsunveiled (i) 3,870 prioritised inter–inter and inter–intra Lead SNPpairs among 312 diseases that share at least one of the imputedbiological mechanisms, (ii) about one third of the SNP pairs wereselectively identified by at least two prioritisation methods,(iii) 80 disease-specific inter–inter and inter–intra Lead SNP pairswith shared mechanisms among 32 diseases and (iv) 473prioritised inter–inter and inter–intra SNP pairs in regions withcommon regulatory properties, among which 26 inter–inter and
inter–intra pairs are of the same disease. We further validated asubset of these predictions with non-additive genetic riskinteractions in an independent association data set for threehuman diseases as well as with ENCODE-informed validations ofregulatory elements. According to ENCODE regulatory data,prioritised Lead SNP pairs were also enriched for similar regulatoryelements (enhancer, promoter and TFs binding sites) and wereinvolved in the same chromatin long-range interactions. Theseresults showed that intergenic and intragenic SNPs share diseaseeffects through shared functionality at different level of scale ofbiology.Using mRNA overlap, previous study of Fehrmann et al.
recovered seven disease-specific unique SNP pairs (trans-eQTLs)at FDRo0.05 among four diseases that shared mRNAs withconverged biological pathways.42 We showed that our prioritisa-tion methods were able to recover substantially more predictionsby GO–BP and GO–MF similarity to identify shared mechanismsfor SNP pairs without mRNA overlap. This suggests that we havesuccessfully enriched for those intergenic SNPs that reveal afunctional impact on disease pathology, although identifyingwhich GWAS SNPs are truly causal rather than associated orperhaps even spurious is a task beyond the scope of this study.If all GWAS SNP inputs could be refined to the causative variant,then we expect to see a significant increase in functional overlapacross each disease. Another limitation of our approach is that itrelies heavily on biased GO knowledge annotations that are notdesigned to uncover non-canonical and poorly characterisedbiological mechanisms. We also observed a high number ofprioritised Lead SNP pairs related to immune related loci(e.g., MHC/HLA) and their downstream activities, which isconsistent with the well-described role for HLA and inflammatoryprocesses in many complex diseases, including those studied byGWAS. It is also possible that these are over-represented heredue to the nature of the lymphoblastoid cell lines used foreQTL studies and their context-specific stimulations linked toparticular diseases.14,42 Although many studies have reiteratedsuch observations, neither consensus nor guidelines regarding theoptimal cell lineage from which to derive eQTL associations thatare most qualified for imputing disease-specific pathogenesis hasbeen established. However, numerous eQTL and genomicannotation-based studies showed that analysing multiple celltypes25,43–45 could uncover novel mechanisms and biomodulesthat explain organs or tissue system implications in overall diseasepathology. Future directions for identifying biomodules from SNPscould involve the use of unbiased gene sets such as thoseobtained by co-expression networks46,47 or computational genesimilarity measures.48 These prioritisation statistics can also beapplied in a targeted manner to a given disease rather than theGWAS catalogue as a whole, where a specific disease-relevanteQTL dataset may be obtained and less stringent nominal P valuescan be used for biomodule discovery without as much need formultiple testing correction. Further investigation in this direction issupported by our independent prioritisation of SNP pairsassociated with liver diseases (Primary biliary cirrhosis andHepatitis B vaccine response) when using the liver eQTL dataset. Finally, this current study was computationally intensive as theempirical resampling was conducted homogeneously across pairs.The algorithms can be optimised by conditioning the resamplingaccording to SNP pairs and dynamically ending the resamplingwhen P values observed are non-significant. These improvementsshould allow to investigate further the effect of eQTL derived fromcell types more relevant to specific diseases, such as thoseavailable in Genotype-Tissue Expression data sets GTEx.49
Previous computational studies preferentially used ENCODEdata sets as a seed to map SNPs to DNA regulatory elements withputative function and used the results to associate these SNPsqualitatively (literature curation) and quantitatively (gene setenrichment in knowledge bases or network models) to predict
Shared biology from intergenic GWAS disease SNPsH Li et al
8
npj Genomic Medicine (2016) 16006 © 2016 Center of Excellence in Genomic Medicine Research/Macmillan Publishers Limited
downstream biomolecular mechanisms.23–25,50–52 In contrast,our approach leverages ENCODE data to determine whetherprior SNP-associated disease mechanism predictions shareregulatory elements that might explain their convergent effects.New genome-wide regulatory annotations and quantitativetrait loci analyses are now increasingly available such as thosederived from chromatin accessibility and DNA methylationpatterns of non-coding regions. Approaches relying on similarityof biological mechanisms could be systematically applied tothese growing genomic data sets and further inform howcommon polymorphisms are involved in transcriptional orpost-transcriptional mechanisms underlying the regulatory andcellular networks of disease progression.This study highlights the significance of mechanistic similarities
for uncovering additional interacting downstream effectors ofintergenic SNPs predisposing individuals to the same disease.Identifying and understanding mechanisms of disease can notonly inform biology but also provide insight in identifyingcandidate therapeutic targets. These results can be pursued forgenerating a comprehensive ‘roadmap’ of disease mechanismsrevealed by downstream effectors of intergenic SNPs.
MATERIALS AND METHODSData sets/database are described below and in detail in SupplementaryFigure S1 and Supplementary Table S2.
eQTL associationTwo eQTL association data sets were acquired from SCAN-DB. The bulk ofthis analysis was done using an eQTL data set of the lymphoblastoid celllines,26 which consisted of 4,189,682 associations between 833,004 distinctSNPs and 11,860 mRNAs at P⩽ 10− 4. Each SNP included for further studywas matched to at least one eQTL transcript with a median of 2 transcriptsper SNP (Supplementary Figure S3). The liver tissue eQTL dataset used forvalidation (Supplementary Methods; Supplementary Figure S9) wascomprised of 314,545 associations between 139,814 SNPs and 19,641mRNAs at P⩽ 10− 5.53 Trans effect was defined as 4 M bp from SNP totarget mRNA based on the original definition54 and dbSNP build 13827 andrefSeq55 hg19 coordinates.
National human genome research institute GWAS catalogueThe dataset comprises 7,236 associations between 574 diseases/traits with6,432 unique Lead SNPs.2
dbSNPSNPs associated with human disease (National human genome researchinstitute (NHGRI) GWAS catalogue) and mRNA expression (eQTL) werecharacterised as inter- or intragenic SNPs according to dbSNP (Build 138)definitions, which are based on RefSeq gene coordinates. Intragenic SNPsare located in regions whose boundaries extend 2 kb upstream of thetranscription start site and 0.5 kb downstream of the terminator accordingto RefSeq.55 Intergenic SNPs are located between two intragenic regions.27
GO annotationsGO annotations for human genes were retrieved from NCBI28,56 and usedto associate mRNA (eQTL) with molecular function (GO–MF) and biologicalprocess (GO–BP) terms. The database consisted of GO–MF and GO–BPannotations for 11,774 and 9,717 distinct genes (mRNAs), respectively.
STRING and protein–protein interactionsThe STRING v9.1 database was used to determine PPIs among TFs.57 Onlyinteractions between distinct TFs that scored ⩾ 0.9 were included in theenrichment analyses (Figure 5).
ENCODE data setThis data set provides DNA element annotations of the human genomebased on various biochemical assays such as ChIP-seq, DNase-seq andRNA-seq.18 We leveraged two types of ENCODE data for the enrichment
analyses: (i) combined data set of TF binding sites (TFBS-Clustered)comprising ChIP-seq of 148 TFs across 95 cell lines and (ii) three ChIA-PETdata sets (Pol2, CTCF and ESR1) with data collected from cell lines, K562,HeLa, MCF-7, HCT-116 and NB4.
Prioritisation of SNP pairsWe included 2,358 SNPs (Supplementary Data S1; 1,092 intergenic SNPs)associated with both disease risk and gene expression for a pairwiseanalysis. We used the HapMap CEU LD data set to determine Lead SNPpairs with LD of r2o0.8 or r2o0.01.58 SNP pairs in strong LD (LD, r2⩾ 0.8)were excluded from the study. Among the remaining pairs, we focused oninter–inter and inter–intra Lead SNP pairs (2,039,944) with at least oneintergenic SNP. We then employed three methods based on a high-throughput computing system to prioritise biological mechanisms sharedamong SNP pairs: (i) mRNA overlap, (ii) molecular function similarity and(iii) biological process similarity. These prioritisations were controlled bypermutation resampling of scale-free networks.3,30
Computed shared mechanisms: mRNA overlap and semanticbiological similarity of SNP pairsPrioritisation by mRNA overlap measured the number of shared mRNAsbetween two SNPs; typically, the number of shared mRNAs was directlyrelated to mRNA overlap. We reported both non-statistical (any overlap)and statistical (prioritised by permutation resampling) types of mRNAoverlap. Prioritisation by biological similarity was based on GO annotationsof mRNA molecular functions or biological processes associated with theSNPs within each pair. Briefly, as every SNP within a pair could beassociated with multiple mRNAs, and every mRNA could be associatedwith multiple GO terms, we performed three steps to impute biologicalsimilarly between two SNPs. First, we calculated the information theoreticsemantic similarity (biological similarity) among GO terms59 as described inour previous work.29 We then computed the biological similarity of eachpair of mRNAs within an SNP pair based on the average biologicalsimilarity of GO term pairs associated with the two mRNAs.7,60 Finally, wedeveloped an algorithm to impute the biological similarity of an SNP pairbased on the average biological similarity of mRNAs associated with thetwo SNPs as the following ‘Equation (1)’.
SNP ITSðs1; s2Þ ¼P
gi AGðs1Þmaxgj AGðs2ÞðGENEITSðgi ; gjÞÞ þP
gj AGðs2Þmaxgi AGðs1ÞðGENEITSðgi ; gjÞÞGðs1Þj j þ Gðs2Þj j
ð1Þ
where SNP s1 was associated with a set of mRNAs G(s1), and |G(s1)| is thecardinality of the set G(s1), similarly for s2. The GENEITS is the biologicalsimilarity of two mRNAs7,60 (details in Supplementary Methods). TheSNP_ITS provides a score that ranges from 0 to 1; a value of 1 indicatedtwo SNPs with common GO–MFs or GO–BPs, and a value of 0corresponded to two SNPs with unrelated GO–BPs or GO–MFs.
Permutation resampling for prioritisation of computed sharedmechanismsThe three prioritisation methods were subjected to stringent statisticalmeasurements to filter the relationship between two SNPs that could beobserved by chance (Supplementary Methods). In contrast to straight-forward resampling methods, we performed permutation resamplingwith node-degree conservation on the entire eQTL association network(SNP–mRNA). Thus, we could control for the distinct probability of eachSNP and mRNA, given original eQTL association network’s topology. Foreach empirical permutation, the number of mRNAs associated with eachSNP (SNP node degree) and the number of SNPs associated with eachmRNA (mRNA node degree) conserved the same cardinality of connectionsas in the original eQTL data set. For each SNP pair, a P value was calculatedas the proportion of empirical permutations (frequency among 100,000times) with equal or greater strength of overlap or biological similaritythan those observed. We then adjusted for multiplicity using theBenjamini–Hochberg FDR procedure independently for each of the threeprioritisation methods using the p.adjust function in R software (http://www.r-project.org/). Prioritised SNP pairs were those yielding sufficientstatistical significance using any of the prioritisation methods.
Shared biology from intergenic GWAS disease SNPsH Li et al
9
© 2016 Center of Excellence in Genomic Medicine Research/Macmillan Publishers Limited npj Genomic Medicine (2016) 16006

ComputationsApproximately 20,000,000 core hours of high-throughput computationswere conducted on the Beagle GLOBUS61,62 computing infrastructurehoused in a Cray XE6 Supercomputer of the Computation Institute at theArgonne National Laboratory with peak performance of 151 teraflopsgenerated by 17,424 compute cores (http://beagle.ci.uchicago.edu/).
Enrichment analysis of disease mechanisms among prioritised SNPpairsWe performed an enrichment analysis to assess whether sharedmechanisms (mRNA overlap, GO–MF/GO–BP similarity) were more likelyfound among SNP pairs related to the same disease than those acrossdistinct diseases. Therefore, we dichotomised all SNP pairs into thoseassociated with the same disease and those associated with distinctdiseases based on the NHGRI GWAS catalogue. We then performed SNPpair enrichment by calculating ORs and P values according to the followingcontingency table: (same disease versus across-disease SNP pairs) ×(prioritised versus non-prioritised SNP pairs) using Fisher’s exact test in R.We also performed enrichment tests at different P value cutoffs of eQTLassociations (⩽10− 4 to ⩽ 10− 6) from which the number of mRNAsassociated with each SNP served as a threshold for calculations (⩾1, ⩾ 3and ⩾ 5 mRNAs per SNP).
Enrichment analysis of common regulatory properties amongprioritised SNP pairsPairs were prioritised according to computed shared mechanisms asdescribed above. For each mechanism, we determined whether prioritisedSNP pairs were enriched in genomic regions with common regulatoryproperties: (i) same TF binding sites, (ii) interacting TFs and (iii) long-rangechromatin interactions. Specifically, we leveraged ENCODE data sets toattribute DNA element annotation(s) to each SNP of the prioritised pairs,such as TF binding sites (ChIP-seq data) and/or anchored regions withlong-range interactions (ChIA-PET) data. We extended the regulatoryannotation of the Lead SNPs to SNPs in strong LD (r2⩾ 0.8) with each LeadSNP of a pair. RegulomeDB39 was used to determine Lead SNPs in strongLD (LD SNPs; r2⩾ 0.8) for which ENCODE-derived functional annotationswere available. The first enrichment analysis assessed whether prioritisedSNP pairs are more likely than non-prioritised pairs to be enriched inregions sharing common regulatory properties using the followingcontingency table: (same regulatory properties versus different regulatoryproperty of Lead SNP pairs) × (prioritised versus non-prioritised Lead SNPpairs). We performed the second enrichment analysis to determinewhether prioritised SNP pairs related to the same disease are more likelyto share common regulatory properties than those associated with distinctdiseases using the contingency table: (same disease and regulatoryproperties versus distinct diseases and/or different regulatory propertyLead SNP pairs) × (prioritised versus non-prioritised Lead SNP pairs). Weincluded a control in which SNP pairs were calculated from every possiblecombination of SNPs with an eQTL association. All Lead SNP pairs derivedfrom the NHGRI GWAS catalogue were used as the background, andenrichment analyses were performed on SNP pairs derived from eQTLassociations with P⩽ 10− 4. Bar graphs were generated using Prism v.6(GraphPad Software Inc, La Jolla, CA, USA).
GWAS-based detection of epistatic effects among mechanism-anchored prioritised Lead SNP pairsPer our a priori hypotheses, prioritised intergenic Lead SNP pairs associatedwith bladder cancer (BC) or Alzheimer's disease (AD) were consideredfor genetic interactions in GWAS (BC: rs9642880–rs1495741 andrs8102137–rs1014971; AD: rs7081208–rs9331888, rs17511627–rs9331888,rs3818361–rs4509693, rs381836–rs7081208, rs4509693–rs753129 andrs4509693–rs6656401). We first applied the multifactor dimensionalityreduction machine-learning method36 for modelling the joint effects of theLead SNP pairs. The multifactor dimensionality reduction approach wasimplemented using 10-fold cross-validation for estimating generalisability,followed by a 1,000-fold permutation test to determine statisticalsignificance and to address multiple testing issues. In addition, we appliedthe explicit test of epistasis, which uses permutation testing to determinestatistical significance of interaction effects while holding the main effectsconstant.63 An entropy-based information gain approach64,65 was used asan additional method for interpreting the statistical pattern of epistasis.The BC GWAS included 3,532 cases and 5,119 controls from the Cancer
Genetic Markers of Susceptibility for Bladder Cancer study,34 which isavailable from dbGaP (accession: phs000346.v1.p1). The AD GWASincluded 529 cases with mild cognitive impairment or AD and 204controls from Phase I of the Alzheimer’s Disease Neuroimaging Initiative,35
also available from dbGaP (accession phs000219.v1.p1).
PheWAS identification of genetic interactions amongmechanism-anchored prioritised Lead SNP pairsEach RA-associated prioritised inter–inter and inter–intra Lead SNP pairwas considered for SNP–SNP interactions using a data set selected fromthe Vanderbilt University EMR-linked DNA biobank (BioVU).38 To identifyRA case–controls cohort from the EHR, we utilised previously developedPheWAS case–control definitions for RA that can reproduce known geneticassociations.66,67 From a population of approximately 36,000 individualswith extant Illumina Human Exome chip genotype data in the deidentifiedVanderbilt University clinical data warehouse linked to BioVU,38 weidentified 1,115 RA cases and 24,169 controls (Supplementary Table S3).Cases had at least two ICD-9-CM billing codes (http://www.cms.gov/Medicare/Coding/ICD9ProviderDiagnosticCodes/codes.html) specific to RA(714.0, 714.1, 714.2 or 714.81) on different days. Controls were selectedamong patients with no RA or related diagnoses (e.g., juvenile idiopathicarthritis, psoriatic arthritis) reported in their billing history according to thePheWAS approach. Individuals with RA noted on a single day wereexcluded, as these cases often have poorer positive predictive value.For each patient, we had previously extracted DNA and genotype data
for 233,605 SNPs with o5% missing data using the Illumina HumanExome 12v.1 array. Genotypes were quality controlled for call rate (495%),minor-allele frequency (41%) and identity by descent to remove relatedindividuals. Among these genotyped SNPs, three prioritised Lead SNP pairs(involving SNPs ‘alleles’ rs6457617-‘T/C’, rs9272219-‘T/G’ and rs9268853-‘C/T’)associated with RA were available for calculations. Only individualsidentified from European ancestry by Structure68 were used in theanalysis, resulting in 29,731 individuals before case and control selection.All association analyses were completed with PLINK v1.0769 using logisticregression adjusted for age and sex and assuming an additive geneticmodel. Interaction analyses were also performed on the second SNP ofeach pair and included an SNP–SNP interaction term (RORi). Interactionsbetween specific alleles of Lead SNP pairs were analysed by Fisher’s exacttest. ORs of allelic combination effects associated with RA and their 95%confidence intervals were reported using PLINK v1.07. Submission todbGaP of RA genotypes and phenotypes of the present PheWAS study is inprocess.70
Network of predicted mechanisms shared by disease-associatedprioritised Lead SNP pairsOn the basis of the disease-specific results of this study, a global networkof functional annotations was constructed that comprises biologicalmolecules and their relationships across the three prioritisation methods(SNP–mRNA eQTL, prioritised SNP–SNP association and computedSNP–GO–SNP association). Disease-specific networks curated to highlightoverlap and similarity of mechanisms found among prioritised Leadprioritised SNP pairs associated with RA. Networks were visualised usingCytoscape.71 Technical details regarding network construction are found inSupplementary Methods.
Original softwareSource code used in this manuscript has been made freely available athttp://www.lussierlab.org/publicationsSupplementary Table S4 presents key concepts and abbreviations.
ACKNOWLEDGEMENTSThe study was supported in part by the following grants: the Computation InstituteBEAGLE Cray Supercomputer of the University of Chicago and Argonne NationalLaboratory (NIH 1S10RR029030-01), the NIH National Library of Medicine(R01-LM010685, K22-LM008308, LM009012, LM010098, LM010685), the Universityof Arizona Cancer Center (NCI P30CA023074), the University of Arizona HealthScience Center (UL1RR024975), the University of Illinois CTSA (UL1TR000050), and theVanderbilt University CTSA (UL1TR000445). We thank Nancy J. Cox and EricR. Gamazon for providing eQTL data, Roger Luo for verifying disease classification,M. Maienschein-Cline for his assistance with the data preparation and Colleen Kenostfor her assistance with proofreading the manuscript.
Shared biology from intergenic GWAS disease SNPsH Li et al
10
npj Genomic Medicine (2016) 16006 © 2016 Center of Excellence in Genomic Medicine Research/Macmillan Publishers Limited
CONTRIBUTIONSConceived the experiments: Y.A.L., H.L., I.A., K.S.R., J.H.M. (GWAS), J.C.D. (PheWAS);conducted the computational biology and high-throughput experiments: H.L., V.G.,Y.L., J.L., I.A., J.H.M., L.P., I.F., L.B., Y.A.L., J.C.D., contributed materials and methods:H.L., I.A., V.G., J.L., L.P., Y.L., I.F., J.H.M., J.C.D., Y.A.L.; Figures, Tables, and Additional files:H.L., I.A., J.B., V.G., X.Y., L.B., J.H.M., J.C.D., Y.A.L.; Analysed the results: H.L., I.A., V.G., L.P.,L.B., I.F., Y.L., J.H.M., J.C.D., Y.A.L.; wrote and revised the manuscript: I.A., H.L., J.B., K.S.R.,J.H.M., J.C.D., Y.A.L.
COMPETING INTERESTSThe authors declare no conflict of interest.
REFERENCES1. Vockley, J., Rinaldo, P., Bennett, M. J., Matern, D. & Vladutiu, G. D. Synergistic
heterozygosity: disease resulting from multiple partial defects in one or moremetabolic pathways. Mol. Genet. Metab. 71, 10–18 (2000).
2. Hindorff, L. A. et al. Potential etiologic and functional implications of genome-wide association loci for human diseases and traits. Proc. Natl Acad. Sci. USA 106,9362–9367 (2009).
3. Lee, Y. et al. Network modeling identifies molecular functions targeted bymiR-204 to suppress head and neck tumor metastasis. PLoS Comput. Biol. 6,e1000730 (2010).
4. Li, H. et al. Complex-disease networks of trait-associated single-nucleotidepolymorphisms (SNPs) unveiled by information theory. J. Am. Med. Inform. Assoc.19, 295–305 (2012).
5. Lim, J. et al. A protein-protein interaction network for human inherited ataxiasand disorders of Purkinje cell degeneration. Cell 125, 801–814 (2006).
6. Pujana, M. A. et al. Network modeling links breast cancer susceptibility andcentrosome dysfunction. Nat. Genet. 39, 1338–1349 (2007).
7. Regan, K. et al. Translating Mendelian and complex inheritance of Alzheimer'sdisease genes for predicting unique personal genome variants. J. Am. Med.Inform. Assoc. 19, 306–316 (2012).
8. Holmans, P. et al. Gene ontology analysis of GWA study data sets providesinsights into the biology of bipolar disorder. Am. J. Hum. Genet. 85, 13–24 (2009).
9. Subramanian, A. et al. Gene set enrichment analysis: a knowledge-basedapproach for interpreting genome-wide expression profiles. Proc. Natl Acad. Sci.USA 102, 15545–15550 (2005).
10. Wang, K., Li, M. & Bucan, M. Pathway-based approaches for analysis ofgenomewide association studies. Am. J. Hum. Genet. 81, 1278–1283 (2007).
11. Wang, K., Li, M. & Hakonarson, H. Analysing biological pathways in genome-wideassociation studies. Nat. Rev. Genet. 11, 843–854 (2010).
12. Cookson, W., Liang, L., Abecasis, G., Moffatt, M. & Lathrop, M. Mapping complexdisease traits with global gene expression. Nat. Rev. Genet. 10, 184–194 (2009).
13. Emilsson, V. et al. Genetics of gene expression and its effect on disease. Nature452, 423–428 (2008).
14. Nica, A. C. et al. Candidate causal regulatory effects by integration of expressionQTLs with complex trait genetic associations. PLoS Genet. 6, e1000895 (2010).
15. Nicolae, D. L. et al. Trait-associated SNPs are more likely to be eQTLs: annotationto enhance discovery from GWAS. PLoS Genet. 6, e1000888 (2010).
16. Westra, H. J. et al. Systematic identification of trans eQTLs as putative drivers ofknown disease associations. Nat. Genet. 45, 1238–1243 (2013).
17. Zhong, Q. et al. Edgetic perturbation models of human inherited disorders. Mol.Syst. Biol. 5, 321 (2009).
18. Dunham, I. et al. An integrated encyclopedia of DNA elements in thehuman genome. Nature 489, 57–74 (2012).
19. Forrest, A. R. et al. A promoter-level mammalian expression atlas. Nature 507,462–470 (2014).
20. Corradin, O. et al. Combinatorial effects of multiple enhancer variants in linkagedisequilibrium dictate levels of gene expression to confer susceptibility tocommon traits. Genome Res. 24, 1–13 (2014).
21. Farh, K. K. et al. Genetic and epigenetic fine mapping of causal autoimmunedisease variants. Nature 518, 337–343 (2015).
22. Grubert, F. et al. Genetic Control of Chromatin States in Humans Involves Localand Distal Chromosomal Interactions. Cell 162, 1051–1065 (2015).
23. Karczewski, K. J. et al. Systematic functional regulatory assessment of disease-associated variants. Proc. Natl Acad. Sci. USA 110, 9607–9612 (2013).
24. Maurano, M. T. et al. Systematic localization of common disease-associatedvariation in regulatory DNA. Science 337, 1190–1195 (2012).
25. Schaub, M. A., Boyle, A. P., Kundaje, A., Batzoglou, S. & Snyder, M. Linking diseaseassociations with regulatory information in the human genome. Genome Res. 22,1748–1759 (2012).
26. Gamazon, E. R. et al. SCAN: SNP and copy number annotation. Bioinformatics 26,259–262 (2010).
27. Sherry, S. T. et al. dbSNP: the NCBI database of genetic variation. Nuclic Acids Res.29, 308–311 (2001).
28. Ashburner, M. et al. Gene ontology: tool for the unification of biology. The GeneOntology Consortium. Nat. Genet. 25, 25–29 (2000).
29. Tao, Y., Sam, L., Li, J., Friedman, C. & Lussier, Y. A. Information theory applied tothe sparse gene ontology annotation network to predict novel gene function.Bioinformatics 23, i529–i538 (2007).
30. Barabasi, A. L. & Albert, R. Emergence of scaling in random networks. Science 286,509–512 (1999).
31. Firestein, G. S. Evolving concepts of rheumatoid arthritis. Nature 423,356–361 (2003).
32. Fu, J. et al. Unraveling the regulatory mechanisms underlying tissue-dependentgenetic variation of gene expression. PLoS Genet. 8, e1002431 (2012).
33. Harrow, J. et al. GENCODE: The reference human genome annotation for TheENCODE Project. Genome Res. 22, 1760–1774 (2012).
34. Rothman, N. et al. A multi-stage genome-wide association study of bladdercancer identifies multiple susceptibility loci. Nat. Genet. 42, 978–984 (2010).
35. Shen, L. et al. Whole genome association study of brain-wide imagingphenotypes for identifying quantitative trait loci in MCI and AD: A study of theADNI cohort. Neuroimage 53, 1051–1063 (2010).
36. Ritchie, M. D. et al. Multifactor-dimensionality reduction reveals high-orderinteractions among estrogen-metabolism genes in sporadic breast cancer. Am. J.Hum. Genet. 69, 138–147 (2001).
37. Moore, J. H. & Andrews, P. C. Epistasis analysis using multifactor dimensionalityreduction. Methods Mol. Biol. 1253, 301–314 (2015).
38. Roden, D. M. et al. Development of a large-scale de-identified DNA biobank toenable personalised medicine. Clin. Pharmacol. Ther. 84, 362–369 (2008).
39. Boyle, A. P. et al. Annotation of functional variation in personal genomes usingRegulomeDB. Genome Res. 22, 1790–1797 (2012).
40. Majumder, P. & Boss, J. M. CTCF controls expression and chromatin architectureof the human major histocompatibility complex class II locus. Mol. Cell Biol. 30,4211–4223 (2010).
41. Ottaviani, D. et al. CTCF binds to sites in the major histocompatibility complexthat are rapidly reconfigured in response to interferon-gamma. Nucleic Acids Res.40, 5262–5270 (2012).
42. Fehrmann, R. S. N. et al. Trans-eQTLs Reveal That Independent Genetic VariantsAssociated with a Complex Phenotype Converge on Intermediate Genes, with aMajor Role for the HLA. PLoS Genet. 7, e1002197 (2011).
43. Arvey, A., Agius, P., Noble, W. S. & Leslie, C. Sequence and chromatin determi-nants of cell-type-specific transcription factor binding. Genome Res. 22,1723–1734 (2012).
44. Lee, M. N. et al. Common genetic variants modulate pathogen-sensing responsesin human dendritic cells. Science 343, 1246980 (2014).
45. Makinen, V. P. et al. Integrative genomics reveals novel molecular pathways andgene networks for coronary artery disease. PLoS Genet. 10, e1004502 (2014).
46. Barabási, A.-L., Gulbahce, N. & Loscalzo, J. Network medicine: a network-basedapproach to human disease. Nat. Rev. Genet. 12, 56–68 (2011).
47. Ramos, K. S. et al. Computational and biological inference of gene regulatorynetworks of the LINE-1 retrotransposon. Genomics 90, 176–185 (2007).
48. Griffiths, T. L. & Steyvers, M. Finding scientific topics. Proc. Natl Acad. Sci. USA101(Suppl 1): 5228–5235 (2004).
49. Ardlie, K. G. et al. The Genotype-Tissue Expression (GTEx) pilot analysis:Multitissue gene regulation in humans. Science 348, 648–660 (2015).
50. Cheng, C. et al. Understanding transcriptional regulation by integrative analysisof transcription factor binding data. Genome Res. 22, 1658–1667 (2012).
51. Gerstein, M. B. et al. Architecture of the human regulatory network derived fromENCODE data. Nature 489, 91–100 (2012).
52. Thurman, R. E. et al. The accessible chromatin landscape of the human genome.Nature 489, 75–82 (2012).
53. Innocenti, F. et al. Identification, replication, and functional fine-mapping ofexpression quantitative trait loci in primary human liver tissue. PLoS Genet. 7,e1002078 (2011).
54. Duan, S. et al. Genetic architecture of transcript-level variation in humans. Am. J.Hum. Genet. 82, 1101–1113 (2008).
55. Pruitt, K. D., Tatusova, T. & Maglott, D. R. NCBI reference sequences (RefSeq): acurated non-redundant sequence database of genomes, transcripts and proteins.Nucleic Acids Res. 35, D61–D65 (2007).
56. Berardini, T. Z. et al. The Gene Ontology in 2010: extensions and refinements.Nucleic Acids Res. 38, D331–D335 (2010).
57. Franceschini, A. et al. STRING v9.1: protein-protein interaction networks, withincreased coverage and integration. Nucleic Acids Res. 41, D808–D815 (2013).
58. Altshuler, D. M. et al. Integrating common and rare genetic variation in diversehuman populations. Nature 467, 52–58 (2010).
Shared biology from intergenic GWAS disease SNPsH Li et al
11
© 2016 Center of Excellence in Genomic Medicine Research/Macmillan Publishers Limited npj Genomic Medicine (2016) 16006
59. Lin, D. An information-theoretic definition of similarity. in Proceedings 15thInternational Conference on Machine Learning. 296-304 (Madison, WI, USA, 1998).
60. Pesquita, C., Faria, D., Falcao, A., Lord, P. & Couto, F. M. Semantic similarity inbiomedical ontologies. PLoS Comput. Biol. 5, e1000443 (2009).
61. Foster, I. & Kesselman, C. Globus: A metacomputing infrastructure toolkit. Int. J.High Perform. Comput. Appl. 11, 115–128 (1997).
62. Czajkowski K., Fitzgerald S., Foster I. & Kesselman C. Grid information services fordistributed resource sharing. in Proceedings 10th IEEE International Symposium onHigh Performance Distributed Computing. 181–194 (San Francisco, CA, USA, 2001).
63. Greene, C. S. et al. Enabling personal genomics with an explicit test of epistasis.Pac. Symp. Biocomput. 15, 327–336 (2010).
64. Hsieh, A. R., Hsiao, C. L., Chang, S. W., Wang, H. M. & Fann, C. S. On the use ofmultifactor dimensionality reduction (MDR) and classification and regression tree(CART) to identify haplotype-haplotype interactions in genetic studies. Genomics97, 77–85 (2011).
65. Moore, J. H. et al. A flexible computational framework for detecting, character-izing, and interpreting statistical patterns of epistasis in genetic studies of humandisease susceptibility. J. Theor. Biol. 241, 252–261 (2006).
66. Denny, J. C. et al. Systematic comparison of phenome-wide association study ofelectronic medical record data and genome-wide association study data. Nat.Biotechnol. 31, 1102–1110 (2013).
67. Denny, J. C. et al. PheWAS: demonstrating the feasibility of a phenome-widescan to discover gene-disease associations. Bioinformatics 26, 1205–1210(2010).
68. Pritchard, J. K., Stephens, M. & Donnelly, P. Inference of population structureusing multilocus genotype data. Genetics 155, 945–959 (2000).
69. Purcell, S. et al. PLINK: a tool set for whole-genome association and population-based linkage analyses. Am. J. Hum. Genet. 81, 559–575 (2007).
70. Mailman, M. D. et al. The NCBI dbGaP database of genotypes and phenotypes.Nat. Genet. 39, 1181–1186 (2007).
71. Shannon, P. et al. Cytoscape: a software environment for integratedmodels of biomolecular interaction networks. Genome Res. 13, 2498–2504(2003).
This work is licensed under a Creative Commons Attribution 4.0International License. The images or other third party material in this
article are included in the article’s Creative Commons license, unless indicatedotherwise in the credit line; if the material is not included under the Creative Commonslicense, users will need to obtain permission from the license holder to reproduce thematerial. To view a copy of this license, visit http://creativecommons.org/licenses/by/4.0/
Supplementary Information accompanies the paper on the npj Genomic Medicine website (http://www.nature.com/npjgenmed)
Shared biology from intergenic GWAS disease SNPsH Li et al
12
npj Genomic Medicine (2016) 16006 © 2016 Center of Excellence in Genomic Medicine Research/Macmillan Publishers Limited