article post-print - mcmaster advanced control...
TRANSCRIPT
Article Post-Print The following article is a “post-print” of an article accepted for publication
in an Elsevier journal.
The post-print is not the final version of the article. It is the unformatted
version which has been accepted for publication after peer review, but
before it has gone through the editing and formatting process with the
publisher. Therefore, there may be minor editorial differences between this
version and the final version.
The final, official version of the article can be downloaded from the
journal’s website via this DOI link when it becomes available (subscription
or purchase may be required):
doi:10.1016/j.energy.2015.08.056
This post-print has been archived on the author’s personal website
(macc.mcmaster.ca) in compliance with the National Sciences and
Engineering Research Council (NSERC) policy on open access and in
compliance with Elsevier’s academic sharing policies.
This post-print is released with a Creative Commons Attribution Non-
Commercial No Derivatives License.
Date Archived: September 28, 2015
Integrated petroleum coke and natural gas polygeneration process with zero carbon 1
emissions 2
Yaser Khojasteh Salkuyeh, Thomas A. Adams II1 3
Department of Chemical Engineering, McMaster University, 1280 Main St W, Hamilton, Ontario, L8S 4L7, Canada. 4
ABSTRACT 5
In the present work, a new polygeneration system is developed that uses petcoke and natural gas 6
as feedstocks and coproduces different products such as chemicals, olefins, electricity and 7
transportation fuels. Furthermore, by incorporation of chemical looping combustion and chemical 8
looping gasification technologies, 100% of CO2 emissions are captured effectively. The particle 9
swarm optimization technique is implemented with Aspen Plus models to determine the optimum 10
product portfolio at different market conditions. Techno-economic optimization results show that 11
this plant can be profitable for a broad range of petcoke consumption (up to 74%) and various 12
feeds and products price changes. 13
Keywords: Polygeneration, petcoke gasification, gas-to-liquids, methanol-to-olefins, CO2 capture 14
1. Introduction 15
As the supply of light crude oils diminishes and the processing of heavier oil increases, crude oil 16
refineries face growing challenges associated with this increased use of heavier crude. For 17
instance, the API gravity of crude produced in the United States has been steadily decreasing [1]. 18
One result of this change is an increasing rate in the production of extremely heavy residues called 19
petroleum coke (or petcoke), even when upgrading units such as delayed coking and fluid coking 20
are implemented [2, 3]. The global production of petcoke has been accelerated to about 4% per 21
year [4] due to the invention of new technologies that can extract crude oil from shale oil and oil 22
sand reservoirs. 23
1Corresponding author.1280 Main Street West, Hamilton, Ontario, Canada, L8S 4L7. Tel.: +1 (905) 525-9140 x24782; E-mail address: [email protected]
Among the several emerging technologies available for the upgrading of petcoke, gasification 24
has emerged as an effective approach that can convert petcoke to more valuable products with 25
minimum environmental impacts compared to commercial combustion systems. In this approach, 26
solid petcoke is converted to synthesis gas and, after purification, is used as a feedstock for other 27
chemical units. Although different petcoke gasification mechanisms and technologies have been 28
studied extensively [1, 5-7], little research has studied the techno-economic analysis on the 29
polygeneration processes that use them. For example, a conceptual study of a large scale 30
polygeneration plant that converts petcoke to power, chemicals such as ammonia and MeOH, 31
hydrogen and transportation liquids was performed by Jacob Consultancy [8]. To the best of our 32
knowledge, this report is the only techno-economic analysis of petroleum-based polygeneration 33
systems. However, their preliminary results showed that the proposed system was not profitable 34
in most cases with current technologies. 35
The incorporation of a natural gas reforming process which produces relatively inexpensive 36
hydrogen rich synthesis gas can improve the performance of polygeneration plants significantly. 37
Comprehensive studies which consider the coupling of pipeline natural gas reforming with 38
commercial coal gasifiers [9, 10], as well as shale gas resources [11, 12] have shown promising 39
results for a variety of different combinations of products and processing routes. Some of these 40
proposed routes incorporate chemical looping gasification [13-15] and chemical looping 41
combustion [16, 17], which can help facilitate low cost CO2 capture. 42
Although these studies provide promising ways to produce energy products with low-to-zero 43
process CO2 emissions with coal and gas, petcoke has not yet been examined as a potential 44
resource to use at the systems level. Even though petcoke and coal have some similarities, the 45
results of the prior studies using coal cannot be readily extrapolated to petcoke. Fundamentally, 46
coal is a more valuable commodity, and petcoke is a low-quality waste product of limited use. As 47
such, petcoke gasification systems produce syngas with a different quality from the coal-based 48
equivalent, which significantly affects the design and economics of the polygeneration plant. The 49
primary innovation of this work is development and techno-economic optimization of the first 50
petcoke-based polygeneration process with zero CO2 emissions. In addition, the incorporation of 51
shale gas steam reforming is another novelty of this work. We focus in the present study on various 52
processes that can upgrade petcoke to chemicals and fuels with minimal environmental impacts. 53
Therefore, the purpose of this work is to determine how petcoke can best be used in combination 54
with natural gas in a polygeneration system which produces different energy products while 55
maintaining zero direct CO2 emissions. 56
57 58
59
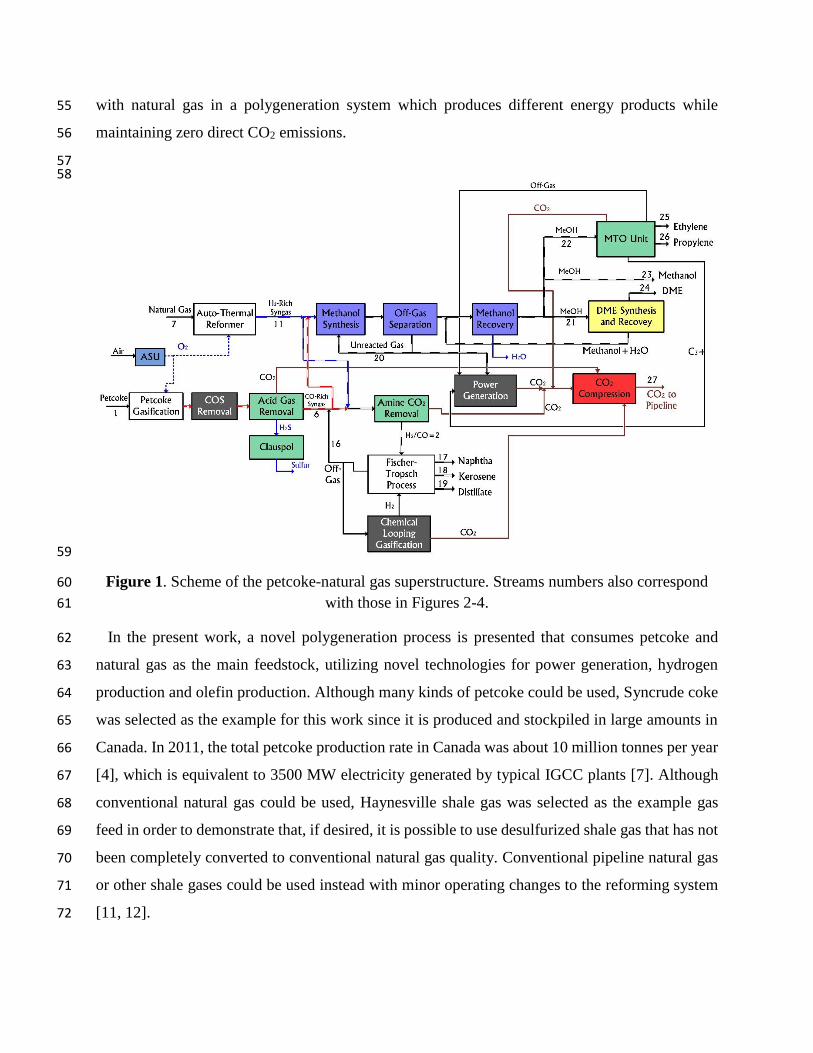
Figure 1. Scheme of the petcoke-natural gas superstructure. Streams numbers also correspond 60
with those in Figures 2-4. 61
In the present work, a novel polygeneration process is presented that consumes petcoke and 62
natural gas as the main feedstock, utilizing novel technologies for power generation, hydrogen 63
production and olefin production. Although many kinds of petcoke could be used, Syncrude coke 64
was selected as the example for this work since it is produced and stockpiled in large amounts in 65
Canada. In 2011, the total petcoke production rate in Canada was about 10 million tonnes per year 66
[4], which is equivalent to 3500 MW electricity generated by typical IGCC plants [7]. Although 67
conventional natural gas could be used, Haynesville shale gas was selected as the example gas 68
feed in order to demonstrate that, if desired, it is possible to use desulfurized shale gas that has not 69
been completely converted to conventional natural gas quality. Conventional pipeline natural gas 70
or other shale gases could be used instead with minor operating changes to the reforming system 71
[11, 12]. 72
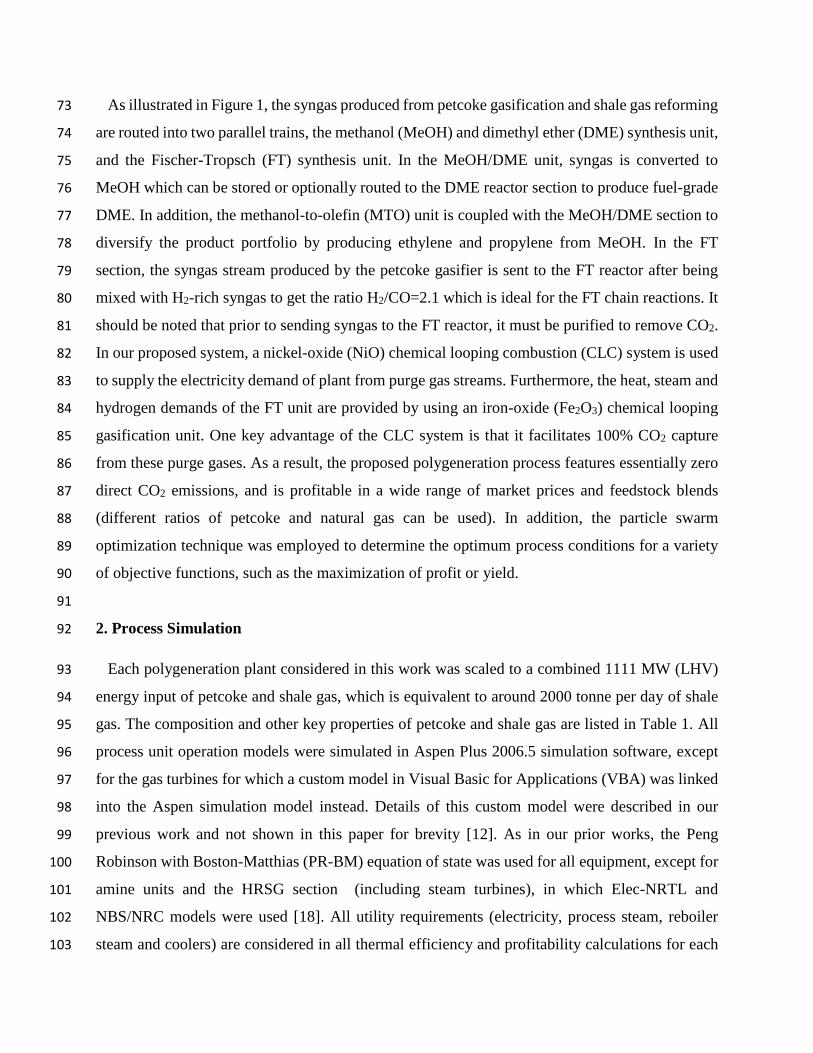
As illustrated in Figure 1, the syngas produced from petcoke gasification and shale gas reforming 73
are routed into two parallel trains, the methanol (MeOH) and dimethyl ether (DME) synthesis unit, 74
and the Fischer-Tropsch (FT) synthesis unit. In the MeOH/DME unit, syngas is converted to 75
MeOH which can be stored or optionally routed to the DME reactor section to produce fuel-grade 76
DME. In addition, the methanol-to-olefin (MTO) unit is coupled with the MeOH/DME section to 77
diversify the product portfolio by producing ethylene and propylene from MeOH. In the FT 78
section, the syngas stream produced by the petcoke gasifier is sent to the FT reactor after being 79
mixed with H2-rich syngas to get the ratio H2/CO=2.1 which is ideal for the FT chain reactions. It 80
should be noted that prior to sending syngas to the FT reactor, it must be purified to remove CO2. 81
In our proposed system, a nickel-oxide (NiO) chemical looping combustion (CLC) system is used 82
to supply the electricity demand of plant from purge gas streams. Furthermore, the heat, steam and 83
hydrogen demands of the FT unit are provided by using an iron-oxide (Fe2O3) chemical looping 84
gasification unit. One key advantage of the CLC system is that it facilitates 100% CO2 capture 85
from these purge gases. As a result, the proposed polygeneration process features essentially zero 86
direct CO2 emissions, and is profitable in a wide range of market prices and feedstock blends 87
(different ratios of petcoke and natural gas can be used). In addition, the particle swarm 88
optimization technique was employed to determine the optimum process conditions for a variety 89
of objective functions, such as the maximization of profit or yield. 90
91
2. Process Simulation 92
Each polygeneration plant considered in this work was scaled to a combined 1111 MW (LHV) 93
energy input of petcoke and shale gas, which is equivalent to around 2000 tonne per day of shale 94
gas. The composition and other key properties of petcoke and shale gas are listed in Table 1. All 95
process unit operation models were simulated in Aspen Plus 2006.5 simulation software, except 96
for the gas turbines for which a custom model in Visual Basic for Applications (VBA) was linked 97
into the Aspen simulation model instead. Details of this custom model were described in our 98
previous work and not shown in this paper for brevity [12]. As in our prior works, the Peng 99
Robinson with Boston-Matthias (PR-BM) equation of state was used for all equipment, except for 100
amine units and the HRSG section (including steam turbines), in which Elec-NRTL and 101
NBS/NRC models were used [18]. All utility requirements (electricity, process steam, reboiler 102
steam and coolers) are considered in all thermal efficiency and profitability calculations for each 103
plant. Since most of the units are already detailed in previous works [11, 12, 19, 20], only the new 104
units are described in this paper. The main products specifications are also listed in Table 2. These 105
values were used as the design specifications in the simulation of their corresponding production 106
units. 107
Table 1. Properties of petcoke and shale gas feedstocks. 108
Petcoke [5]: Syncrude coke;
Gross heating value: 13923 Btu/lb (HHV)
Property proximate (wt. %)
Moisture 0.25 Ash 4.83
Volatiles 4.99 Fixed carbon 89.95
Ultimate (wt. %)
Carbon 83.74 Chlorine 0.25 Nitrogen 2.03
Hydrogen 1.77 Sulfur 6.52 Oxygen 0.88
Shale gas [21]: Haynesville
Gas composition (% molar)
Methane 0.948 CO2 0.05
Ethane 0.001 N2 0.001
109
Table 2. Main products properties and purity specifications. 110
MeOH Mole purity (industrial grade): 99.5% [22]
DME Mole purity (fuel grade): 99.9% [23]
Propylene Mole purity (polymer grade): 99.2% [24]
Ethylene Mole purity (polymer grade): 99.9% [25]
Naphtha True boiling point temperature, 100% liquid: 150°C [26]
Kerosene True boiling point temperature, 100% liquid: 260°C [26]
Diesel (Distillate) True boiling point temperature, 100% liquid: 380°C [26]
CO2 captured Mole purity ≥ 0.966 [27]
111
2.1 Petcoke Gasification 112
Various types of petcoke gasification technologies have been developed in recent years. For 113
example, Lee et al. [6] investigated the main characteristics of petcoke gasification by 114
experimenting on a 1 tonne per day entrained flow gasifier pilot unit. A detailed study of different 115
petcoke gasification mechanisms, provided by Murthy et al. [7], showed that entrained flow 116
gasifiers are capable of offering higher efficiency and conversion compared to other kinds of 117
gasifiers. In addition, our previous work [20] showed that coal-based polygeneration systems using 118
slurry feed entrained gasifiers are generally more profitable than systems using dry gasifiers, and 119
so it is likely to be a good choice for use in the petcoke-based polygeneration systems studied in 120
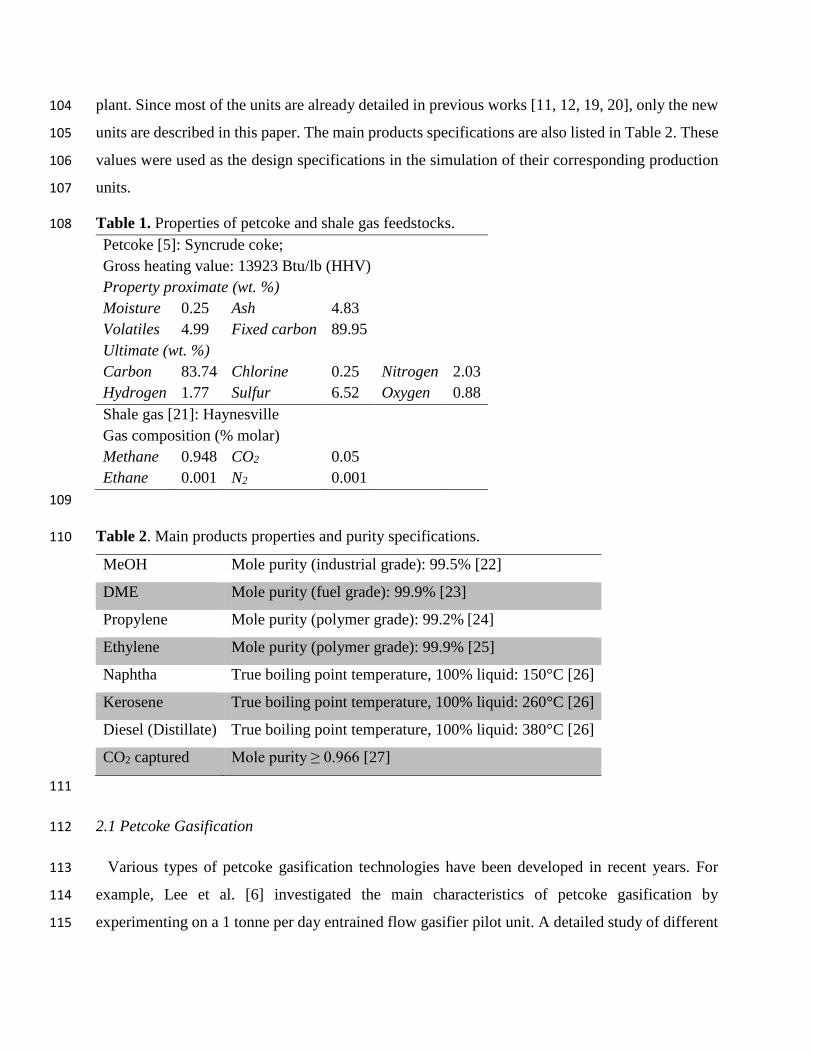
this work. Thus, the slurry feed entrained gasifier was chosen as shown in Figure 2. The typical 121
operating range of this type of gasifier is 20-80 bar and 1200-1600°C [7]. Using a "full heat 122
recovery" gasification system, described by Furimsky [1, 7], high pressure steam is generated in 123
both radiant and convective coolers. The H2/CO ratio of the produced syngas is around 0.39. This 124
syngas stream is then sent to the purification unit to remove NH3 and HCl. A COS conversion 125
reactor is also required to hydrolyze the COS impurities to H2S: 126
COS + H2O → CO2 + H2S (1) 127
The reactor effluent must pass through an amine unit to remove H2S and CO2 from the syngas. 128
Diglycolamine (DGA) solvent (70% wt. DGA/30% wt. H2O) has been used as the scrubbing amine 129
for the acid gas removal in this section and also for the CO2 removal step of MTO (Figure 1) and 130
FT units (Figures 1 and 4). MDEA was also investigated as a potential solvent, but our simulation 131
results showed that at the same acid gas removal performance, the energy requirement and amine 132
loss of DGA is lower than those of MDEA. The Elec-NRTL model was used for the simulation of 133
the amine units, and the methodology for construction of the flowsheet and simulation is described 134
in our prior work [28]. The clean syngas is then sent to the reforming section to be mixed with the 135
H2-rich syngas as described in the next section. The captured acid gases are sent to the Clauspol 136
unit where H2S is removed and converted to liquid sulphur. This unit is not modeled but its utility 137
consumption and cost are considered in the techno-economic analysis of each plant [29]. The CO2 138
recovered in the Clauspol process is sent to the CO2 compression unit to be liquefied. 139
140
141
Figure 2. Petcoke gasification and purification unit [1]. 142
2.1.1 Shale Gas Reforming 143
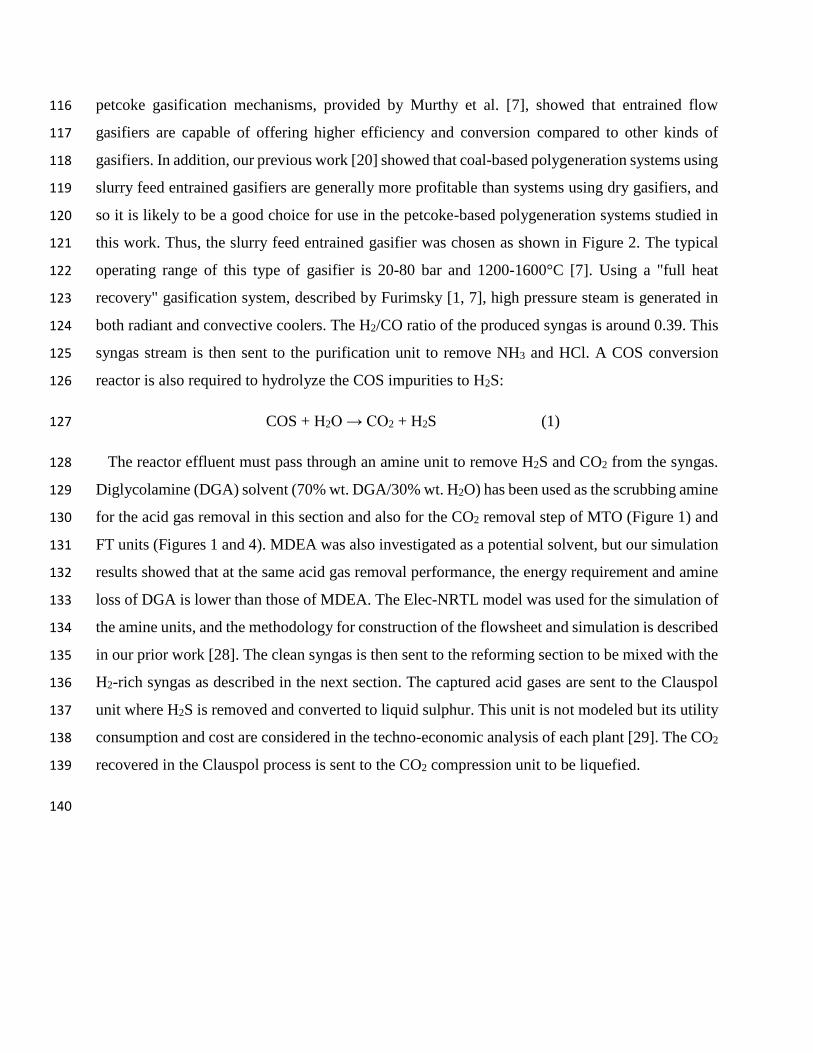
The synthesis gas produced by the petcoke gasifier is mixed with the unreacted gases from the 144
FT unit (stream 16, Figures 3 and 4). This CO-rich syngas stream is mixed with the H2-rich syngas 145
provided by the shale gas reformer, and then divided into two streams and fed to FT (stream 12) 146
and MeOH/DME (stream 13) units, respectively. The ratio of blending is adjusted to create a ratio 147
of H2/CO around 2.1, which is required by FT unit. Conversion of shale gas to H2-rich synthesis 148
gas is performed in a low-temperature pre-reformer followed by a high-temperature reformer as 149
shown in Figure 3. This system is applicable for different low N2 content shale gases such as 150
Marcellus, New Albany or Fayetteville [21]. Details of the operating conditions of the natural gas 151
reforming section are described in [19, 20] and will not be described here for brevity. 152
153
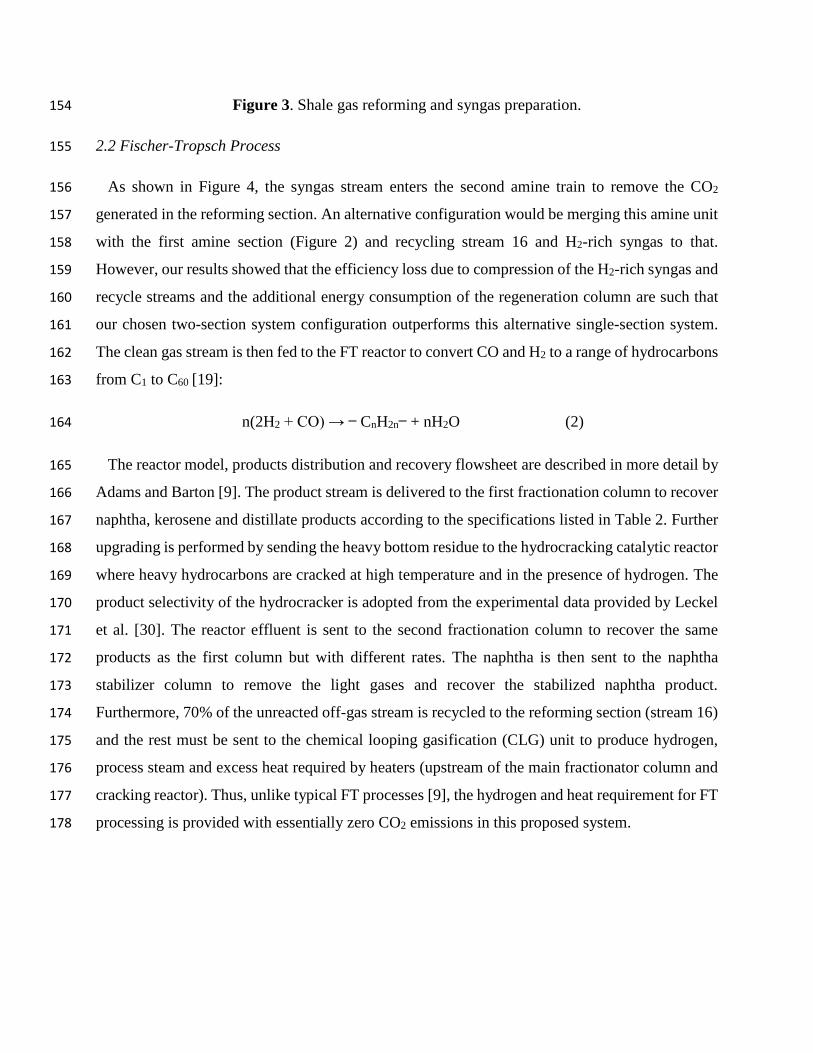
Figure 3. Shale gas reforming and syngas preparation. 154
2.2 Fischer-Tropsch Process 155
As shown in Figure 4, the syngas stream enters the second amine train to remove the CO2 156
generated in the reforming section. An alternative configuration would be merging this amine unit 157
with the first amine section (Figure 2) and recycling stream 16 and H2-rich syngas to that. 158
However, our results showed that the efficiency loss due to compression of the H2-rich syngas and 159
recycle streams and the additional energy consumption of the regeneration column are such that 160
our chosen two-section system configuration outperforms this alternative single-section system. 161
The clean gas stream is then fed to the FT reactor to convert CO and H2 to a range of hydrocarbons 162
from C1 to C60 [19]: 163
n(2H2 + CO) → — CnH2n— + nH2O (2) 164
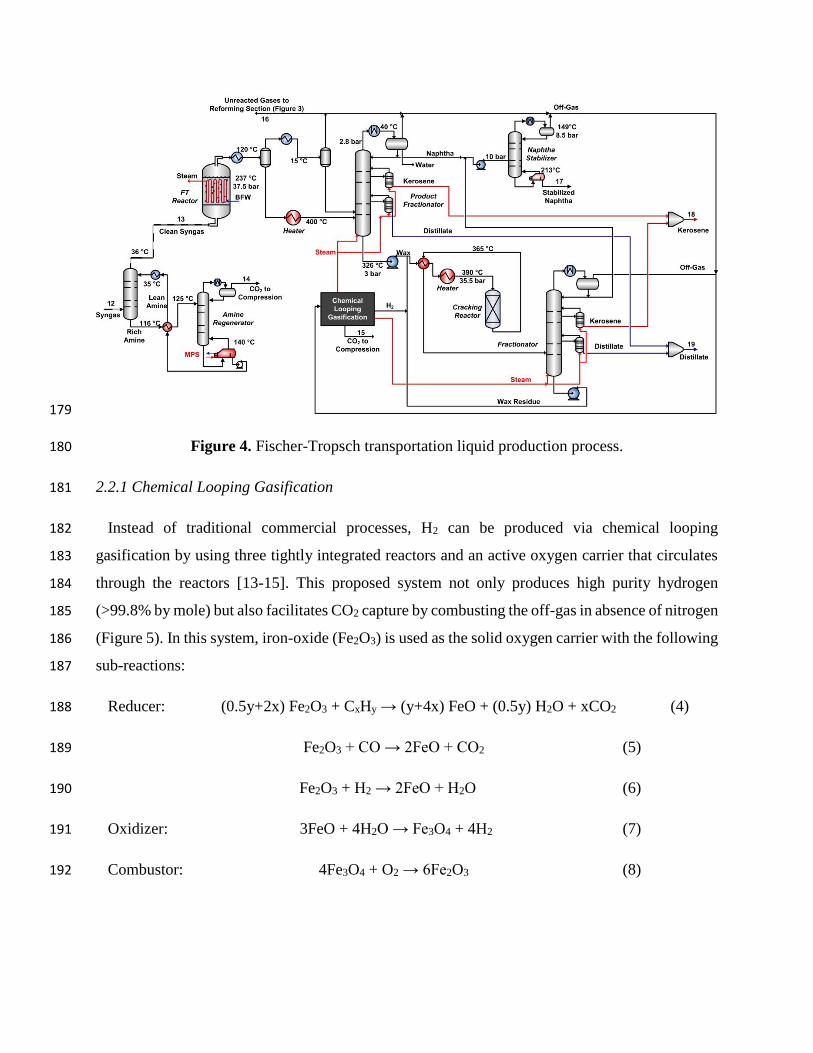
The reactor model, products distribution and recovery flowsheet are described in more detail by 165
Adams and Barton [9]. The product stream is delivered to the first fractionation column to recover 166
naphtha, kerosene and distillate products according to the specifications listed in Table 2. Further 167
upgrading is performed by sending the heavy bottom residue to the hydrocracking catalytic reactor 168
where heavy hydrocarbons are cracked at high temperature and in the presence of hydrogen. The 169
product selectivity of the hydrocracker is adopted from the experimental data provided by Leckel 170
et al. [30]. The reactor effluent is sent to the second fractionation column to recover the same 171
products as the first column but with different rates. The naphtha is then sent to the naphtha 172
stabilizer column to remove the light gases and recover the stabilized naphtha product. 173
Furthermore, 70% of the unreacted off-gas stream is recycled to the reforming section (stream 16) 174
and the rest must be sent to the chemical looping gasification (CLG) unit to produce hydrogen, 175
process steam and excess heat required by heaters (upstream of the main fractionator column and 176
cracking reactor). Thus, unlike typical FT processes [9], the hydrogen and heat requirement for FT 177
processing is provided with essentially zero CO2 emissions in this proposed system. 178
179
Figure 4. Fischer-Tropsch transportation liquid production process. 180
2.2.1 Chemical Looping Gasification 181
Instead of traditional commercial processes, H2 can be produced via chemical looping 182
gasification by using three tightly integrated reactors and an active oxygen carrier that circulates 183
through the reactors [13-15]. This proposed system not only produces high purity hydrogen 184
(>99.8% by mole) but also facilitates CO2 capture by combusting the off-gas in absence of nitrogen 185
(Figure 5). In this system, iron-oxide (Fe2O3) is used as the solid oxygen carrier with the following 186
sub-reactions: 187
Reducer: (0.5y+2x) Fe2O3 + CxHy → (y+4x) FeO + (0.5y) H2O + xCO2 (4) 188
Fe2O3 + CO → 2FeO + CO2 (5) 189
Fe2O3 + H2 → 2FeO + H2O (6) 190
Oxidizer: 3FeO + 4H2O → Fe3O4 + 4H2 (7) 191
Combustor: 4Fe3O4 + O2 → 6Fe2O3 (8) 192
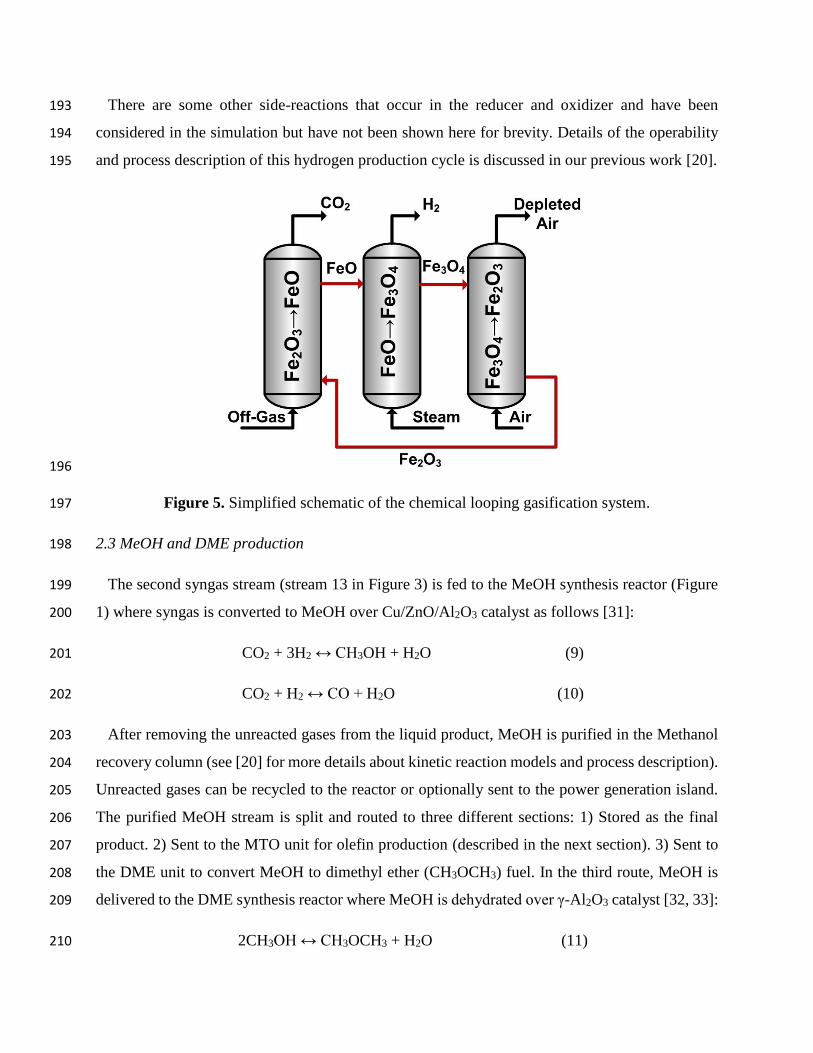
There are some other side-reactions that occur in the reducer and oxidizer and have been 193
considered in the simulation but have not been shown here for brevity. Details of the operability 194
and process description of this hydrogen production cycle is discussed in our previous work [20]. 195
196
Figure 5. Simplified schematic of the chemical looping gasification system. 197
2.3 MeOH and DME production 198
The second syngas stream (stream 13 in Figure 3) is fed to the MeOH synthesis reactor (Figure 199
1) where syngas is converted to MeOH over Cu/ZnO/Al2O3 catalyst as follows [31]: 200
CO2 + 3H2 ↔ CH3OH + H2O (9) 201
CO2 + H2 ↔ CO + H2O (10) 202
After removing the unreacted gases from the liquid product, MeOH is purified in the Methanol 203
recovery column (see [20] for more details about kinetic reaction models and process description). 204
Unreacted gases can be recycled to the reactor or optionally sent to the power generation island. 205
The purified MeOH stream is split and routed to three different sections: 1) Stored as the final 206
product. 2) Sent to the MTO unit for olefin production (described in the next section). 3) Sent to 207
the DME unit to convert MeOH to dimethyl ether (CH3OCH3) fuel. In the third route, MeOH is 208
delivered to the DME synthesis reactor where MeOH is dehydrated over γ-Al2O3 catalyst [32, 33]: 209
2CH3OH ↔ CH3OCH3 + H2O (11) 210
The reactor effluent is then sent to the DME recovery column (Figure 1) to purify the DME 211
product and recycle back MeOH+water to methanol recovery column. 212
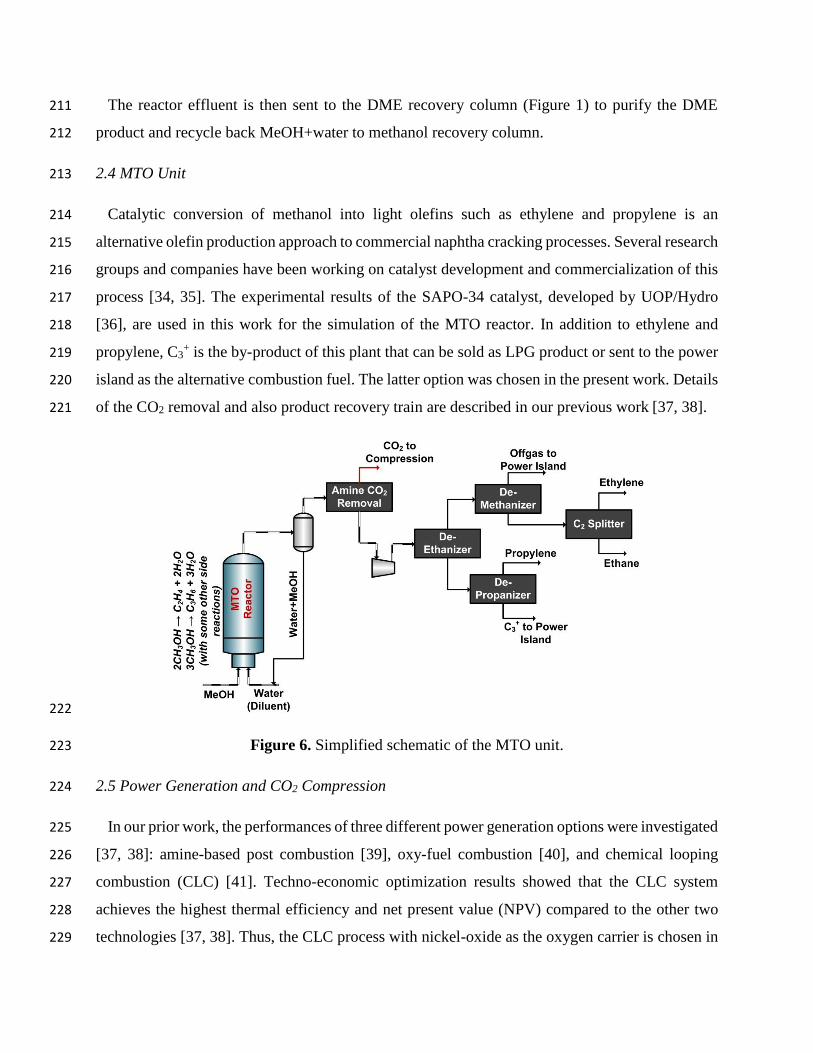
2.4 MTO Unit 213
Catalytic conversion of methanol into light olefins such as ethylene and propylene is an 214
alternative olefin production approach to commercial naphtha cracking processes. Several research 215
groups and companies have been working on catalyst development and commercialization of this 216
process [34, 35]. The experimental results of the SAPO-34 catalyst, developed by UOP/Hydro 217
[36], are used in this work for the simulation of the MTO reactor. In addition to ethylene and 218
propylene, C3+ is the by-product of this plant that can be sold as LPG product or sent to the power 219
island as the alternative combustion fuel. The latter option was chosen in the present work. Details 220
of the CO2 removal and also product recovery train are described in our previous work [37, 38]. 221
222
Figure 6. Simplified schematic of the MTO unit. 223
2.5 Power Generation and CO2 Compression 224
In our prior work, the performances of three different power generation options were investigated 225
[37, 38]: amine-based post combustion [39], oxy-fuel combustion [40], and chemical looping 226
combustion (CLC) [41]. Techno-economic optimization results showed that the CLC system 227
achieves the highest thermal efficiency and net present value (NPV) compared to the other two 228
technologies [37, 38]. Thus, the CLC process with nickel-oxide as the oxygen carrier is chosen in 229
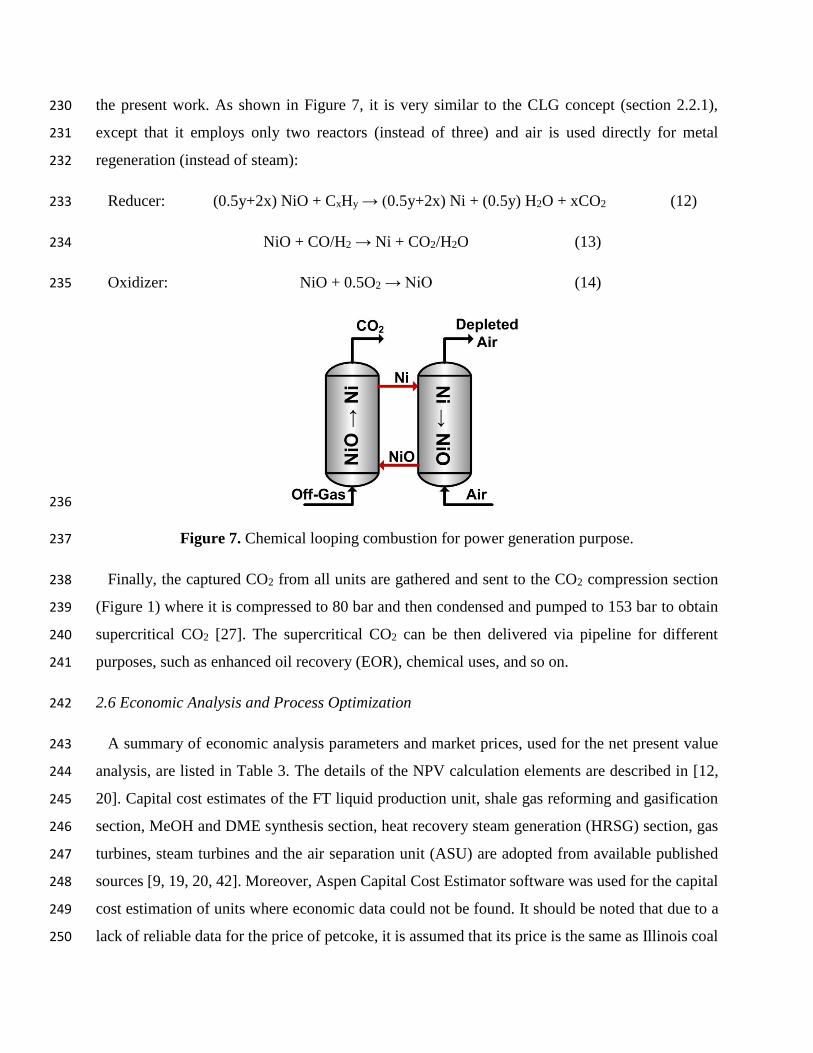
the present work. As shown in Figure 7, it is very similar to the CLG concept (section 2.2.1), 230
except that it employs only two reactors (instead of three) and air is used directly for metal 231
regeneration (instead of steam): 232
Reducer: (0.5y+2x) NiO + CxHy → (0.5y+2x) Ni + (0.5y) H2O + xCO2 (12) 233
NiO + CO/H2 → Ni + CO2/H2O (13) 234
Oxidizer: NiO + 0.5O2 → NiO (14) 235
236
Figure 7. Chemical looping combustion for power generation purpose. 237
Finally, the captured CO2 from all units are gathered and sent to the CO2 compression section 238
(Figure 1) where it is compressed to 80 bar and then condensed and pumped to 153 bar to obtain 239
supercritical CO2 [27]. The supercritical CO2 can be then delivered via pipeline for different 240
purposes, such as enhanced oil recovery (EOR), chemical uses, and so on. 241
2.6 Economic Analysis and Process Optimization 242
A summary of economic analysis parameters and market prices, used for the net present value 243
analysis, are listed in Table 3. The details of the NPV calculation elements are described in [12, 244
20]. Capital cost estimates of the FT liquid production unit, shale gas reforming and gasification 245
section, MeOH and DME synthesis section, heat recovery steam generation (HRSG) section, gas 246
turbines, steam turbines and the air separation unit (ASU) are adopted from available published 247
sources [9, 19, 20, 42]. Moreover, Aspen Capital Cost Estimator software was used for the capital 248
cost estimation of units where economic data could not be found. It should be noted that due to a 249
lack of reliable data for the price of petcoke, it is assumed that its price is the same as Illinois coal 250
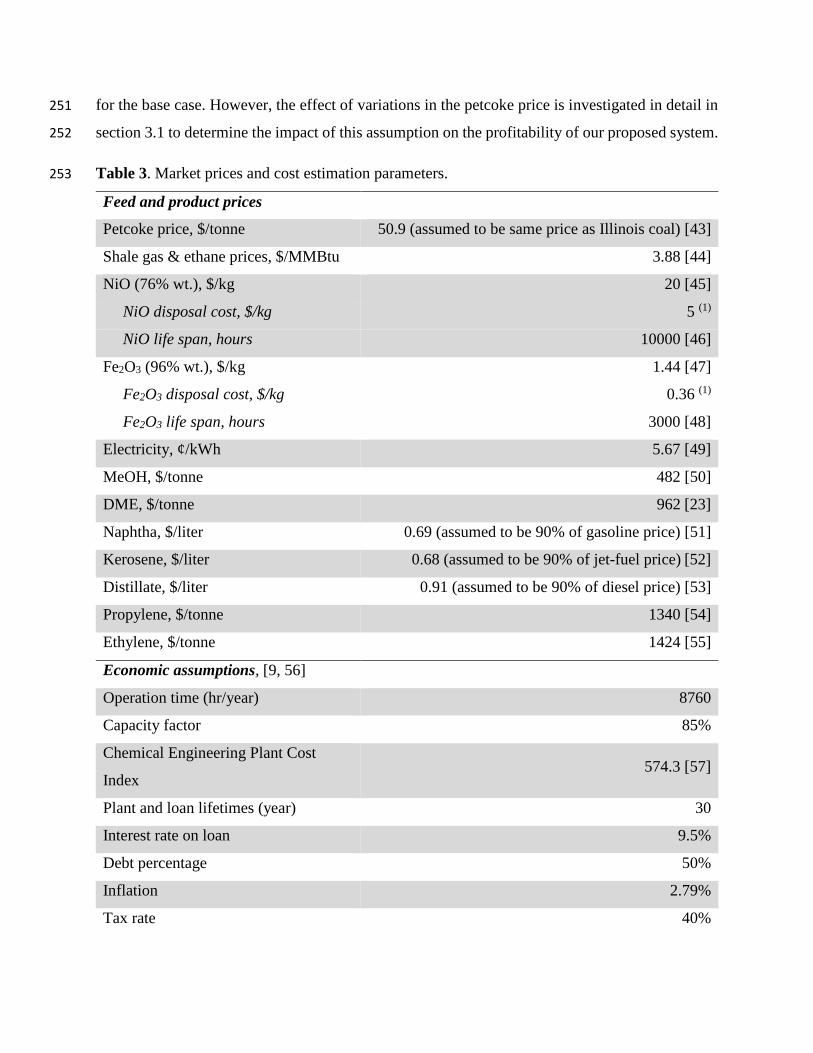
for the base case. However, the effect of variations in the petcoke price is investigated in detail in 251
section 3.1 to determine the impact of this assumption on the profitability of our proposed system. 252
Table 3. Market prices and cost estimation parameters. 253
Feed and product prices
Petcoke price, $/tonne 50.9 (assumed to be same price as Illinois coal) [43]
Shale gas & ethane prices, $/MMBtu 3.88 [44]
NiO (76% wt.), $/kg 20 [45]
NiO disposal cost, $/kg 5 (1)
NiO life span, hours 10000 [46]
Fe2O3 (96% wt.), $/kg 1.44 [47]
Fe2O3 disposal cost, $/kg 0.36 (1)
Fe2O3 life span, hours 3000 [48]
Electricity, ¢/kWh 5.67 [49]
MeOH, $/tonne 482 [50]
DME, $/tonne 962 [23]
Naphtha, $/liter 0.69 (assumed to be 90% of gasoline price) [51]
Kerosene, $/liter 0.68 (assumed to be 90% of jet-fuel price) [52]
Distillate, $/liter 0.91 (assumed to be 90% of diesel price) [53]
Propylene, $/tonne 1340 [54]
Ethylene, $/tonne 1424 [55]
Economic assumptions, [9, 56]
Operation time (hr/year) 8760
Capacity factor 85%
Chemical Engineering Plant Cost
Index 574.3 [57]
Plant and loan lifetimes (year) 30
Interest rate on loan 9.5%
Debt percentage 50%
Inflation 2.79%
Tax rate 40%
Equity return rate 20%
(1) Due to lack of published data, assumed to be 25% of the metal-oxide price. 254
255
2.6.1 Process Optimization 256
There are 5 main decision variables that affect the product portfolio of plant, its thermal 257
efficiency, and its NPV: 258
1. Petcoke consumption (stream 1, Figure 1), which influences both product portfolio and 259
subsequently the profitability of the plant. As mentioned earlier, when the petcoke rate 260
is altered, the shale gas rate is automatically adjusted such that the total energy input 261
remains the same. The petcoke rate is allowed to vary between 0 tonne/day and 3254 262
tonne/day (0-1111 MW (LHV), or 0%-100% of total input). 263
2. The split ratio of CO-rich syngas that is sent to FT section (Figure 3). By raising this ratio 264
the FT liquid production increases, and thus, the MeOH, DME and olefin production 265
rates drop subsequently. The split ratio is allowed to vary between 0% and 100%. 266
3. The recycle ratio of unreacted gases that are sent back to the MeOH synthesis reactor 267
(Steam 20, Figure 1). Raising this recycle ratio increases the MeOH production rate. On 268
the other hand, the unreacted gases can be used for power generation to meet the plant’s 269
electricity demand or even be sold to the power grid. The recycle ratio is allowed to vary 270
between 0% and 99%. Note that a 100% recycle ratio is not possible because a purge 271
stream is required to allow impurities such as nitrogen to escape from the MeOH 272
synthesis loop. 273
4. The percentage of the MeOH product that is fed to the DME synthesis reactor (Stream 274
21, Figure 1). 275
5. The percentage of the MeOH product that is fed to the MTO reactor (Stream 22, Figure 276
1). Both 4 and 5 impact the DME, olefins and stored MeOH rates relatively. The MeOH 277
to DME and MTO ratios are allowed to vary between 5% and 95% and manually set to 278
0% when they reach the lower bound (5%). 279
Different scenarios are considered for the optimization of plant, as described in section 3, and for 280
each scenario the objective function and constraints where changed respectively. Furthermore, the 281
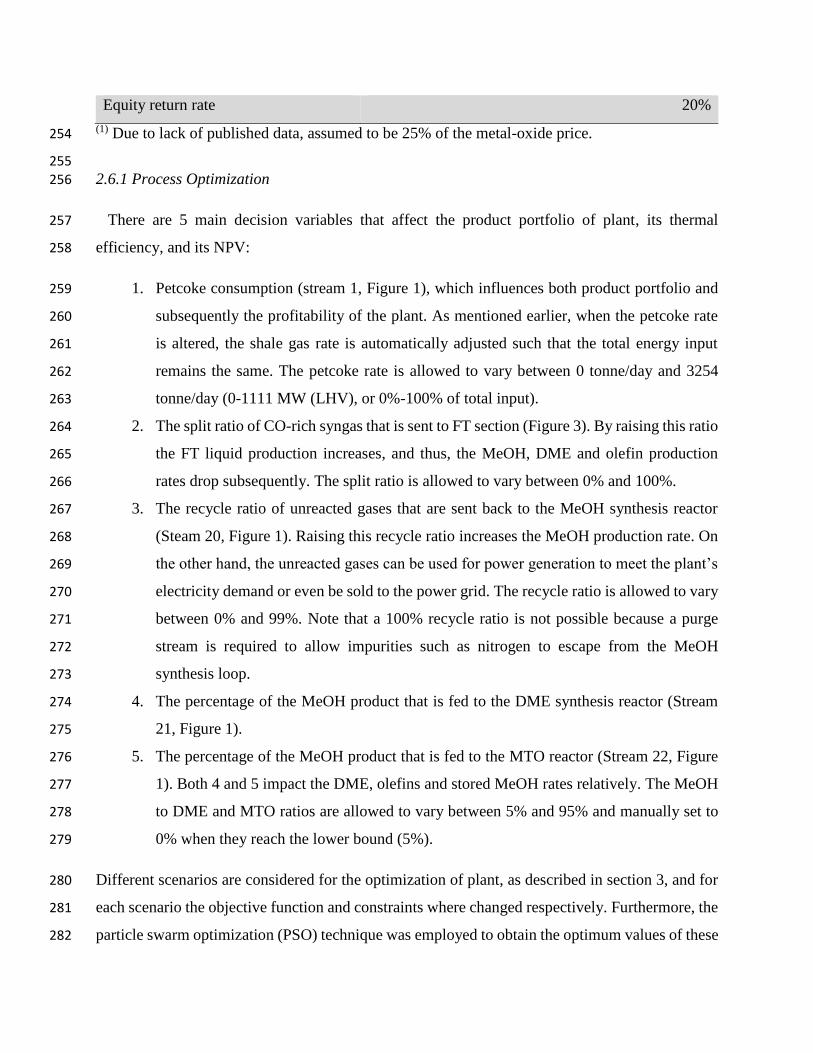
particle swarm optimization (PSO) technique was employed to obtain the optimum values of these 282
five variables for each scenario (Table 4). The PSO code was adopted from our previous work [12] 283
in MATLAB and linked to the Aspen simulation file using VBA code. The only change is the 284
maximum number of function evaluations (NFE) which has been increased to 150, since there 285
were more decision variables to be considered and thus requiring more iterations. This 286
optimization technique was much faster than other heuristic approaches such as genetic algorithm 287
(GA) and simulated annealing (SA). It was found by testing the PSO, GA and SA techniques on 288
the optimization scenarios listed in Table 5. Therefore PSO is used for all sensitivity analyses to 289
locate the optimum conditions at different market prices. 290
Table 4. Particle Swarm Optimization (PSO) parameters [58]. 291
Parameter Value
Number of function evaluation (NFE) 150
Number of particles 5
Number of process variables 5 (see section 2.6.1)
Objective function See Table 5
a1, a2 2.05
φ a1 + a2
Inertia weight (w) 2
|2−φ−√φ2−4φ|
Personal and global learning ratios (c1, c2) a1w, a2w
292
3. Results 293
The techno-economic results and breakdown of products and feedstocks are listed in Table 5 for 294
different optimization scenarios (objective functions): 1) Maximum NPV; 2) Maximum olefin 295
production; 3) Maximum transportation fuel production; and 4) Maximum petcoke consumption. 296
It can be seen that the maximum NPV (first scenario) is achieved when most of the output is DME. 297
In addition to NPV, the thermal efficiency of this scenario is the highest compared to other 298
scenarios. This means the DME section not only produces more valuable products (in terms of 299
market prices) but also has higher efficiency than the olefin and FT-liquid production units. In the 300
second scenario, the objective function was to maximize the olefins production rate with an added 301
constraint requiring non-negative NPV. This option shows that, at current market prices, the 302
maximum olefin production ratio (ethylene + propylene) must be less than 35.8% to have a 303
profitable plant. In the third scenario, the transportation fuel production is maximized with a non-304
negative NPV constraint. Based on the HHV energy content of outputs, around 59.2% of outputs 305
are the produced transportation fuels (gasoline, kerosene and diesel). Furthermore, around 19.6% 306
of feedstock is petcoke in this scenario. And finally the fourth scenario shows that the maximum 307
petcoke consumption ratio while still having a profitable plant is around 74%. In addition, for each 308
scenario, a summary of the most important economic parameters are listed in Table 6. It can be 309
seen that the internal return rate (IRR) of the first scenario is much higher than other options. This 310
means that at current market conditions, the production of DME is much more attractive than 311
olefins or FT-liquids. It should be noted that the profitability of the olefin section can be improved 312
significantly by polymerization of olefins and selling poly-olefin products instead of olefins. 313
However, a techno-economic analysis of this downstream unit is out of the scope of this work. 314
315
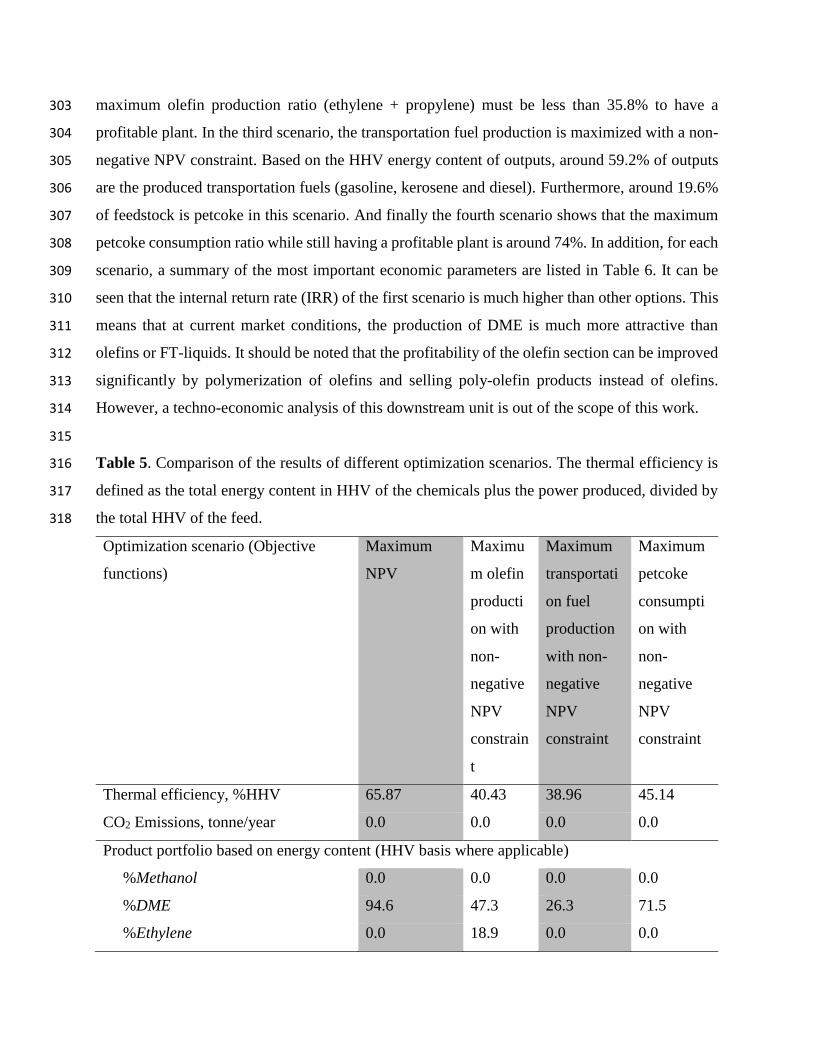
Table 5. Comparison of the results of different optimization scenarios. The thermal efficiency is 316
defined as the total energy content in HHV of the chemicals plus the power produced, divided by 317
the total HHV of the feed. 318
Optimization scenario (Objective
functions)
Maximum
NPV
Maximu
m olefin
producti
on with
non-
negative
NPV
constrain
t
Maximum
transportati
on fuel
production
with non-
negative
NPV
constraint
Maximum
petcoke
consumpti
on with
non-
negative
NPV
constraint
Thermal efficiency, %HHV 65.87 40.43 38.96 45.14
CO2 Emissions, tonne/year 0.0 0.0 0.0 0.0
Product portfolio based on energy content (HHV basis where applicable)
%Methanol 0.0 0.0 0.0 0.0
%DME 94.6 47.3 26.3 71.5
%Ethylene 0.0 18.9 0.0 0.0
%Propylene 0.0 16.9 0.0 0.0
%Ethane 0.0 1.6 0.0 0.0
%Naphtha 0.0 0.0 6.5 0.0
%Kerosene 0.0 0.0 12.0 0.0
%Distillate 0.0 0.0 40.7 0.0
%Power 5.4 15.3 14.5 28.5
Decision Variables (section 2.6.1)
Petcoke rate, tonne/day 0 0 661 2434
CO-rich syngas to FT 0% 0% 100% 0%
Recycle ratio 99% 99% 99% 99%
MeOH to DME 100% 53% 100% 100%
MeOH to MTO 0% 47% 0% 0%
Feedstock ratio
%Petcoke 0.0 0.0 19.6 74.0
%Shale gas 100.0 100.0 80.4 26.0
NPV, $million $1,237 0 0 0
Capital cost, $million $575 $595 $762 $937
319
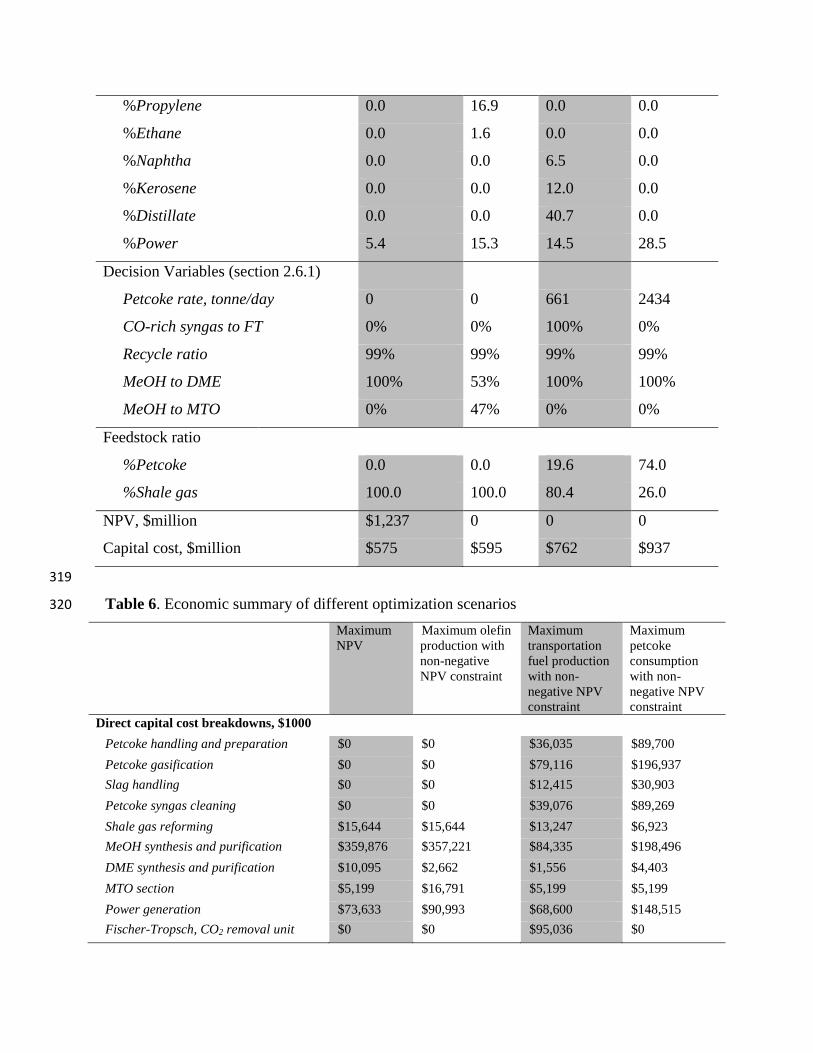
Table 6. Economic summary of different optimization scenarios 320
Maximum
NPV
Maximum olefin
production with
non-negative
NPV constraint
Maximum
transportation
fuel production
with non-
negative NPV
constraint
Maximum
petcoke
consumption
with non-
negative NPV
constraint
Direct capital cost breakdowns, $1000
Petcoke handling and preparation $0 $0 $36,035 $89,700
Petcoke gasification $0 $0 $79,116 $196,937
Slag handling $0 $0 $12,415 $30,903
Petcoke syngas cleaning $0 $0 $39,076 $89,269
Shale gas reforming $15,644 $15,644 $13,247 $6,923
MeOH synthesis and purification $359,876 $357,221 $84,335 $198,496
DME synthesis and purification $10,095 $2,662 $1,556 $4,403
MTO section $5,199 $16,791 $5,199 $5,199
Power generation $73,633 $90,993 $68,600 $148,515
Fischer-Tropsch, CO2 removal unit $0 $0 $95,036 $0
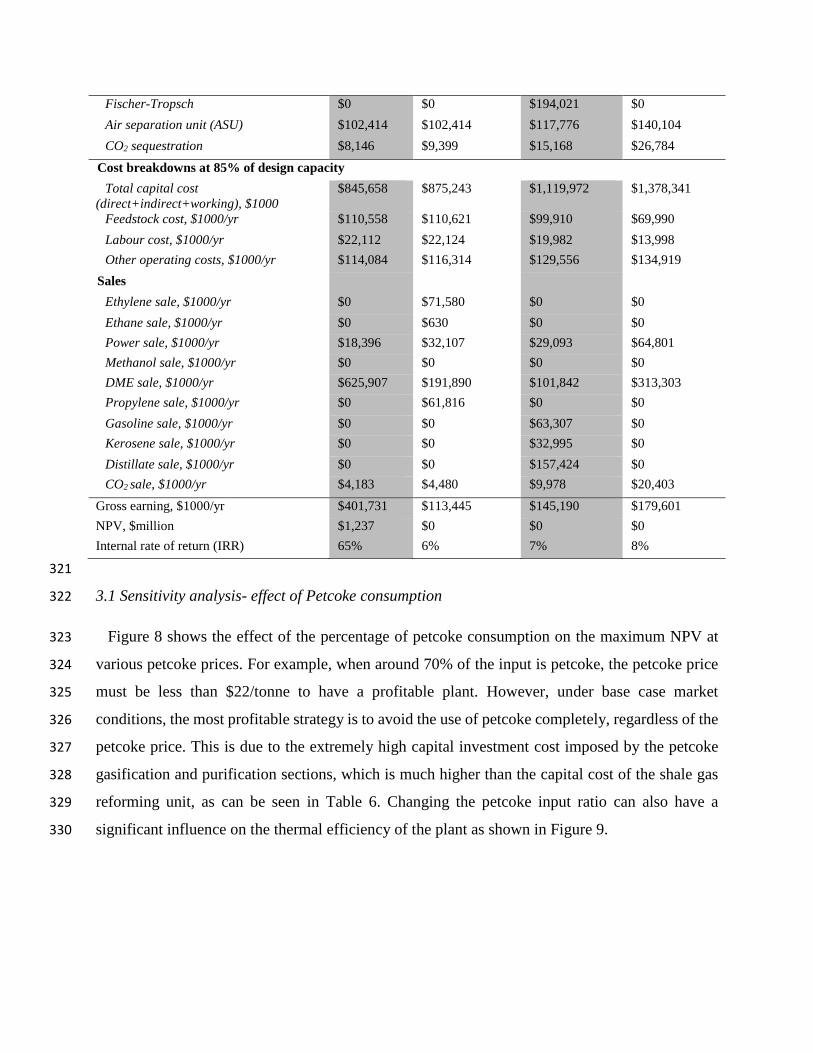
Fischer-Tropsch $0 $0 $194,021 $0
Air separation unit (ASU) $102,414 $102,414 $117,776 $140,104
CO2 sequestration $8,146 $9,399 $15,168 $26,784
Cost breakdowns at 85% of design capacity
Total capital cost
(direct+indirect+working), $1000
$845,658 $875,243 $1,119,972 $1,378,341
Feedstock cost, $1000/yr $110,558 $110,621 $99,910 $69,990
Labour cost, $1000/yr $22,112 $22,124 $19,982 $13,998
Other operating costs, $1000/yr $114,084 $116,314 $129,556 $134,919
Sales
Ethylene sale, $1000/yr $0 $71,580 $0 $0
Ethane sale, $1000/yr $0 $630 $0 $0
Power sale, $1000/yr $18,396 $32,107 $29,093 $64,801
Methanol sale, $1000/yr $0 $0 $0 $0
DME sale, $1000/yr $625,907 $191,890 $101,842 $313,303
Propylene sale, $1000/yr $0 $61,816 $0 $0
Gasoline sale, $1000/yr $0 $0 $63,307 $0
Kerosene sale, $1000/yr $0 $0 $32,995 $0
Distillate sale, $1000/yr $0 $0 $157,424 $0
CO2 sale, $1000/yr $4,183 $4,480 $9,978 $20,403
Gross earning, $1000/yr $401,731 $113,445 $145,190 $179,601
NPV, $million $1,237 $0 $0 $0
Internal rate of return (IRR) 65% 6% 7% 8%
321
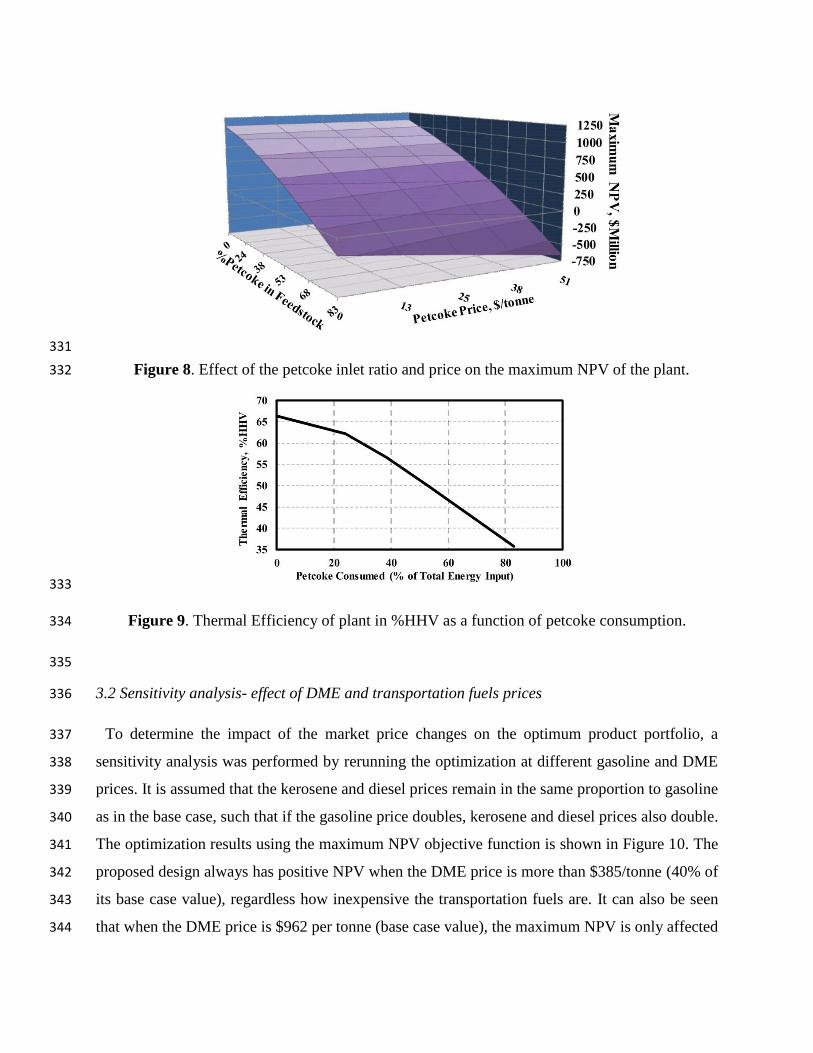
3.1 Sensitivity analysis- effect of Petcoke consumption 322
Figure 8 shows the effect of the percentage of petcoke consumption on the maximum NPV at 323
various petcoke prices. For example, when around 70% of the input is petcoke, the petcoke price 324
must be less than $22/tonne to have a profitable plant. However, under base case market 325
conditions, the most profitable strategy is to avoid the use of petcoke completely, regardless of the 326
petcoke price. This is due to the extremely high capital investment cost imposed by the petcoke 327
gasification and purification sections, which is much higher than the capital cost of the shale gas 328
reforming unit, as can be seen in Table 6. Changing the petcoke input ratio can also have a 329
significant influence on the thermal efficiency of the plant as shown in Figure 9. 330
331
Figure 8. Effect of the petcoke inlet ratio and price on the maximum NPV of the plant. 332
333
Figure 9. Thermal Efficiency of plant in %HHV as a function of petcoke consumption. 334
335
3.2 Sensitivity analysis- effect of DME and transportation fuels prices 336
To determine the impact of the market price changes on the optimum product portfolio, a 337
sensitivity analysis was performed by rerunning the optimization at different gasoline and DME 338
prices. It is assumed that the kerosene and diesel prices remain in the same proportion to gasoline 339
as in the base case, such that if the gasoline price doubles, kerosene and diesel prices also double. 340
The optimization results using the maximum NPV objective function is shown in Figure 10. The 341
proposed design always has positive NPV when the DME price is more than $385/tonne (40% of 342
its base case value), regardless how inexpensive the transportation fuels are. It can also be seen 343
that when the DME price is $962 per tonne (base case value), the maximum NPV is only affected 344
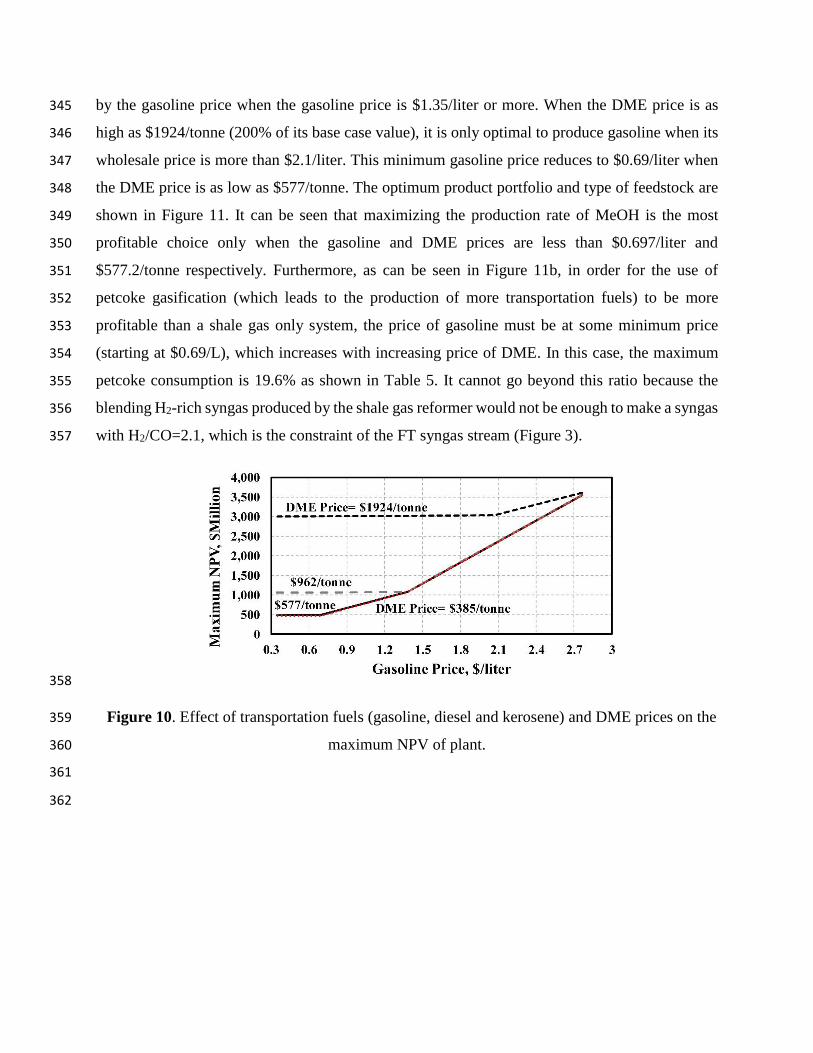
by the gasoline price when the gasoline price is $1.35/liter or more. When the DME price is as 345
high as $1924/tonne (200% of its base case value), it is only optimal to produce gasoline when its 346
wholesale price is more than $2.1/liter. This minimum gasoline price reduces to $0.69/liter when 347
the DME price is as low as $577/tonne. The optimum product portfolio and type of feedstock are 348
shown in Figure 11. It can be seen that maximizing the production rate of MeOH is the most 349
profitable choice only when the gasoline and DME prices are less than $0.697/liter and 350
$577.2/tonne respectively. Furthermore, as can be seen in Figure 11b, in order for the use of 351
petcoke gasification (which leads to the production of more transportation fuels) to be more 352
profitable than a shale gas only system, the price of gasoline must be at some minimum price 353
(starting at $0.69/L), which increases with increasing price of DME. In this case, the maximum 354
petcoke consumption is 19.6% as shown in Table 5. It cannot go beyond this ratio because the 355
blending H2-rich syngas produced by the shale gas reformer would not be enough to make a syngas 356
with H2/CO=2.1, which is the constraint of the FT syngas stream (Figure 3). 357
358
Figure 10. Effect of transportation fuels (gasoline, diesel and kerosene) and DME prices on the 359
maximum NPV of plant. 360
361
362

363
Figure 11. Effect of transportation fuels and DME prices on the optimum product portfolio and 364
feedstock selection. 365
3.3 Sensitivity analysis- effect of MeOH and transportation fuels prices 366
A similar sensitivity analysis was performed to determine the effect of varying the prices of 367
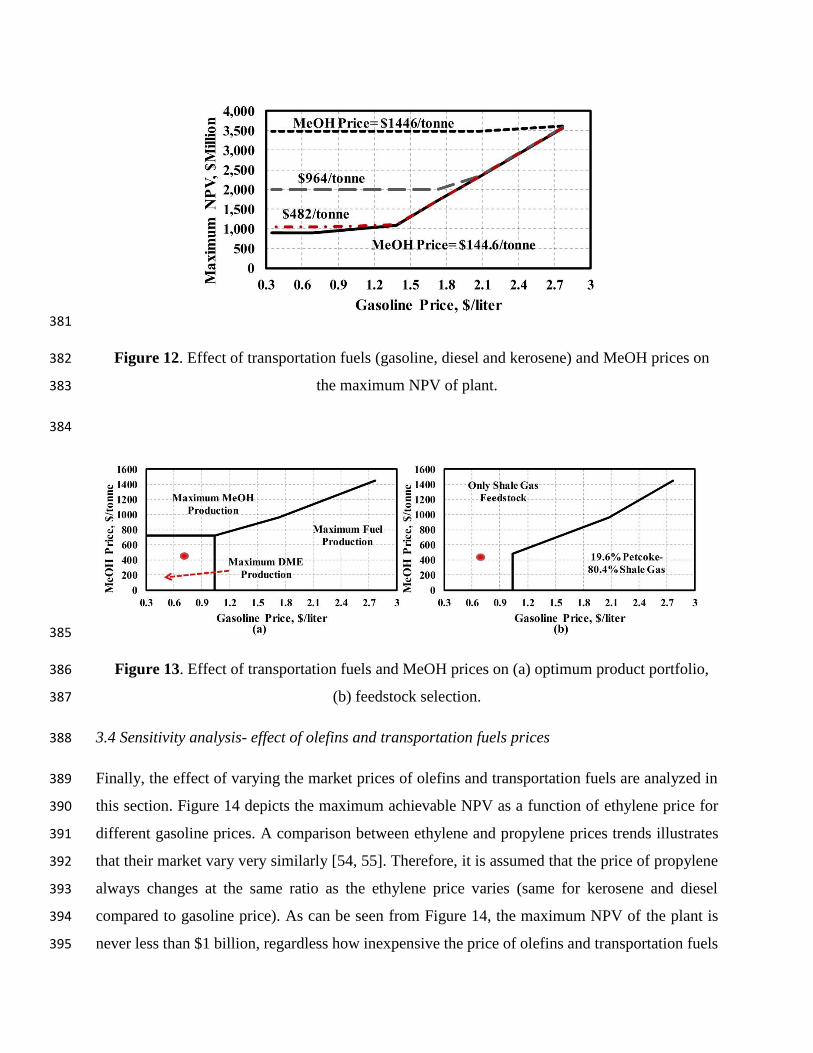
MeOH and gasoline on the maximum achievable NPV (Figure 12), optimum product portfolio 368
(Figure 13a) and the optimum feedstock selection (Figure 13b). As depicted in Figure 12, the 369
proposed design always has positive NPV regardless of MeOH and gasoline prices. When the 370
MeOH price is $482 per tonne (base case value), the maximum NPV is only affected by the 371
gasoline price when the gasoline price is $1.04/liter or more. Furthermore, when the MeOH price 372
is 3 times of its base case value ($1446/tonne), it is only optimal to produce gasoline when its 373
wholesale price is more than $2.7/liter. When the MeOH price is 2 times of its base case value 374
($964/tonne), this minimum gasoline price reduces to $1.73/liter. As shown in Figure 13a, when 375
the price of MeOH is $723/tonne or less, DME or transportation fuels are the major product of the 376
plant. Furthermore, as illustrated in Figure 13b, supplying syngas by using shale gas reforming-377
petcoke gasification trains is more profitable than using just the shale gas reforming system, only 378
when the price of gasoline is more than $1.037/liter. 379
380
381
Figure 12. Effect of transportation fuels (gasoline, diesel and kerosene) and MeOH prices on 382
the maximum NPV of plant. 383
384
385
Figure 13. Effect of transportation fuels and MeOH prices on (a) optimum product portfolio, 386
(b) feedstock selection. 387
3.4 Sensitivity analysis- effect of olefins and transportation fuels prices 388
Finally, the effect of varying the market prices of olefins and transportation fuels are analyzed in 389
this section. Figure 14 depicts the maximum achievable NPV as a function of ethylene price for 390
different gasoline prices. A comparison between ethylene and propylene prices trends illustrates 391
that their market vary very similarly [54, 55]. Therefore, it is assumed that the price of propylene 392
always changes at the same ratio as the ethylene price varies (same for kerosene and diesel 393
compared to gasoline price). As can be seen from Figure 14, the maximum NPV of the plant is 394
never less than $1 billion, regardless how inexpensive the price of olefins and transportation fuels 395
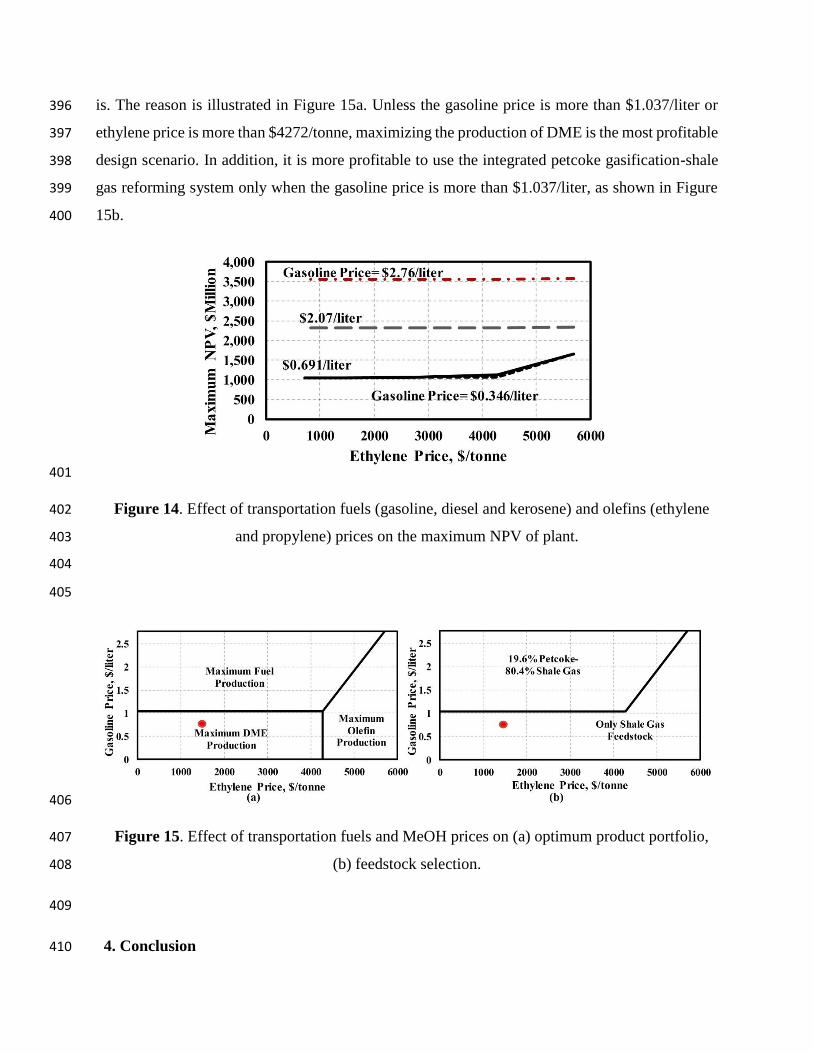
is. The reason is illustrated in Figure 15a. Unless the gasoline price is more than $1.037/liter or 396
ethylene price is more than $4272/tonne, maximizing the production of DME is the most profitable 397
design scenario. In addition, it is more profitable to use the integrated petcoke gasification-shale 398
gas reforming system only when the gasoline price is more than $1.037/liter, as shown in Figure 399
15b. 400
401
Figure 14. Effect of transportation fuels (gasoline, diesel and kerosene) and olefins (ethylene 402
and propylene) prices on the maximum NPV of plant. 403
404
405
406
Figure 15. Effect of transportation fuels and MeOH prices on (a) optimum product portfolio, 407
(b) feedstock selection. 408
409
4. Conclusion 410
In the present work, a novel polygeneration system was investigated that uses a combination of 411
shale gas and petcoke feedstocks and co-produces methanol, DME, FT liquids, electricity and 412
olefins. Incorporation of petcoke gasification technology and coupling it with the shale gas 413
reforming system is a great opportunity for petcoke producers such as oil sand upgrading plants 414
and heavy oil refineries. This proposed process not only offers a zero carbon emissions model, but 415
also can be an incentive for those producers to convert stockpiled petcoke to more valuable 416
products, as an alternative to combusting petcoke or transporting it to regions or countries that do 417
not control the environmental impacts of petcoke combustion. 418
Chemical looping combustion and chemical looping gasification alternatives were also 419
considered for the power generation and FT units respectively, which both have beneficial effects 420
on the performance of the plant. In addition, four optimization scenarios were investigated to 421
determine the maximum achievable NPV, olefin production, FT liquid production and petcoke 422
consumption. Optimization results showed that up to 74% of the feed can be petcoke while having 423
a profitable plant. Moreover, a comprehensive sensitivity analysis was performed resulting that 424
this integrated system can be profitable over a wide range of market conditions. 425
Nomenclature 426
Abbreviations 427
ASU Air separation unit 428
CLC Chemical looping combustion 429
CLG Chemical looping gasification 430
CEPCI Chemical engineering plant cost index 431
DGA Diglycolamine 432
DME Dimethyl ether 433
FT Fischer-Tropsch 434
HHV Higher heating value 435
HRSG Heat recovery steam generator 436
LHV Lower heating value 437
LPG Liquefied petroleum gas 438
MDEA Methyl diethanolamine 439
MTO Methanol-to-olefin 440
NBS National Bureau of Standards 441
NFE Number of function evaluations 442
NPV Net present value 443
NRC National Research Council 444
NRTL Non-random two-liquid model 445
PSO Particle swarm optimization 446
References 447
[1] Furimsky E. Gasification in Petroleum Refinery of 21st Century. Oil & Gas Science and Technology - Rev IFP. 1999;54(5):597-448 618. 449 [2] M. S. Rana, V. Sa´mano, J. Ancheyta, Diaz JAI. A review of recent advances on process technologies for upgrading of heavy 450 oils and residua. Fuel. 2007;86:1216-31. 451
[3] Hammond D, Lampert L, Mart C, Massenzio S, Phillips G, Sellards D, et al. Review of fluid bed coking technologies. Petroleum 452 technology quarterly. 2003;8:27-34. 453 [4] Stockman L. Petroleum Coke: the coal hiding in the tar sands. Oil Chance International, Washington DC, USA. 2013. 454 [5] Furimsky E. Gasification of oil sand coke: Review. Fuel Process Technol. 1998;56(3):263-90. 455 [6] Lee SH, Yoon SJ, Ra HW, Son YI, Hong JC, Lee JG. Gasification characteristics of coke and mixture with coal in an entrained-456 flow gasifier. Energy. 2010;35(8):3239-44. 457 [7] Murthy BN, Sawarkar AN, Deshmukh NA, Mathew T, Joshi JB. Petroleum coke gasification: A review. The Canadian Journal 458 of Chemical Engineering. 2014;92(3):441-68. 459 [8] Centralized coke gasification study under the clean coal-carbon program, JACOBS Consultancy: Technical Report for Alberta 460 Innovates-Energy and Environment Solutions. 2010. 461 [9] Adams II TA, Barton PI. Combining coal gasification and natural gas reforming for efficient polygeneration. Fuel Process 462 Technol. 2011;92:639-55. 463 [10] Adams II TA, Barton PI. Combining coal gasification, natural gas reforming, and solid oxide fuel cells for efficient 464 polygeneration with CO2 capture and sequestration. Fuel Process Technol. 2011;92:2105-15. 465 [11] Khojasteh Salkuyeh Y, A. Adams II T. Shale gas for the petrochemical industry: incorporation of novel technologies. 466 Conference Shale gas for the petrochemical industry: incorporation of novel technologies, Washington, USA. 467 [12] Khojasteh Salkuyeh Y, Adams II TA. A novel polygeneration process to co-produce ethylene and electricity from shale gas 468 with zero CO2 emissions via methane oxidative coupling. Energy Convers Manage. 2015;92(0):406-20. 469 [13] Fan L, Li F, Ramkumar S. Utilization of chemical looping strategy in coal gasification processes. Particuology. 2008;6:131-470 42. 471 [14] Li F, Kim HR, Sridhar D, Wang F, Zeng L, Chen J, et al. Syngas Chemical Looping Gasification Process: Oxygen Carrier 472 Particle Selection and Performance. Energy & Fuels. 2009;23:4182–9. 473 [15] Velazquez-Vargas LG. Development of chemical looping gasification processes for the production of hydrogen from coal: 474 The Ohio State University, 2007. 475 [16] Kolbitsch P, Bolhàr-Nordenkampf J, Pröll T, Hofbauer H. Operating experience with chemical looping combustion in a 120 476 kW dual circulating fluidized bed (DCFB) unit. Int J Greenh Gas Control. 2010;4(2):180-5. 477 [17] Kolbitsch P, Pröll T, Bolhar-Nordenkampf J, Hofbauer H. Design of a Chemical Looping Combustor using a Dual Circulating 478 Fluidized Bed (DCFB) Reactor System. Chem Eng Technol. 2009;32(3):398-403. 479 [18] Chen CC, Mathias PM. Applied thermodynamics for process modeling. AlChE J. 2002;48(2):194-200. 480 [19] Khojasteh Salkuyeh Y, Adams II TA. Combining coal gasification, natural gas reforming, and external carbonless heat for 481 efficient production of gasoline and diesel with CO2 capture and sequestration. Energy Convers Manage. 2013;74(0):492-504. 482 [20] Khojasteh Salkuyeh Y, Adams II TA. A new power, methanol, and DME polygeneration process using integrated chemical 483 looping systems. Energy Convers Manage. 2014;88(0):411-25. 484 [21] Bullin K, Krouskop P. Composition Variety Complicates Processing Plans for U.S. Shale Gas. Bryan, TX, USA2009. 485 [22] Methanol Industrial Grade, Available online: http://www.alibaba.com/product-detail/2012-Methanol-99-5-_551002733.html, 486 (accessed on 01/06/2014). 487 [23] DiMethyl Ether, Available online: http://www.alibaba.com/product-detail/DiMethyl-Ether_1659793013.html, (accessed on 488 01/06/2014). 489 [24] Propylene, Polymer Grade, Available online: http://www.dow.com/productsafety/finder/pro.htm, (accessed on 01/06/2014). 490 [25] Ethylene, Polymer Purity, Available online: https://www.mathesongas.com/pdfs/products/Ethylene-Pure-Gas.pdf, (accessed 491 on 01/06/2014). 492 [26] Wauquier J. Petroleum Refining, Vol. 1: Crude Oil, Petroleum Products, Process Flowsheets. Editions Technip, Paris; 1995. 493 [27] Adams II TA, Barton PI. High-Efficiency Power Production from Coal with Carbon Capture. AlChE J. 2010;56(12):3120-36. 494 [28] Adams II TA, Khojestah Salkuyeh Y, Nease J. Chapter 6 - Processes and simulations for solvent-based CO2 capture and syngas 495 cleanup. In: Shi F, editor. Reactor and Process Design in Sustainable Energy Technology. Amsterdam: Elsevier; 2014. p. 163-231. 496 [29] Barrere-Tricca C, Smith D, Margotin J. Thirty years of operating experience with the Clauspol process. Oil & Gas Science 497 and Technology. 2001;56(2):199-206. 498 [30] Leckel D, Liwanga-Ehumbu M. Diesel-Selective Hydrocracking of an Iron-Based Fischer−Tropsch Wax Fraction (C15−C45) 499 Using a MoO3-Modified Noble Metal Catalyst. Energy & Fuels. 2006;20(6):2330-6. 500 [31] Vanden bussche KM, Froment GF. A steady-state kinetic model for methanol synthesis and the water gas shift reaction on a 501 commercial Cu/ZnO/Al2O3 catalyst. J Catal. 1996;161(1):1-10. 502 [32] Bercic G, Levec J. Catalytic dehydration of methanol to dimethyl ether. Kinetic investigation and reactor simulation. Ind Eng 503 Chem Res. 1993;32(11):2478-84. 504 [33] Diep BT, Wainwright MS. Thermodynamic equilibrium constants for the methanol-dimethyl ether-water system. Journal of 505 Chemical & Engineering Data. 1987;32(3):330-3. 506 [34] Ren T, Patel MK, Blok K. Steam cracking and methane to olefins: Energy use, CO2 emissions and production costs. Energy. 507 2008;33(5):817-33. 508 [35] Chen JQ, Bozzano A, Glover B, Fuglerud T, Kvisle S. Recent advancements in ethylene and propylene production using the 509 UOP/Hydro MTO process. Catal Today. 2005;106(1–4):103-7. 510 [36] Wilson S, Barger P. The characteristics of SAPO-34 which influence the conversion of methanol to light olefins. Microporous 511 Mesoporous Mater. 1999;29(1–2):117-26. 512
[37] Khojasteh Salkuyeh Y, Adams II TA. Co-Production of Olefins, Fuels, and Electricity from Conventional Pipeline Gas and 513 Shale Gas with Near-Zero CO2 Emissions. Part I: Process Development and Technical Performance. Energies. 2015;8(5):3739-61. 514 [38] Khojasteh Salkuyeh Y, Adams II TA. Co-Production of Olefins, Fuels, and Electricity from Conventional Pipeline Gas and 515 Shale Gas with Near-Zero CO2 Emissions. Part II: Economic Performance. Energies. 2015;8(5):3762-74. 516 [39] Abu-Zahra MRM, Niederer JPM, Feron PHM, Versteeg GF. CO2 capture from power plants: Part II. A parametric study of 517 the economical performance based on mono-ethanolamine. Int J Greenh Gas Control. 2007;1(2):135-42. 518 [40] Tan Y, Douglas MA, Thambimuthu KV. CO2 capture using oxygen enhanced combustion strategies for natural gas power 519 plants. Fuel. 2002;81(8):1007-16. 520 [41] Moghtaderi B. Review of the Recent Chemical Looping Process Developments for Novel Energy and Fuel Applications. 521 Energy Fuels. 2011;26(1):15-40. 522 [42] Haslbeck JL, Kuehn NJ, Lewis EG, Pinkerton LL, Simpson J, Turner MJ, et al. Cost and Performance Baseline for Fossil 523 Energy Plants Volume 1: Bituminous Coal and Natural Gas to Electricity, DOE. Pittsburgh, PA, USA: U.S. Department of Energy; 524 2010. 525 [43] Illinois Basin coal, average wholesale price; Aug 2014. http://www.eia.gov/coal/news_markets/. 526 [44] Henry hub spot, average wholesale price; Available online: http://www.eia.gov/electricity/wholesale/, (accessed on 527 01/08/2014). 528 [45] Nickel Monoxide, CAS No.: 1313-99-1, Available online: http://www.alibaba.com/product-529 gs/747545915/Factory_direct_sales_with_reasonable_price.html, (accessed on 01/08/2014). 530 [46] Adanez J, Abad A, Garcia-Labiano F, Gayan P, de Diego LF. Progress in Chemical-Looping Combustion and Reforming 531 technologies. Prog Energy Combust Sci. 2012;38(2):215-82. 532 [47] Factory price of Iron Oxide (Fe2O3), CAS No.: 1309-37-1. Available online: http://wwwalibabacom/product-detail/factory-533 price-of-iron-oxide-fe2o3-_814503142html?s=p, (accessed 01/08/2014). 534 [48] Fan LS. Chemical Looping Systems For Fossil Energy Conversions. Hoboken, NJ, USA: John Wiley & Sons, Inc., , 2010. 535 [49] Electricity wholesale price, Average 2014. Available online: http://www.eia.gov/electricity/wholesale/, (acessed on 536 10/11/2014). 537 [50] Methanol Price, North America, October 2014, Available online: https://www.methanex.com/our-business/pricing, (accessed 538 on 26/10/2014). 539 [51] U.S. Regular Conventional Retail Gasoline Prices, 11/Nov/2014, http://www.eia.gov/petroleum/gasdiesel/. 540 [52] Kerosene-Type Jet Fuel, U.S. Gulf Coast, 08/Nov/2014, http://www.eia.gov/dnav/pet/pet_pri_spt_s1_d.htm. 541 [53] U.S. On-Highway Diesel Fuel Prices, 08/Nov/2014, http://www.eia.gov/petroleum/gasdiesel/. 542 [54] Platts Global Propylene Price Index, August 2014, Available online: http://www.platts.com/news-543 feature/2014/petrochemicals/pgpi/propylene, (accessed on 01/11/2014). 544 [55] Platts Global Ethylene Price Index, August 2014, Available online: http://www.platts.com/news-545 feature/2014/petrochemicals/pgpi/ethylene, (accessed on 01/11/2014). 546 [56] M. S. Peters, Timmerhaus KD. Plant Design and Economics for Chemical Engineers. 4th ed. New York, NY, United States: 547 McGraw-Hill, 1991. 548 [57] CEPCI. Chemical Engineering Plant Cost Index. Chem Eng. May 2014;121(9):80. 549 [58] Parsopoulos KE, Vrahatis MN. Particle Swarm Optimization and Intelligence: Advances and Applications. Hershey, PA, USA: 550 IGI Global, 2010. 551
552