article+massaferri+et+al.,+2015
DESCRIPTION
Artigo CientíficoTRANSCRIPT
Complimentary and personal copy for
This electronic reprint is provided for non- commercial and personal use only: this reprint may be forwarded to individual colleagues or may be used on the author’s homepage. This reprint is not provided for distribution in repositories, including social and scientific networks and platforms.
Publishing House and Copyright:© 2015 byGeorg Thieme Verlag KGRüdigerstraße 1470469 StuttgartISSN
Any further use only by permission of the Publishing House
www.thieme.com

IJSM/4616/16.5.2015/MPS Training & Testing
Massaferri R et al. Hemodynamic Responses and Perceived … Int J Sports Med
Hemodynamic Responses and Perceived Exertion During Continuous and Discontinuous Resistance Exercise
Authors R. Massaferri1, L. Matos-Santos2, P. Farinatti3, W. D. Monteiro2
Affiliations 1 Salgado de Oliveira University, PGCAF, Niterói, Brazil 2 Rio de Janeiro State University, IEFD, Rio de Janeiro, Brazil 3 School of Physical Education, Rio de Janeiro State University, Rio de Janeiro, Brazil
Introduction▼The hemodynamic responses during resistance exercises are influenced by mechanical compres-sion on blood vessels, which may cause a marked increase in blood pressure (BP), due to increased total peripheral resistance (TPR). The increase in BP and TPR might also elevate the cardiac output (Q), although only for a short period of time [7, 12]. For instance, values of BP as high as 480/350 mmHg have been reported during resistance exercise performed with large muscle mass and maximal intensity [12]. Hence it seems important to adopt strategies to reduce the potential increase of hemodynamic responses during resistance training sessions.One of the possible strategies that have been sug-gested to offset the increase in BP and heart rate (HR) during resistance exercise is to perform dis-continuous sets, by adding a brief interruption at the middle of a given set of repetitions, instead of performing it continuously [1, 5]. Baum et al. (2003) [1] suggested that the inclusion of pauses while performing resistance exercises would mitigate the hemodynamic responses by decreas-ing the mechanical compression on the blood
vessels and favoring the removal of local metabo-lites. Consequently, there would be a reduction of vascular resistance and afferent stimulus from the exercise pressor reflex, producing lower val-ues of BP at the end of a given set of repetitions vs. continuous sets.Based on this premise, different strategies to apply discontinuous sets have been investigated, such as splitting sets in 2 halves using pauses of 2–15 s [4, 5, 15], or interspersing pauses after each repetition [1]. While some studies have shown that cardiovascular responses might decrease at the end of discontinuous sets in com-parison to continuous sets [1, 4, 5], at least one study revealed that BP after multiple discontinu-ous sets could be even higher than continuous sets, therefore suggesting that the BP response to discontinuous or continuous sets might rely on the type of exercise [15]. Other issues that are still unclear and warrant additional research include the optimal pause to induce an attenua-tion of hemodynamic stress in different resist-ance exercises and the possible mechanisms underlying the hemodynamic responses in dis-continuous vs. continuous sets.
accepted after revision April 15, 2015
BibliographyDOI http://dx.doi.org/ 10.1055/s-0035-1549957 Published online: 2015 Int J Sports Med © Georg Thieme Verlag KG Stuttgart · New York ISSN 0172-4622
CorrespondenceDr. Walace David MonteiroRio de Janeiro State University IEFD Rua São Francisco Xavier 524 sala 8133, Bloco F Maracanã Rio de Janeiro, RJ Brazil 20550-013 Tel.: + 55/21/2334 0775 Fax: + 55/21/2334 0222 [email protected]
Key words●▶ muscle strength●▶ strength training●▶ photoplethysmography●▶ blood pressure●▶ borg scale
Abstract▼This study compared acute responses of systolic and diastolic blood pressure (SBP/DBP), cardiac output (Q), heart rate (HR), stroke volume (SV), total peripheral resistance (TPR) and rate of per-ceived exertion (RPE) during resistance exercise performed continuously and discontinuously. Hemodynamic responses and RPE were assessed in the last of 4 sets of 12 repetitions of the knee extension with load corresponding to 70 % of 12 repetition maximum, performed continuously (C) or discontinuously, with pauses of 5 s (D5) or 10 s (D10) interspersed in the middle of sets. The increase in SBP was higher for D10 (34.0 ± 8.4 %)
and D5 (34.1 ± 13.2 %) vs. C (19.8 ± 10.3 %; P < 0.001), while no difference was detected for DBP. Q (P = 0.03) and SV (P = 0.02) were higher, but HR was lower (P = 0.04) in discontinuous vs. contin-uous. TPR remained stable during continuous, but significant decreases occurred during the pauses in the discontinuous protocols (P < 0.001). The BP was higher in discontinuous than in con-tinuous protocols, but the RPE was attenuated in discontinuous compared to continuous exercise. In conclusion, hemodynamic responses were exacerbated during resistance exercise per-formed discontinuously, but the perceived exer-tion was lowered.

IJSM/4616/16.5.2015/MPSTraining & Testing
Massaferri R et al. Hemodynamic Responses and Perceived … Int J Sports Med
Another potential effect of applying discontinuous instead of continuous sets would be the delay of peripheral fatigue due to metabolite removal, which could attenuate the rate of perceived exertion (RPE) at the end of resistance exercise sessions [4]. This effect would be evidently important in terms of exercise pre-scription, particularly in untrained or frail populations, but additional research is necessary to confirm preliminary evidence in this regard.Since there is a lack of studies comparing the hemodynamic responses and RPE in resistance exercises performed continu-ously or discontinuously, the present study aimed to compare the responses of HR, BP, TPR, stroke volume (SV) and Q during continuous and discontinuous sets of an isotonic resistance exercise. Additionally, the RPE at the end of multiple sets per-formed continuously or discontinuously was assessed. It has been hypothesized that the hemodynamic responses and RPE would be attenuated in discontinuous vs. continuous resistance exercise protocols.
Methods▼Participants11 healthy young men participated in the study [mean ± SD: 24 ± 3 years, 175 ± 5 cm, 75 ± 8 kg, systolic and diastolic BP (SBP/DBP) 117 ± 3 and 70 ± 9 mmHg, respectively]. All participants had a minimum experience of 6 months in resistance training, including the exercise applied in this study [21]. The following exclusion criteria were adopted: a) participation in athletic com-petitive training; b) use of any medication or substances with potential cardiovascular effect at rest and during exercise; c) musculoskeletal problems that could preclude the exercise performance; d) history or presence of cardiovascular disease or hypertension; e) positive score on the Physical Activity Readi-ness Questionnaire (PAR-Q). The study was performed in accord-ance with the ethical standards required by the journal [8], all participants signed informed consent, and the study was approved by the Institutional Ethics Committee of Salgado de Oliveira University, Rio de Janeiro, Brazil (44/2012).
Study designThe subjects were recommended to avoid drinking coffee or alcoholic beverages, or performing any kind of physical exercise 24 h prior to the experimental sessions. Data collection was con-ducted over 5 visits separated by 48- to 72-h intervals and always at the same time of day, from 10 to 11 a.m. On the first visit, subjects signed the informed consent form, answered questions related to the anamnesis and PAR-Q, performed the anthropometric measurements and 12 repetition maximum (RM) test-retest for the exercise included in the protocol.On the third, fourth and fifth visits, the participants underwent the resistance exercise sessions in a counterbalanced random order as follows: 1) exercise performed continuously (C); 2) exer-cise performed discontinuously, with 5-s (D5) pause between the sixth and seventh repetitions; 3) exercise performed discontinu-ously, with 10-s (D10) pause between the sixth and seventh rep-etitions. All protocols included 4 sets of 12 repetitions with 70 % of the load corresponding to12 RM, and 2-min intervals between sets. In order to compare the hemodynamic responses and RPE, and considering that the number of sets seem to have a cumula-tive effect upon BP [7], only the last set (fourth) was considered in each situation. The bilateral knee extension was performed
using a TechnogymTM knee extension machine (Gambetolla, Italy).
12 repetition maximum test (12 RM)After receiving detailed and standardized instructions about the test procedures, the volunteers performed a warm-up of 15 rep-etitions with a comfortable load. The exercise was performed as follows: 1) start position (knees flexed at 90 degrees); 2) end position (knees completely extended). The cadence of move-ment was set by a metronome in order to standardize the time under muscle tension in all experimental situations (2 s per rep-etition – 1 s for each concentric and eccentric phase). A maxi-mum of 4 sets was allowed to obtain the 12 RM load, with a 5 min interval between sets. In the event that the load corre-sponding to 12 RM was not determined within 4 trials, the test was repeated on another visit at least 48 h later. The test-retest reproducibility of the 12 RM load was verified within 48 to 72 h after the first determination (ICC = 0.92).
Hemodynamic assessment and rating of perceived exertion (RPE)The BP at rest was measured by an automatic sphygmomanom-eter (OnromTM, Matsusaka, Japan). Upon arrival at the labora-tory, the subjects remained seated in a quiet environment for 10 min. After this, 3 sequential measurements of BP were obtained with 2 min intervals and the average value was recorded as BP at rest. Before each exercise session the BP at rest was checked using the same device, to assure that pre-exercise values were similar across conditions and consistent with the BP at rest previously determined.Beat-to-beat blood pressure during exercise was measured using finger photoplethysmography (FinometerTM, Finapres Medical Systems BV, Arnhem, the Netherlands) obtained from the mid-dle finger of the left hand. The finger was supported at the level of the right atrium by a sling, and the hip was stabilized through a belt to prevent any unwanted movement that could jeopardize the physiological sign. Subjects were instructed not to perform any muscle contraction with the left lower limb and to avoid the Valsalva maneuver, exhaling during the concentric phase and inhaling in the eccentric phase of the movement. The stroke vol-ume (SV) was calculated offline using a Modelflow offered by the BeatScope software, version 1.0 (TNO Biomedical Instrumenta-tionTM, Amsterdam, The Netherlands), which computed aortic blood flow from arterial pressure wave by simulating a nonlin-ear, time-varying, 3-element model of aortic input impedance [25]. This methodology has been shown to reliably estimate rapid changes in CO during a variety of experimental protocols [14, 23], including both dynamic [23] and resistance exercise [24]. In our lab, the operator reliability has been calculated and was considered satisfactory (ICC = 0.84). The Q was estimated by the product between SV and HR, while the TPR was calculated as the ratio between the mean arterial pressure (MAP) and Q.Changes in mean arterial pressure measured by photoplethys-mography are not different from direct arterial blood pressure measurements both at rest and during exercise [10, 22]. How-ever, finger photoplethysmography may slightly overestimate SBP and underestimate DBP vs. intrabrachial [9] and ausculta-tion [16] methods. Therefore prior to data assessment the BP values at rest provided by the Finometer were checked against automatic sphygmomanometer (OnromTM, Matsusaka, Japan). The tests were initiated only when the difference between BP assessed by both methods was lower than 5 %. Data assessed by
IJSM/4616/16.5.2015/MPS Training & Testing
Massaferri R et al. Hemodynamic Responses and Perceived … Int J Sports Med
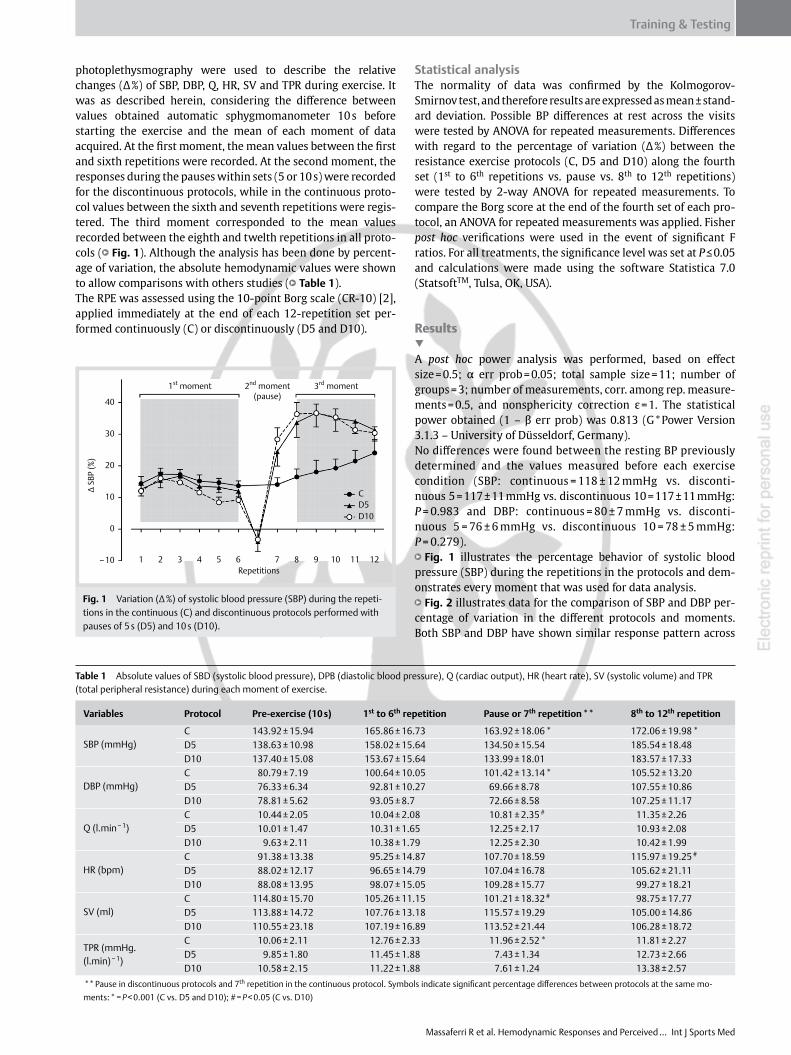
photoplethysmography were used to describe the relative changes (Δ %) of SBP, DBP, Q, HR, SV and TPR during exercise. It was as described herein, considering the difference between values obtained automatic sphygmomanometer 10 s before starting the exercise and the mean of each moment of data acquired. At the first moment, the mean values between the first and sixth repetitions were recorded. At the second moment, the responses during the pauses within sets (5 or 10 s) were recorded for the discontinuous protocols, while in the continuous proto-col values between the sixth and seventh repetitions were regis-tered. The third moment corresponded to the mean values recorded between the eighth and twelth repetitions in all proto-cols ( ●▶ Fig. 1). Although the analysis has been done by percent-age of variation, the absolute hemodynamic values were shown to allow comparisons with others studies ( ●▶ Table1).The RPE was assessed using the 10-point Borg scale (CR-10) [2], applied immediately at the end of each 12-repetition set per-formed continuously (C) or discontinuously (D5 and D10).
StatisticalanalysisThe normality of data was confirmed by the Kolmogorov-Smirnov test, and therefore results are expressed as mean ± stand-ard deviation. Possible BP differences at rest across the visits were tested by ANOVA for repeated measurements. Differences with regard to the percentage of variation (Δ %) between the resistance exercise protocols (C, D5 and D10) along the fourth set (1st to 6th repetitions vs. pause vs. 8th to 12th repetitions) were tested by 2-way ANOVA for repeated measurements. To compare the Borg score at the end of the fourth set of each pro-tocol, an ANOVA for repeated measurements was applied. Fisher post hoc verifications were used in the event of significant F ratios. For all treatments, the significance level was set at P ≤ 0.05 and calculations were made using the software Statistica 7.0 (StatsoftTM, Tulsa, OK, USA).
Results▼A post hoc power analysis was performed, based on effect size = 0.5; α err prob = 0.05; total sample size = 11; number of groups = 3; number of measurements, corr. among rep. measure-ments = 0.5, and nonsphericity correction ε = 1. The statistical power obtained (1 – β err prob) was 0.813 (G * Power Version 3.1.3 – University of Düsseldorf, Germany).No differences were found between the resting BP previously determined and the values measured before each exercise condition (SBP: continuous = 118 ± 12 mmHg vs. disconti-nuous 5 = 117 ± 11 mmHg vs. discontinuous 10 = 117 ± 11 mmHg: P = 0.983 and DBP: continuous = 80 ± 7 mmHg vs. disconti-nuous 5 = 76 ± 6 mmHg vs. discontinuous 10 = 78 ± 5 mmHg: P = 0.279). ●▶ Fig. 1 illustrates the percentage behavior of systolic blood pressure (SBP) during the repetitions in the protocols and dem-onstrates every moment that was used for data analysis. ●▶ Fig. 2 illustrates data for the comparison of SBP and DBP per-centage of variation in the different protocols and moments. Both SBP and DBP have shown similar response pattern across
Table1 Absolute values of SBD (systolic blood pressure), DPB (diastolic blood pressure), Q (cardiac output), HR (heart rate), SV (systolic volume) and TPR (total peripheral resistance) during each moment of exercise.
Variables Protocol Pre-exercise (10 s) 1st to 6th repetition Pause or 7th repetition ** 8th to 12th repetition
SBP (mmHg)C 143.92 ± 15.94 165.86 ± 16.73 163.92 ± 18.06 * 172.06 ± 19.98 * D5 138.63 ± 10.98 158.02 ± 15.64 134.50 ± 15.54 185.54 ± 18.48D10 137.40 ± 15.08 153.67 ± 15.64 133.99 ± 18.01 183.57 ± 17.33
DBP (mmHg)C 80.79 ± 7.19 100.64 ± 10.05 101.42 ± 13.14 * 105.52 ± 13.20D5 76.33 ± 6.34 92.81 ± 10.27 69.66 ± 8.78 107.55 ± 10.86D10 78.81 ± 5.62 93.05 ± 8.7 72.66 ± 8.58 107.25 ± 11.17
Q (l.min − 1)C 10.44 ± 2.05 10.04 ± 2.08 10.81 ± 2.35 # 11.35 ± 2.26D5 10.01 ± 1.47 10.31 ± 1.65 12.25 ± 2.17 10.93 ± 2.08D10 9.63 ± 2.11 10.38 ± 1.79 12.25 ± 2.30 10.42 ± 1.99
HR (bpm)C 91.38 ± 13.38 95.25 ± 14.87 107.70 ± 18.59 115.97 ± 19.25 #
D5 88.02 ± 12.17 96.65 ± 14.79 107.04 ± 16.78 105.62 ± 21.11D10 88.08 ± 13.95 98.07 ± 15.05 109.28 ± 15.77 99.27 ± 18.21
SV (ml)C 114.80 ± 15.70 105.26 ± 11.15 101.21 ± 18.32 # 98.75 ± 17.77D5 113.88 ± 14.72 107.76 ± 13.18 115.57 ± 19.29 105.00 ± 14.86D10 110.55 ± 23.18 107.19 ± 16.89 113.52 ± 21.44 106.28 ± 18.72
TPR (mmHg.(l.min) − 1)
C 10.06 ± 2.11 12.76 ± 2.33 11.96 ± 2.52 * 11.81 ± 2.27D5 9.85 ± 1.80 11.45 ± 1.88 7.43 ± 1.34 12.73 ± 2.66D10 10.58 ± 2.15 11.22 ± 1.88 7.61 ± 1.24 13.38 ± 2.57
** Pause in discontinuous protocols and 7th repetition in the continuous protocol. Symbols indicate significant percentage differences between protocols at the same mo-ments: * = P < 0.001 (C vs. D5 and D10); # = P < 0.05 (C vs. D10)
Fig. 1 Variation (Δ %) of systolic blood pressure (SBP) during the repeti-tions in the continuous (C) and discontinuous protocols performed with pauses of 5 s (D5) and 10 s (D10).
1st moment 2nd moment(pause)
3rd moment
Repetitions1 2 3 4 5 6 7 8 9 10 11 12
CD5D10
Δ SB
P (%
)
40
30
20
10
0
–10

IJSM/4616/16.5.2015/MPSTraining & Testing
Massaferri R et al. Hemodynamic Responses and Perceived … Int J Sports Med
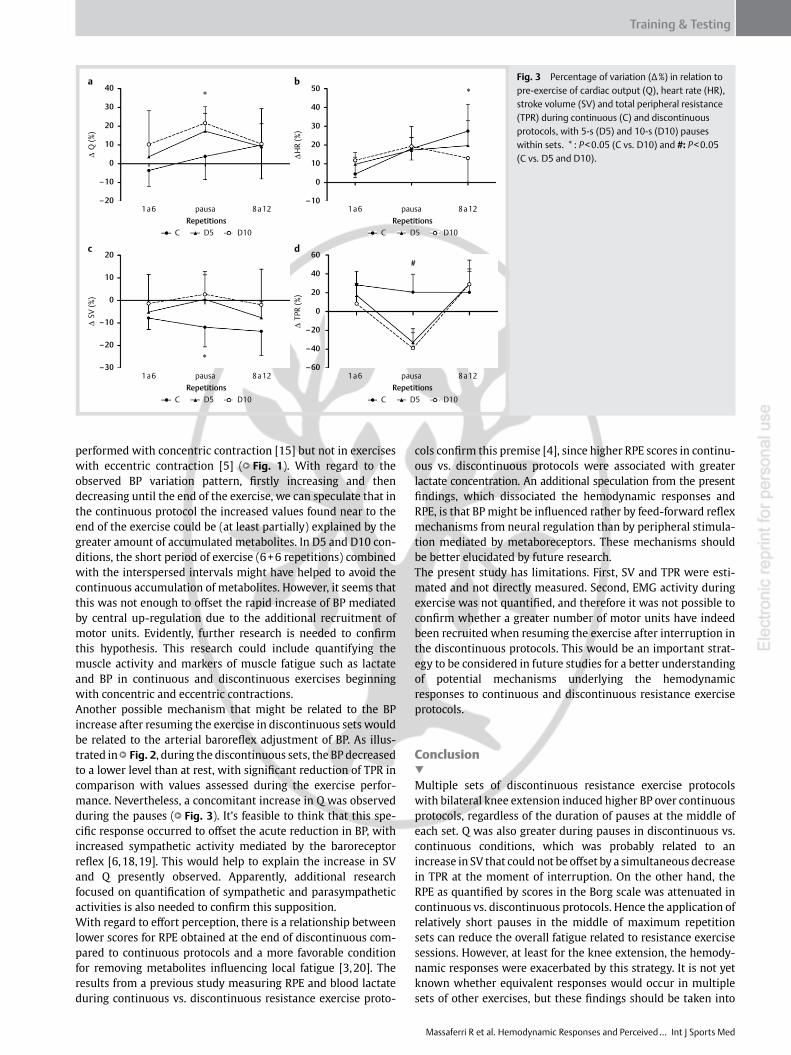
the protocols. At the first moment (1st to 6th repetitions – ●▶ Fig. 1) there was no difference between the 3 protocols. At the second moment (pause in D5 and D10, or 7th repetition in C – ●▶ Fig. 1), SBP and DBP was lower in D5 and D10 vs. C (SBP: C = 14.0 ± 7.0 % vs. D5 = − 3.9 ± 10.3 %; P = 0.001 and vs. D10 = − 3.2 ± 9.7 %; P = 0.001; and DBP: C = 25.4 ± 11.2 % vs. D5 = − 10.3 ± 8.7 %; P < 0.001 and vs. D10 = − 9.4 ± 10.7 %; P < 0.001). At the third moment (8th to 12th repetitions), the SBP increase was higher in D10 and D5 vs. C (C = 19.8 ± 10.3 % vs. D5 = 34.1 ± 13.2 %; P < 0.001 and vs. D10 = 34.0 ± 8.4 %; P < 0.001), while no difference between protocols was detected for DBP (C = 30.7 ± 14.0 % vs. D5 = 41.1 ± 10.7 %; P = 0.109 and vs. D10 = 36.0 ± 9.5 %; P = 0.409). ●▶ Fig. 3 depicts data for the percentage of variation of Q, HR, SV, and TPR in the different protocols. The Q was higher in discon-tinuous (during interspersed pauses) vs. continuous conditions (P < 0.05), which was probably due to a higher SV observed at the same time (P < 0.05). On the other hand, the HR tended to be higher in continuous vs. discontinuous protocols (P < 0.05) The TPR remained stable during the continuous exercise, but varied significantly along the discontinuous protocols, being lower dur-ing the pauses in comparison with values obtained during the sets (P < 0.05). ●▶ Table1 contains the absolute values of SBD, DPB, Q, HR, SV, and TPR during each moment of analysis.Finally, the RPE was lower in D10 vs. C (4.1 ± 1.0 vs. 5.8 ± 1.2; P = 0.006). No difference was found between D5 (5.09 ± 1.57) and C (5.8 ± 1.2; P = 0.20) or between D5 and D10 (4.1 ± 1.0; P = 0.11).
Discussion▼This study investigated the effect of performing multiple sets of resistance exercise continuously or discontinuously upon hemo-dynamic responses and RPE. It has been demonstrated that pauses lasting 5 or 10 s in the middle of sets performed with 70 % of 12RM load induced higher hemodynamic responses than con-tinuous protocols. On the other hand, the RPE at the end of these sets was higher after continuous vs. discontinuous sets. These data contradict our initial hypothesis claiming that the hemo-dynamic responses would be attenuated in discontinuous vs. continuous resistance exercise protocols. However, findings with regard to RPE support the premise that including a short pause in the middle of each set during multiple sets of a resist-ance exercise may reduce the effort perception and therefore the fatigue during resistance training sessions.Few studies have compared the effects of continuous vs. discon-tinuous resistance exercise protocols on hemodynamic responses, and their results are mixed and inconclusive. In 2 previous studi es, it has been suggested that hemodynamic responses would be different higher in continuous vs. discontinuous proto-
cols [1, 5], but at least one previous study concurred with our results [15]. Baum et al. [1] analyzed the BP and rate product pressure during the leg press performed intermittently and con-tinuously (1.5 s for concentric and eccentric phases, with 3 s pauses between each repetition) in protocols including 3 sets of 12, 10 and 8 repetitions with 50, 70 and 80 % of 1RM loads, respectively. At all intensities, the hemodynamic responses were higher when exercise was performed continuously. Silva et al. [5] assessed the effects of discontinuous and continuous proto-cols during the leg press and bench press performed with 3 sets of 10 repetitions with load corresponding to 10RM. Although the pauses between sets in the discontinuous protocol (5 and 15 s) have been quite similar to those adopted in the present study, in contrast to their results our data suggested that discon-tinuous exercise would be related to lower hemo dynamic responses.A previous study by our group [15] could not confirm these find-ings. Similar to the present data, it has been shown that both SBP and DBP were higher at the end of discontinuous over continu-ous sets performed with 8RM load (4 sets of 8 repetitions and 2 s pauses between the fourth and fifth repetitions). The exercise protocols applied by Polito et al. [15] were quite similar to the protocols used in this study – the hemodynamic responses were assessed during the knee extension performed continuously and with pauses applied at the middle of each set. However, the pauses presently applied were longer (5 and 10 s) than in the study by Polito et al. [15] (only 2 s). It can be therefore claimed that, at least for the knee extension exercise, pauses from 2 to 10 s do not minimize the hemodynamic responses in compari-son with continuous protocols.Considering the type of exercises investigated by the studies reporting lower hemodynamic responses in discontinuous vs. continuous protocols, and those that did not concur with those findings, it can be speculated that the type of muscle contraction applied at the beginning of the exercises might have a determi-nant role. For instance, Silva et al. (2010) and Baum et al. (2003) [5] used exercises which started with eccentric muscle contrac-tion, while in the present and in Polito’s [15] studies, the exer-cise began with the concentric phase. The rationale for such a hypothesis relies on the fact that, at the beginning of exercises performed with concentric contraction, it is necessary to move the load against gravity to overcome inertia with additional recruitment of motor units [11, 13, 17], which could probably lead to an up-regulated and centrally mediated increase in BP [26, 27]. On the other hand, when beginning the exercise with eccentric contraction, the movement is not performed against gravity and the number of recruited motor units would not be influenced by inertia [11, 13, 17]. This may help to explain why the increased hemodynamic responses, particularly BP, would be greater after the pauses in the middle of each set in exercises
Fig. 2 Percentage of variation (Δ %) in relation to pre-exercise of systolic blood pressure (SBP) and diastolic blood pressure (DBP) in the 3 analyzed moments (1st to 6th, pause, and 8th to 12th repeti-tions) during continuous (C), and discontinuous protocols performed with pauses of 5 s (D5) and 10 s (D10) within sets. * : P < 0.001: C vs. D5 and D10.
Repetitions1 to 6
Δ SB
P (%
)
Δ D
BP (%
)
pause 8 to 12 1 to 6 pause 8 to 12
50
40
30
20
10
0
–10
–20Repetitions
50
60
40
30
20
10
0
–10
–20
*
*
*
CD5D10
CD5D10
a b
IJSM/4616/16.5.2015/MPS Training & Testing
Massaferri R et al. Hemodynamic Responses and Perceived … Int J Sports Med
performed with concentric contraction [15] but not in exercises with eccentric contraction [5] ( ●▶ Fig. 1). With regard to the observed BP variation pattern, firstly increasing and then decreasing until the end of the exercise, we can speculate that in the continuous protocol the increased values found near to the end of the exercise could be (at least partially) explained by the greater amount of accumulated metabolites. In D5 and D10 con-ditions, the short period of exercise (6 + 6 repetitions) combined with the interspersed intervals might have helped to avoid the continuous accumulation of metabolites. However, it seems that this was not enough to offset the rapid increase of BP mediated by central up-regulation due to the additional recruitment of motor units. Evidently, further research is needed to confirm this hypothesis. This research could include quantifying the muscle activity and markers of muscle fatigue such as lactate and BP in continuous and discontinuous exercises beginning with concentric and eccentric contractions.Another possible mechanism that might be related to the BP increase after resuming the exercise in discontinuous sets would be related to the arterial baroreflex adjustment of BP. As illus-trated in ●▶ Fig. 2, during the discontinuous sets, the BP decreased to a lower level than at rest, with significant reduction of TPR in comparison with values assessed during the exercise perfor-mance. Nevertheless, a concomitant increase in Q was observed during the pauses ( ●▶ Fig. 3). It’s feasible to think that this spe-cific response occurred to offset the acute reduction in BP, with increased sympathetic activity mediated by the baroreceptor reflex [6, 18, 19]. This would help to explain the increase in SV and Q presently observed. Apparently, additional research focused on quantification of sympathetic and parasympathetic activities is also needed to confirm this supposition.With regard to effort perception, there is a relationship between lower scores for RPE obtained at the end of discontinuous com-pared to continuous protocols and a more favorable condition for removing metabolites influencing local fatigue [3, 20]. The results from a previous study measuring RPE and blood lactate during continuous vs. discontinuous resistance exercise proto-
cols confirm this premise [4], since higher RPE scores in continu-ous vs. discontinuous protocols were associated with greater lactate concentration. An additional speculation from the present findings, which dissociated the hemodynamic responses and RPE, is that BP might be influenced rather by feed-forward reflex mechanisms from neural regulation than by peripheral stimula-tion mediated by metaboreceptors. These mechanisms should be better elucidated by future research.The present study has limitations. First, SV and TPR were esti-mated and not directly measured. Second, EMG activity during exercise was not quantified, and therefore it was not possible to confirm whether a greater number of motor units have indeed been recruited when resuming the exercise after interruption in the discontinuous protocols. This would be an important strat-egy to be considered in future studies for a better understanding of potential mechanisms underlying the hemodynamic responses to continuous and discontinuous resistance exercise protocols.
Conclusion▼Multiple sets of discontinuous resistance exercise protocols with bilateral knee extension induced higher BP over continuous protocols, regardless of the duration of pauses at the middle of each set. Q was also greater during pauses in discontinuous vs. continuous conditions, which was probably related to an increase in SV that could not be offset by a simultaneous decrease in TPR at the moment of interruption. On the other hand, the RPE as quantified by scores in the Borg scale was attenuated in continuous vs. discontinuous protocols. Hence the application of relatively short pauses in the middle of maximum repetition sets can reduce the overall fatigue related to resistance exercise sessions. However, at least for the knee extension, the hemody-namic responses were exacerbated by this strategy. It is not yet known whether equivalent responses would occur in multiple sets of other exercises, but these findings should be taken into
Fig. 3 Percentage of variation (Δ %) in relation to pre-exercise of cardiac output (Q), heart rate (HR), stroke volume (SV) and total peripheral resistance (TPR) during continuous (C) and discontinuous protocols, with 5-s (D5) and 10-s (D10) pauses within sets. * : P < 0.05 (C vs. D10) and #: P < 0.05 (C vs. D5 and D10).
50
40
30
20
10
–10
0
*
*
#
*
–20
–30
–10
20
10
0
–20
–40
–60
0
60
40
20
1a6 8a12pausaRepetitions Repetitions
∆H
R (%
)
∆ Q
(%)
∆ S
V (%
)
∆ T
PR (%
)
1a6 8a12pausa
40
c
a b
d
30
20
10
–10
–20
0
C D5 D10
1a6 8a12pausaRepetitions
C D5 D10
C D5 D10
Repetitions1a6 8a12pausa
C D5 D10

IJSM/4616/16.5.2015/MPSTraining & Testing
Massaferri R et al. Hemodynamic Responses and Perceived … Int J Sports Med
account when prescribing resistance training sessions to popu-lations with cardiovascular risk.
Acknowledgements▼This study was partially supported by the Carlos Chagas Filho Foundation for the Research Support in Rio de Janeiro and by the Brazilian Council for the Research Development.
Conflictofinterest: The authors declare that there is no conflict of interests.
References1 Baum K, Ruther T, Essfeld D. Reduction of blood pressure response
during strength training through intermittent muscle relaxations. Int J Sports Med 2003; 24: 441–445
2 Borg GAV. Psychophysical bases of perceived exertion. Med Sci Sports Exerc 1982; 14: 377–381
3 Chen MJ, Fan X, Moe ST. Criterion-related validity of the Borg ratings of perceived exertion scale in healthy individuals: a meta-analysis. J Sports Sci 2002; 20: 873–899
4 Coelho CW, Hamar D, De Araújo CGS. Physiological responses using 2 high-speed resistance training protocols. J Strength Cond Res 2003; 17: 334–337
5 da Silva RP, da Silva Novaes J, de Oliveira RJ, de Jesus Camilo F, Marques MFB. Respostas cardiovasculares agudas de três protocolos de exer-cício resistido em idosas. Rev Bras Cineantropom Desempenho Hum 2010; 12: 112–119
6 De Hert S. Physiology of hemodynamic homeostasis. Best Pract Res Clin Anaesthesiol 2012; 26: 409–419
7 Gotshall R, Gootman J, Byrnes W, Fleck S, Valovich T. Noninvasive char-acterization of the blood pressure response to the double-leg press exercise. J Exerc Physiol Online 1999; 2: 1–6
8 Harriss DJ, Atkinson G. Ethical standards in sport and exercise science research: 2014 update. Int J Sports Med 2013; 34: 1025–1028
9 Idema RN, van den Meiracker AH, Imholz B, Settels J, Ritsema VEH, Schalekamp M. Comparison of Finapres non-invasive beat-to-beat fin-ger blood pressure with intrabrachial artery pressure during and after bicycle ergometry. J Hypertens Suppl 1989; 7: S58–S59
10 Imholz B. Automated blood pressure measurement during ergometric stress testing: possibilities of Finapres. Z Kardiol 1995; 85: 76–80
11 Kallio J, Søgaard K, Avela J, Komi PV, Selänne H, Linnamo V. Motor unit firing behaviour of soleus muscle in isometric and dynamic contrac-tions. PloS One 2013; 8: e53425
12 MacDougall J, Tuxen D, Sale D, Moroz J, Sutton J. Arterial blood pres-sure response to heavy resistance exercise. J Appl Physiol 1985; 58: 785–790
13 Moritani T, Muramatsu S, Muro M. Activity of Motor Units during Concentric and Eccentric Contractions. Am J Phys Med Rehabil 1987; 66: 338–350
14 Nissen P, Van Lieshout JJ, Novovic S, Bundgaard-Nielsen M, Secher NH. Techniques of cardiac output measurement during liver transplanta-tion: arterial pulse wave versus thermodilution. Liver Transpl 2009; 15: 287–291
15 Polito M, Simão R, Lira V, Nóbrega A, Farinatti P. Série fracionada da extensão de joelho proporciona maiores respostas cardiovasculares que séries contínuas. Arq Bras Cardiol 2008; 90: 382–387
16 Polito MD, Farinatti PT, Lira VA, Nobrega AC. Blood pressure assess-ment during resistance exercise: comparison between auscultation and Finapres. Blood Press Monit 2007; 12: 81–86
17 Qi L, Wakeling JM, Ferguson-Pell M. Spectral properties of electromyo-graphic and mechanomyographic signals during dynamic concentric and eccentric contractions of the human biceps brachii muscle. J Elec-tromyogr Kinesiol 2011; 21: 1056–1063
18 Raven PB, Fadel PJ, Smith SA. The influence of central command on baroreflex resetting during exercise. Exerc Sport Sci Rev 2002; 30: 39–44
19 Robinson BF, Epstein SE, Beiser GD, Braunwald E. Control of Heart Rate by the Autonomic Nervous System Studies in Man on the Interrela-tion between Baroreceptor Mechanisms and Exercise. Circ Res 1966; 19: 400–411
20 Scherr J, Wolfarth B, Christle JW, Pressler A, Wagenpfeil S, Halle M. Asso-ciations between Borg’s rating of perceived exertion and physiological measures of exercise intensity. Eur J Appl Physiol 2013; 113: 147–155
21 Shephard RJ. PAR-Q, Canadian Home Fitness Test and exercise screen-ing alternatives. Sports Med 1988; 5: 185–195
22 Shi X, Crandall CG, Potts JT, Williamson J, Foresman BH, Raven PB. A diminished aortic-cardiac reflex during hypotension in aerobically fit young men. Med Sci Sports Exerc 1993; 25: 1024–1030
23 Sugawara J, Tanabe T, Miyachi M, Yamamoto K, Takahashi K, Iemitsu M, Otsuki T, Homma S, Maeda S, Ajisaka R. Non invasive assessment of cardiac output during exercise in healthy young humans: comparison between Modelflow method and Doppler echocardiography method. Acta Physiol Scand 2003; 179: 361–366
24 Takahashi M, Sakaguchi A, Matsukawa K, Komine H, Kawaguchi K, Onari K. Cardiovascular control during voluntary static exercise in humans with tetraplegia. J Appl Physiol 2004; 97: 2077–2082
25 Wesseling K, Jansen J, Settels J, Schreuder J. Computation of aortic flow from pressure in humans using a nonlinear, three-element model. J Appl Physiol 1993; 74: 2566–2573
26 Williamson J, Fadel P, Mitchell J. New insights into central cardiovas-cular control during exercise in humans: a central command update. Exp Physiol 2006; 91: 51–58
27 Williamson J. The relevance of central command for the neural cardio-vascular control of exercise. Exp Physiol 2010; 95: 1043–1048