articulo 4 cooper basin vol 4 - 8
DESCRIPTION
sfbdfbfsgbdfTRANSCRIPT

INTRODUCTION
Although numerous commercial and non-commercialhydrocarbon discoveries have been made in the CooperBasin and overlying Eromanga Basin, the origin of the oilhas been the subject of considerable controversy with variedviews over an exclusive Cooper Basin source versus acombined Cooper and Eromanga Basins source. However,there appears to be a growing tide, particularly over the lastdecade, in favour of a mixed source. Recent studies byPowell et al. (1989), Michaelsen and McKirdy (1996), Ryan(1996) and Alexander et al. (1996) have providedconclusive evidence for an Eromanga Basin hydrocarbonsource in the southern Cooper Basin, South Australia.
This chapter draws on existing company andDepartmental data accessed from the Rock-Eval pyrolysismodule of the PEPS database, recent technical reportscommissioned by PIRSA (Alexander et al., 1996;Michaelsen et al., 1995) and results from the NationalGeoscience Mapping Accord (NGMA) Cooper andEromanga Basins Project. The data have been compiled toidentify potential and probable hydrocarbon source rocks,summarise the biomarker geochemistry for oils and sourcerocks, and establish genetic relationships between potentialsource rocks and hydrocarbon accumulations.
BACKGROUND
Cooper Basin
Numerous oil and gas fields in the Cooper Basin point tothe Permian containing effective source rocks. Oil andcondensate are typically medium to light (30–60° API) andparaffinic, with low to high wax contents. Most oil inPermian reservoirs contains significant dissolved gas andnone shows any evidence of water washing (Hunt et al.,1989). Gas composition is closely related to maturity withdepth, with drier gas occurring towards basin depocentres(Figs 8.1, 8.2) although there is strong geological control onhydrocarbon composition (Hunt et al., 1989). ThePatchawarra Trough contains the bulk of the oil and wet gasreserves, consistent with local source rocks being in the ‘oilwindow’ while the Nappamerri Trough is overmature andcontains mainly dry gas (Hunt et al., 1989).
Permian source rocks have average total organic content(TOC) and S2 pyrolysis yields of 3.9% and 6.9 kg ofhydrocarbon per tonne, respectively (excluding coal).Locally, the Toolachee Formation is the richest source unit.The Patchawarra Formation is considered the other majorsource unit (Jenkins, 1989), especially the lower beds of
shale and coal (Hunt et al., 1989). The lacustrine Murtereeand Roseneath Shales appear to have little source potential(Hunt et al., 1989). Permian non-marine clastics arecharacterised by inertinitic dispersed organic matter (DOM)with liptinite and vitrinite totalling <25% of the organicmatter. On the other hand, the coal units are low in liptiniteand contain subequal amounts of inertinite and vitrinite(Smyth, 1983). Sub-microscopic alginite dispersed withinthe inertinitic matrix of some Patchawarra coal has beensuggested as a novel source for oil (Taylor et al., 1988).
Together, the petrographic and geochemical evidencesupport coal and associated DOM as the effective source
129
SOURCE ROCK DISTRIBUTION
AND HYDROCARBON
GEOCHEMISTRYC.J. Boreham*
and A.J. Hill
Chapter 8
98-1295
0 50
141°
28°
27°
KILOMETRES
Data point
15
15
20
20
25
25
30
10
10
10
5
5
5
1
1
Contour values in % C /C2-4 1-4
margin ofToolachee Formation
Fig. 8.1 Toolachee Formation gas wetness (after Hunt et al., 1989,fig. 3).
* Petroleum and Marine Division, Australian Geological SurveyOrganisation

rocks capable of generating gas and minor oil, albeit in lowyields (Hunt et al., 1989). At maturity levels of 0.7–0.95%measured vitrinite reflectance (Ro), initial generation fromthe richer facies led to partial filling of reservoirs with wetgas and oil. There is a sharp onset of significanthydrocarbon accumulation as the source reaches a maturityof 0.95% Ro (Hunt et al., 1989). Faulting along anticlinaltrends or basin margin pinchouts can provide migrationpaths for Cooper Basin-derived hydrocarbons into youngerhorizons (Heath et al., 1989; Passmore, 1989).
Eromanga Basin
The origin of oil in the Eromanga Basin has beenattributed to a Cooper Basin source, an indigenous source ora mixture of both. Although it is recognised that BirkheadFormation and Murta Formation sources exist (Vincent etal., 1985, Alexander et al., 1988, 1992, 1996; Jenkins, 1989;Lowe-Young et al., 1996; Powell et al., 1989), there is stillconsiderable debate as to their extent and relativecontribution.
Potential source rocks of Jurassic and Early Cretaceousage contain Type II to Type III organic matter and have beenshown to have maturities within the ‘oil window’ (onset of
oil generation between vitrinite reflectance of 0.65 and0.7%; Kantsler et al., 1983; Passmore and Boreham, 1982,1986; Jenkins, 1989). Average TOC and pyrolysis yields areslightly lower for Eromanga Basin source rocks compared toPermian source rocks (Jenkins, 1989). However, theBirkhead Formation contains the most hydrogen-richorganic matter, has an average TOC of 2.5% and S2
pyrolysis yield of 10.8 kg/t. Birkhead Formation coal istypically vitrinite rich (>50%) and inertinite poor (<10%),while the DOM is commonly more liptinitic and inertinitic(Smyth et al., 1984). The Poolowanna Formation (formerlythe ‘basal Jurassic’ unit in Queensland) shows fair to goodsource richness; the Westbourne Formation exhibits mainlyfair source richness (Hawkins et al., 1989).
Hydrocarbon extracts of Jurassic potential source rocksare paraffinic and waxy, similar to those from Permiansediments. This lack of distinction probably reflects onlyminor changes in organic facies and/or maturation histories(Gilby and Mortimore, 1989) or, alternatively, reflects oilcontamination of Eromanga source rocks by migratingPermian hydrocarbons (Heath et al., 1989). However, usingage and source-specific Araucariacean conifer biomarkers,Alexander et al. (1988, 1992) proposed that Eromangahydrocarbons can have both a combination from a local andCooper Basin source or derive solely from the latter source.In addition, Jenkins (1989) suggested that the occurrence of25,28,30-trisnorhopane, 25,28,30-trisnormoretane and19-norisopimarane in an oil signifies an Eromanga sourceinput. Using these criteria, a maximum Eromanga sourcecontribution of 40% has been assigned to an individual pool(Jenkins, 1989) although an overall volumetric average of<20% can be attributable to an Eromanga source (Jenkins,1989; Lowe-Young et al., 1996).
But even this minor volumetric significance has beenquestioned by Tupper and Burckhardt (1990) since19-norisopimarane occurs in Permian source rocks (Jenkins,1989). Indeed, Heath et al. (1989) concluded a dominantPermian source for Jurassic oil and gas. Unlike CooperBasin hydrocarbons, the Eromanga Basin petroleum inJurassic reservoirs does not show regionally consistenttrends in hydrocarbon type, composition and maturation.These differences have been interpreted to indicatevariations in local source rock depositional environments(Vincent et al., 1985; Alexander et al., 1988; Powell et al.,1989). The alternative model proposes that migrationoccurs beyond the edge of the Permian and Triassic seals andinto the Eromanga aquifer system. Here, the physical andchemical properties of the Permian-sourced petroleum weresignificantly modified by pressure and temperature-inducedmigration fractionation and water washing (Heath et al.,1989).
Oil in Cretaceous reservoirs is often geochemicallydistinct from that in Jurassic reservoirs. It is typically light(45° API), non-waxy, low sulphur, paraffinic crude (Vincentet al., 1985) although waxy oil does occur (Michaelsen andMcKirdy, 1989; Powell et al., 1989). The Murta Formationoil is thought to be locally derived from Cretaceous sourcerocks (Vincent et al., 1985; Michaelsen and McKirdy, 1989;Powell et al., 1989). Pristane/phytane ratios (Pr/Ph = 5–9)are higher compared to those of greater reservoir age(Michaelsen and McKirdy, 1989). In addition, theCretaceous oil shows lower levels of maturation based on
130
Petroleum geology of South Australia. Vol. 4: Cooper Basin.
98-1296
0 50
141°
28°
27°
KILOMETRES
Data point
15
20
2530 35
25
30
10
5
Contour values in % molar volume
margin ofToolachee Formation
Fig. 8.2 Toolachee Formation CO2 content (after Hunt et al., 1989,fig. 4).

sterane isomers (Vincent et al., 1985; Powell et al., 1989;AGSO and GeoMark Research, in prep.) and theirmethylphenanthrene index (MPI-1) (Michaelsen andMcKirdy, 1989; Powell et al., 1989; Tupper and Burckhardt,1990). Michaelsen and McKirdy (1989) and Powell et al.(1989) suggested that a major bacterial overprint of theoriginal terrestrial organic matter has led to susceptibility toearly generation of hydrocarbons. Although this may wellbe the case, kinetic studies on petroleum generation frompotential Murta source rocks indicate that oil expulsionoccurs at higher maturity levels (see Ch. 9). Thisdiscrepancy may be reconciled with the known sourceinfluence on the content of 1-methylphenanthrene(Alexander et al., 1988, 1992) that will lower maturityestimates based on MPI-1. Furthermore, the resultspresented in Powell et al. (1989) show enough biomarkerdissimilarities between Murta oil and the potential Murtasource rocks to doubt whether a strong oil-to-sourcecorrelation has been demonstrated and the suggestion madeby these authors, that migration effects could be analternative explanation for the unusual chemistry of Murtaoil, is explored further in this chapter.
Cretaceous accumulations which show reducedproportions of gasoline-range hydrocarbons (C5–C10) andlow gas/oil ratios possibly reflect losses due to washing bymeteoric waters, albeit to a less intense degree compared toJurassic oil reservoirs (Vincent et al., 1985; Michaelsen andMcKirdy, 1989). The source for the Coorikiana Sandstonegas is less well studied, although a local Cretaceous source ishighly likely (McKirdy et al., 1986; Vincent et al., 1985).Alternatively, an origin from an altered Permian-sourcedpetroleum has also been suggested for Cretaceousreservoired hydrocarbons (Heath et al., 1989). The marineCretaceous sequence contains good potential source rocks,but it is considered immature for hydrocarbon generation(Moore and Pitt, 1984). Clearly, more work needs to bedone in order to distinguish local Eromanga Basin sourcing.
SOURCE ROCK DISTRIBUTION
Merrimelia Formation
Previous workers have concentrated on the source rockpotential of DOM and coal of the Patchawarra andToolachee Formations which represent the major sourceunits and, to a lesser extent, the Epsilon and DaralingieFormations rather than focusing on the MerrimeliaFormation and the Murteree and Roseneath Shales.
In the context of source quality and source richness of theGidgealpa Group, shale of the Merrimelia Formation ratespoorly. The formation is dominated by glaciogenicsandstone, siltstone and conglomerate with only minoramounts of mudstone, the last of which is organically lean.Thin, discontinuous coal lenses deposited as vegetated bartops represent the best source rocks of the formation(hydrogen index (HI) average = 159; range 94–203).However, these units are infrequent and have little impact onthe overall source quality.
Rock-Eval data from 13 wells (55 samples) are plotted inFigure 8.3 and selected Rock-Eval parameters for CooperBasin shale and coal are summarised in Tables 8.1 and 8.2,respectively.
Source richness of Merrimelia Formation shale isgenerally very good (TOC average = 2.1) but ranges frompoor to excellent (TOC = 0.03–9.9; S1+S2 = 0.3–19 kg ofhydrocarbon per tonne). Hydrogen indices are moderate(46–201) consistent with a Type III–IV gas-prone kerogen.Several wells have HI values >150, indicating potential forgas and minor light oil generation consistent with a TypeII/III to III kerogen (Snake Hole 1, HI = 201; TirrawarraWest 1, HI = 163; Tinga Tingana 1, HI = 165).
Patchawarra Formation
Coal and carbonaceous shale of the PatchawarraFormation represent the principal source rocks of the CooperBasin, both in source richness and quality, and overallthickness. Patchawarra Formation total coal thickness is>60 m in the Weena Trough and up to 40 m in thePatchawarra Trough (see Fig. 6.6) in contrast to theNappamerri Trough where total coal thickness rarelyexceeds 10 m. Rock-Eval data are summarised in Tables 8.1and 8.2, and plotted in Figure 8.4. Shale (<10% TOC) hasthe potential to generate oil (HI = 3–346; S1+S2 = 0.04–36.6kg hydrocarbon per tonne) and represents Type II/IIIkerogen, whilst carbonaceous shale and coal shale (10%<TOC <30%) and coal (TOC >30%) are capable of generatinglarge quantities of oil (S1+S2 = 2–182 kg hydrocarbon pertonne). In volumetric terms, the western PatchawarraTrough represents the most important kitchen where thickPatchawarra Formation shale and coal lie within thepresent-day oil window.
HI values >250 indicating good (Type II/III kerogen) tovery good oil source potential (Type II kerogen) are found inAndree 2, Kurunda 1, Tibouchina 1, Snake Hole 1,Murteree 2, Gidgealpa 1 and Pondrinie 2 (Fig. 8.4).
131
Petroleum geology of South Australia. Vol. 4: Cooper Basin.
98-0514
T ( C)max °
HY
DR
OG
EN
IND
EX
1000
900
800
700
600
500
400
300
200
100
0
380 400 420 440 460 480 500 520
I
II
III
VR = 1.35 %
VR=
0.5
%
Kenny 1 (2), Kerinna 1 (1),Lake MacMillan 1 (1),Nulla 1 (1), Pondrinie 2 (7),Spectre 1 (3), Tindilpie 2 (3),Tinga Tingana 1 (20),Tirrawarra 17 (1),Tirrawarra North 1 (1)
Snake Hole 1 (6)
Tirrawarra West 1 (2)
Toonman 1 (7)
Fig. 8.3 HI versus Tmax plot, Merrimelia Formation.

Murteree Shale
Rock-Eval data from 10 wells (27 samples) are plotted inFigure 8.5 and summarised in Table 8.1. All samples plotwithin the Type III/IV kerogen envelope indicating a drygas-prone source. TOC ranges from 1.7 to 4.7% (i.e. good to
very good), but genetic potential is poor to fair (S1+S2 =1–6.6 kg hydrocarbons per tonne), with the richestintersection occurring in Tindilpie 2.
Although these values point to poor source potential(observed HI = 41–131 kg hydrocarbon per tonne), initial HIvalues would be expected to be slightly higher although stillgas prone.
There are no Rock-Eval data for Roseneath Shalesediments. Based on the same environment of depositionand stratigraphic relationship to the Murteree Shale, it is safeto conclude that it would share similar geochemicalproperties to this unit.
Epsilon Formation
Rock-Eval data from 18 wells (50 samples) are plotted inFigure 8.6 and summarised in Tables 8.1 and 8.2. These datapoint to a Type II/III to Type II kerogen (i.e. good to verygood oil source potential). HI values often exceed 250, witha carbonaceous shale sample from Andree 2 (HI = 472) andcoally shale sample from Toonman 1 (HI = 385) having thegreatest oil source potential. No organic petrology isavailable for either of these wells but presumably thesesamples would be exinite rich. Epsilon Formation shaledemonstrates highly variable source richness (TOC =0.1–9.8%; S1+S2 = 0.2–22.1 kg hydrocarbon per tonne).Isolith maps of coal and mudrock percentage appear inFigures 6.24b and c, respectively.
Daralingie Formation
Only 11 samples from four wells have been analysed forRock-Eval pyrolysis (Fig. 8.7; Tables 8.1, 8.2). Such a smalldata set makes it difficult to predict basin-wide sourcerichness and quality. Based on these wells, source richnessof Daralingie Formation shale is moderate to very good(TOC = 2.1–9.0%; S1+S2 = 1.6–24.4 kg hydrocarbon pertonne) and HI = 66–245 kg hydrocarbon per tonne,
132
Petroleum geology of South Australia. Vol. 4: Cooper Basin.
Table 8.1 Summary of Rock-Eval pyrolysis data for Cooper Basin shale, South Australia.
Unit TOC Genetic potential Hydrogen index Oxygen index(%) (kg/t)
average range average range average range average range
Nappamerri Group 0.65 0.1–9.15 1.45 0.1–11.9 104 22–247 368 6–2509Toolachee Formation 3.8 0.3–9.3 6.9 0.1–19.5 128 8–215 32 0–278Daralingie Formation 5.3 2.1–9.0 12.7 1.6–24.4 157 66–245 20 0–82Epsilon Formation 4.2 0.1–9.8 7.0 0.2–22.1 142 51–472 72 0–541Murteree Shale 2.6 1.7–4.7 2.5 1.0–6.6 71 41–131 103 17–455Patchawarra Formation 4.4 0.2–10.0 7.7 0.04–36.6 132 3–346 43 0–480Merrimelia Formation 2.1 0.03–9.9 4.2 0.3–19 102 46–201 59 0–251
NB. Present-day Rock-Eval parameters are not corrected for maturity.
Table 8.2 Summary of Rock-Eval pyrolysis data for Cooper Basin coal and coal-affected shale, South Australia.
Formation TOC Genetic potential Hydrogen index Oxygen index(%) (kg/t)
average range average range average range average range
Nappamerri Group 13.6 10.7–16.4 25.9 21.3–30.5 175 175–175 10 4–15Toolachee Formation 26.6 10.4–73.4 61.5 21.2–187 214 141–330 5 0–12Daralingie Formation 13.1 11–15 30.3 19–40 206 151–268 4 0–8Epsilon Formation 30.7 10.3–64.9 68.7 3.8–177.2 197 11–385 6 0–17Patchawarra Formation 28.2 10–84.5 54 2–182 177 12–347 8 0–42Merrimelia Formation 28.7 14.1–57.9 47.8 15.2–130.2 159 94–203 8 0–13
NB. Present-day Rock-Eval parameters are not corrected for maturity.
98-0510
T ( C)max °
HY
DR
OG
EN
IND
EX
1000
900
800
700
600
500
400
300
200
100
0
380 400 420 440 460 480 500 520
I
II
III
VR = 1.35 %
VR=
0.5
%
Baratta 1 (4), Callabonna 1 (3),Cuttapirrie 1 (5), Dirkala1 (1),Fly Lake 3 (1),Gidgealpa 17 (1),Kanowana 1 (2),Kerinna 1 (8),Kobari 1 (6), Lake MacMillan 1 (3),Leleptian 1 (10), Maraku 1 (4),Munkari 4 (7), Nulla 1 (7),Papyrus 1 (7), Spectre 1 (14),Tindilpie 2 (10),Tinga Tingana 1 (30),Tirrawarra 2 (2), Tirrawarra 16 (1),Tirrawarra North 1 (12),Toolachee East 2 (21),Toonman 1 (1), Wancoocha 1 (7)
Andree 2 (8)
Gidgealpa 1 (3)
Kurunda 1 (11)
Murteree 2 (20)
Pondrinie 2 (17)
Sturt 3 (1), Sturt 4 (1),Sturt 6 (1), Sturt East 4 (1)
Snake Hole 1 (20)
Tibouchina 1 (3)
Tirrawarra West 1 (22)
Fig. 8.4 HI versus Tmax plot, Patchawarra Formation.

indicating a moderately oil-prone source facies (Type II/IIIkerogen). Isolith maps of coal and mudrock percentageappear in Figures 6.26b and c, respectively.
Toolachee Formation
Toolachee Formation coal and carbonaceous shalerepresent the second most important source rock unit of theCooper Basin in terms of richness, quality and thickness.Combined Toolachee Formation coal reaches thicknesses>35 m in the northern Patchawarra Trough and 25 m in theWeena Trough, similar to regional coal thickness trends forthe Patchawarra Formation. Isolith maps of coal andmudrock percentage appear in Figures 6.30b and c,respectively. Rock-Eval data from 22 wells (88 samples) areplotted in Figure 8.8 and summarised in Tables 8.1 and 8.2.They indicate a predominantly oil-prone source facies (TypeII/III kerogen) with highly variable source richness (TOC =0.3–9.3 for shale; S1+S2 = 0.1–19.5 kg hydrocarbon pertonne). Source potential is also understandably variablegiven the large number of samples with HI values rangingfrom 8 to 330 kg hydrocarbon per tonne for the combinedcoal and shale data set. HI values >250 indicating good(Type II/III kerogen) to very good oil source potential(Type II kerogen) are found in Snake Hole 1, Toonman 1,Leleptian 1, Tirrawarra North 1 and Tirrawarra West 1.
In volumetric terms, the northern Patchawarra Troughrepresents the most important kitchen where thickToolachee Formation shale and coal lie within thepresent-day oil window.
Nappamerri Group
Thin, laterally discontinuous coal represents the bestsource rock of the Nappamerri Group whilst shale tends to
be organically lean. The oxidised humic-rich gas-pronenature of the kerogen is supported by Rock-Eval (Fig. 8.9;Tables 8.1, 8.2). Oxygen index (OI) for the shale averages368 mg CO2 (S3)/g TOC and range from 6 to 2509, whilst HIaverages 104 kg hydrocarbon per tonne indicating an
133
Petroleum geology of South Australia. Vol. 4: Cooper Basin.
98-0509
T ( C)max °
HY
DR
OG
EN
IND
EX
1000
900
800
700
600
500
400
300
200
100
0
380 400 420 440 460 480 500 520
I
II
III
VR = 1.35 %
VR=
0.5
%
Andree 2 (1), Baratta 1 (3),Dirkala 1 (1), Kobari 1 (2)),Munkarie 4 (6), Murteree 2 (6),Snake Hole 1 (1),Toolachee East 2 (5),Wancoocha 1 (1)
Tindilpie 2 (1)
Fig. 8.5 HI versus Tmax plot, Murteree Shale.
98-0508
T ( C)max °
HY
DR
OG
EN
IND
EX
1000
900
800
700
600
500
400
300
200
100
0
380 400 420 440 460 480 500 520
I
II
III
VR = 1.35 %
VR=
0.5
%
Baratta 1 (2), Cuttapirrie 1 (2),Dirkala1 (2), Kurunda 1 (1),Lake Hope 1 (2),Munkarie 4 (5), Murteree 2 (3),Nulla 1 (1), Spectre 1 (2),Tindilpie 2 (3),Tirrawarra North 1 (2),Tirrawarra West 1 (2),Toolachee East 2 (7),Wancoocha 1 (6)
Andree 2 (3)
Lake MacMillan 1 (2)
Leleptian 1 (2)
Toonman 1 (3)
Fig. 8.6 HI versus Tmax plot, Epsilon Formation.
98-0507
Munkarie 4 (4)Toolachee East 2 (3)
Dirkala 1 (1)
Tindilpie 2 (3)
T ( C)max °
HY
DR
OG
EN
IND
EX
1000
900
800
700
600
500
400
300
200
100
0
380 400 420 440 460 480 500 520
I
II
III
VR = 1.35 %
VR=
0.5
%
Fig. 8.7 HI versus Tmax plot, Daralingie Formation.
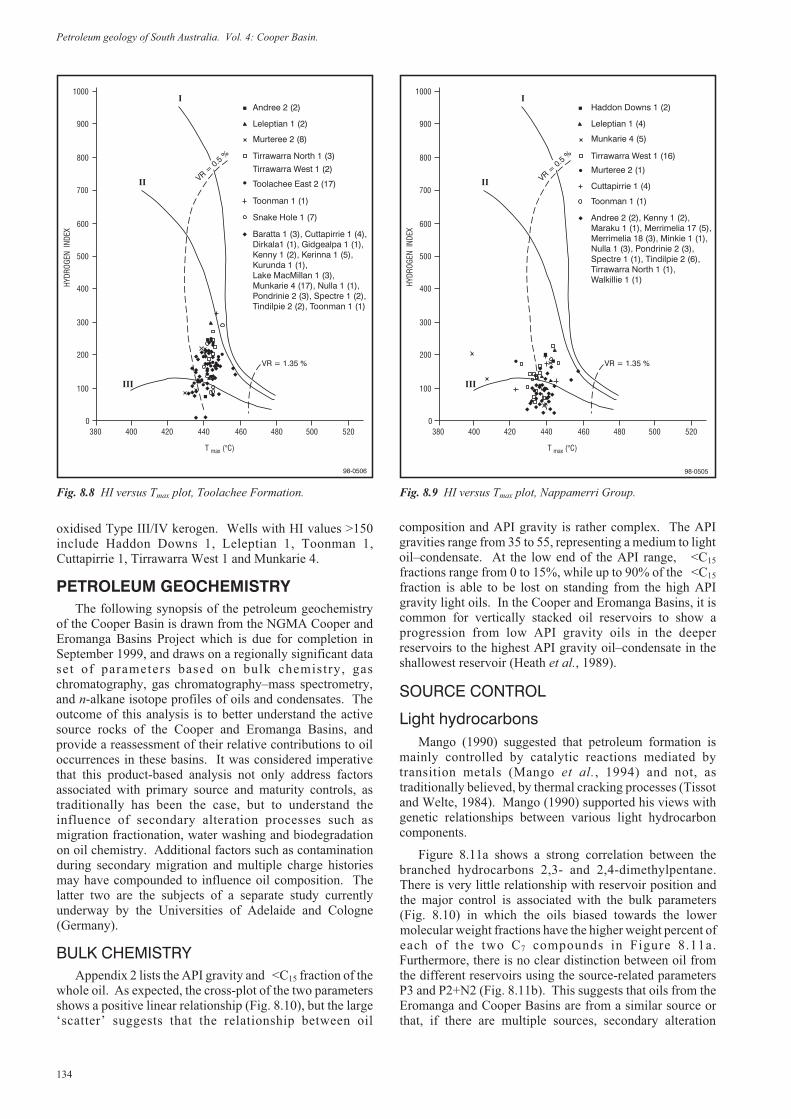
oxidised Type III/IV kerogen. Wells with HI values >150include Haddon Downs 1, Leleptian 1, Toonman 1,Cuttapirrie 1, Tirrawarra West 1 and Munkarie 4.
PETROLEUM GEOCHEMISTRY
The following synopsis of the petroleum geochemistryof the Cooper Basin is drawn from the NGMA Cooper andEromanga Basins Project which is due for completion inSeptember 1999, and draws on a regionally significant dataset of parameters based on bulk chemistry, gaschromatography, gas chromatography–mass spectrometry,and n-alkane isotope profiles of oils and condensates. Theoutcome of this analysis is to better understand the activesource rocks of the Cooper and Eromanga Basins, andprovide a reassessment of their relative contributions to oiloccurrences in these basins. It was considered imperativethat this product-based analysis not only address factorsassociated with primary source and maturity controls, astraditionally has been the case, but to understand theinfluence of secondary alteration processes such asmigration fractionation, water washing and biodegradationon oil chemistry. Additional factors such as contaminationduring secondary migration and multiple charge historiesmay have compounded to influence oil composition. Thelatter two are the subjects of a separate study currentlyunderway by the Universities of Adelaide and Cologne(Germany).
BULK CHEMISTRY
Appendix 2 lists the API gravity and <C15 fraction of thewhole oil. As expected, the cross-plot of the two parametersshows a positive linear relationship (Fig. 8.10), but the large‘scatter’ suggests that the relationship between oil
composition and API gravity is rather complex. The APIgravities range from 35 to 55, representing a medium to lightoil–condensate. At the low end of the API range, <C15
fractions range from 0 to 15%, while up to 90% of the <C15
fraction is able to be lost on standing from the high APIgravity light oils. In the Cooper and Eromanga Basins, it iscommon for vertically stacked oil reservoirs to show aprogression from low API gravity oils in the deeperreservoirs to the highest API gravity oil–condensate in theshallowest reservoir (Heath et al., 1989).
SOURCE CONTROL
Light hydrocarbons
Mango (1990) suggested that petroleum formation ismainly controlled by catalytic reactions mediated bytransition metals (Mango et al., 1994) and not, astraditionally believed, by thermal cracking processes (Tissotand Welte, 1984). Mango (1990) supported his views withgenetic relationships between various light hydrocarboncomponents.
Figure 8.11a shows a strong correlation between thebranched hydrocarbons 2,3- and 2,4-dimethylpentane.There is very little relationship with reservoir position andthe major control is associated with the bulk parameters(Fig. 8.10) in which the oils biased towards the lowermolecular weight fractions have the higher weight percent ofeach of the two C7 compounds in Figure 8.11a.Furthermore, there is no clear distinction between oil fromthe different reservoirs using the source-related parametersP3 and P2+N2 (Fig. 8.11b). This suggests that oils from theEromanga and Cooper Basins are from a similar source orthat, if there are multiple sources, secondary alteration
134
Petroleum geology of South Australia. Vol. 4: Cooper Basin.
98-0506
Baratta 1 (3), Cuttapirrie 1 (4),Dirkala1 (1), Gidgealpa 1 (1),Kenny 1 (2), Kerinna 1 (5),Kurunda 1 (1),Lake MacMillan 1 (3),Munkarie 4 (17), Nulla 1 (1),Pondrinie 2 (3), Spectre 1 (2),Tindilpie 2 (2), Toonman 1 (1)
Andree 2 (2)
Leleptian 1 (2)
Murteree 2 (8)
Tirrawarra North 1 (3)
Tirrawarra West 1 (2)
Toolachee East 2 (17)
Toonman 1 (1)
Snake Hole 1 (7)
T (°C)max
HYD
RO
GEN
IND
EX
1000
900
800
700
600
500
400
300
200
100
0
380 400 420 440 460 480 500 520
I
II
III
VR = 1.35 %
VR=
0.5
%
Fig. 8.8 HI versus Tmax plot, Toolachee Formation.
98-0505
T (°C)max
HYD
RO
GEN
IND
EX
1000
900
800
700
600
500
400
300
200
100
0
380 400 420 440 460 480 500 520
I
II
III
VR = 1.35 %
VR=
0.5
%
Andree 2 (2), Kenny 1 (2),Maraku 1 (1), Merrimelia 17 (5),Merrimelia 18 (3), Minkie 1 (1),Nulla 1 (3), Pondrinie 2 (3),Spectre 1 (1), Tindilpie 2 (6),Tirrawarra North 1 (1),Walkillie 1 (1)
Haddon Downs 1 (2)
Leleptian 1 (4)
Munkarie 4 (5)
Tirrawarra West 1 (16)
Murteree 2 (1)
Cuttapirrie 1 (4)
Toonman 1 (1)
Fig. 8.9 HI versus Tmax plot, Nappamerri Group.

processes are sufficiently strong to overprint the sourcesignature.
n-Alkanes and isoprenoids
Gas chromatograms of representative whole oils areshown in Figure 8.12. Appendix 2 lists a range ofparameters derived from quantisation of individualcompounds from the gas chromatographic traces. For thevertically stacked reservoirs (Fig. 8.12), the variation in APIgravity is readily reconciled at the molecular level. Sincen-alkanes are the major class of compounds of the oil, theycan be considered representative of oil as a whole. Waxyn-alkanes, maximising between n-C21 and n-C23, dominatethe n-alkane profile of the deepest oil and progressively giveway to lower molecular weight homologues higher in thesuccession. This variability is further illustrated in theternary diagram of the relative proportion of n-C11, n-C17 andn-C23 together with colour-filled contours defining thecomposition limits of oil from the main reservoirs (Fig.8.13). Light oil within the Cooper and Eromanga Basinsranges up to 90% n-C11 whereas up to 70% n-C23 ischaracteristic of the low API gravity oil. The composition ofCooper Basin oil (representatives from MerrimeliaFormation to Nappamerri Group) shows two end-membergroupings. One group is dominated by light hydrocarbons(n-C11 dominant) while the other group is the high wax oil(n-C23 dominant). Compared to this latter group, EromangaBasin oil shows slightly lower n-C23 content. The highestn-C17 content is encountered in oil from the youngerreservoirs (Murta, Wyandra and Cadna-owie). A secondarygroup of light oil is also encountered in the MurtaFormation. Namur Sandstone oil shows a similar range ofn-alkane compositions to the Murta oil, while oil lower inthe section (Westbourne to Poolowanna) show a muchnarrower range of n-C17 content, with the variabilitydistributed between n-C11 and n-C23.
All oil accumulations have Pr/Ph >3, indicative of apredominantly non-marine source from terrestrial organicmatter (Fig. 8.14). Furthermore, the progressive changefrom waxy to light oil has been interpreted to indicate anincreased contribution of bacterial or algal source inputs tothe lighter oil (Powell et al., 1989). An alternative
interpretation is that the original source input, althoughdominantly from terrestrial organic matter, has been maskedby secondary alteration processes (see below).
Biomarkers
The recognition of selective enrichment in saturated andaromatic hydrocarbons related to conifer-derived input hasimplied an effective Eromanga Basin source (Alexander etal., 1988, 1992; Jenkins, 1989). Furthermore, this approachhas enabled a semi-quantitative analysis of the proportion ofEromanga and Cooper source contribution to an oil (Jenkins,1989). Consistent with the model, Figure 8.15 shows a cleardistinction between oil reservoired in the Cooper Basin andthat reservoired in the Eromanga Basin. The latter oil ischaracterised by enhanced relative enrichments in1-methylphenanthrene, 1,7-dimethylphenanthrene, reteneand 1,2,5-trimethylphenanthrene.
135
Petroleum geology of South Australia. Vol. 4: Cooper Basin.
30
35
40
45
50
55
60
0 10 20 30 40 50 60 70 80 90
<C15+
AP
Igra
vity
98-1062
Fig. 8.10 Plot of API gravity versus <C15.
2,4-DMP (wt%)
2,3
-DM
P(w
t%)
0.30
0
0.1
0.2
0.3
0.4
0.5
0.6
0 0.05 0.10 0.15 0.20 0.25
Wyandra Sst.
Cadna-owie Fm
Murta Fm
Namur Sst.
Westbourne Fm
Birkhead Fm
Hutton Sst.
Poolowanna Fm
‘Basal Jurassic’
Tinchoo Fm
Nappamerri Grp
Gidgealpa Grp
Toolachee Fm
Patchawarra Fm
Tirrawarra Sst.
Merrimelia Fm
Permian coal measures
Pre-Permian
(a)
P2
(wt%
)
0
1
2
3
0 0.5 1 1.5 2 2.5N2/P3
(b)
98-1063
Fig. 8.11 Mango plot of (a) 2,3- versus 2,4-dimethylpentane(DMP), (b) source parameter (P2 = 2- + 3-methylhexane; N2 =1,1- + 1-cis-3 + 1-trans-3-dimethylcyclopentane; P3 = 2,2- + 2,3-+ 2,4- + 3,3-DMP).

Moorari 4 shows the highest relative content of these
components (Fig. 8.15) and is considered to be
representative of an oil sourced predominantly from the
Eromanga Basin (Alexander et al., 1996). Considering its
low maturity based on high Pr/n-C17 and Ph/n-C18, and
carbon preference index >>1 (Appendix 2), a local source
from the Birkhead Formation is implied. Oil from stacked
reservoirs in the Gidgealpa and Merrimelia Fields clearly
show a compositional distinction between Cooper and
Eromanga reservoirs. It could also be argued that the
Eromanga Basin oil from these two reservoirs has a
contribution from a Cooper Basin source since the Birkhead
signature of this oil is not as strong as that shown in Moorari
4 (Fig. 8.15). This is consistent with the recent study by
Boult et al. (1998) where, using a greater range in
biomarkers, the two Gidgealpa 17 oils from the Birkhead
Formation and Hutton Sandstone have been attributed to a
local Eromanga Basin source. It also agrees with a
multi-component statistical analysis based on bulk carbon
isotopes and saturated biomarkers (AGSO and GeoMark
Research, in prep.; oil included in that study is shown in
Appendix 2) where Cooper Basin oil at Gidgealpa and
Merrimelia showed a low correlation with oil higher in the
section in the Eromanga Basin. Thus, for these two oil
fields, a classical oil–oil correlation study based onbiomarker and bulk carbon isotopes has implicated two mainact ive petroleum systems (source–reservoir) ,
136
Petroleum geology of South Australia. Vol. 4: Cooper Basin.
98-1381
10 20 30 40 50 60 70 80 90
10 20 30 40 50 60 70 80 9010 20 30 40 50 60 70 80 90
10 20 30 40 50 60 70 80 90
10 20 30 40 50 60 70 80 90
10 20 30 40 50 60 70 80 90
10 20 30 40 50 60 70 80 90
10 20 30 40 50 60 70 80 90
10 20 30 40 50 60 70 80 90
10 20 30 40 50 60 70 80 90
10 20 30 40 50 60 70 80 90
10 20 30 40 50 60 70 80 90
10 20 30 40 50 60 70 80 90
10 20 30 40 50 60 70 80 90
10 20 30 40 50 60 70 80 9010 20 30 40 50 60 70 80 90
10 20 30 40 50 60 70 80 90
10 20 30 40 50 60 70 80 90
Sturt Field Gidgealpa Field Merrimelia Field Jackson Fieldn-C23 n-C23 n-C23 n-C23
10167Sturt 7DST 5Poolawanna Fm
10173Gidgealpa 17DST 4Hutton Sst.
10174Gidgealpa 17DST 6Tirrawarra Sst.
10172Gidgealpa 17DST 3Birkhead Fm
7Merrimelia 8Namur Sst.
1Merrimelia 6Murta Fm
2Jackson 1Murta Fm
196Jackson 1Westbourne Fm
10115Jackson 1DST-2Birkhead Fm
191Jackson 1Hutton Sst.
11Merrimelia 9Birkhead Fm
193Merrimelia 8Hutton Sst.
16Merrimelia 7Nappamerri Fm
10158Sturt 6DST 3Patchawarra Fm
10159Sturt 6DST 5Pre-Permian
Fig. 8.12 Gas chromatograms for vertically stacked reservoirs from selected oil fields, Cooper and Eromanga Basins.
0
0.2
0.4
0.6
0.8
0
0.2
0.4
0.6
0.8
0.10.30.50.70.9
Wyandra Sst. – Cadna-owie Fm
Murta Fm
Namur Sst.
Westbourne Fm
Birkhead Fm
Hutton Sst.
Poolowanna Fm
Nappamerri Grp –Toolachee Fm
Patchawarra Fm –Tirrawarra Sst. –Merrimelia Fm
n-C23
n-C17
n-C11
98-1066
Fig. 8.13 Ternary diagram of relative proportions of n-C11, n-C17
and n-C23 in Cooper–Eromanga whole oil.

Cooper–Cooper and Eromanga–Eromanga, with lattershowing variable contributions from a Cooper–Eromangapetroleum system.
n-Alkane isotope profiles
Unquestionably, the biomarkers are information-richand are an indispensable and valid component of any seriousattempt in oil–oil and oil–source correlations leading to theidentification of active petroleum systems (AGSO andGeoMark Research, 1996; Boreham et al., 1997). However,it is debatable that quantitative analysis can be achieved byrelying solely on those ‘classical’ sterane and triterpanebiomarkers which are biased towards the higher molecularweight components. For example, Alexander et al. (1996)recently recognised that some oil in the Eromanga Basin is acomposite produced by mixing of a light Permian oil with awaxy Eromanga oil of differing maturities. In this case,analysis of biomarkers would not do justice to thecontribution of the former oil considering its much lowerbiomarker content. A similarly biased interpretation wouldexist for migration contamination where a light Permian oilmigrates through Eromanga strata inherently enriched inbiomarkers.
On the other hand, the n-alkanes represent the majorstructurally-related class of compounds in an unaltered oil.Their individual carbon isotopes have given new insightsinto the origins of Australian oil (Boreham and de Boer,1998; Boreham et al., 1995; Edwards et al., 1997; Murray etal., 1994; Summons et al., 1995).
Figure 8.16 shows the n-alkane isotope profile forstacked reservoirs in Gidgealpa and Merrimelia oil fieldstogether with oil from the Birkhead reservoir atBookabourdie 8 and Moorari 4. For the Merrimelia andGidgealpa crudes, the pronounced negative slope to then-alkane isotope profile is consistent with an origin from apredominantly land plant source (Murray et al., 1994). AtGidgealpa, the different slope and a wider isotopic range forthe Patchawarra crude compared to the identical isotopiccomposition for the n-alkanes in Birkhead and Hutton oil
suggests a different source rock for oil from the Cooper andEromanga Basin, in agreement with biomarker evidence(AGSO and GeoMark Research, in prep.).
A structural cross-section of the Gidgealpa Field (afterBoult et al., 1998) shows possible migration pathways andsource contributions to the oil accumulations (Fig. 8.17).The dissimilar n-alkane profiles between Patchawarra oil atGidgealpa 17 (Fig. 8.16) and Gidgealpa 2 (not shown)indicates different source kitchens and migration pathways.On the other hand, the identical isotopic composition forMerrimelia Field oil implies a common origin (from aPermian source) for both the Cooper and Eromangaaccumulations. However, a minor Eromanga source input isimplied from the biomarker evidence (Fig. 8.15). Figure8.18 shows a cross-section of the Merrimelia Field with
137
Petroleum geology of South Australia. Vol. 4: Cooper Basin.
-0.2
0.2
0.4
0.6
0.8
-1 -0.5 0.5
Log (1,2,5-TMN/1,3,6-TMN)
-2.5
-2
-1.5
-1
-0.5
0
0.5
-0.5 -0.3 -0.1 0.1 0.3 0.5
Log (1,7-DMP/X)
Log
(Ret
ene/
9-M
P)
Log
(1-M
P/9
-MP
)
(a)
(b)
Wyandra Sst.
Cadna-owie Fm
Murta Fm
Namur Sst.
Westbourne Fm
Birkhead Fm
Hutton Sst.
Poolowanna Fm
Nappamerri Grp
Toolachee Fm
Patchawarra Fm
Tirrawarra Sst.
Merrimelia Fm
Moorari 4
Gidgealpa
Gidgealpa
Moorari 4
Gidgealpa
Gidgealpa
Gidgealpa
Merrimelia
Merrimelia
98-1068
Fig. 8.15 Source indicators based on ratios of selected aromatichydrocarbons (after Alexander et al., 1988). MP = methyl-phenanthrene, TMN = trimethylnaphthalene, DMP = dimethyl-phenanthrene and X = group of other DMP isomers.
0
1
2
3
4
5
6
7
8
9
10
0 1 2 3 4 5 6 7 8 9 10
Pr/Ph
nn
-C/
-C23
11
Cretaceous
Jurassic
Triassic
Permian
Basement
light oil
waxy oil
mig
ration-fractio
nation
terrestrial source
98-1067
Fig. 8.14 Plot of n-C23/n-C11 versus Pr/Ph for Cooper–Eromangaoil.

migration from Permian source rocks responsible for themajor charge to the Eromanga Basin oil accumulations.
Birkhead Formation oi l in Moorar i 4 andBookabourdie 8 shows a different isotopic profile toBirkhead Formation oil at Gidgealpa and Merrimelia. Theformer have a carbon isotope composition that remainsreasonably constant over the range n-C8 to n-C29. Thisisotopically ‘flat’ profile is considered a characteristic of anoil generated locally from the Birkhead Formation andestablishes the existence of oil accumulations primarilyfrom this source. The two wells are notably within theregion of thickest Birkhead Formation (Paton, 1986). Theisotopic difference of up to 1o/oo between the n-alkanes in theMoorari and Bookabourdie oil suggests that isotopicvariations of this magnitude are due to slight changes inorganic facies. Indeed, Paton (1986) has shownconsiderable lateral variations in the coal swamp tolacustrine environments for unit 2 (highest source potential)of the Birkhead Formation.
The isotopic variability between and within formationscan be readily seen in the carbon isotopic composition of theorganic matter from potential source rocks (Fig. 8.19). Here,an isotopic difference of up to 3o/oo occurs in organic matterfrom rocks of the same formation. Furthermore, the range inisotopic composition of organic matter in the EromangaBasin (average = -24.7o/oo; sd = 1.4o/oo; n = 18) is similar tothat in the Cooper Basin (average = -24.0o/oo; sd = 1.5o/oo;n = 13). In Moorari 4 and Bookabourdie 8, there is no clearsource distinction between Late and Early Permian sourcerocks based on bulk carbon isotopes. Furthermore, organicmatter from the Cretaceous Murta Formation and thePermian of the Cooper Basin appears to be isotopicallyindistinguishable. Although this may suggest that bulkisotopes offer little source differentiation, the regionalisotopic variability in the Murta Formation is much less thanthat for any of the other formations. For the latter, organicmatter in the Jackson Field of South-West Queensland isslightly lighter isotopically than in the same formations inthe Merrimelia area of South Australia.
For reservoirs where multiple charging from Permianand Jurassic sources is suspected (Alexander et al., 1988,
1992; Jenkins, 1989; Heath et al., 1989), a measure of then-alkane ‘isotopic gradient’ may provide an estimate of thedegree of mixing.
Figure 8.20 plots the isotopic difference betweenaverage isotopic composition over selected carbon numberranges between n-C10 and n-C25 for oil from Murta toMerrimelia Formations. Accumulations sourced from theJurassic Birkhead Formation show the least isotopicdifferences. For the Gidgealpa 17 stacked reservoirs, acalculation based on the average isotopic difference in therange n-C10 to n-C20 of -1.7o/oo for a Cooper-sourced oil andan average of 0.08o/oo for a Birkhead-sourced oil (Fig. 8.20)leads to 35:65 mixing of Permian and Jurassic sources (Fig.8.17) in the Birkhead and Hutton oils (average isotopicdifference of -0.54o/oo). In this case a lower than 25%Birkhead-source contribution would not have beenresolvable considering the 0.5o/oo analytical error.
138
Petroleum geology of South Australia. Vol. 4: Cooper Basin.
98-1297
17 9 15 221
1500 North Dome
MurtaFormation
Toolachee Formation
Top Permiandepth structure contours,
(50 m interval),Gidgealpa Field
TRIASSIC SEAL
PRE-PERMIANPatchawarra Sandstone
Tirrawarra Sandstone
Craton derived sediments Gas
3 km
Volcanic arc derived sediments Oil
PERMIANOther seals of non-volcanicor unknown origin
HuttonSandstone
Wallumbilla Formation(marine)
Depthsub-seametres
Poolowanna Formation
Seals
Cadna-owie Formation
1750
2000
2250
South DomeBirkhead Formation
Namur Sandstone
2
15
9
17
21
5
KILOMETRES
02200
Line of section2150
2100
2050
North Dome
South Dome
Fig. 8.17 Cross-section of Gidgealpa Field showing oil and gasaccumulations and migration pathways from Cooper (blue arrows)and Eromanga (purple arrows) sources (after Boult et al., 1998,fig. 14).
-28
-27
-26
-25
-24
-23
-22
97 11 13 15 17 19 21 23 25 27 29
Gidgealpa 17, Murta Fm
Gidgealpa 17, Hutton Sst.
Gidgealpa 17, Patchawarra Fm
Merrimelia 6, Murta Fm
Merrimelia 9, Birkhead Fm
Merrimelia 7, Nappamerri Grp
Bookabourdie 8, Birkhead Fm
Moorari 4, Birkhead Fm
n-alkane carbon number
98-1069
d13C
(°/ °°
)
Fig. 8.16 n-Alkane isotope plot of carbon number versus carbonisotopic composition.

MATURITY CONTROL
Almost every biomarker parameter is affected to varying
degrees, by both source and maturity. Thus, the specificity
expressed in the aromatic source parameters (Fig. 8.15) is
di luted with increasing maturi ty and becomes
unrecognisable past the main oil window. Similarly, the
most commonly used aromatic maturity parameter (MPI-1)
and the derived calculated vitrinite reflectance (Rc; Radke
and Welte, 1983) are source dependent for Eromanga
Basin sediments by vir tue of the presence of
1-methylphenanthrene in their formulae. The Rc values of
the oil samples (in Fig. 8.15) are plotted in Figure 8.21 and
are in the range 0.5% <Rc <1.0%. Oil higher in the section in
the Eromanga Basin has, on average, the lowest Rc, as has
been previously recognised (Alexander et al., 1988;
Michaelsen and McKirdy, 1989; Powell et al., 1989; Tupper
and Burckhardt, 1990). This Rc distribution, attributed
primarily to maturity, has subsequently been used to infer
migration directions from maturity gradients (Tupper and
Burckhardt, 1990). An independent measure of maturity
based on the highly stable, low molecular weight
diamondoid structure (Chen et al., 1996; methyl adamantane
index (MAI) = 1-methyl adamantane/(1-methyl adamantane
+ 2-methyl adamantane) has proven useful in identifying
maturity effects at the high maturity end (past peak oil
generation; Chen et al., 1996, 1998; Boreham et al., 1997;
Boreham and de Boer, 1998) where most hopane and
sterane-based maturity parameters are ineffective. Figure
8.21 plots MAI versus Rc (based on MPI-1). The two
parameters show a weak positive correlation although the oil
has a higher extrapolated maturity range based on MAI
(0.9%< Rc <1.2%) compared to that based on Rc (0.5%< Rc
<1.0%). Despite the limited use of the MAI parameter, and
uncertainties concerning its source dependency (cf. source
dependency of MPI-1; Boreham et al., 1988), the similar
range in MAI for the Murta and Cooper oil compared to
lower Rc for Murta oil may implicate a mixed origin with a
high and low maturity fraction in the Murta oil.
Maturity effects are also evident in the n-alkane profiles.The Cooper oil from Merrimelia, Moorari and Strzeleckiwells shows n-alkane isotope profiles with parallel negativeslopes (Fig. 8.22), characteristic of oil derived from coal andassociated terrestrial source rocks (Murray et al., 1994). Onthe other hand, the Kanowana oil shows a much flattern-alkane profile. Such a profile is similar to that displayedby Birkhead oil (Fig. 8.16) and is also typical of oil derivedfrom marine source rocks (Murray et al., 1994). Marinesediments are known to be present in the underlyingOrdovician to Cambrian Warburton Basin (Sun, 1997), andfault-controlled migration from a deep source may be apossibility. Flat n-alkane profiles are characteristic oforganic matter in sediments of similar age in the Officer andAmadeus Basins, but the n-alkanes are isotopically light (i.e.
139
Petroleum geology of South Australia. Vol. 4: Cooper Basin.
-0.8
-0.6
-0.4
-0.2
-1.5 -1 -0.5 0.5
MM
MB
MN MOB
BOB
GH
GP
GB
d d1310-15
1315-20C av - C av (°/
°°)
dd
13
15
-20
13
20-2
5C
av
-C
av
(°/ °°
)
98-1071
Fig. 8.20 Plot of carbon isotope difference between the average of(d13C n-C10 to d13C n-C15) and the average of (d13C n-C15 to d13Cn-C20) versus the carbon isotope difference between the average of(d13C n-C15 to d13C n-C20)and the average of (d13C n-C20 to d13Cn-C25). Oils: MM = Merrimelia 6, Murta Formation; MB =Merrimelia 9, Birkhead Formation; MN = Merrimelia 7,Nappamerri Group; GB = Gidgealpa 17, Birkhead Formation; GH= Gidgealpa 17, Hutton Sandstone; GP = Gidgealpa 17,Patchawarra Formation; MOB = Moorari 4, Birkhead Formation;BOB = Bookabourdie 8, Birkhead Formation.
-28
-27
-26
-25
-24
-23
-22
Jackson
Nam
ur
Sst
.
West
bo
urn
eF
m
Bir
kh
ead
Fm
Hu
tto
nS
st.
Nap
pam
err
iGrp
Too
lach
ee
Fm
Patc
haw
arr
aF
m
Mu
rta
Fm
d1
3C
(°/ °°
)
Merrimelia
98-1070
Fig. 8.19 Carbon isotopic composition of organic matter fromsedimentary rocks in the Jackson and Merrimelia wells. Datarepresent maximum and minimum values.
Pre-Permian
Formation
NappamerriFormation
1500
2000
2500
2800
METRES
Birkhead
Namur Sandstone
SandstoneHutton
Tirr
awar
raSS
Pa
atc
hw
arra
Fm
Mer
rimel
iaFm
1 4 5 12 13 7 6 8 2
Gas
Oil
Toolachee Fm
98-1298
Fig. 8.18 Cross-section of Merrimelia Field showing oil and gasaccumulations and migration pathways from Cooper (blue arrows)and Eromanga (purple arrows) sources (after Bowering andHarrison, 1986, fig 6).

depleted in 13C) with d13C mainly between -28 and -32o/oo
(Logan et al., 1997), outside the range shown for any oilfrom the Cooper and Eromanga Basins. The isotopicallyheavy n-alkanes in Kanowana light oil–condensate are morelikely to be high temperature products of secondary crackingreactions and the overall profile is predominantly maturityinfluenced.
SECONDARY ALTERATION
Migration fractionation
Migration fractionation (Curiale and Bromley, 1996) orevaporative fractionation (Thompson, 1987 1988) is onemechanism that can account for some of the systematicchanges in composition for stratigraphically and spatiallyconstrained oil reservoirs in the Cooper and EromangaBasins. As upward-migrating petroleum experiencesdecreasing pressure, oil expands and higher molecularweight components become less soluble. Finally, as thefluid passes through the bubble point pressure, it separatesinto gas and oil-rich phases. Furthermore, ineffective oilseals in the deeper reservoirs can allow preferential leakageof low molecular components. In all of these processes aless mobile fluid (residual oil) becomes enriched in highermolecular components. Ultimately, in stacked reservoirs,low API gravity crude resides at the base and high APIgravity light oil at the top of reservoirs (Fig. 8.12).However, there are many stacked reservoirs that do not showsignificant compositional differences (Fig. 8.12). This maybe a function of multiple sourcing but could also reflect aphase with high gas–oil ratio (GOR) that does not undergophase separation. For the latter, oil dissolved in gas could bean effective phase for lateral migration within the Cooperand Eromanga Basins and extending well past the Permianedge in Eromanga Basin reservoirs. Gas loss along themigration pathway will reduce the ability of the migratingphase to retain dissolved oil. Thus, an initial waxy oil legdevoid of low molecular weight hydrocarbons will beexsolved, becoming progressively enriched in lighthydrocarbons with increasing migration distance from its
source. Thus, the initial GOR will be critical in determiningcompositional variability along a migration fairway.
It would be naive to propose migration fractionation asthe sole process operating in the Cooper and EromangaBasins without considering the primary controls of sourceand maturity. As stated above, all oil shows Pr/Ph >3,attesting to terrestrial origin. However, Pr/Ph also shows aregular trend with n-C23/n-C11 (Fig. 8.14), a parameterassociated with the waxy to light oil character. Thus, oilwith Pr/Ph >4.5 and n-C23/n-C11 <1 may have experiencedsecondary alteration by migration fractionation. Indeed, Ph,being of higher molecular weight than Pr, will bepreferentially retained in the heavier residual oil. Theseeffects have previously been recognised in South East Asianoil, again from terrestrial sources (Curiale and Bromley,1996).
Water washing and biodegradation
The C6–C7 light hydrocarbons are greatly influenced bysecondary alteration processes (Thompson, 1987, 1988).For example, compared to the parent oi l , thetoluene/n-heptane ratio has been shown in field (Thompson,1987) and laboratory studies (Carpentier et al., 1996) toincrease in the residual heavy oil and decrease in light oil(dissolved in the gas phase) through the process of migrationfractionation. However, Heath et al. (1989) interpreted thehigher toluene/n-heptane in Cooper Basin oil compared tooil in the Eromanga Basin as indicating greater waterwashing of the latter. This behaviour is also evident in themuch larger data set (Fig. 8.23; Appendix 2). The strongpositive linear relationship between toluene/n-heptane andn-heptane/methylcyclohexane (Fig. 8.24) is furtherevidence that water washing is the dominant factor operatingon the light hydrocarbons. The trend is what would bepredicted from laboratory experiments (Lafargue andBarker, 1988). There the rate of loss of light hydrocarbonsfrom oil exposed to water washing is in the ordertoluene > heptane > methylcyclohexane. Again, oil from theCooper Basin is the least affected by water washing (Heathet al., 1989; Hunt, 1989) and this may suggest shorter
140
Petroleum geology of South Australia. Vol. 4: Cooper Basin.
-28
-27
-26
-25
-24
-23
-22
-21
97 11 13 15 17 19 21 23 25 27
Merrimelia 7, Nappamerri Grp
Strzelecki 10, Toolachee Fm
Kanowana 1, Patchawarra Fm
Moorari 1, Tirrawarra Sst.
.
n-alkane carbon number
d13C
(°/ °°
)
98-1073
Fig. 8.22 n-Alkane isotope plot of carbon number versus carbonisotopic composition.
0.4
0.6
0.8
1
1.2
1.4
1.6
0.4 0.5 0.6 0.7 0.8
Rc
Wyandra Sst.
Cadna-owie Fm
Murta Fm
Namur Sst.
Westbourne Fm
Birkhead Fm
Hutton Sst.
Poolowanna Fm
Nappamerri Grp
Toolachee Fm
Patchawarra Fm
Tirrawarra Sst.
Merrimelia Fm
Chen
1996
et al.,
98-1072
AIM
Fig. 8.21 MAI versus Rc plot (based on MPI-1 of Radke and Welte,1983). The line of Chen et al. (1996) is the best-fit straight line foran effective vitrinite reflectance based on MAI.

migration distances, being closer to the Permian sourcerocks.
Dibenzothiophene (DBT) is another compound that hasbeen suggested to be highly affected by water washing(Lafargue and Barker, 1988). Phenanthrene (P) and 1,3,6,7-tetramethylnaphthalene (1,3,6,7-TeMN) are twoubiquitous compounds in crude oil and both have similarchromatographic behaviour. Water solubilities are in theorder DBT > P > 1,3,6,7-TeMN (Alexander et al., 1996).Indeed, a plot of P/1,3,6,7-TeMN versus DBT/1,3,6,7-TeMN (Fig. 8.25) shows a good linear correlation.However, there is no clear distinction between oil from theCooper and Eromanga Basins, suggesting that other factors(e.g. source) have an increased influence relative to the lighthydrocarbons.
The unusual oil in Figure 8.14 with Pr/Ph = 6.85 andn-C23/n-C11 = 9.74 is from Cuddapan 1 (45 km north of thePermian edge in Queensland). This oil is interpreted to beseverely water washed with C6–C7 light hydrocarbons beingcompletely lost, with the alteration effects extending pastn-C11. Based on Pr/Ph, the original Cuddapan oil wasrelatively light (Fig. 8.14).
In-reservoir alteration by biodegradation is of littleimportance in the Cooper and Eromanga Basins althoughbiodegradation is a major alteration process in the adjacentBowen and Surat Basins. The reason for the absence forbiodegradation in the Cooper and Eromanga Basins isunclear since reservoirs in most regions have access tonutrient-rich connate water. However, levels of dissolvedoxygen observed in the aquifer waters of the EromangaBasin may be too low (R. Habermehl, AGSO, pers. comm.,1998) to support intense aerobic biodegradation.Furthermore, temperature of the Eromanga reservoirs isgenerally >80–90°C, which is above the threshold forsustainable bacterial growth.
Migration contamination
The concept of migration contamination has been largelyignored. However, it has been previously identified in the
Gippsland Basin (Philp and Gilbert, 1982) and recentlyrecognised in Birkhead oil at Gidgealpa 17 (Boult et al.,1998). In principle, migration contamination is anend-member in the continuum of mixing of different oils.However, the term attracts a degree of uncertainty and canobviously be misused to ‘cover’ shortfalls in geochemicalinterpretations. Following expulsion from the effectivesource rock, the mobile oil phase finds its way through thepermeable migration pathway to the reservoir. Thus,between source and reservoir there exists the possibility thatthe mobile oil phase can be supplemented with ‘soluble’organics either from contact with DOM or through mixingwith other mobile hydrocarbons from different effectivesources at various stratigraphic levels before it reaches thetrap.
All oil reservoired in the Eromanga Basin has enhancedlevels of conifer-derived biomarkers compared to CooperBasin oil (Fig. 8.15). For the Merrimelia Field stackedaccumulations, this is despite a Cooper origin for then-alkanes. Here the reliance on aromatic biomarkers wouldlead to a disproportionately higher level of Eromanga oilcontribution than is considered the case. Studies of oilaccumulations in the Bowen and Surat Basins have shownthat they are predominantly from Permian source rocks andthere is no contribution from Jurassic sources (Boreham,
141
Petroleum geology of South Australia. Vol. 4: Cooper Basin.
0
1
2
3
4
5
6
0 0.5 1 1.5 2
n-heptane/methylcyclohexane
Tolu
ene/
-hep
tane
n
Wyandra Sst.
Cadna-owie Fm
Murta Fm
Namur Sst.
Westbourne Fm
Birkhead Fm
Hutton Sst.
Poolowanna Fm
Nappamerri Grp
Toolachee Fm
Patchawarra Fm
Tirrawarra Sst.
Merrimelia Fm
98-1144
Fig. 8.24 Plot of toluene/n-heptane versus n-heptane/methylcyclohexane.
0
1
2
3
4
5
6
7
8
9
0 0.1 0.2 0.3 0.4 0.5 0.6
DBT/1,3,6,7-TeMN
P/1
,3,6
,7-T
eMN
Wyandra Sst.Cadna-owie FmMurta FmNamur Sst.Westbourne FmBirkhead FmHutton Sst.Poolowanna FmNappamerri GrpTolachee FmPatchawarra FmTirrawarra Sst.Merrimelia Fm
98-1074
Fig. 8.25 Cross-plot of the ratio of DBT to 1,3,6,7-TeMN versusthe ratio of P to 1,3,6,7-TeMN.
Wyan
dra
Sst
.
Tolu
ene/
-hep
tane
n
Cad
na-o
wie
Fm
Mu
rta
Fm
Nam
ur
Sst
.
West
bo
urn
eF
m
Bir
kh
ead
Fm
Hu
tto
nS
st.
Po
ola
wan
na
Fm
Nap
pam
err
iGrp
Too
lach
ee
Fm
Patc
haw
arr
aF
m
Tir
raw
arr
aS
st
Merr
imelia
Fm
0
1
2
3
4
98-1143
Fig. 8.23 Plot of toluene/n-heptane in whole oils grouped withintheir reservoir units.

1995). The difference between the Surat and the EromangaBasins is that the main Jurassic source rocks (Walloon CoalMeasures in the Surat Basin, and the Birkhead Formation inthe Eromanga Basin) are immature in the former butmarginally mature to mature in the latter. Furthermore, oil inthe Surat Basin is effectively trapped before it can come intocontact with Walloon Formation sediments containingconifer-derived biomarkers (Boreham, 1994). Migrationcontamination of upward-migrating oil should be seriouslyconsidered when mobile hydrocarbons are expelled fromJurassic and Cretaceous source rocks, and thesehydrocarbons remain pervasive throughout the EromangaBasin succession in varying concentrations.
SUMMARY
Both Cooper and Eromanga Basin source rocks havecontributed to oil accumulations in the region. Each oilaccumulation needs to be considered on its merits withrespect to the extent of ‘mixing’ from Permian and Mesozoicsources. The ultimate ‘mix’ will be biased by thosechemical parameters that are used since different classes ofcompounds respond differently to source, maturity andsecondary alteration processes. n-Alkane isotope profilesprovide a means for quantitatively assessing contributionsfrom Cooper and Eromanga Basin sources. However, minorcontributions (volumetrically <25%) from either source aredifficult to access through n-alkane isotope profiles andother more sensitive geochemical tools are required (e.g.biomarkers).
The Cooper Basin contains both light oil–condensate andwaxy oil with depleted light hydrocarbon contents. Thesource of the oil is Permian coal and associated terrestrialorganic matter. The oil is characterised by low saturatedbiomarker contents, lack of conifer-derived biomarkers andan n-alkane isotope profile that becomes isotopically lighterwith increasing carbon number.
The Eromanga Basin oil accumulations with a Birkheadsource appear to be confined to the area of mature andthickest Birkhead Formation in the vicinity of Moorari andBookabourdie Fields. This oil is characterised by highconifer-derived biomarkers (Moorari 4) and n-alkaneisotope profiles that are ‘flat’ (where the isotopiccomposition of individual n-alkanes does not changesignificantly with carbon number).
Gas chromatographic fingerprints and parametersderived for Jurassic oil are only marginally distinguishablefrom Cretaceous and Cooper Basin oil. The Jurassic oil hasa much narrower range of bulk compositions. The Moorari 4oil, being the least mature, can be used to define the maturitythreshold (0.65% Ro for a local source) below which noexpulsion of oil can occur. Birkhead Formation oil atGidgealpa and Merrimelia would be considered to have anEromanga Basin source content based on biomarkerevidence. However, n-alkane isotope data only support astrong local source contribution at Gidgealpa, whereas theBirkhead oil in the Merrimelia Field is dominantly sourcedfrom the Cooper Basin.
A local source to the Murta Formation oil accumulationmay have been overestimated since secondary alterationprocesses have been undervalued in previous studies. Murtaoil in the Merrimelia Field in South Australia and some otheraccumulations in Queensland (e.g. Jackson Field) have
biomarker characteristics that set them apart from oil lowerin the succession, but their n-alkane profiles match all othersin the stacked reservoirs.
142
Petroleum geology of South Australia. Vol. 4: Cooper Basin.