art/visual communication: illustration - chaffey.edu communication: illustration needs assessment...
TRANSCRIPT
Art/Visual Communication: Illustration Needs Assessment Page 1
Art/Visual Communication: Illustration
August 2015 Needs Assessment
Prepared by Danielle Pearson
Date: August 20, 2015 Art/Visual Communication: Illustration
Art/Visual Communication: Illustration Needs Assessment Page 2
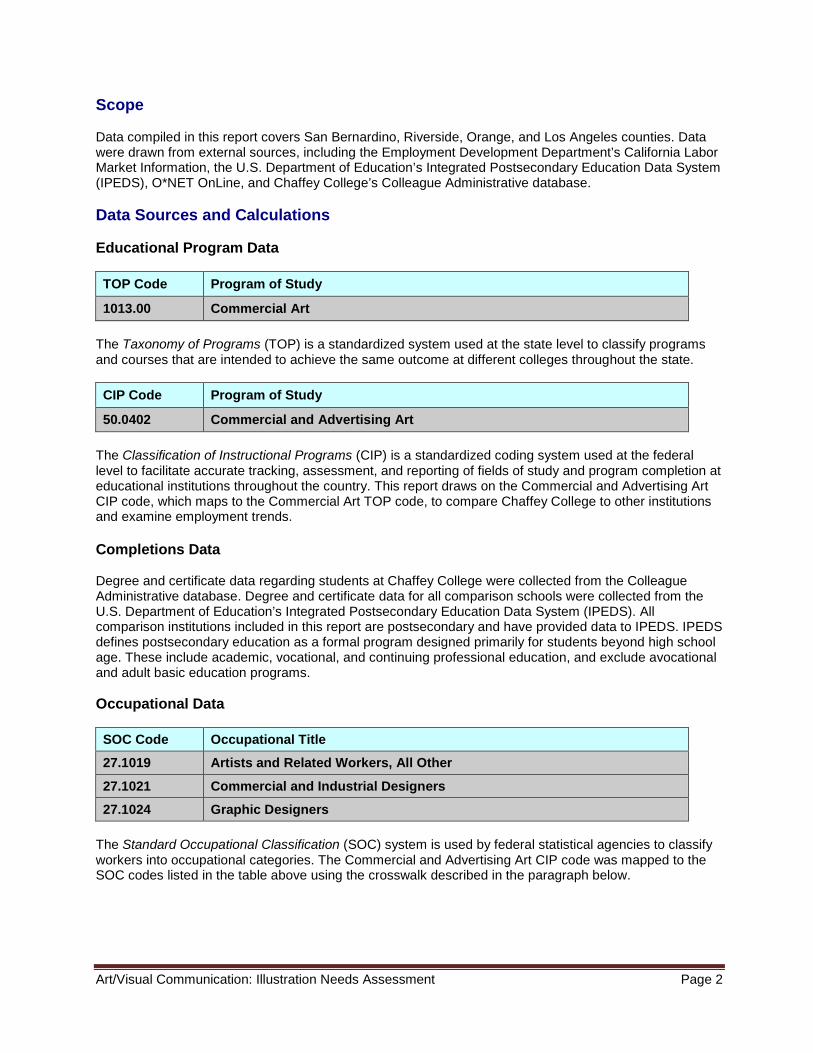
Scope Data compiled in this report covers San Bernardino, Riverside, Orange, and Los Angeles counties. Data were drawn from external sources, including the Employment Development Department’s California Labor Market Information, the U.S. Department of Education’s Integrated Postsecondary Education Data System (IPEDS), O*NET OnLine, and Chaffey College’s Colleague Administrative database. Data Sources and Calculations Educational Program Data TOP Code Program of Study
1013.00 Commercial Art The Taxonomy of Programs (TOP) is a standardized system used at the state level to classify programs and courses that are intended to achieve the same outcome at different colleges throughout the state. CIP Code Program of Study
50.0402 Commercial and Advertising Art The Classification of Instructional Programs (CIP) is a standardized coding system used at the federal level to facilitate accurate tracking, assessment, and reporting of fields of study and program completion at educational institutions throughout the country. This report draws on the Commercial and Advertising Art CIP code, which maps to the Commercial Art TOP code, to compare Chaffey College to other institutions and examine employment trends. Completions Data Degree and certificate data regarding students at Chaffey College were collected from the Colleague Administrative database. Degree and certificate data for all comparison schools were collected from the U.S. Department of Education’s Integrated Postsecondary Education Data System (IPEDS). All comparison institutions included in this report are postsecondary and have provided data to IPEDS. IPEDS defines postsecondary education as a formal program designed primarily for students beyond high school age. These include academic, vocational, and continuing professional education, and exclude avocational and adult basic education programs. Occupational Data SOC Code Occupational Title
27.1019 Artists and Related Workers, All Other
27.1021 Commercial and Industrial Designers
27.1024 Graphic Designers The Standard Occupational Classification (SOC) system is used by federal statistical agencies to classify workers into occupational categories. The Commercial and Advertising Art CIP code was mapped to the SOC codes listed in the table above using the crosswalk described in the paragraph below.

Art/Visual Communication: Illustration Needs Assessment Page 3
Educational Program to Occupation Crosswalk The TOP-CIP-SOC Crosswalk (Employment Development Department, 2009) was used in this report to map TOP codes to CIP and SOC codes. This crosswalk allows the user to estimate labor market demand for California Community College program completers using SOC based projections from the Labor Market Information Division. Industry Data The North American Industry Classification System (NAICS) is used by federal statistical agencies to classify business establishments for the purpose of conducting and reporting research on the U.S. business economy. Using the Standard Occupational Classification codes listed above, associated NAICS industries were identified.
Art/Visual Communication: Illustration Needs Assessment Page 4
Introduction and Contents Contents Background Information 5 Regional Job Outlook 7 Largest & Fastest Growing Industry Employers 10 Regional Graduation Summary 13 Chaffey College’s Performance on Core Indicators 14 Purpose and Goals Chaffey College currently offers a 40-41 unit Associate in Science degree in Art/Visual Communication: Illustration. A 43-45 unit Illustration Certificate is also available. The following is a description of the Art/Visual Communication: Illustration program as outlined in the 2015-16 Catalog: “The Illustration program develops students’ ability to visually communicate ideas. Primary emphasis is on conceptual development and refinement of technical skills in varied forms including drawing, painting, and digital imagery. The Illustration Program is designed to assist students in the preparation of a portfolio for transfer to a four-year institution. To transfer, students should consult with the intended transfer institution to obtain a list of appropriate courses to complete at Chaffey College.” The purpose of this report is to integrate and analyze data from multiple sources to determine labor market needs for the Art/Visual Communication: Illustration program at Chaffey College.
Regional Definitions Inland Empire includes the Riverside-San Bernardino-Ontario Metropolitan Statistical Area (MSA) Los Angeles County includes the Los Angeles-Long Beach-Glendale Metro Division Orange County includes the Santa Ana-Anaheim-Irvine Metro Division Key Terms and Concepts Replacement Jobs: Replacement jobs refer to the number of job openings due to workers leaving an occupation. Annual Openings: Annual openings are calculated by adding the number of new jobs to the number of replacement jobs, divided by the number of years in the projection period. Projections: Projections of employment are calculated by the Employment Development Department and are based on a mathematical formula that includes historical employment and economic indicators along with national, state, and local trends. Occupation: Jobs are grouped into occupations using the federal Standard Occupational Classification (SOC) system. Industry: Occupations are grouped into industries using the North American Industry Classification System (NAICS). Wages: Hourly wages are reported in percentiles and averages. The 25th percentile is a useful proxy of entry-level wages and the 75th percentile of experienced-level wages.
Art/Visual Communication: Illustration Needs Assessment Page 5
Background Information
1 California Community Colleges, Chancellor’s Office, Taxonomy of Programs, Sixth Edition (Corrected Version). 2 O*Net Online: http://www.onetonline.org/find/
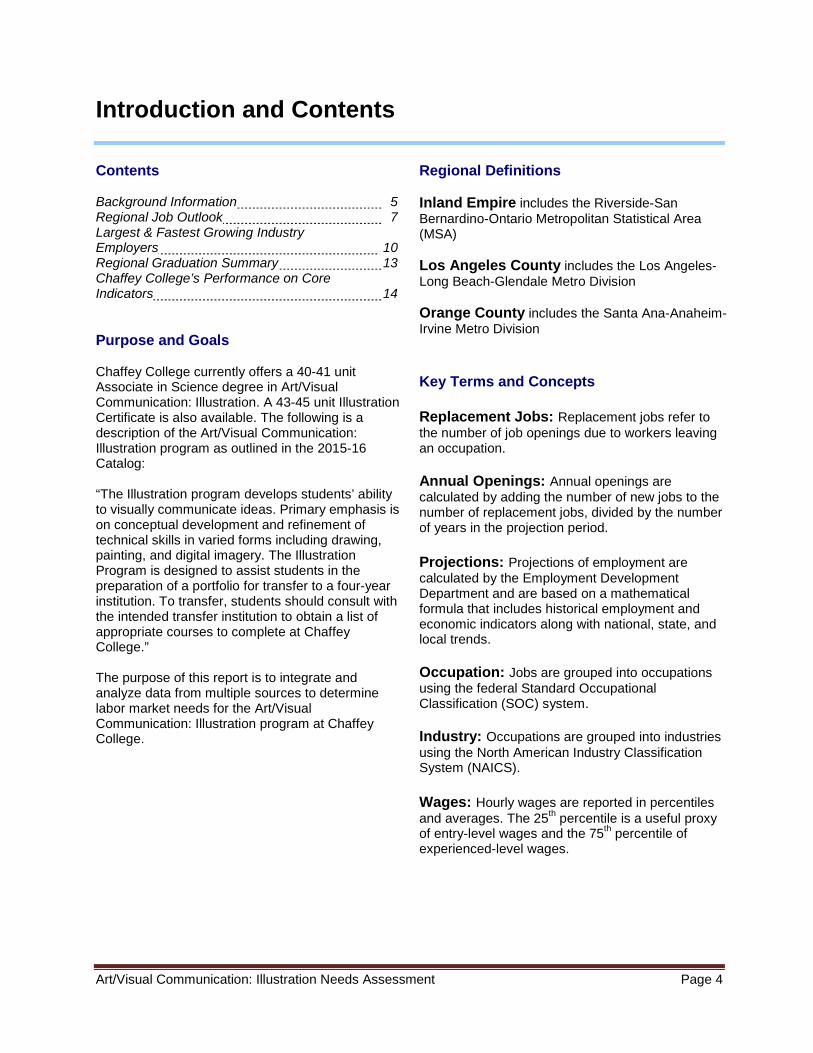
Artists and Related Workers, All Other2 Artists and Related Workers, All Other, is an occupational group that includes all artists and related workers not listed separately by the California Labor Market Information Division. This group includes Art Directors, Craft Artists, Fine Artists, Illustrators, Medical and Scientific Illustrators, Cartoonists, Sketch Artists, Sculptors, Printmakers, Painting Restorers, and Multi-media Artists and Animators. Data on typical tasks for this occupational group are not available due to the group’s heterogeneity.
Commercial and Industrial Designers2 Commercial and Industrial Designers develop and design manufactured products, such as cars, home appliances, and children’s toys. They combine artistic talent with research on product use, marketing, and materials to create the most functional and appealing product design. Typical Tasks
♦ Prepare sketches of ideas, detailed drawings, illustrations, artwork, or blueprints, using drafting instruments, paints and brushes, or computer-aided design equipment
♦ Confer with engineering, marketing, production, or sales departments, or with customers, to establish and evaluate design concepts for manufactured products
♦ Modify and refine designs, using working models, to conform with customer specifications, production limitations, or changes in design trends
♦ Direct and coordinate the fabrication of models or samples and the drafting of working drawings and specification sheets from sketches
♦ Evaluate feasibility of design ideas, based on factors such as appearance, safety, function, serviceability, budget, production costs/methods, and market characteristics
♦ Present designs and reports to customers or design committees for approval, and discuss need for modification
♦ Investigate product characteristics such as the product’s safety and handling qualities, its market appeal, how efficiently it can be produced, and ways of distributing, using and maintaining it
♦ Develop manufacturing procedures and monitor the manufacture of their designs in a factory to improve operations and product quality
♦ Research production specifications, costs, production materials and manufacturing methods, and provide cost estimates and itemized production requirements
♦ Participate in new product planning or market research, including studying the potential need for new products
Commercial Art
Commercial Art programs in California Community Colleges cover the design and execution of layouts and illustrations for advertising displays and instructional manuals, including the preparation of copy, lettering, poster, package and product design, fashion illustration, silk screening, air brushing, inks, color dynamics, and computer pre-print applications.1 The descriptions of job duties for Commercial Art-related occupations are provided by the Occupational Information Network.2

Art/Visual Communication: Illustration Needs Assessment Page 6
Graphic Designers2 Graphic Designers design or create graphics to meet specific commercial or promotional needs, such as packaging, displays, or logos. They may use a variety of mediums to achieve artistic or decorative effects. Typical Tasks
♦ Create designs, concepts, and sample layouts based on knowledge of layout principals and esthetic design concepts
♦ Determine size and arrangement of illustrative material and copy, and select style and size of type
♦ Confer with clients to discuss and determine layout design ♦ Develop graphics and layout for product illustrations, company logos, and internet
websites ♦ Review final layouts and suggest improvements as needed ♦ Prepare illustrations or rough sketches of material, discussing them with clients or
supervisors and making necessary changes ♦ Use computer software to generate new images ♦ Key information into computer equipment to create layouts for client or supervisor ♦ Maintain archive of images, photos, or previous work products ♦ Prepare notes and instructions for workers who assemble and prepare final layouts for
printing
Art/Visual Communication: Illustration Needs Assessment Page 7
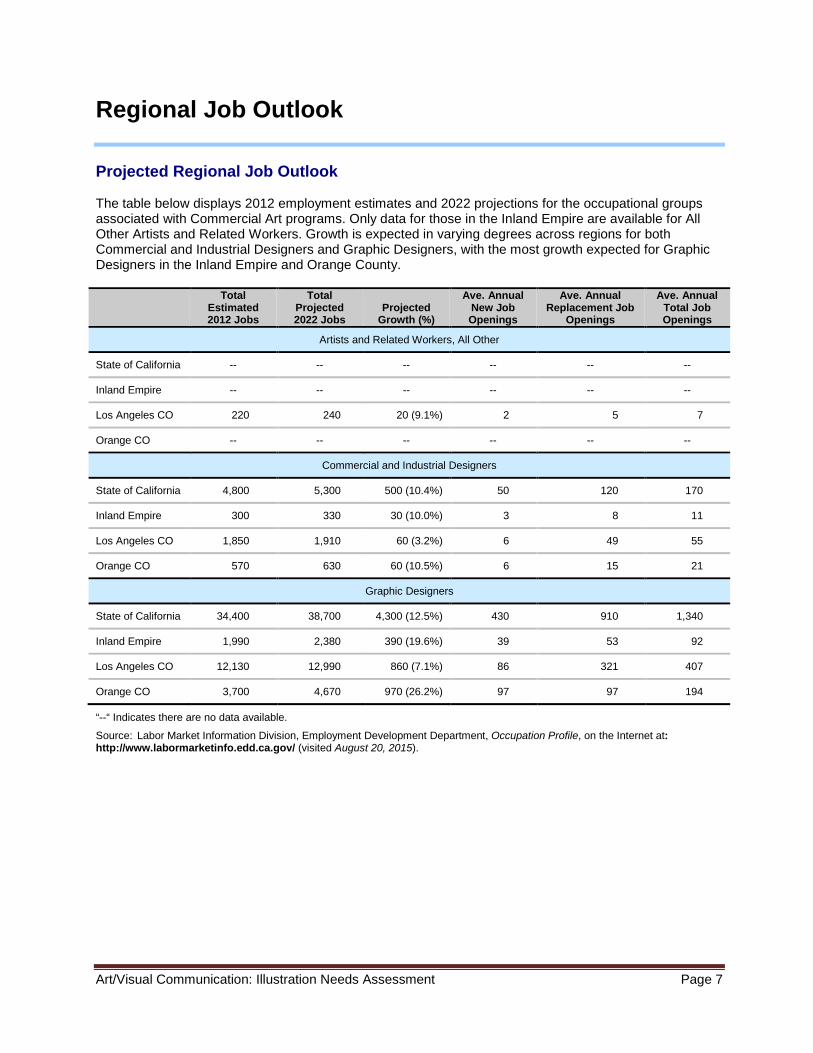
Regional Job Outlook Projected Regional Job Outlook The table below displays 2012 employment estimates and 2022 projections for the occupational groups associated with Commercial Art programs. Only data for those in the Inland Empire are available for All Other Artists and Related Workers. Growth is expected in varying degrees across regions for both Commercial and Industrial Designers and Graphic Designers, with the most growth expected for Graphic Designers in the Inland Empire and Orange County.
Total
Estimated 2012 Jobs
Total Projected 2022 Jobs
Projected Growth (%)
Ave. Annual New Job Openings
Ave. Annual Replacement Job
Openings
Ave. Annual Total Job Openings
Artists and Related Workers, All Other
State of California -- -- -- -- -- --
Inland Empire -- -- -- -- -- --
Los Angeles CO 220 240 20 (9.1%) 2 5 7
Orange CO -- -- -- -- -- --
Commercial and Industrial Designers
State of California 4,800 5,300 500 (10.4%) 50 120 170
Inland Empire 300 330 30 (10.0%) 3 8 11
Los Angeles CO 1,850 1,910 60 (3.2%) 6 49 55
Orange CO 570 630 60 (10.5%) 6 15 21
Graphic Designers
State of California 34,400 38,700 4,300 (12.5%) 430 910 1,340
Inland Empire 1,990 2,380 390 (19.6%) 39 53 92
Los Angeles CO 12,130 12,990 860 (7.1%) 86 321 407
Orange CO 3,700 4,670 970 (26.2%) 97 97 194
“--“ Indicates there are no data available.
Source: Labor Market Information Division, Employment Development Department, Occupation Profile, on the Internet at: http://www.labormarketinfo.edd.ca.gov/ (visited August 20, 2015).
Art/Visual Communication: Illustration Needs Assessment Page 8
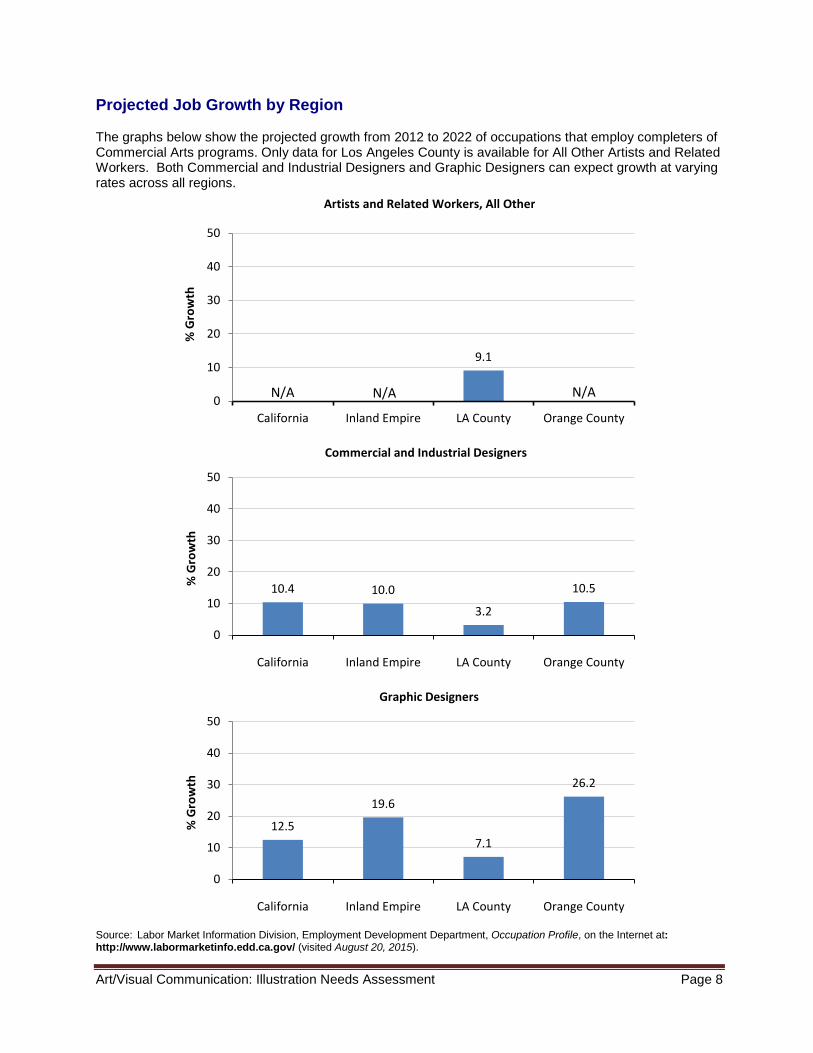
Projected Job Growth by Region The graphs below show the projected growth from 2012 to 2022 of occupations that employ completers of Commercial Arts programs. Only data for Los Angeles County is available for All Other Artists and Related Workers. Both Commercial and Industrial Designers and Graphic Designers can expect growth at varying rates across all regions.
Source: Labor Market Information Division, Employment Development Department, Occupation Profile, on the Internet at: http://www.labormarketinfo.edd.ca.gov/ (visited August 20, 2015).
9.1
0
10
20
30
40
50
California Inland Empire LA County Orange County
% G
row
th
Artists and Related Workers, All Other
N/A N/A N/A
10.4 10.0
3.2
10.5
0
10
20
30
40
50
California Inland Empire LA County Orange County
% G
row
th
Commercial and Industrial Designers
12.5
19.6
7.1
26.2
0
10
20
30
40
50
California Inland Empire LA County Orange County
% G
row
th
Graphic Designers
Art/Visual Communication: Illustration Needs Assessment Page 9
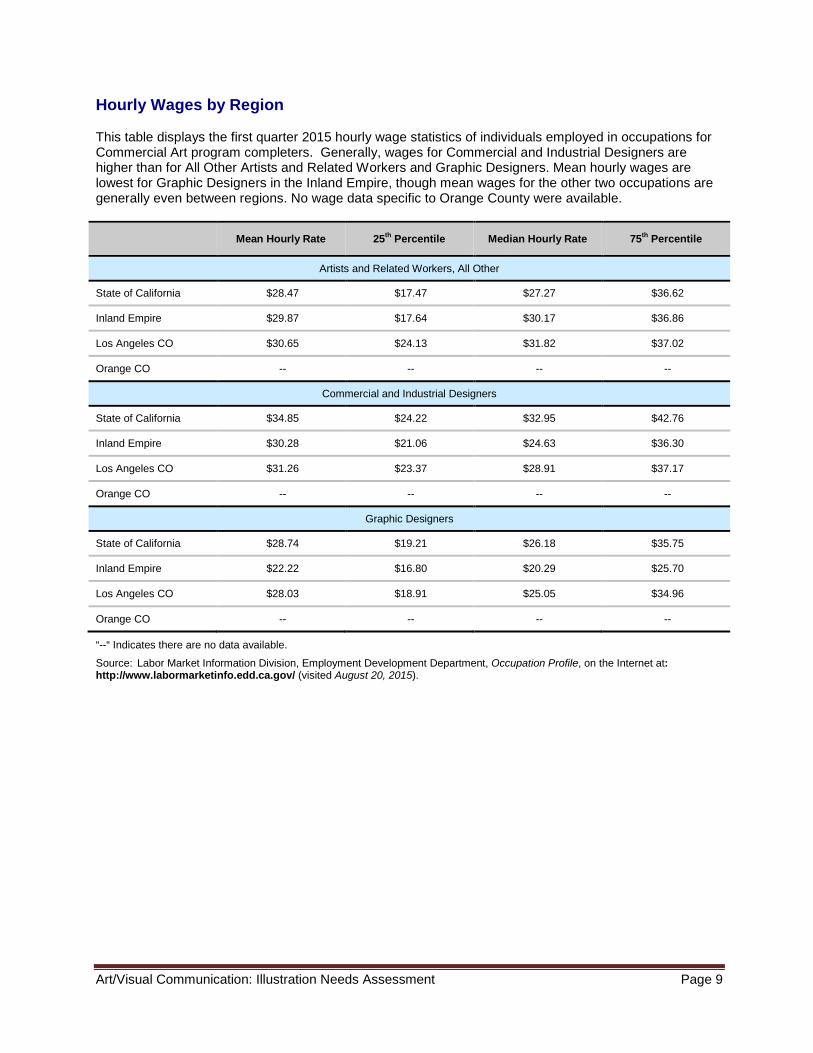
Hourly Wages by Region This table displays the first quarter 2015 hourly wage statistics of individuals employed in occupations for Commercial Art program completers. Generally, wages for Commercial and Industrial Designers are higher than for All Other Artists and Related Workers and Graphic Designers. Mean hourly wages are lowest for Graphic Designers in the Inland Empire, though mean wages for the other two occupations are generally even between regions. No wage data specific to Orange County were available.
Mean Hourly Rate 25th Percentile Median Hourly Rate 75th Percentile
Artists and Related Workers, All Other
State of California $28.47 $17.47 $27.27 $36.62
Inland Empire $29.87 $17.64 $30.17 $36.86
Los Angeles CO $30.65 $24.13 $31.82 $37.02
Orange CO -- -- -- --
Commercial and Industrial Designers
State of California $34.85 $24.22 $32.95 $42.76
Inland Empire $30.28 $21.06 $24.63 $36.30
Los Angeles CO $31.26 $23.37 $28.91 $37.17
Orange CO -- -- -- --
Graphic Designers
State of California $28.74 $19.21 $26.18 $35.75
Inland Empire $22.22 $16.80 $20.29 $25.70
Los Angeles CO $28.03 $18.91 $25.05 $34.96
Orange CO -- -- -- --
“--“ Indicates there are no data available.
Source: Labor Market Information Division, Employment Development Department, Occupation Profile, on the Internet at: http://www.labormarketinfo.edd.ca.gov/ (visited August 20, 2015).
Art/Visual Communication: Illustration Needs Assessment Page 10
Largest and Fastest Growing Industry Employers
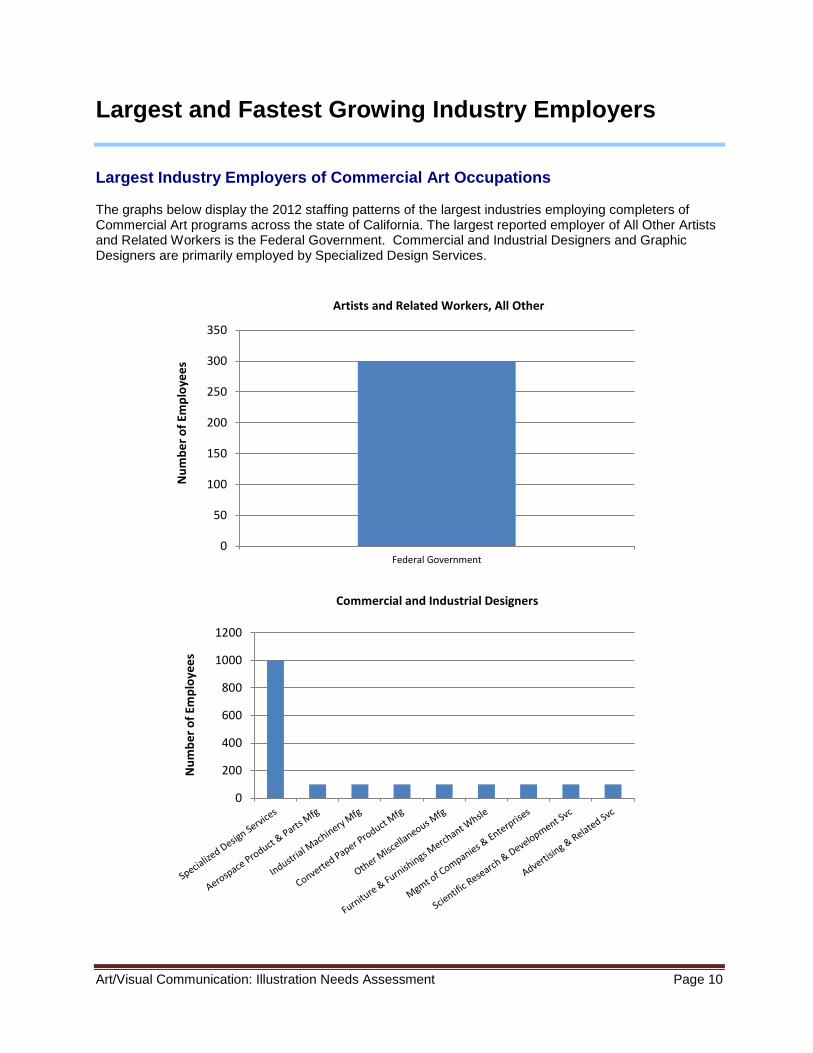
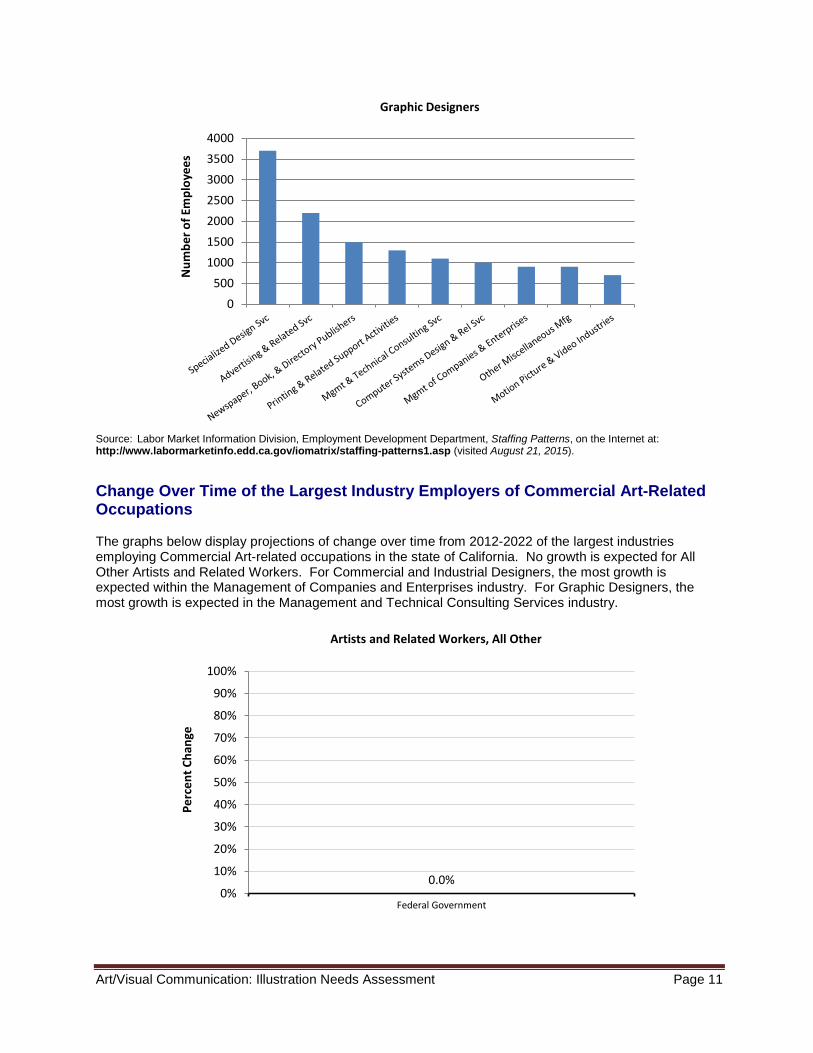
Largest Industry Employers of Commercial Art Occupations The graphs below display the 2012 staffing patterns of the largest industries employing completers of Commercial Art programs across the state of California. The largest reported employer of All Other Artists and Related Workers is the Federal Government. Commercial and Industrial Designers and Graphic Designers are primarily employed by Specialized Design Services.
0
50
100
150
200
250
300
350
Federal Government
Num
ber o
f Em
ploy
ees
Artists and Related Workers, All Other
0
200
400
600
800
1000
1200
Num
ber o
f Em
ploy
ees
Commercial and Industrial Designers
Art/Visual Communication: Illustration Needs Assessment Page 11
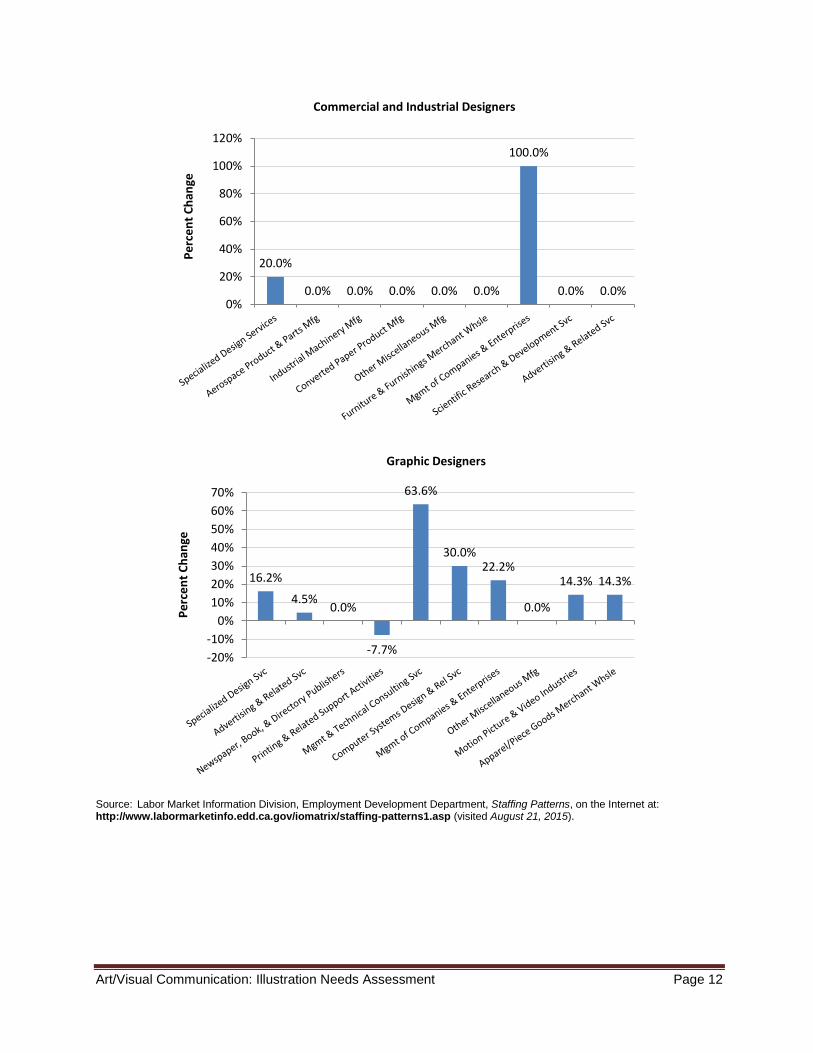
Source: Labor Market Information Division, Employment Development Department, Staffing Patterns, on the Internet at: http://www.labormarketinfo.edd.ca.gov/iomatrix/staffing-patterns1.asp (visited August 21, 2015). Change Over Time of the Largest Industry Employers of Commercial Art-Related Occupations The graphs below display projections of change over time from 2012-2022 of the largest industries employing Commercial Art-related occupations in the state of California. No growth is expected for All Other Artists and Related Workers. For Commercial and Industrial Designers, the most growth is expected within the Management of Companies and Enterprises industry. For Graphic Designers, the most growth is expected in the Management and Technical Consulting Services industry.
0500
1000150020002500300035004000
Num
ber o
f Em
ploy
ees
Graphic Designers
0.0% 0%
10%
20%
30%
40%
50%
60%
70%
80%
90%
100%
Federal Government
Perc
ent C
hang
e
Artists and Related Workers, All Other
Art/Visual Communication: Illustration Needs Assessment Page 12
Source: Labor Market Information Division, Employment Development Department, Staffing Patterns, on the Internet at: http://www.labormarketinfo.edd.ca.gov/iomatrix/staffing-patterns1.asp (visited August 21, 2015).
20.0%
0.0% 0.0% 0.0% 0.0% 0.0%
100.0%
0.0% 0.0% 0%
20%
40%
60%
80%
100%
120%
Perc
ent C
hang
e
Commercial and Industrial Designers
16.2%
4.5% 0.0%
-7.7%
63.6%
30.0% 22.2%
0.0%
14.3% 14.3%
-20%-10%
0%10%20%30%40%50%60%70%
Perc
ent C
hang
e
Graphic Designers
Art/Visual Communication: Illustration Needs Assessment Page 13
Regional Graduation Summary
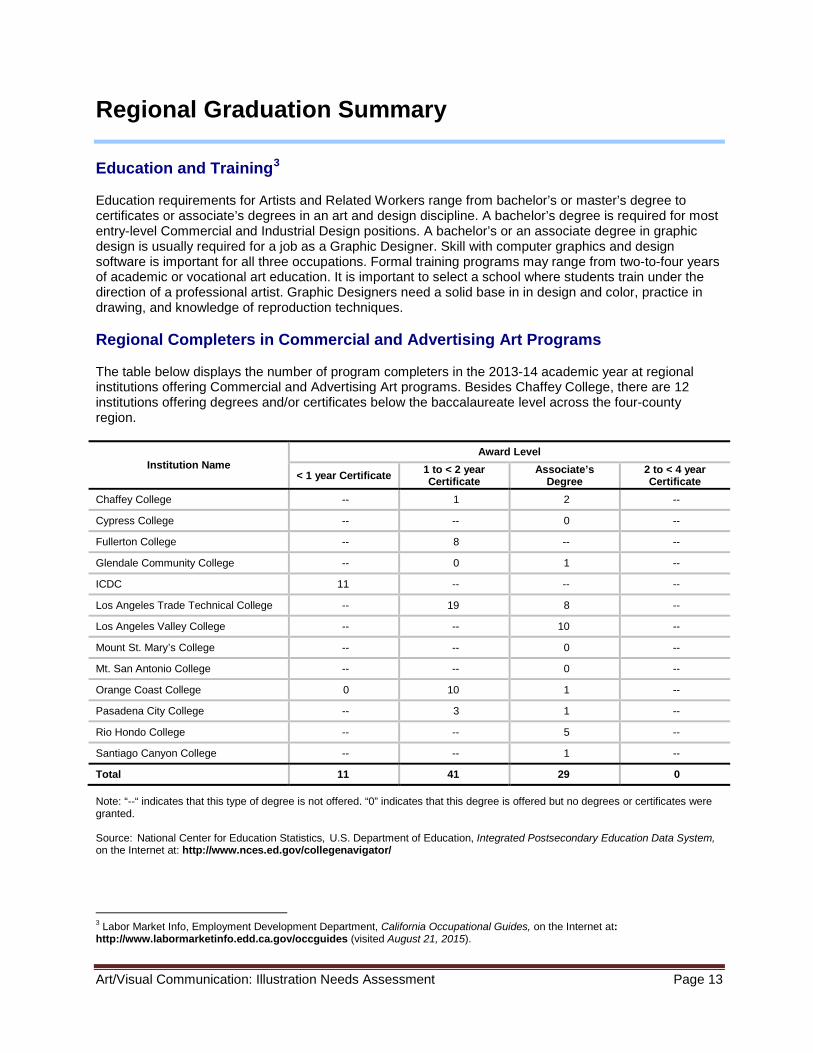
Education and Training3 Education requirements for Artists and Related Workers range from bachelor’s or master’s degree to certificates or associate’s degrees in an art and design discipline. A bachelor’s degree is required for most entry-level Commercial and Industrial Design positions. A bachelor’s or an associate degree in graphic design is usually required for a job as a Graphic Designer. Skill with computer graphics and design software is important for all three occupations. Formal training programs may range from two-to-four years of academic or vocational art education. It is important to select a school where students train under the direction of a professional artist. Graphic Designers need a solid base in in design and color, practice in drawing, and knowledge of reproduction techniques. Regional Completers in Commercial and Advertising Art Programs The table below displays the number of program completers in the 2013-14 academic year at regional institutions offering Commercial and Advertising Art programs. Besides Chaffey College, there are 12 institutions offering degrees and/or certificates below the baccalaureate level across the four-county region.
Institution Name Award Level
< 1 year Certificate 1 to < 2 year Certificate
Associate’s Degree
2 to < 4 year Certificate
Chaffey College -- 1 2 --
Cypress College -- -- 0 --
Fullerton College -- 8 -- --
Glendale Community College -- 0 1 --
ICDC 11 -- -- --
Los Angeles Trade Technical College -- 19 8 --
Los Angeles Valley College -- -- 10 --
Mount St. Mary’s College -- -- 0 --
Mt. San Antonio College -- -- 0 --
Orange Coast College 0 10 1 --
Pasadena City College -- 3 1 --
Rio Hondo College -- -- 5 --
Santiago Canyon College -- -- 1 --
Total 11 41 29 0 Note: “--“ indicates that this type of degree is not offered. “0” indicates that this degree is offered but no degrees or certificates were granted. Source: National Center for Education Statistics, U.S. Department of Education, Integrated Postsecondary Education Data System, on the Internet at: http://www.nces.ed.gov/collegenavigator/ 3 Labor Market Info, Employment Development Department, California Occupational Guides, on the Internet at: http://www.labormarketinfo.edd.ca.gov/occguides (visited August 21, 2015).
Art/Visual Communication: Illustration Needs Assessment Page 14
Chaffey College’s Performance on Core Indicators
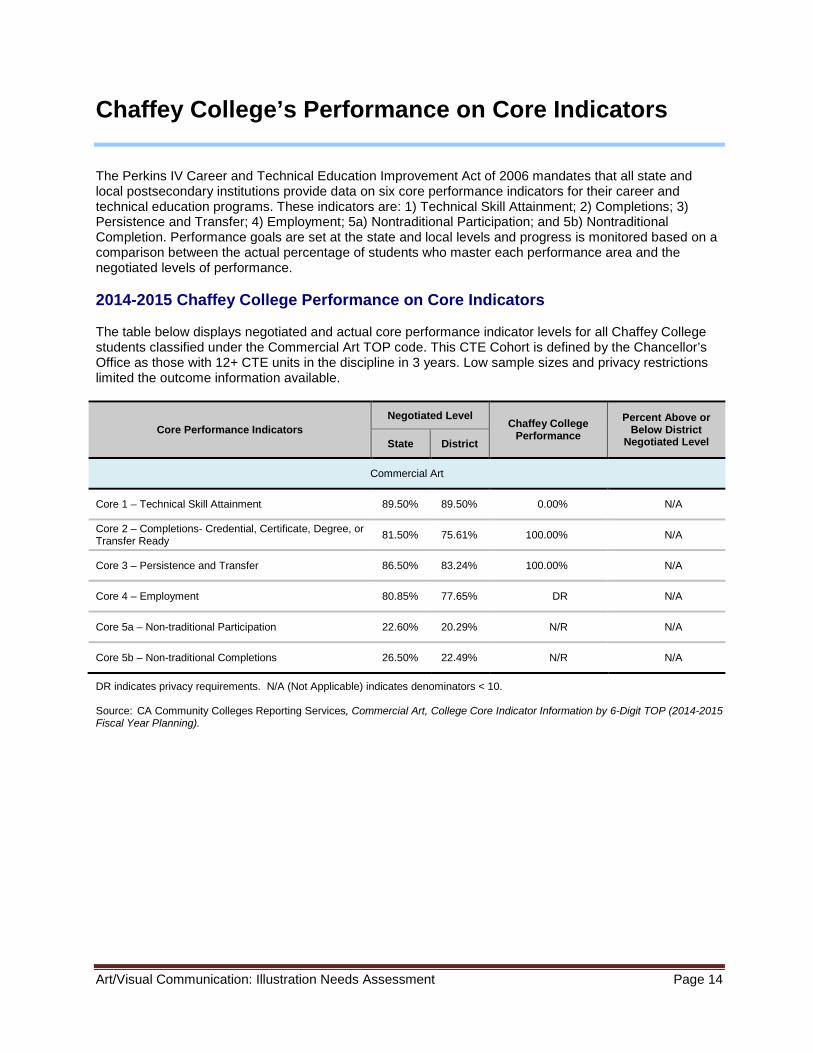
The Perkins IV Career and Technical Education Improvement Act of 2006 mandates that all state and local postsecondary institutions provide data on six core performance indicators for their career and technical education programs. These indicators are: 1) Technical Skill Attainment; 2) Completions; 3) Persistence and Transfer; 4) Employment; 5a) Nontraditional Participation; and 5b) Nontraditional Completion. Performance goals are set at the state and local levels and progress is monitored based on a comparison between the actual percentage of students who master each performance area and the negotiated levels of performance. 2014-2015 Chaffey College Performance on Core Indicators The table below displays negotiated and actual core performance indicator levels for all Chaffey College students classified under the Commercial Art TOP code. This CTE Cohort is defined by the Chancellor’s Office as those with 12+ CTE units in the discipline in 3 years. Low sample sizes and privacy restrictions limited the outcome information available.
Core Performance Indicators Negotiated Level
Chaffey College Performance
Percent Above or Below District
Negotiated Level State District
Commercial Art
Core 1 – Technical Skill Attainment 89.50% 89.50% 0.00% N/A
Core 2 – Completions- Credential, Certificate, Degree, or Transfer Ready 81.50% 75.61% 100.00% N/A
Core 3 – Persistence and Transfer 86.50% 83.24% 100.00% N/A
Core 4 – Employment 80.85% 77.65% DR N/A
Core 5a – Non-traditional Participation 22.60% 20.29% N/R N/A
Core 5b – Non-traditional Completions 26.50% 22.49% N/R N/A
DR indicates privacy requirements. N/A (Not Applicable) indicates denominators < 10. Source: CA Community Colleges Reporting Services, Commercial Art, College Core Indicator Information by 6-Digit TOP (2014-2015 Fiscal Year Planning).