as geography population
TRANSCRIPT

ASGEOGRAPHYPOPULATION

BOOK RESOURCEThis presentation is using This presentation is using the curricula activities and the curricula activities and exercises from the exercises from the following book:following book:
GEOGRAPHY – An Integrated GEOGRAPHY – An Integrated Approach by David Waugh, Approach by David Waugh, fourth edition.fourth edition.
IntroductionAnswer the following from Ch13 (pg344)
What is ‘demography’?
Define the term ‘population distribution’.
Using fig 13.1 describe the population distribution patterns shown (identify areas of high & low distribution).
Why is fig 13.1 misleading?
Define the term ‘population density’ - quantify.
List what affects distribution at a Global and Regional/Local scales.
Only 11% of the Earth’s land surface presents no serious limitations to settlement and agriculture. What prevents this on the other 89%?
Using figure 13.4 draw 2 star diagrams. One to highlight factors affecting ‘Sparsely Populated Areas’ and one to highlight factors of ‘Densely Populated Areas’.
Using figure 13.5 describe and explain the population distribution and densities of Brazil.

Population GrowthRead the extract from the Guardian newspaper from 14th August 1999 and answer the following questions:
1. Briefly describe the main features of world population since 1950.
2. Why should we be suspicious about the accuracy of projections of future world population size?
3. What factors might explain the differences in the levels of fertility between more economically developed countries (MEDC’s) and less economically developed countries (LEDC’s)?
4. What, according to the article, are the possible consequences of future increases in the world’s population?

The worlds population now stands at just over 6.5 billion people.
The world’s growth rate is determined by the simple equation:
Births (fertility) – Deaths (mortality) = Growth Rate
Before the 18th century the population growth was very slow (almost zero) because the high birth rate was cancelled out by widespread disease, wars and famines (high death rate).
However since then due to rapid medical and technological advances the death rate has fallen rapidly while the birth rate has remained high = Population Explosion.

FertilityFertility is measured by the Birth Rate (total number of live births per year per 1000 people in the population).
The level of the birth rate is linked with economic development, status of women, religion and social customs & levels of health care.
Graph the population increases from 1900 – 2100 for developing, developed and world population.
Write a brief summary of the trends in the graph.

Global Fertility Rates
From the map we can clearly see the higher fertility rates in the LEDC’s and the lower in the MEDC’s.

MEDC Fertility RatesMany MEDC countries have seen a decline in fertility rates in the post war years.However many (including New Zealand) experienced an immediate post war ‘Baby Boom’ and a subsequent ripple effect boom from the next generation.This can be seen in the below diagram showing ‘Births in England and Wales, 1945-91’.

Mortality
Measurements of mortality indicate the rate at which people are dying in a population.
The simplest measure is ‘death rate’ (the total number of deaths per year for every 1000 people in the population).
As with birth rates, death rates can be linked to levels of economic development.
Another measure is the standardised mortality ratio (SMR) which compares the number of actual deaths for a particular place with the expected in that place allowing for different proportions of age and sex groupings.

How does population change over time?
Natural Increase (NI) = BR – DR
Birth rates and death rates have been closely linked to the economic development of a country.
They point out that changes like industrialisation and urbanisation lead to transition in which high BR & DR are gradually replaced by low BR & DR.
This is shown in the 4 stage ‘Demographic Transition Model’.
This model can be used to compare countries at a particular time or track the transition of a single country in its development history.

Copy diagram above and add stage names (pg350)For each stage state the level of the BR & DR and the effect of Natural Increase.Detail the main causes for the BR & DR levels for each stage From page 351 briefly explain the main factors that limit the models effectiveness.
The Demographic Transition Model

Birth & Death Rates by Continent1. On the graph Fig 4.12 plot
the figures for Latin America
2. State the continent which in 1995 had the:
a. highest birth rate
b. highest death rate
3. Give reasons for the answers to (2).
4. Why could Natural Increase differ from actual population change.
5. Write a paragraph to describe the trends shown in fig 14.2 and the implications of the differences in growth rate.

Population StructureAnswer the following from Ch13 (pg353)
Define the term ‘Life Expectancy’.
Describe how ‘Population or Age/Sex pyramids’ are constructed.
Why is the use of ‘Population or Age/Sex pyramids’ useful for analysing population structure?
Copy the basic shape of the pyramid shown in figure 13.13 (1999 UK) then copy the bullet points noting the features about its shape.
Copy fig 13.14: Characteristic pyramid shapes for each stage of the DTM. Label with real world examples (Fig 13.15) – read 1st column pg 354.

Dependency Ratio
Answer the following from Ch13 (pg354)Who are described as ‘Economically Active’?
Who are described as the ‘Non-Economically Active’?
What does the Dependency Ratio tell us about a population?
How can the Dependency Ratio be expressed as an equation?

Trends in Population Growth
Read pgs355-360 and list the trends in population growth under the following headings:
Global TrendsRegional TrendsBirth Rates, Total Fertility Rates and Replacement RatesDeath Rates and Life Expectancy
Japanese case study: Copy the text box and Fig 13.27 (pyramid shapes only).

Comparing Population PyramidsThere are important differences in the shape of the population pyramids for MEDC’s and LEDC’s, which result from differences in their population structure.
In general a population pyramid for a developing country has a wide base which indicates a youthful population (as a result of high birth rates), and a narrow top (less people in the older age groups because average life expectancy is lower).
In contrast, the population pyramid for a developed country has a narrower base (due to a lower birth rate) and a wider top (reflecting a longer average life expectancy).

Kenya: Rapid Growth
Kenya is typical of a LEDC experiencing rapid population growth.
Kenya’s population pyramid’s wide base indicates large numbers of dependant children aged 0-14, which is a result of high levels of fertility.
The top of the pyramid is narrow indicating a smaller proportion of the population lives to old age.
Implications:• Limited resources (schooling, nutrition
& health) will be stretched by large numbers of young dependants.
• As this group reaches working age large numbers of new jobs will need to be created to support themselves.
• As this group reaches child bearing age fertility rates will be high, leading to continued high natural increase.

USA & Denmark: Slow & Zero GrowthThe USA is typical of a MEDC experiencing slow rates of natural increase. The population pyramid’s narrow base reflects a low birth rate and the wider top is the result of people living longer. The 30-34 age ‘bulge’ is a result of the 1960’s baby boom.
While the pyramid for Denmark is similar to the USA it represents zero growth (death rates cancel out birth rates). It’s shape is more like a column than a pyramid with people are distributed more evenly within the cohorts.
The USA and Denmark both face the prospect of an increasing dependency ratio and the task of a smaller work force needing to generate enough wealth to support a large dependant population.

Population and Resources The world’s
population is growing very rapidly.
95% of population growth is taking place in LEDC’s.
Population growth creates great pressures on governments to provide for people; increased pressures on the environment; increased risk of famine and malnutrition; and greater differences between the richer countries and the poorer countries.
From page 376 define the terms ‘Optimum, Over & Under population (give examples)

The Principles of Thomas Malthus In his ‘Essays on the Principle of Population
Growth’ 1798, the reverend Thomas Malthus predicted that there was a finite population size in relation to food supply.
He stated that any increase in population beyond this point would lead to a decline in the standard of living and to “war, famine and disease”.
His theory was based on two principles:
Food supply at best only increases at an arithmetic rate, i.e. 1,2,3,4,5 etc.
Population grows at a geometric or exponential rate, in the absence of checks, i.e. 1,2,4,8,16 etc.

Malthus suggested two ways in which population growth could be reduced: Delayed age of marriage Abstinence from sex
From page 378 explain what is meant by ‘Carrying Capacity of the Environment’ & copy & explain Figure 13.58

The Theories of Esther Boserup
Esther Boserup, 1965, believed that people have the resources of knowledge and technology to increase food production. She suggested that in pre-industrial society, an increase in population brought about a change in agricultural techniques to allow for an increase in food production. Thus population growth enabled agricultural development to occur.
Boserup assumed that people knew of the techniques required by more intensive systems and used them when the population grew. If knowledge was not available then the agricultural system would regulate the population size in a given area until people would find new ways of increasing food production.

Increased Food Production
There have been many ways since Malthus’s time that people have increased food production – These include:
Draining marshlands Reclaiming land from the sea Cross breeding of cattle Developing high yielding varieties of plants (HYV’s) Terracing of steep slopes Growing crops in greenhouses Using more sophisticated irrigation techniques Making new foods such as soya Making artificial fertilisers Farming native species of crops and animals Fish farming & aquaculture
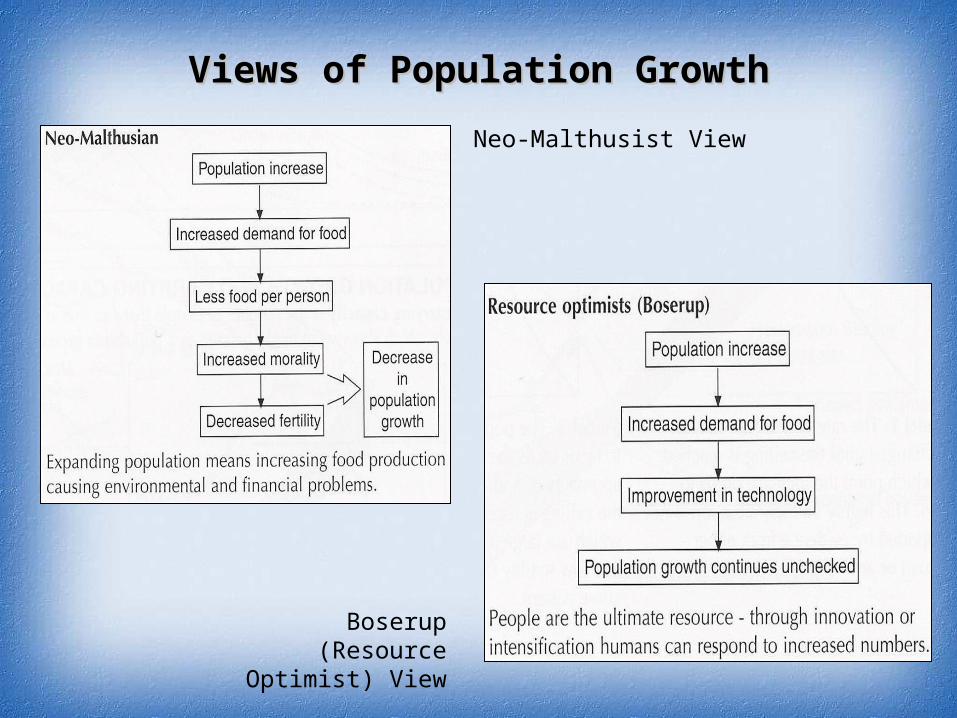
Views of Population GrowthViews of Population Growth
Neo-Malthusist View
Boserup (Resource Optimist) View

1. Why did population control become an urgent necessity in China?
a) Development of the economy >>> increased standard of living = increase in population growth (after revolution).
2. The Chinese census of 1982 saw the population reach 1008 million. What % was under 21 years of age?
a) 50% of China’s population was under 21 years of age.
3. Between 1982 – 2000 more than 11 million couples reached child bearing age each year. How many new babies were born every year?
a) At least 10 million new babies were born every year. (84.3 million have been born since 1/1/2000)

4. What are the benefits of the extended families in the rural areas? Why have large families?
a) Provides labour for farms, support for young families, security in old age etc.
5. Although the ‘One Child’ policy is not enforced in many rural areas with national minority populations how many children are they ‘advised’ to have?
a) 2 children – to maintain minority populations.
6. In Beijing what % of mothers work?
a) 97% of mothers in Beijing work.
7. How much of the world’s arable land does China have to produce enough food for ¼ of the worlds population??
a) China has 7% of the world’s arable land area.

What actions have the Chinese government implemented to reduce China’s growth rate? The ‘One Child’ Policy – mass propaganda campaign
Family Planning (sex education, contraception)
Birth control social ideology indoctrination (incl. social pressure).
Preferential treatment for families with one child:
Housing, schools, subsidised utilities, land, healthcare, employment
Penalties for couples who have 2 or more children.
Free abortions for unwanted pregnancies
Raise marriage age, birth quota system.
State kindergartens
Worker peer pressure / community responsibilities system.

What are the effects of the ‘One Child Policy’?
Society with no siblings >>> no aunties or uncles.
Lack of security in old age for many citizens.
Ageing population (fewer children)
Increase in standard of living
Reduce pressures on urban housing shortages
Changing attitudes to family structure (extended to nuclear)
Desire to have boys (female infanticide & future population structure gender imbalance)
Loss of rural labour force >> mechanisation
Majority of children are only children >> behavioural problems

Exam Question on Population Control