as the river flows - sierra club
TRANSCRIPT

As The River FlowsRiver Prairie Group’s 2012 Status Report on the Health of Salt Creek-DuPage River Watershed
Explore, enjoy and protect the planet

22
This report would not be possible without the work of the following volunteers who collected and tested water samples at specific sites along Salt Creek, the East Branch of the DuPage River, and West Branch of the DuPage River.
Collectors: Jane Foulser (collector trainer), Joe Dick, Patti Schiewe & Kevin Clower, Judy Toth , Karen Tredinnick, Chris Cyrsler, Dennis Clark, Shannon Burns, George Gibson III, Jessica Klaibor, Melinda Keith-Singleton
Testers: Mary Ann Ciesla (Monitoring assistant), Bob Barbieri (Technical advisor), Bonnie Blake (Volunteer coordinator), Katie LaGory, Steve Griffin, Linda Volin
Special thanks also goes to Lonnie Morris, Bob Barbieri, Tom Richardson, Dennis Striecher and Tess Wendel for their assistance in editing and producing the final report.
Table of ContentsThe River Monitoring Project: Sierra Club’s Investment in DuPage County 4 DuPage County Watersheds 5River Monitoring Project Results 6 Discussion of Findings 11Healthy DuPage Streams- Still A Way to Go 12Healthy DuPage Streams- A Call to Action 14 Illinois State 14 Muncipalities and Counties 15 Residents 17
Executive Summary
The River Prairie Group is the local section of the Sierra Club and is made up of members in the greater DuPage County Illinois area. The group’s river monitoring network is entirely volunteer run and this report is a result of over a decades worth of monitoring and involvement in local environmental planning efforts. This report is designed to illustrate the water quality monitoring that has been done by the group and put it in context of current work and the greater vision for improved water quality in the DuPage-Salt Creek Watersheds and the state of Illinois.
The water quality in the watersheds continues to reflect the urbanization of the county. The monitoring shows elevated levels of nitrate and phosphate which mostly come from fertilizer runoff either directly into our waters or through wastewater that is collected and treated by wastewater facilities. The nutrients lead to low levels of dissolved oxygen or big fluxes in dissolved oxygen levels which are detrimental to aquatic life. Chloride levels are often in violation with the national aquatic life criteria due to road salt use in the winter time.
Water sample testing revealed a substantial change to the watershed’s water quality between 2007-2008 in Salt Creek. We believe this is due to a nutrient removal project at the Egan Wastewater Treatment Facility that was implemented between February of 2007 through December of 2008 that was unfortunately discontinued. The group also continues to find low levels of nutrients in St Joseph Creek that are rarely observed in the watershed. The excellent water quality in St Joesph Creek make it a perfect candidate for habitat restoration. DuPage County should also consider a ban on the application of phosphorus-containing fertilizer and a ban on coal-tar sealants containing polycyclic aromatic hydrocarbons (PAH), which are carcinogenic. These measures would lead to improved water quality not only in St Joseph Creek but in all three watersheds and downstream in the Gulf of Mexico.
The latter half of the report summarizes work done by the state, county and municipalities to improve water quality. Since the River Prairie Group began monitoring in 2000 substantial steps have been taken to address chloride and nutrient pollution but there is still work to be done. Maintaining vegetative buffers along waterways, controlling stormwater runoff from construction sites and implementing green infrastructure will greatly benefit the Salt Creek and DuPage River watersheds.
3

Introduction
The south-flowing streams of DuPage County are a result of the last glaciation of the area 13,000 years ago. Later, Native Americans and then European immigrants moved into the area. By the early part of the 20th century, towns had sprouted along the three rail lines that traverse the county, while the rest of the county was farmed. After WWII, people began flocking to the newly suburbanized area, which grew to have the second largest population in the state. Consequently, the landscape of DuPage County was converted first from native prairie and wetland to farmland, then to homes, roads, and businesses. In the process, over 90% of the county’s original wetlands were lost, and 51% of its streams were channelized.
Today the water quality of Salt Creek and the East and West Branches of the DuPage River reflect the urbanization of the county. All three fail to meet state water quality standards, and clean-up plans are underway. This document is an update of Sierra Club- River Prairie Group’s 2001 Troubled Waters in DuPage County and the 2008 Restoring DuPage County Rivers reports and presents the group’s latest river testing results. The report also documents the progress being made in restoring the county’s rivers to good health and offers recommendations for municipalities and local citizens to further these efforts.
The River Monitoring Project: Sierra Club’s Investment in DuPage County
DuPage County’s local Sierra Club group, the River Prairie Group, conducts regular monitoring on rivers throughout the county. Their River Monitoring Project, launched in January 2000, performs quarterly and monthly testing on a number of sites on Salt Creek and the East and West Branches of the DuPage River1. Most aspects of the tests are performed by local Sierra Club volunteers2. The group summarizes the test results on their website, to educate DuPage residents about the waterways in their backyards3. The test data is valuable to researchers, educators, and policymakers, and has ongoing value in providing a baseline for future analysis of changes in the rivers’ water quality.
River samples are routinely tested for four chemical compounds (phosphate, nitrate, ammonia, chloride), temperature, pH, and in some areas, dissolved oxygen, radioactive isotopes, and mercury4. The first four chemical compounds pose the greatest threat to DuPage County’s watersheds, but it is worth noting that
Point source pollution comes from specific sources such as Publically Owned Treatment Works (POTWs) or industrial facilities that literally have a point (a pipe) from which they discharge wastewater into a body of water. Recently the Illinois Environmental Protection Agency (IEPA) has also designated storm water discharges from storm systems as a point source.
Non-point source pollution is pollution that enters streams in rain and snowmelt runoff from lawns, streets, and farmland through open ditches and direct overland means. Examples include urban runoff of motor oil, road salt, lawn fertilizers, and pesticides into storm ditches during storm events.
1 Hereafter, the East Branch and West Branch are collectively referred to as DuPage River branches.2 River samples are analyzed using Hach Chemical Co. tests with a Hach 2010 spectrophotometer and a digital titrator as well as a pH probe and thermometer. Measurements of radioactive isotopes and mercury are performed by a commercial lab.3All river monitoring data collected by River Prairie Group volunteers are posted at the group’s website at illinois.sierraclub.org/rpgwatermonitorproj.htm. The group also provides their data to the Illinois EPA and the DuPage River Salt Creek Workgroup for use in their river assessment programs.4Testing does not include all potentially harmful pollutants in these streams. There are many pollutants, such as heavy metals, organic chemicals, pesticides, endocrine-disrupting chemicals, and others, which may cause serious problems in these waterways, but the tests are sophisticated and expensive and exceed River Prairie Group’s resources.
4

the first two are not toxics – in fact, they are just the opposite. Categorized as “nutrients”, phosphate and nitrate act as fertilizers that feed algae and aquatic plants, and in sufficient concentrations, fuel their overgrowth leading to eutrophication resulting in low levels of dissolved oxygen harming aquatic life. Ammonia, too, acts as a fertilizer, but in addition, it is highly toxic to aquatic organisms. Due to their use in landscaping and agricultural fertilizers, these compounds enter our streams as non-point source pollution but they are also present in Publicly Owned Treatment Works (POTW) discharges. Chloride is found in POTW discharge but its primary source in DuPage Rivers is from road salt runoff in wintertime.
The Watersheds of DuPage County
The DuPage River Watershed covers major portions of DuPage and Will counties, and minor portions of Cook, Grundy, Kane, and Kendall counties. The river’s headwaters consist of east and west branches. The East Branch originates in Bloomingdale’s West Lake, and the West Branch in Schaumburg. The two branches meander south until Bolingbrook, where they converge as the DuPage River just south of the Will-DuPage county line. The DuPage River flows south to its confluence with the Des Plaines River in Channahon.
The Salt Creek Watershed lies just east of the DuPage River Watershed. Salt Creek runs from Inverness south to Lyons, traveling approximately 40 miles
eutrophication (noun): the process by which a body of water becomes enriched in nutrients that stimulate the growth of algae and other aquatic plant life often resulting in the depletion of dissolved oxygen.
River Prairie Group Sampling Sites in the DuPage River-Salt Creek Watersheds
5
Stream Length (miles) Watershed Area (sq miles)E. Branch DuPage River 24 79W. Branch DuPage River 35 127Salt Creek 40 150

before emptying into the Des Plaines River.
Together the Des Plaines, DuPage and the Kankakee Rivers form the headwaters of the Illinois River which empties into the Mississippi River, which empties into the Gulf of Mexico. These connections mean that nutrient pollution in DuPage County is not simply a local problem but affects communities downstream. In this way, the River Monitoring Project embodies the adage, “think globally, and act locally.”
River Monitoring Project Results
Phosphate: Phosphorus, usually found as the compound phosphate, is a naturally occurring element abundant in our rich Illinois soils and is a necessary nutrient for animal and plant growth. In undisturbed watersheds little phosphorus reaches the water as most runoff infiltrates into the ground. Natural levels of phosphate in streams are thought to be very low, probably much less than we normally find in Illinois rivers and streams. For example, the U.S. EPA considers total phosphorus levels of 0.0765 mg/L to be indicative of pristine streams in the Midwest ecosystem.
In the largely disturbed watershed in DuPage County the greatest source of phosphate is likely stormwater runoff from lawns and gardens. Phosphate is the limiting nutrient for growth which means this nutrient heavy runoff leads to algal overgrowth, especially where there is abundant sunlight and slower moving waters. Excess algae can cause dissolved oxygen (DO) levels to drop to extremely low levels suffocating aquatic life. Furthermore, wide fluctuations in DO levels due to algal activity have been shown to be detrimental to aquatic life, even when low levels of DO are not reached.5,6 Additionally, eutrophication promotes blue-green algae (cyanobacteria) which release toxins known to make people and animals sick.
Publicly Owned Treatment Plants (POTWs) discharge into DuPage County’s streams on a daily basis, and while they are required to control for many different pollutants, Illinois only recently required
plants discharging into rivers and streams to control, or even monitor, the levels of phosphorus. In 2006 the Pollution Control Board ruled that new and expanded POTWs will limit phosphorus concentrations in discharges to 1mg/L or less.
FindingsMedian phosphate levels have decreased significantly in Salt Creek while the levels in the DuPage River Branches have stayed more constant. The observed decrease at Salt Creek happened between 2007-2008 and is most likely a result of the test nutrient removal program at a treatment facility upstream. During those two years phosphate levels
5 Minnesota Nutrient Criteria Development November 2010. http://www.pca.state.mn.us/index.php/view-document.html?gid=14947 6 Miltner J., A Method and Rationale for Deriving Nutrient Criteria for Small Rivers and Streams in Ohio Environmental Management, DOI 10.1007/s00267-010-9439-9 (2010)6
0
0.5
1
1.5
2
2.5
W. Branch E. Branch Salt Creek St. Joseph
Creek
Phoshp
ate-‐P (m
g/L)
Phosphorus
2000-‐2006
2007-‐2011
State Median Level
PrisBne Stream

(measured as Phosphate-P) were between 0.25-0.50 mg/L but more recent data show levels around 2.0 mg/L which is similar to levels found between 2000-2006. Phosphate concentrations often exceeded the statewide median of 0.2 mg/L with the highest levels found in the West Branch of the DuPage River7. Only St. Joseph Creek, a tributary to the East Branch, had low levels of phosphorus (0.1 mg/L phosphate-P median value) approaching the US EPA’s levels indicative of pristine streams. Nitrate: Nitrate like phosphate is a nutrient integral for supporting plant growth. However, if concentrations of nitrate become too high they stimulate excessive plant growth leading to dissolved oxygen sags impacting aquatic life in streams. Major sources of nitrate in water are POTWs and industrial wastewater effluent, failed or failing septic fields, animal wastes (livestock, birds, mammals and fish), fertilizers and vehicular exhausts. Nitrate like phosphate levels in water fluctuate by season with spring concentrations usually higher after snowmelt or heavy rainfall events.
A drinking water standard of 10 mg/L has been established for nitrate. However, Illinois does not have a nitrate standard for rivers and streams to protect aquatic life here or downstream in the Gulf of Mexico. The Illinois River makes up 3% of water volume in the Mississippi River but contributes 12% of the nitrate load.8 We must act to reduce our disproportionate nutrient loading to the gulf which will also allow our rivers and streams to return to their more natural nutrient levels.
The IEPA is addressing nitrate and phosphate through its nutrient workgroups. The workgroups are revising the narrative standard which currently is described as ‘An Offensive Conditions Standard’. This is a condition in which a segment of river or stream may be deemed to be impaired if it is ‘unsightly’ or has ‘excessive’ algae growth, etc.
FindingsMedian nitrate levels have decreased in Salt Creek in the past five years compared to the first five years
7 Baseline Loadings of Nitrogen, Phosphorus and Sediments From Illinois Watersheds: October 1980- September 1996. IEPA Surface Water Division. Table 3.18 Hey, Donald L. “Nitrogen Farming: Harvesting a Different Crop.” Restoration Ecology Vol 10, No 1 March 2002
7
0
2
4
6
8
10
12
W. Branch E.
Branch Salt Creek St Joseph
Creek
Nitrate-‐N (mg/L)
Nitrogen
2001-‐2006
2007-‐2011
Statewide Median
Drinking Water Std
PrisBne Stream
0
0.5
1
1.5
2
2.5
W. Branch E. Branch Salt Creek St. Joseph
Creek
Phoshp
ate-‐P (m
g/L)
Phosphorus
2000-‐2006
2007-‐2011
State Median Level
PrisBne Stream

7 Baseline Loadings of Nitrogen, Phosphorus and Sediments From Illinois Watersheds: October 1980- September 1996. IEPA Surface Water Division. Table 3.1
8
but have remained the same in both branches of the DuPage River. Similar to phosphate this decrease from 7 mg/L to around 4 mg/L is only between 2007 and 2008 and the most current monitoring shows levels closer to 7 mg/L.
While nitrate levels in Salt Creek and the DuPage River branches are safely below the Illinois Water Quality Standard for drinking water (10 mg/L Nitrate-N) and the Illinois EPA Guideline for Impairment for aquatic life (7.8 mg/L Total Nitrogen), they are well above the median level found in Illinois streams (2.7 mg/L Nitrate+Nitrite)7. However, St Joseph Creek, a tributary to the East Branch DuPage River, has consistently displayed nitrate levels below the U.S. EPA Total Nitrogen Criterion for Pristine Streams (0.70 mg/L). The low nitrate levels suggest that lower, healthier levels could be achieved on other segments of the Eash Branch DuPage River. Ammonia: Ammonia is a nutrient like phosphate and nitrate that supports plant growth and thus can contribute to eutrophication. Unlike the two other nutrients ammonia becomes more toxic as the pH of the water increases and may then negatively affect the hatching and growth rates of fish. Structural development problems in the gills, livers and kidneys may also occur with increasing ammonia concentrations at high pH levels. Freshwater mussels have been shown to be especially sensitive to ammonia. It has been determined to be toxic to freshwater organisms in concentrations in the range of 0.44 to 15mg/L (toxicity is both pH and temperature dependent).
Fertilizer production accounts for nearly three-fourths of the ammonia produced in the U.S. Ammonia is also used to remove carbonate from hard water and is found in domestic wastewater. However POTWs are very good at removing ammonia and normally discharge very low concentrations in their treated effluent.
FindingsThe State of Illinois has established a total ammonia limit of 15 mg/L with lower site-specific limits based on the pH and temperature of the water. All samples tested by our group had levels below the state’s Water Quality Standard for ammonia, indicating that POTWs in the watersheds are doing a good 0
0.2
0.4
0.6
0.8
1
1.2
1.4
W. Branch
E. Branch Salt Creek
St Joseph's Creek
Ammon
ia m
g/L
Ammonia
2000-‐2006
2007-‐2011
0
0.5
1
1.5
2
2.5
W. Branch E. Branch Salt Creek St. Joseph
Creek
Phoshp
ate-‐P (m
g/L)
Phosphorus
2000-‐2006
2007-‐2011
State Median Level
PrisBne Stream
0
0.5
1
1.5
2
2.5
W. Branch E. Branch Salt Creek St. Joseph
Creek
Phoshp
ate-‐P (m
g/L)
Phosphorus
2000-‐2006
2007-‐2011
State Median Level
PrisBne Stream
0
0.5
1
1.5
2
2.5
W. Branch E. Branch Salt Creek St. Joseph
Creek
Phoshp
ate-‐P (m
g/L)
Phosphorus
2000-‐2006
2007-‐2011
State Median Level
PrisBne Stream

job of removing this toxin from their discharges (although most samples exceeded the median level found in Illinois streams of 0.1 mg/L). We are not seeing any significant differences in ammonia levels between the two branches of the DuPage River or Salt Creek.
Chloride: Chloride salts are essential for life and normal cell function. However, when high levels of chloride contaminate freshwater streams and lakes, it becomes toxic to fish and other aquatic life forms. Chlorides may enter surface water from rocks, agricultural runoff, industrial wastewater, wastewater treatment plant effluents and, most significantly, wintertime road salts.
FindingsThe levels of chlorides detected in Salt Creek and the DuPage River branches fluctuate from season to season. Many winter test samples exhibit elevated levels of chlorides, occasionally violating the state’s Water Quality Standard of 500 mg/L, the result of road salt runoff after a snowfall. Conversely, samples taken in the summer months reveal relatively low levels. Although our limited chloride data set does not show a recent violation of the water quality standard, the Illinois EPA has found violations which have led to both branches and Salt Creek being listed as impaired due to high chloride levels.
The national aquatic life criterion for chloride is 230 mg/L for chronic conditions. Between 2000-2011 River Prairie Group observed the national aquatic life criteria being violated in 20%, 29% and 40% of samples for the West Branch, East Branch and Salt Creek respectively. Looking at only data from 2007-2011 there is an increase in violations in 25%, 31%, 47% of samples on the West Branch, East Branch and Salt Creek respectively. This increase in chloride highlights the importance of advocating for chloride reduction practices at the municipal, county and residential level.
Dissolved Oxygen: Oxygen dissolved in water is essential to all aquatic life. The amount of oxygen found in DuPage County streams is dependent both on physical and biological factors. First, oxygen solubility in water is temperature dependent; cold waters more dissolved oxygen than warm water. Second, aquatic organisms
9
0.0
100.0
200.0
300.0
400.0
500.0
600.0
700.0
Jan-
08
Mar
-08
May
-08
Jul-0
8
Sep
-08
Nov
-08
Jan-
09
Mar
-09
May
-09
Jul-0
9
Sep
-09
Nov
-09
Jan-
10
Mar
-10
May
-10
Jul-1
0
Sep
-10
Nov
-10
Jan-
11
Mar
-11
May
-11
Jul-1
1
Sep
-11
Con
cent
ratio
n
Date
Chloride
St Joe Prairie Path Eldridge Churchill Centennial Park Butterfield Beecher

can influence the level of oxygen in water. During the daytime, aquatic plants and algae performing photosynthesis consume carbon dioxide and release oxygen directly into the water. At nighttime, plants and algae change gears and join aquatic animals in the process of respiration, consuming oxygen and releasing carbon dioxide.
If algal colonies are sufficiently numerous, they can overtax the system and send nighttime dissolved oxygen levels plunging; the following day, dissolved oxygen levels rebound as the aquatic plants and algae resume photosynthesis.
Problems with low dissolved oxygen levels can occur under conditions of eutrophication. Low dissolved oxygen levels can also result when organic pollution enters a river. As bacteria decompose organic material, they, too, consume large quantities of oxygen and can reduce the amount of dissolved oxygen to levels dangerous for aquatic life. In fact, one aspect of the EPA’s 2003 municipal storm water management program addresses this issue by stressing the need to reduce the quantity of leaves entering watersheds during the fall. To ensure sufficient levels of oxygen for aquatic life use, Illinois currently has established seasonally dependent water quality standards of no less than 3.5 mg/L in warmer months and 5.0 mg/L in cooler months.
A special study of dissolved oxygen levels in the West Branch DuPage River watershed was established in 2003. At that time, the Illinois EPA had identified problems with low dissolved oxygen levels in both Salt Creek and the East Branch of the DuPage River. Illinois EPA now lists the West Branch as failing to meet the state’s water quality standard for dissolved oxygen.
FindingsBoth sampling sites along the West Branch show levels of dissolved oxygen dipping below the water quality standard. Low dissolved oxygen levels tend to happen during hot summer days in areas where there is low flow. Although our limited data set shows only a few dips below the water quality standard, it only takes an hour or two of low DO to hurt fish. Furthermore we continue to see wide fluctuations in DO levels on a daily and seasonal basis. These fluctuations have been shown to be stressful to aquatic life5,6.
Date Klein Creek Beecher Creek01/04/03 11.5 16.002/02/03 11.8 11.603/01/03 10.4 9.204/05/03 7.1 5.705/03/03 3.3 5.805/03/03 7.7 5.906/05/03 7.8 8.907/04/03 2.4 4.508/04/03 2.7 8.209/27/03 5.4 10.210/05/03 6.4 9.011/01/03 7.5 6.012/06/03 10.1 10.701/03/04 9.0 8.602/07/04 10.7 11.502/29/04 14.0 12.504/03/04 13.1 12.005/01/04 8.5 8.006/05/04 6.5 7.307/10/04 7.0 6.008/07/04 6.6 6.609/11/04 5.9 6.210/03/04 5.3 6.811/06/04 6.3 7.612/04/04 7.5 8.301/08/05 7.0 8.502/05/05 10.5 9.003/05/05 4.8 6.504/02/05 8.2 6.405/08/05 13.7 9.606/04/05 6.1 6.007/10/05 5.0 6.008/06/05 6.4 4.309/03/05 6.8 6.510/10/05 8.4 6.811/05/05 11.4 5.712/03/05 7.0 8.501/08/06 5.7 6.702/05/06 8.5 10.103/04/06 13.9 12.004/01/06 6.0 6.205/06/06 10.5 3.106/03/06 6.5 5.507/01/06 8.5 5.608/05/06 4.7 4.509/02/06 3.2 8.010/07/06 5.0 5.512/03/06 2.1 1.501/06/07 7.5 7.202/03/07 9.5 4.003/04/07 7.8 8.804/15/07 9.1 8.505/05/07 7.0 5.306/03/07 7.1 6.007/14/07 4.3 5.308/05/07 6.5 4.809/08/07 6.2 4.510/06/07 7.2 6.111/03/07 6.1 8.112/01/07 8.0 9.501/05/08 9.7 9.702/02/08 10.3 10.003/01/08 10.5 13.204/05/08 9.3 9.905/10/08 12.5 9.505/31/08 5.7 5.907/06/08 8.2 4.308/02/08 6.8 6.509/06/08 8.9 6.401/03/09 9.1 11.702/07/09 8.5 6.703/07/09 9.1 9.204/04/09 10.6 11.005/02/09 9.7 9.206/06/09 6.8 6.407/04/09 6.7 6.408/01/09 7.4 7.209/05/09 9.6 3.510/03/09 7.2 7.810/31/09 7.3 5.512/05/09 10.3 8.801/10/10 10.8 11.002/06/10 10.4 9.103/06/10 11.8 9.804/03/10 7.2 6.605/01/10 7.0 6.206/12/10 2.6 5.507/03/10 10.3 5.008/07/10 6.6 5.709/11/10 6.0 6.510/02/10 7.1 6.711/06/10 5.8 9.312/11/10 9.6 10.001/08/11 10.5 10.602/05/11 9.6 9.803/05/11 9.7 8.904/09/11 8.7 8.405/07/11 7.6 7.506/05/11 5.3 5.507/10/11 5.8 4.108/06/11 4.7 4.809/10/11 6.5 7.710/09/11 6.9 7.011/05/11 9.4 10.412/04/11 9.3 8.9
0.0
2.0
4.0
6.0
8.0
10.0
12.0
14.0
16.0
18.0
01/04/03 01/04/04 01/04/05 01/04/06 01/04/07 01/04/08 01/04/09 01/04/10 01/04/11
Dissolved
Oxygen (m
g/L)
Year
Dissolved Oxygen Levels on the West Branch of the DuPage River
Klein Creek
Beecher Creek
5 Minnesota Nutrient Criteria Development November 2010. http://www.pca.state.mn.us/index.php/view-document.html?gid=14947 6 Miltner J., A Method and Rationale for Deriving Nutrient Criteria for Small Rivers and Streams in Ohio Environmental Management, DOI 10.1007/s00267-010-9439-9 (2010)
10

pH and Temperature: pH and temperature measurements are also routinely taken. pH is a measure of the acidity/alkalinity of the water, with a pH of 7 indicating neutrality. Aquatic organisms are generally adapted to pH levels near neutral; thus, the state’s water quality standard requires pH levels in the range of 6.5-9.0. In addition, both parameters are needed to determine if measured ammonia levels are meeting site-specific standards that are based on the pH and temperature of the water. FindingspH measurements on all streams fell within the state’s standard.
Discussion of Findings
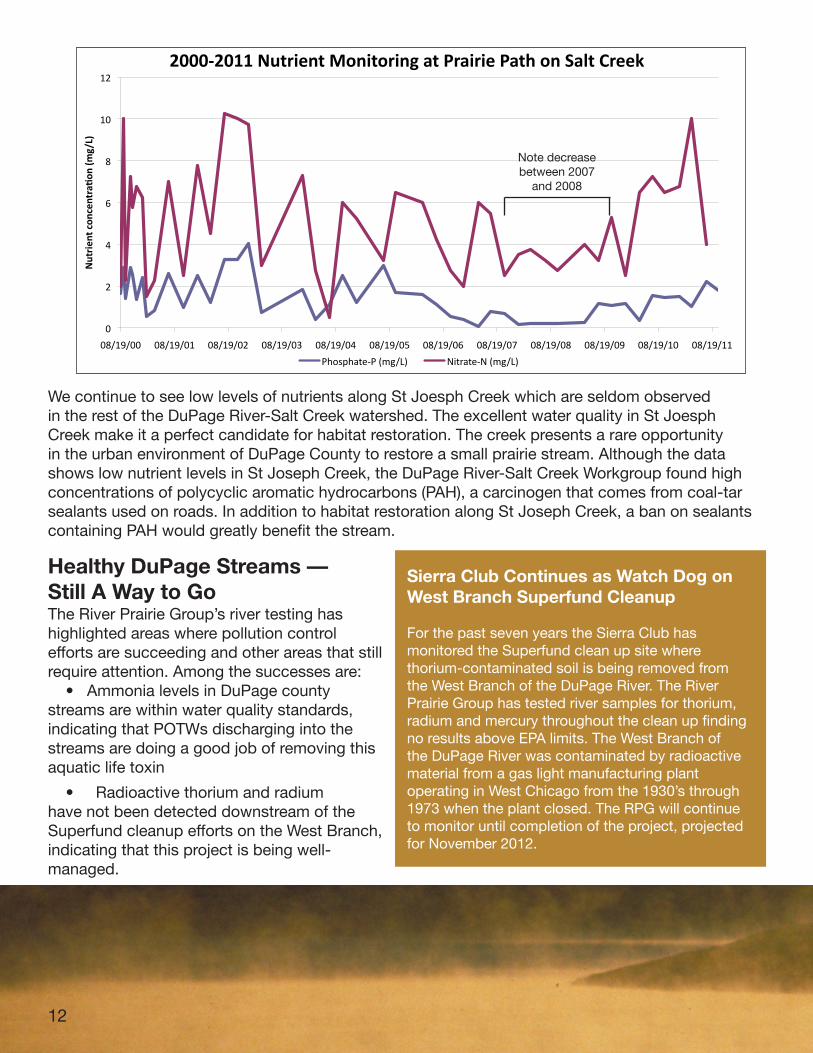
In general River Prairie Group’s monitoring does not show dramatic differences from previous years. The water quality in DuPage County mirrors overall statewide trends for the last four years which consistently show about 1/3 of Illinois’ streams impaired due to nutrients, fecal or mercury and PCBs.9 However, our data did reflect a substantial change to the watershed’s water quality between 2007-2008. As shown in the figure on page 12, significant decreases in nitrates and phosphates were observed at both sampling sites (Prairie Path and Elridge Creek) along Salt Creek.
We believe this is due to a nutrient removal project at Egan Wastewater Treatment Facility that was implemented between February of 2007 through December of 200810. This project was not continued despite the drastic decrease in nutrient levels observed downstream because significant changes were not observed in fish data, algae and dissolved oxygen. However, it is difficult to know whether noticeable changes would be observed in aquatic life in such a short time span. There are also complicating factors such as large rain events leading to high and fast flows in the watershed which make it hard to interpret DO and algal results. Additionally research has shown that high levels of nutrients can threaten aquatic life and recreational uses without causing algal blooms11 . Thus the River Prairie Group urges the Metropolitan Water Reclamation District of Greater Chicago to consider implementing this program on a permanent basis to reduce loading for impairments further downstream in the watershed and Illinois’ total nutrient loading to the Gulf of Mexico.
9 Illinois Integrated Water Quality Report and Section 303(d) List - Volume I: Surface Water - 2012 3-16-12 Public Review Draft 10 Wasik, Jennifer et al. Phosphorus Reduction Demonstration Project at the John E Egan Treatment Plant. November 2008 www.mwrd.org/.../Wasik_HZ_KKP_GT_Novseminar_2008.pdfwww.mwrd.org/.../Wasik_HZ_KKP_GT_Novseminar_2008.pdf
11 EPA’s Combined Response to Plaintiffs’ Motions for Summary Judgment, filed 9/15/11, p. 154. See also, Technical Support Document for EPA’s Final Rule for Numeric Criteria for Nitrogen/Phosphorus Pollution in Florida’s Inland Surface Fresh Waters p. 1
11
Measured pH Range
E. Branch DuPage River 6.5-8.3
W. Branch DuPage River 6.8-8.7
Salt Creek 6.5-8.3
0
2
4
6
8
10
12
08/19/00 08/19/01 08/19/02 08/19/03 08/19/04 08/19/05 08/19/06 08/19/07 08/19/08 08/19/09 08/19/10 08/19/11
Nutrien
t con
centra,on
(mg/L)
2000-‐2011 Nutrient Monitoring at Prairie Path on Salt Creek
Phosphate-‐P (mg/L) Nitrate-‐N (mg/L)
We continue to see low levels of nutrients along St Joesph Creek which are seldom observed in the rest of the DuPage River-Salt Creek watershed. The excellent water quality in St Joesph Creek make it a perfect candidate for habitat restoration. The creek presents a rare opportunity in the urban environment of DuPage County to restore a small prairie stream. Although the data shows low nutrient levels in St Joseph Creek, the DuPage River-Salt Creek Workgroup found high concentrations of polycyclic aromatic hydrocarbons (PAH), a carcinogen that comes from coal-tar sealants used on roads. In addition to habitat restoration along St Joseph Creek, a ban on sealants containing PAH would greatly benefit the stream.
Healthy DuPage Streams — Still A Way to GoThe River Prairie Group’s river testing has highlighted areas where pollution control efforts are succeeding and other areas that still require attention. Among the successes are: • Ammonia levels in DuPage county streams are within water quality standards, indicating that POTWs discharging into the streams are doing a good job of removing this aquatic life toxin
• Radioactive thorium and radium have not been detected downstream of the Superfund cleanup efforts on the West Branch, indicating that this project is being well-managed.
Sierra Club Continues as Watch Dog on West Branch Superfund Cleanup
For the past seven years the Sierra Club has monitored the Superfund clean up site where thorium-contaminated soil is being removed from the West Branch of the DuPage River. The River Prairie Group has tested river samples for thorium, radium and mercury throughout the clean up finding no results above EPA limits. The West Branch of the DuPage River was contaminated by radioactive material from a gas light manufacturing plant operating in West Chicago from the 1930’s through 1973 when the plant closed. The RPG will continue to monitor until completion of the project, projected for November 2012.
12
Note decrease between 2007
and 2008

However, eutrophication remains a major concern of the county’s streams:
• Nutrient levels are high.
• Offensive conditions in the form of excess algae most likely due to elevated phosphorus can be found in some stream segments in DuPage County12.
• Some stream segments occasionally have dissolved oxygen levels lower than allowed by existing state standards.
• Recent biological and habitat assessment performed by the DuPage River Salt Creek Workgroup (DRSCW) show that DuPage area streams exhibit significant habitat degradation that will need to be corrected before the streams can once again support the diversity of fish and insect species found in a healthy aquatic environment.13
• DRSCW research has found that artificial barriers such as dams are the single greatest impairments on the rivers and recommends historical dams that have no flood control function be removed or modified to allow fish migration.13
• Chloride levels rise during late winter and early spring from road salt runoff. Although most levels found in the DuPage area are below the 500 mg/L water quality limit, research in Illinois has shown that concentrations of chloride as low as 250 mg/L have been recognized as harmful to freshwater life.
The climate for achieving improvements in the quality of DuPage County streams has definitely improved since the River Prairie Group last reported on their status in 2007.
Most significantly, a number of local efforts are underway studying the problems of the rivers and developing solutions. These include:
• DuPage River Salt Creek Workgroup
• DuPage County Water Quality Stakeholders Committee
12IEPA. Illinois Integrated Water Quality Report and Section 303d list:Appendix B-2. Specific Assessment Information for Streams, 201213 “DuPage River-Salt Creek Bioassessment Report.” Prepared for DuPage River Salt Creek Workgroup by Center for Applied Bioassessment and Biocriteria- Midwest Biodiversity
Institute. Dec. 31, 2008.
TMDL CompletionShort for Total Maximum Daily Load, a TMDL is essentially a dirty water clean-up plan. TMDLs are a calculation of the maximum amount of a pollutant that a body of water can receive and still meet water quality standards. The calculation must include a margin of safety to ensure that the waterbody can be utilized for its designated uses set by the state. A tenet of the Clean Water Act of 1972, TMDLs set pollution reduction goals that are necessary to improve the quality of impaired waters, and its watershed approach considers all potential sources of pollutants, both point and non-point. For example, Salt Creek’s TMDL for chloride is 74 million pounds per year; an estimated 8% reduction in chloride runoff is needed to achieve this goal.
Illinois EPA issued multiple TMDLs for Salt Creek and the DuPage River branches in 2004. The TMDLs addressed violations of Illinois’s water quality standards for conductivity, chloride, copper, and dissolved oxygen. The goal of Illinois TMDLs is to achieve better water quality and balanced, healthy ecosystems overall, and to have a positive impact on the quality and quantity of fish and animals that depend on these waters for habitat, food, breeding and survival.
In 2006, additional pollution problems were identified in DuPage County waterways and TMDL development began in the fall of 2007. Currently TMDLs for silver, chloride, fecal coliform, dissolved oxygen, manganese and pH water quality violations are in stage 3 of development. At this stage all the data has been collected and load allocations are being made and an implementation plan is being created. Water quality violations that were found for copper, iron and zinc are being addressed at the point sources where they originate.
13

The activities of these two groups are described in the Ongoing Work in the Watershed sidebar and the importance of broad participation in these efforts is made clear in the Call to Action section below.
Healthy DuPage County Streams-A Call to ActionClearly action is needed at all levels of government and by the citizens of DuPage County if the county’s streams are to be restored to good health.
State Actions Have Helped
Since 2001, a number of actions by the Illinois EPA and state legislators have addressed the pollutant problems that continue to plague DuPage streams. These include:
• In 2004 Illinois EPA Completed Total Maximum Daily Load requirements (TMDLs) for Salt Creek and the DuPage River branches by the Illinois EPA in 2004. (See TMDL sidebar earlier in the report) which led to the formation of the DuPage River Salt Creek Workgroup.
• In 2006 Illinois EPA adopted an interim phosphorus effluent standard which requires new and expanding sewage treatment plants to reduce phosphorus in their discharges to 1 mg/L.
• Starting in 2010 the Illinois General Assembly required phosphorus levels in dishwasher detergent to be reduced to no more than 0.5% by weight.
• In 2010 the State of Illinois passed a law prohibiting hired applicators from using lawn fertilizer containing phosphorus.
• Illinois Environmental Protection Agency has created four nutrient workgroups that are working on putting together a package of standards revisions for the IL Pollution Control Board that includes updating the narrative standard, updating effluent standards for phosphorus and identifying low phosphorus waters to be protected.
• In May 2012 the Illinois Fertilizer Act was amended to include funding for a nutrient research council to help farmers reduce nutrient losses and improve water quality.
More State Help is Needed
Additional actions by the Illinois EPA would also aid in addressing the water quality problems found in DuPage streams: • Illinois EPA needs to develop scientifically sound water quality standards for phosphorus and bring those to the Illinois 14

Pollution Control Board for approval.
• Illinois EPA should continue to fund the work of the DuPage River Salt Creek Workgroup by matching locally-raised funds with federal funds which the Agency receives through the 319 grant program. Counties and Municipalities Can Help Reduce PollutionIn an urbanized area like DuPage County, the role of municipalities and other local governmental bodies is critical to the restoration of the county’s waterways.The active participation of DuPage County government, the Forest Preserve District of DuPage County and all municipalities and sanitary districts in the county in both the DuPage River Salt Creek Workgroup (DRSCW) and the DuPage County Water Quality Stakeholders Committee is a major step toward restoring the quality of DuPage County’s waterways. By working together with watershed, conservation, and environmental groups these efforts offer the best chance for multiple stakeholders to come together, make critical decisions, and implement projects to address the waterways’ current problems with low dissolved oxygen levels, a complex issue. DRSCW is doing an excellent job of exploring opportunities such as dam removal for its benefits to raise dissolved oxygen levels and improve stream habitat. Sierra Club- River Prairie Group is proud to be an active participant in DRSCW and to participate in the Executive Committee.
Reducing road salt usage is the key to addressing the current problems of chloride pollution in DuPage County’s streams.Sierra Club applauds the efforts of muncipalities such as Carol Stream, Downers Grove and Hanover Park which employ anti-icing practices to reduce salt use. The village of Glen Ellyn has invested in calibrated salt spreaders to reduce oversalting. In addition, DRSCW has funded a chloride usage education and reduction program study which is developing recommendations and an implementation plan for alternative products and practices designed to reduce chloride pollution in the county. DRSCW, DuPage County and the American Public Works Association conducted chloride reduction workshops in 2009, 2010 and 2011 for public agencies and private operators. DRSCW reviewed the impacts of chloride reduction efforts through a questionnaire comparing 2007 to 2010 deicing methods.
DuPage River Salt Creek Workgroup The DuPage River Salt Creek Workgroup (DRSCW) is comprised of the Sierra Club River Prairie Group, local communities, POTWs and other environmental organizations who have come together in response to the TMDLs developed for Salt Creek and the East and West branches of the DuPage River. The goal is to more accurately measure the stressors to the aquatic systems through a long-term water quality monitoring program. The group has begun to develop and implement projects to address those stressors. The group’s goal is to preserve and enhance water quality in the East and West Branches of the DuPage River, Salt Creek and their tributaries by collecting reliable water quality data, investigating the options available to meet water quality standards and implementing a coordinated effort to install best management practices in the watershed, including dam removal.
The DRSCW has completed over five years of detailed water quality monitoring, biological assessments and habitat evaluations on all three watersheds.
The group is currently completing the dam removal at Churchill Woods on the East Branch; including restoring the stream to its original channel and establishing natural wetland plantings along the banks. The River Prairie Group is an active member of the Workgroup, heading up the Salt Creek subcommittee and serving on the group’s Executive Committee. www.drscw.org
DuPage County Water Quality Stakeholders Committee meets periodically to address the compliance of the county and municipalities with the USEPA’s urban storm water management program. This group has recently completed a manual of best management practices designed to reduce pollution from developed areas.
15

Sierra Club was pleased that DRSCW found that 12 DuPage County communities are using GeoMelt which contains beet juice, an environmentally friendly deicing alternative.
Promoting infiltration of storm water into the ground will help reduce pollution of our waterways by reducing urban runoff.Sierra Club encourages continued efforts such as the county’s seminar on permeable pavers, the Conservation Foundation’s sale of rain barrels and incentives for rain gardens. Municipalities could emulate the Rock
Island, Illinois program which helps homeowners fund the installation of rain gardens on their properties. For more info: www.rigov.org/citydepartments/publicworks/raingarden.html
Sierra Club recommends that DuPage County and its municipalities consider a ban on the use of lawn fertilizer containing phosphorus.Illinois soils typically contain sufficient phosphorus for turf grass growth, and phosphorus-free fertilizers are available.In recent years more and more areas have limited the use of phosphorus in lawn fertilizers to prevent its runoff to streams and lakes. These include the States of Minnesota, and Wisconsin and numerous villages and homeowner associations in Illinois. Sierra Club is interested in helping municipalities work with the Department of Agriculture to put these bans in place.
Sierra Club supports increasing the size and span of vegetative buffers along DuPage County streams.Vegetative buffers capture pollutants, regulate stream temperature and stabilize stream banks after rain events which helps avoid erosion. In DuPage County much of the stormwater is piped directly into the stream so pollutant capture by buffers is more limited than in less developed areas but buffers provide critical habitat for wildlife, especially macroinvertebrates. Studies have shown that a minimum buffer width of 98 feet is needed to provide adequate habitat for aquatic species in ecosystems similar to those in DuPage County.
It is imperative that the county and municipalities do their best to control stormwater runoff from construction sites.Construction sites have a high potential for soil erosion and runoff of sediment into storm sewers and ultimately into DuPage County streams. Under the Illinois EPA’s municipal storm water management
Dams’ Impact on Water Quality Dams tend to exacerbate the nutrient problems already found in streams because they create stagnant pools in which algae thrive. These blooms decompose leading to problems with dissolved oxygen levels for aquatic life. Dams also disrupt natural sediment transport processes. Sediment builds behind dams rather than being distributed to its natural floodplain. Below dams you tend to see channel bed degradation, channel narrowing and bank erosion. Dams also modify temperature of river systems. Shallow impoundments can lead to warmer waters altogether and in deeper systems dams lead to more stratification meaning some water is much warmer or cooler than it would normally be.14
14 ASFPM Working Group on Dams Issue 5: Environmental Issues Related To Dams http://www.scribd.com/doc/87351909/081105- Environmental-Issues-Related-to-Dams
16

program, each town is required to develop, implement, and enforce a program to reduce pollutants in any storm water runoff from construction activities. Each town must see that construction site operators implement appropriate erosion and sediment control best management practices which they have described in the stormwater pollution prevention plan developed for the site. Each town must also have procedures for accepting concerns about poor construction site practices from the public. Sierra Club encourages towns to vigorously enforce the DuPage County Stormwater Management Plan and to provide residents with an opportunity to help monitor construction sites.
You Can Help Reduce PollutionResidents of DuPage County can help restore the quality of local waterways by reducing the use of pollutants that end up in the streams. Homeowners play a critical role in reducing nonpoint source pollution runoff from lawns, houses, parking lots, and streets by remaining mindful that runoff into storm drains flows directly to rivers without treatment. Thus, the most effective means of reducing nonpoint source pollution is to minimize your use of pollutants such as fertilizers, cleaners, and road salt.
Reduce salt use: Merely using less road salt on your property in the winter months reduces excess chloride in surrounding watersheds. Gravel, sand and kitty litter are alternatives which can be safely swept onto lawns in the spring.
Use only asphalt or water based driveway sealants: Or better yet use no sealant at all, as there is no evidence that sealing a driveway does anything to prolong the useful life of the driveway. Avoiding sealants will lower the levels of toxic polycyclic aromatic hydrocarbons in our waters.
Reduce fertilizer use: Many people over-fertilize simply because they are unaware of the existing health of their lawn. Get your soil tested at the Kane County Farm Bureau by calling 630-584-8660 and find an environmentally friendly fertilizer that is right for your lawn or use natural fertilizers
Polycyclic Aromatic Hydrocarbons (PAHs)A major source of PAHs is coal-tar based asphalt road sealers. This material is used on both public road ways and private parking lots and driveways. Unlike asphalt and water based sealers coal-tar based sealers release significant amounts of organic molecules collectively called polycyclic aromatic hydrocarbons. PAHs are a concern because some compounds have been identified as carcinogenic and mutagenic. The DRSCW has identified significant concentrations of PAHs in river sediment immediately downstream of dense residential areas that drain to DuPage rivers.
In 2005, the City of Austin, TX and USGS released their studies on coal tar-based sealants. This study showed that one of the major sources of PAHs found in urban runoff is coal tar-based sealants. The City of Austin, demonstrating the toxicity of PAHs and their effects on aquatic and human health, triggered several municipalities around the country to ban coal tar sealants.
You can read the entire report at: http://www.drscw.org/dissolvedoxygen/PAHFinal.pdf
17

such as compost, manure, bone meal or peat. The 2010 Lawn Care Act bans the use of phosphorus containing fertilizer for hired applicators unless you have a soil test which says your lawn is deficient in phosphorus. Sierra Club recommends residents follow similar guidelines and purchase phosphorus-free fertilizer.
Capture rooftop runoff: Collecting the rainwater that falls on your home’s roof is another way to reduce stormwater runoff to streams. Rainwater diverted from gutter downspouts can be collected in rain barrels for use in plant and garden watering or can be directed to a rain garden.
The Wisconsin Dept. of Natural Resources has produced a how-to manual on rain gardens for homeowners: www.dnr.state.wi.us/org/water/wm/dsfm/shore/documents/rgmanual.pdf
Rain barrels can be ordered from The Conservation Foundation: www.theconservationfoundation.org
Grasscycle: Grass cycling is the practice of leaving clippings on the lawn when mowing. The clippings quickly decompose, returning nutrients to the soil. This reduces water loss from the lawn and the need for phosphorus and nitrogen-containing fertilizer.
Use native landscaping: Native plants, which are adapted to Illinois’ climate and soils, require no fertilizer and can withstand drought conditions without watering. Information on native species can be found at the following websites:
Morton Arboretum (www.mortonarb.org) The Conservation Foundation (www.theconservationfoundation.org). The DuPage Wild Ones (http://www.for-wild.org/chapters/dupage)
Proper disposal: Generally, anything that enters a storm drain flows directly, without treatment, into local creeks, streams, rivers, and eventually, the ocean. To dispose of oil, fertilizer, pesticides, paints and solvents, visit http://illinois.earth911.org, type in your city, state, and zip code; and the website will provide locations, dates and times for drop-off.
Conclusion
There have been many positive changes in the Du Page- Salt Creek Watershed since River Prairie Group began monitorng in 2000 but there is still work to be done to improve water quality. The group looks forward to seeing decreases in nutrient levels as green infrastructure efforts become more widespread and developments at the state level lead to increased nutrient removal at wastewater treatment facilities. Chloride reduction measures, improved fertilizer guidelines, and dam removal will also lead to healthier waters in DuPage County. In the meantime the group will continue advocating for cleaner water and maintaining the nutrient monitoring program. River Prairie Group is always looking for volunteers for monitoring and advocacy work in DuPage County.
To learn more about the River Prairie Group visit http://illinois.sierraclub.org/RPG
18

Sierra Club Water SentinelsThe River Prairie Group is one of six Sierra Club Water Sentinel groups in Illinois. Water Sentinels work to protect, improve and restore our waters by fostering alliances to promote water quality monitoring, public education, and citizen action. The Illinois groups monitor nutrients, dissolved oxygen, chloride, some radioactive elements and coal mining related pollutants. A new group tests conductivity in wells in southern Illinois in response to the hyrdraulic fracking industry. Water Sentinels believe that the best way to defend our waterways from misuse and pollution is to empower local activists with accurate information and train them in water quality monitoring techniques and grassroots advocacy.
Sierra Club volunteer Jane Foulser, has been involved with testing since 2000, the very beginning of the program. The River Prairie Group’s monitoring program would not exist without help from its committed volunteers.
For more information about RPG’s Water Sentinels program visit: http://illinois.sierraclub.org/rpg/
Not in DuPage County but want to get involved in Water Sentinels? Visit http://www.sierraclub.org/watersentinels/map/illinois.aspx
19

The Illinois Clean Water Campaign is supported by generous contributions from individual Sierra Club members across Illinois and the Sierra Club’s Water Sentinels Program.
A River Prairie Group Publication. June 2012
Explore, enjoy and protect the planet