asbestos industry dec10
TRANSCRIPT
8/8/2019 Asbestos Industry Dec10
http://slidepdf.com/reader/full/asbestos-industry-dec10 1/31
RESEARCH
EUREKA RESEARCH www.eurekasecurities.com
ANALYST
Samudrajit Gohain
097488 60335 / 91-33-3918 0386 - 87
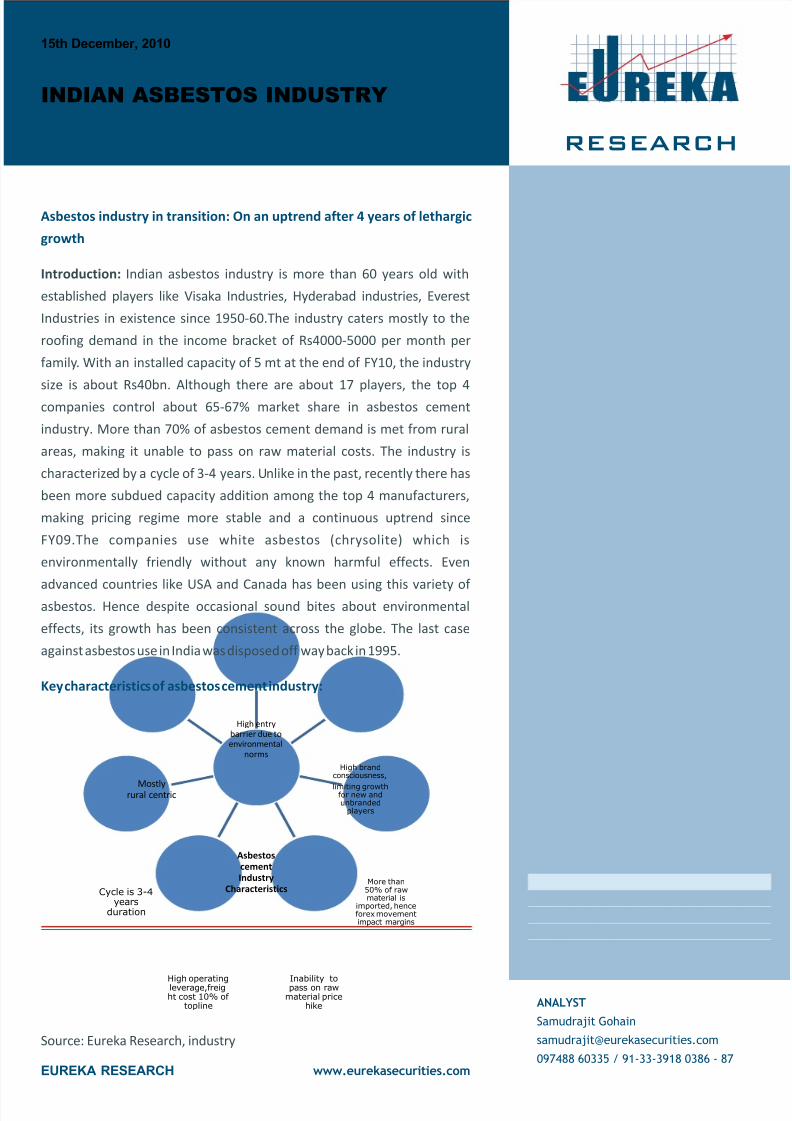
AsbestoscementIndustry
Characteristics
High entrybarrier due toenvironmental
norms
High brandconsciousness,
limiting growthfor new andunbranded
players
More than50% of rawmaterial is
imported, henceforex movementimpact margins
Inability topass on raw
material pricehike
High operatingleverage,freight cost 10% of
topline
Cycle is 3-4years
duration
Mostlyrural centric
Asbestos industry in transition: On an uptrend after 4 years of lethargic
growth
Key characteristics of asbestos cement industry:
Introduction: Indian asbestos industry is more than 60 years old with
established players like Visaka Industries, Hyderabad industries, Everest
Industries in existence since 1950-60.The industry caters mostly to the
roofing demand in the income bracket of Rs4000-5000 per month per
family. With an installed capacity of 5 mt at the end of FY10, the industry
size is about Rs40bn. Although there are about 17 players, the top 4
companies control about 65-67% market share in asbestos cement
industry. More than 70% of asbestos cement demand is met from rural
areas, making it unable to pass on raw material costs. The industry is
characterized by a cycle of 3-4 years. Unlike in the past, recently there has
been more subdued capacity addition among the top 4 manufacturers,
making pricing regime more stable and a continuous uptrend since
FY09.The companies use white asbestos (chrysolite) which is
environmentally friendly without any known harmful effects. Even
advanced countries like USA and Canada has been using this variety of asbestos. Hence despite occasional sound bites about environmental
effects, its growth has been consistent across the globe. The last case
against asbestos use in India was disposed off way back in 1995.
Source: Eureka Research, industry
15th December, 2010
INDIAN ASBESTOS INDUSTRY

8/8/2019 Asbestos Industry Dec10
http://slidepdf.com/reader/full/asbestos-industry-dec10 2/31
As the above diagram shows, though asbestos cement is a commodity, there are few peculiar characteristics to this industry.
So far because of these characteristics; companies' financial performances have been highly erratic on both top-line and
bottom-line.
The industry (mainly top 4 manufacturers) is likely to benefit from confluence of 5 main factors. These factors have been
visible since beginning of FY10.The industry was besieged with significant finished goods industry between FY05-09 as there
was reckless capacity addition not only by marginal players but also by top 4 manufacturers in anticipation of strong demand
growth. Though demand did pick up during that period, it was exceeded by supply to some extent. Hence, along with uptick
in raw material cost, manufactures were unable to completely sell the products till FY09.
Source: Eureka Research, industry
With more balanced demand supply dynamics these days, companies have been able to pass on hike in raw material cost and
freight cost to customers. With average net realization increasing from Rs6500 per ton in FY05-06, the average EBITDA
margin of the companies increased from 15-16% to 18-19% in recent days. The next 4-5 years is likely to witness a CAGR sale
growth of 9-10% for the top 4 asbestos cement manufacturers.
Asbestos cement sheets being used in different applications
EUREKA RESEARCH 2
INDIAN ASBESTOS INDUSTRY
15th December, 2010
www.eurekasecurities.com
9-10% CAGR in sale of asbestos cement sale in next4-5 years against 4-5% growth in last 4-5 years
Capacityutilisationmore than
90% in FY10
from 65-70%in FY05-09
Uptick in bankcredit to agriand related
activity(25%CAGR),loan to
SME(42%
CAGR), ruraldeposits withbanks(17%
CAGR) in last4 years
Significantincrease in
rural incomefrom
NREGA,highminimumsupport price
Netrealisationincreasing
fromRs6500/ton in
Fy05-06 toRs8700/ton in
FY10
Better daysvisible asthere has
beensignificant
drop infinished goods
inventoryfrom
2009(22%CAGR inFY05-09)
8/8/2019 Asbestos Industry Dec10
http://slidepdf.com/reader/full/asbestos-industry-dec10 3/31
Huge emerging demand for asbestos cement sheets as rural income grows
The housing shortage in rural India by end of CY2009 was 14.6 million units. Out of this, 11.4 million units on account of replacement and additional 3.2 million units are new units (Source:NABRD).Every year this number is increasing by 3-4%.
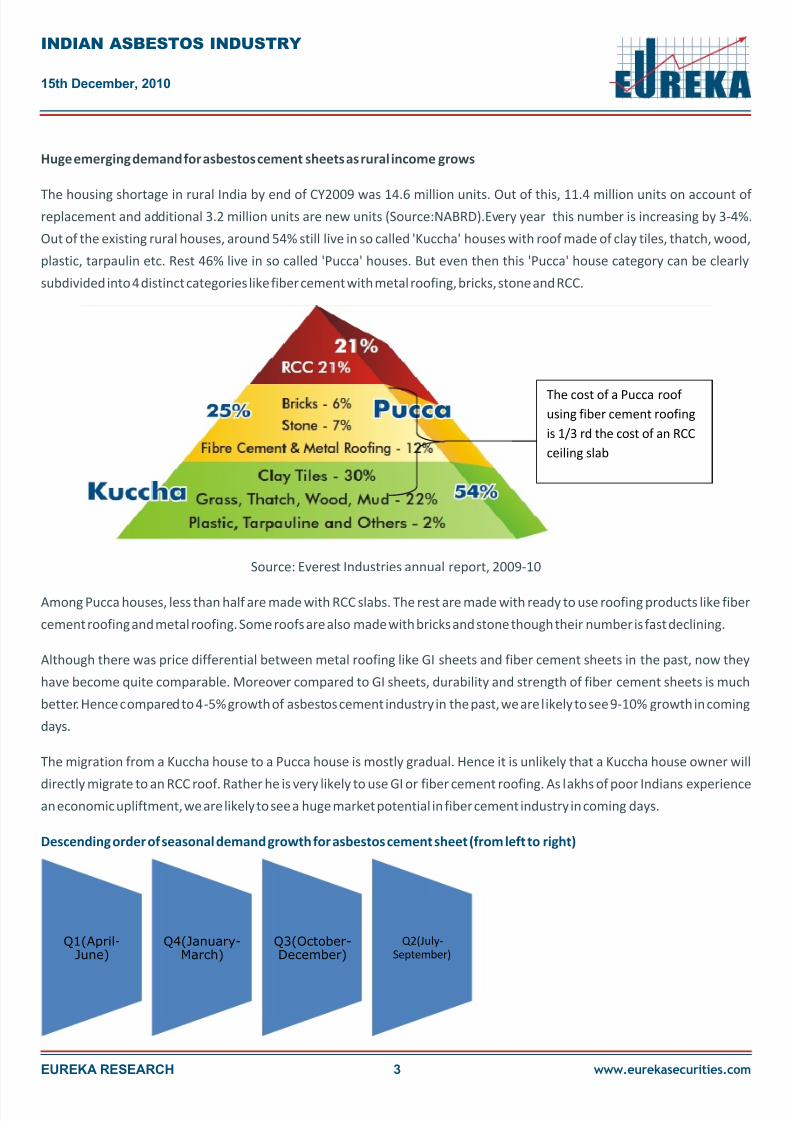
Out of the existing rural houses, around 54% still live in so called 'Kuccha' houses with roof made of clay tiles, thatch, wood,
plastic, tarpaulin etc. Rest 46% live in so called 'Pucca' houses. But even then this 'Pucca' house category can be clearly
subdivided into 4 distinct categories like fiber cement with metal roofing, bricks, stone and RCC.
Source: Everest Industries annual report, 2009-10
Among Pucca houses, less than half are made with RCC slabs. The rest are made with ready to use roofing products like fiber
cement roofing and metal roofing. Some roofs are also made with bricks and stone though their number is fast declining.
Although there was price differential between metal roofing like GI sheets and fiber cement sheets in the past, now they
have become quite comparable. Moreover compared to GI sheets, durability and strength of fiber cement sheets is much
better. Hence compared to 4-5% growth of asbestos cement industry in the past, we are likely to see 9-10% growth in coming
days.
The migration from a Kuccha house to a Pucca house is mostly gradual. Hence it is unlikely that a Kuccha house owner will
directly migrate to an RCC roof. Rather he is very likely to use GI or fiber cement roofing. As lakhs of poor Indians experiencean economic upliftment, we are likely to see a huge market potential in fiber cement industry in coming days.
Descending order of seasonal demand growth for asbestos cement sheet (from left to right)
EUREKA RESEARCH 3
INDIAN ASBESTOS INDUSTRY
15th December, 2010
www.eurekasecurities.com
The cost of a Pucca roof using fiber cement roofing
is 1/3 rd the cost of an RCC
ceiling slab
Q1(April-June)
Q4(January-March)
Q3(October-December)
Q2(July-September)
8/8/2019 Asbestos Industry Dec10
http://slidepdf.com/reader/full/asbestos-industry-dec10 4/31
Construction activity in India for most of the infrastructure activities including home building is seasonal due to prevalence
of rainy season from June-July to September-October. More or less construction activities of all sorts take a back seat during
this rainy season.
Accordingly sales of asbestos cement sheets is also not uniform throughout the year. The best quarter is first (Q1) from April-
June as there is less rainfall and winter effects start receding. This is followed by fourth (Q4) quarter from January to March
though during Q4, winter spell somewhat impacts construction activity in north India, rest of India can easily undertake
construction activities including house building in rural areas.
This is followed by third and second quarter.
But going forward, we believe this trend is likely to change for top three manufacturers (Visaka Industries, Hyderabad
Industries and Everest Industries) as all of them are diversifying into somewhat related but urban and corporate centric
products like panels and boards which are used for interior purposes. These panels and boards can be used throughout the
year and they come at the very fag end of construction activities.
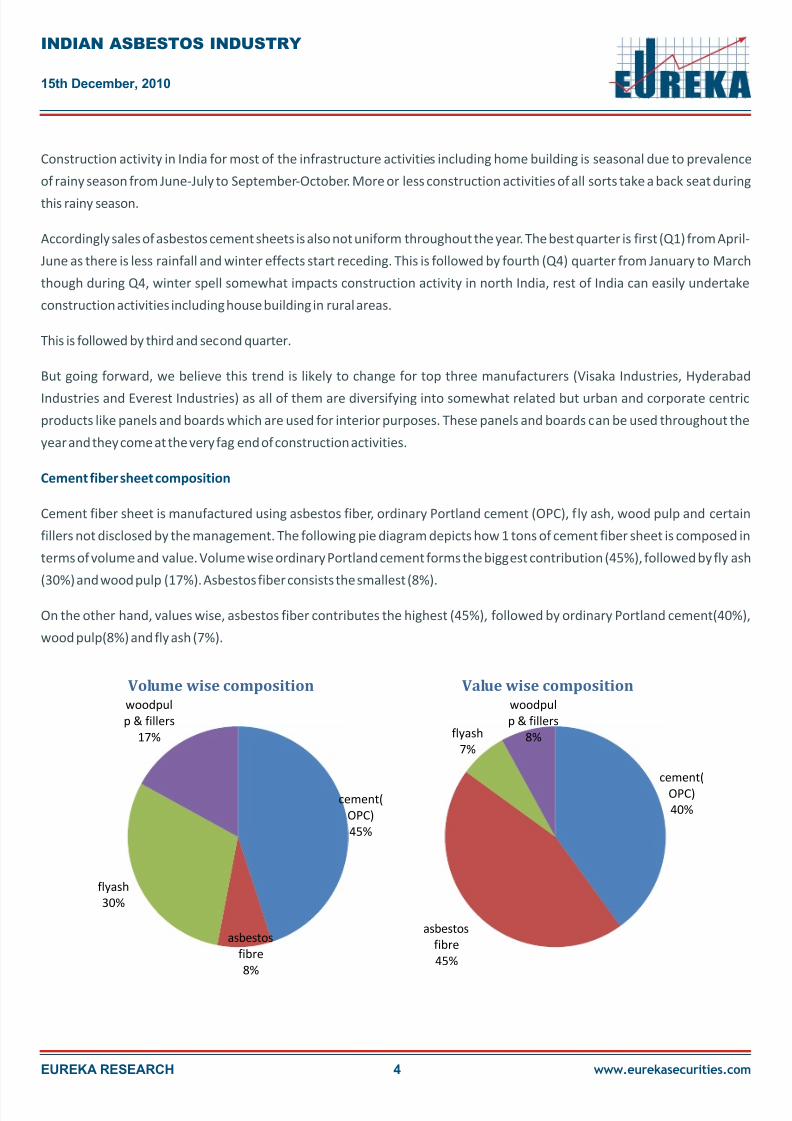
Cement fiber sheet is manufactured using asbestos fiber, ordinary Portland cement (OPC), fly ash, wood pulp and certain
fillers not disclosed by the management. The following pie diagram depicts how 1 tons of cement fiber sheet is composed in
terms of volume and value. Volume wise ordinary Portland cement forms the biggest contribution (45%), followed by fly ash
(30%) and wood pulp (17%). Asbestos fiber consists the smallest (8%).
On the other hand, values wise, asbestos fiber contributes the highest (45%), followed by ordinary Portland cement(40%),
wood pulp(8%) and fly ash (7%).
Cement fiber sheet composition
EUREKA RESEARCH 4
INDIAN ASBESTOS INDUSTRY
15th December, 2010
www.eurekasecurities.com
Volume wise composition Value wise composition
cement(
OPC)
45%
asbestos
fibre
8%
flyash
30%
woodpul
p & fillers
17%
cement(
OPC)
40%
asbestos
fibre
45%
flyash
7%
woodpul
p & fillers
8%

8/8/2019 Asbestos Industry Dec10
http://slidepdf.com/reader/full/asbestos-industry-dec10 5/31
Raw material procurement policy
(A) Ordinary Portland cement (OPC):
Ordinary Portland cement is procured as per demand schedule.
Companies generally maintain inventory of 15-20days. Hence the
asbestos cement producers have been able to take advantage of
softening of cement prices in last couple of months. The situation is
likely to stay favorable for next 1.5 years as new capacity has been
added significantly in the cement industry and supply is likely to
exceed demand for some more time
(B) Chrysotile (white asbestos) fiber:
India uses only about 6 to 7% of the white asbestos produced in the world and apart from India, Russia, China Indonesia,
Thailand and Brazil are some of the largest users of asbestos cement (AC) sheets. In India, over 90% of asbestos fiber imports
of India go into AC sheet and pipe production.
All the member industries of Chrysotile Asbestos Cement Products
Manufacturers Association (CACPMA) carry out dust level
measurements and health surveillance programs as prescribed by
regulatory authorities. No asbestos related diseases were detected
in a test taken by Directorate General of Factory Advisory Services &
Labour Institutes (DGFASLI) in the employees who are exposed to
chrysotile fiber for the last 20 years
The Ministry of Industry, Ministry of Labour, Ministry of Environment, Ministry of Consumer Affairs, Bureau of Indian
Standards, et al have laid-down regulations, standards, guidelines and recommendations specific to the asbestos industry, in
line with those of International Labour Organization, World Health Organization and other bodies. The Central and State
Pollution Control Boards, Labour and Factory Inspectors also regularly monitor the factories' compliance with the
mandatory safety standards and pollution control levels.
(C) Wood pulp:
The wood pulp is a very important raw material for manufacturing of V-boards (a form of asbestos cement sheet) which is
used further to manufacture V-panels. The manufactures' import wood pulp and Russia has emerged as the major supplier
of wood pulp for Indian asbestos cement manufacturers in recent days.
EUREKA RESEARCH 5
INDIAN ASBESTOS INDUSTRY
15th December, 2010
www.eurekasecurities.com
200
210
220
230
240
250
260
N o v - 0 8
J a n - 0 9
M a r - 0 9
M a y - 0 9
J u l - 0 9
S e p - 0 9
N o v - 0 9
J a n - 1 0
M a r - 1 0
M a y - 1 0
J u l - 1 0
S e p - 1 0
N o v - 1 0
Cement Prices (Rs/bag)
Source:CMA
22843
27101
32117
38200
15000
20000
25000
30000
35000
40000
FY08 FY09 FY10 FY11E
Landed cost of Chrysotile (Rs/ton)
8/8/2019 Asbestos Industry Dec10
http://slidepdf.com/reader/full/asbestos-industry-dec10 6/31
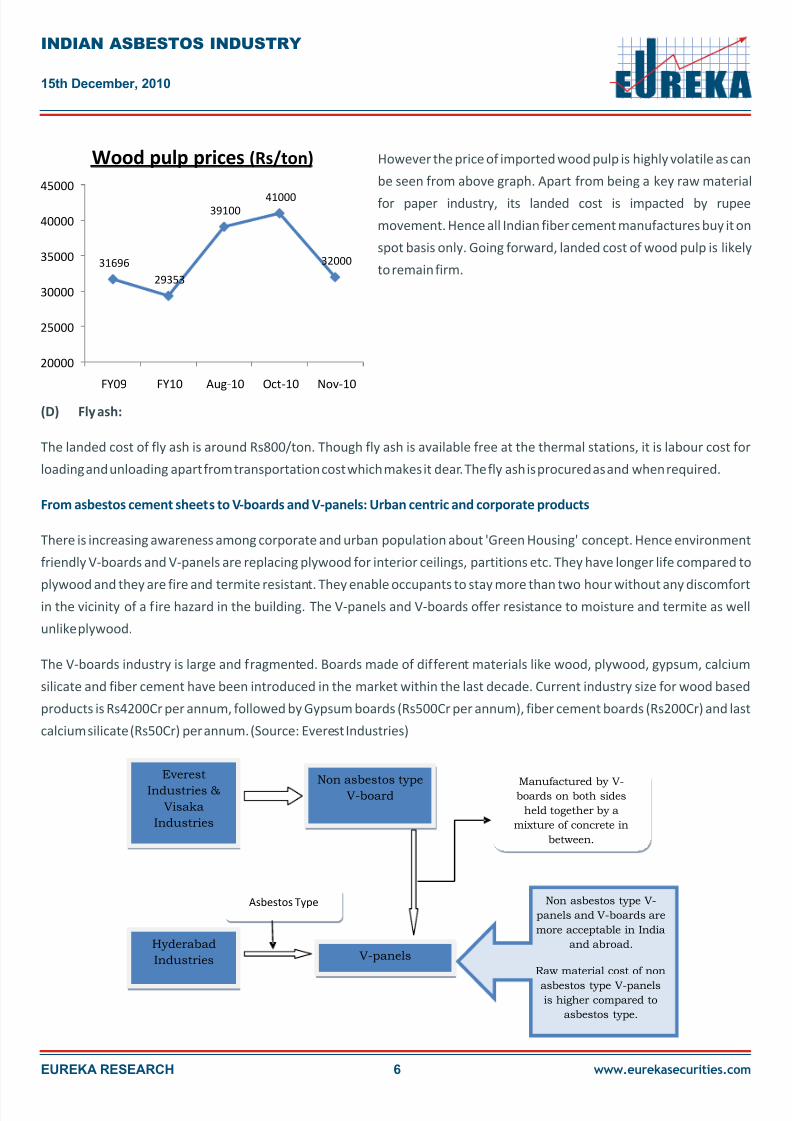
However the price of imported wood pulp is highly volatile as can
be seen from above graph. Apart from being a key raw material
for paper industry, its landed cost is impacted by rupee
movement. Hence all Indian fiber cement manufactures buy it on
spot basis only. Going forward, landed cost of wood pulp is likely
to remain firm.
(D) Fly ash:
The landed cost of fly ash is around Rs800/ton. Though fly ash is available free at the thermal stations, it is labour cost for
loading and unloading apart from transportation cost which makes it dear. The fly ash is procured as and when required.
There is increasing awareness among corporate and urban population about 'Green Housing' concept. Hence environment
friendly V-boards and V-panels are replacing plywood for interior ceilings, partitions etc. They have longer life compared to
plywood and they are fire and termite resistant. They enable occupants to stay more than two hour without any discomfortin the vicinity of a fire hazard in the building. The V-panels and V-boards offer resistance to moisture and termite as well
unlike plywood.
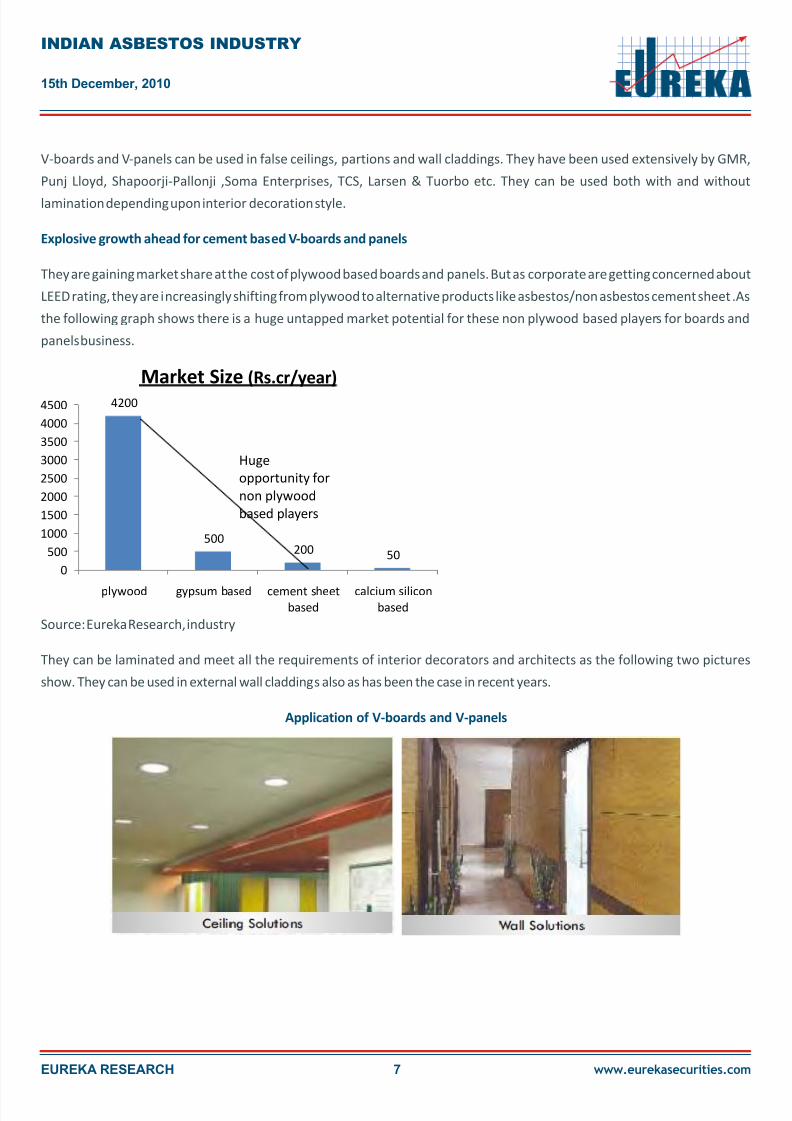
The V-boards industry is large and fragmented. Boards made of different materials like wood, plywood, gypsum, calcium
silicate and fiber cement have been introduced in the market within the last decade. Current industry size for wood based
products is Rs4200Cr per annum, followed by Gypsum boards (Rs500Cr per annum), fiber cement boards (Rs200Cr) and last
calcium silicate (Rs50Cr) per annum. (Source: Everest Industries)
From asbestos cement sheets to V-boards and V-panels: Urban centric and corporate products
EUREKA RESEARCH 6
INDIAN ASBESTOS INDUSTRY
15th December, 2010
www.eurekasecurities.com
31696
29353
3910041000
32000
20000
25000
30000
35000
40000
45000
FY09 FY10 Aug-10 Oct-10 Nov-10
Wood pulp prices (Rs/ton)
Everest
Industries &
Visaka
Industries
Non asbestos typeV-board
Hyderabad
Industries V-panels
Manufactured by V-boards on both sides
held together by a
mixture of concrete in
between.
Asbestos Type Non asbestos type V-
panels and V-boards are
more acceptable in India
and abroad.
Raw material cost of non
asbestos type V-panels
is higher compared to
asbestos type.
8/8/2019 Asbestos Industry Dec10
http://slidepdf.com/reader/full/asbestos-industry-dec10 7/31
V-boards and V-panels can be used in false ceilings, partions and wall claddings. They have been used extensively by GMR,
Punj Lloyd, Shapoorji-Pallonji ,Soma Enterprises, TCS, Larsen & Tuorbo etc. They can be used both with and without
lamination depending upon interior decoration style.
They are gaining market share at the cost of plywood based boards and panels. But as corporate are getting concerned about
LEED rating, they are increasingly shifting from plywood to alternative products like asbestos/non asbestos cement sheet .As
the following graph shows there is a huge untapped market potential for these non plywood based players for boards and
panels business.
Source: Eureka Research, industry
They can be laminated and meet all the requirements of interior decorators and architects as the following two pictures
show. They can be used in external wall claddings also as has been the case in recent years.
Explosive growth ahead for cement based V-boards and panels
Application of V-boards and V-panels
EUREKA RESEARCH 7
INDIAN ASBESTOS INDUSTRY
15th December, 2010
www.eurekasecurities.com
4200
500200 50
0
500
1000
1500
2000
2500
3000
3500
4000
4500
plywood gypsum based cement sheetbased
calcium siliconbased
Market Size (Rs.cr/year)
Huge
opportunity for
non plywood
based players

8/8/2019 Asbestos Industry Dec10
http://slidepdf.com/reader/full/asbestos-industry-dec10 8/31
Source: Eureka Research, industry
As the above pyramid structure shows there is a huge price differential especially between cement sheet based boards and
panels and other type, namely plywood based and gypsum based. Hence going forward, we believe that a huge market
opportunity will be tapped by these three companies (Visaka Industries, Hyderabad Industries and Everest Industries).
As the above diagram shows, it is not only costs but several other physical and qualitative parameters which speak for a
compelling growth story for the cement sheet based boards and panels. They make the whole construction exercise fast and
easy apart from lower cost. Hence a very healthy yearly growth rate which is likely to exceed other competitive products'
growth rate.
EUREKA RESEARCH 8
INDIAN ASBESTOS INDUSTRY
15th December, 2010
www.eurekasecurities.com
1.2
6.5
7.5
0 1 2 3 4 5 6 7 8
Cement Sheet
Gypsum
Plywood
Cost of panels (Rs./ sq. ft/ mm)
Advantages of c ement based V-boards and panels
Cost wise quiteeconomical
compared toplyboard
Lighter & thinnerthanplywood,brick,quicker & easier to erect
by 3persons,reusable atdifferent locations
Environmentally
friendly, fireresistancecapability,ter-
mite,moisture andsound proof
Enhances LEED
rating of projects, moredurability and
longevity

8/8/2019 Asbestos Industry Dec10
http://slidepdf.com/reader/full/asbestos-industry-dec10 9/31
Industry dynamics of V-boards and V-panels: quite different for boards/panels and asbestos sheets
Comparison among asbestos cement sheets, V-boards and V-panels
The V-boards and V-panels industry is growing at a CAGR of about %10 in last 4 years as per different industry estimates. Asindustrial capex cycle picks up in next few years, it is highly likely that we are likely to witness a CAGR growth of 11-12% in next
4-5 years.
Source: industry, Eureka Research
As the following table shows, compared to asbestos cement sheets, V-boards and V-panels can bring several additional
advantages for the traditional asbestos cement manufacturers. Apart from ability to pass on raw material price hike, they
offer excellent diversification opportunities .Hence going forward it is highly likely that contribution of boards and panels will
increase their contribution to revenue from less than 3% in coming days. As these companies already enjoy strong brand
name, selling this urban and corporate centric product is not going to be difficult at all. In contrast apart from margins, they
are likely to improve working capital cycle considerably.
EUREKA RESEARCH 9
INDIAN ASBESTOS INDUSTRY
15th December, 2010
www.eurekasecurities.com
186300207000
227700
252747
283077
317046
50000
100000
150000
200000
250000
300000
350000
FY09 FY10 FY11E FY12E FY13E FY14E
Sales Volume (tons)Looking at a market of
Rs400Cr plus per year
in next 3 years,
dominated currently
by 3 players only.
cementsheet
oversupply RCCetc
V-boards/panels
Urban Corporate Yes Favourable Yes Plywood,gypsumboard etc
High
Users
(location
wise)
Users(cat
egory
wise
Pricing
power
Demand –
supply
equation
Export
potentia
l
Alternativ
e product
Longevity
&
durability
Asbestos
rural Mostlyretail
less Balanced tomoderately
No GI sheet,clay,
High

8/8/2019 Asbestos Industry Dec10
http://slidepdf.com/reader/full/asbestos-industry-dec10 10/31
Production capacity of V-boards and V-panels
Realisation and capex required per ton for asbestos cement sheet, V-boards and V-panels
In terms of V-boards capacity, Visaka Industries is ahead of its nearest rival as on today. But it is Everest Industries which is theleader in non asbestos panels. On the other hand, though Hyderabad Industries does not manufacture boards, they
manufacture Aerocon panels which is made from asbestos fiber, OPC and fly ash apart from other additives.
We believe that export potential and domestic market growth of non asbestos based boards and panels will be higher
compared to asbestos based boards or panels.
Moreover, capex requirement of boards and panels is quite high compared to that of asbestos cement sheet. Realisation per
ton and gross margin per ton of boards and panels are considerably high compared to pure asbestos cement sheets.
Thus we believe that overall sales growth of top three asbestos cement players is likely to go up in coming years apart from
improvement in margin as well as comparatively higher sales growth. Thus diversification into boards and panels has proved
to be quite timely.
EUREKA RESEARCH 10
INDIAN ASBESTOS INDUSTRY
15th December, 2010
www.eurekasecurities.com
1,20,000
90,000
10,00022,000 23000
0
20,000
40,000
60,000
80,000
1,00,000
1,20,000
1,40,000
Visaka Industries Everest Industries Hyderabad Industries
m e t r i c
t o n
n e
V boards V panels
85009500
12500
3000
10000 10000
02000
4000
6000
8000
10000
12000
14000
asbestos cement sheet V boards V panels
R s / t o n
realisation per ton capex per ton
8/8/2019 Asbestos Industry Dec10
http://slidepdf.com/reader/full/asbestos-industry-dec10 11/31
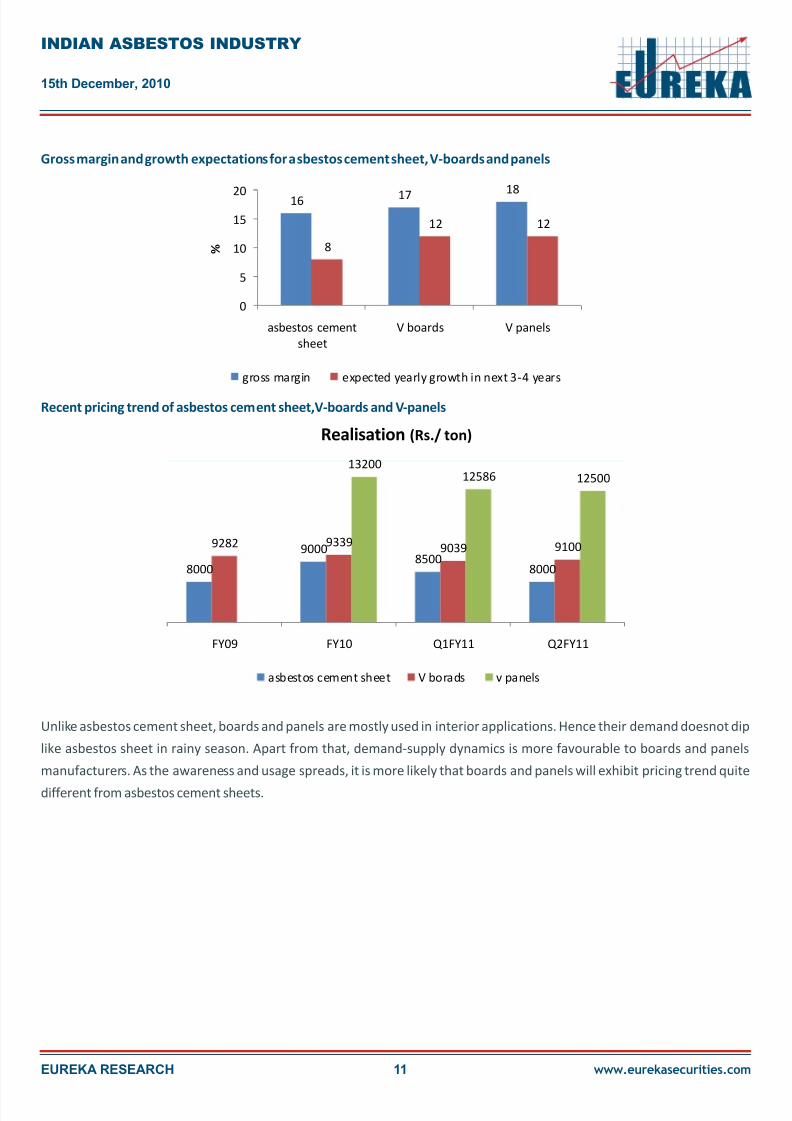
Gross margin and growth expectations for asbestos cement sheet, V-boards and panels
Recent pricing trend of asbestos cement sheet,V-boards and V-panels
Unlike asbestos cement sheet, boards and panels are mostly used in interior applications. Hence their demand doesnot dip
like asbestos sheet in rainy season. Apart from that, demand-supply dynamics is more favourable to boards and panels
manufacturers. As the awareness and usage spreads, it is more likely that boards and panels will exhibit pricing trend quite
different from asbestos cement sheets.
EUREKA RESEARCH 11
INDIAN ASBESTOS INDUSTRY
15th December, 2010
www.eurekasecurities.com
16 1718
8
12 12
0
5
10
15
20
asbestos cement
sheet
V boards V panels
%
gross margin expected yearly growth in next 3-4 years
8000
90008500
8000
9282 93399039 9100
1320012586 12500
FY09 FY10 Q1FY11 Q2FY11
Realisation (Rs./ ton)
asbestos cement sheet V borads v panels

8/8/2019 Asbestos Industry Dec10
http://slidepdf.com/reader/full/asbestos-industry-dec10 12/31
8/8/2019 Asbestos Industry Dec10
http://slidepdf.com/reader/full/asbestos-industry-dec10 13/31
Introduction:
Catering to all India demand
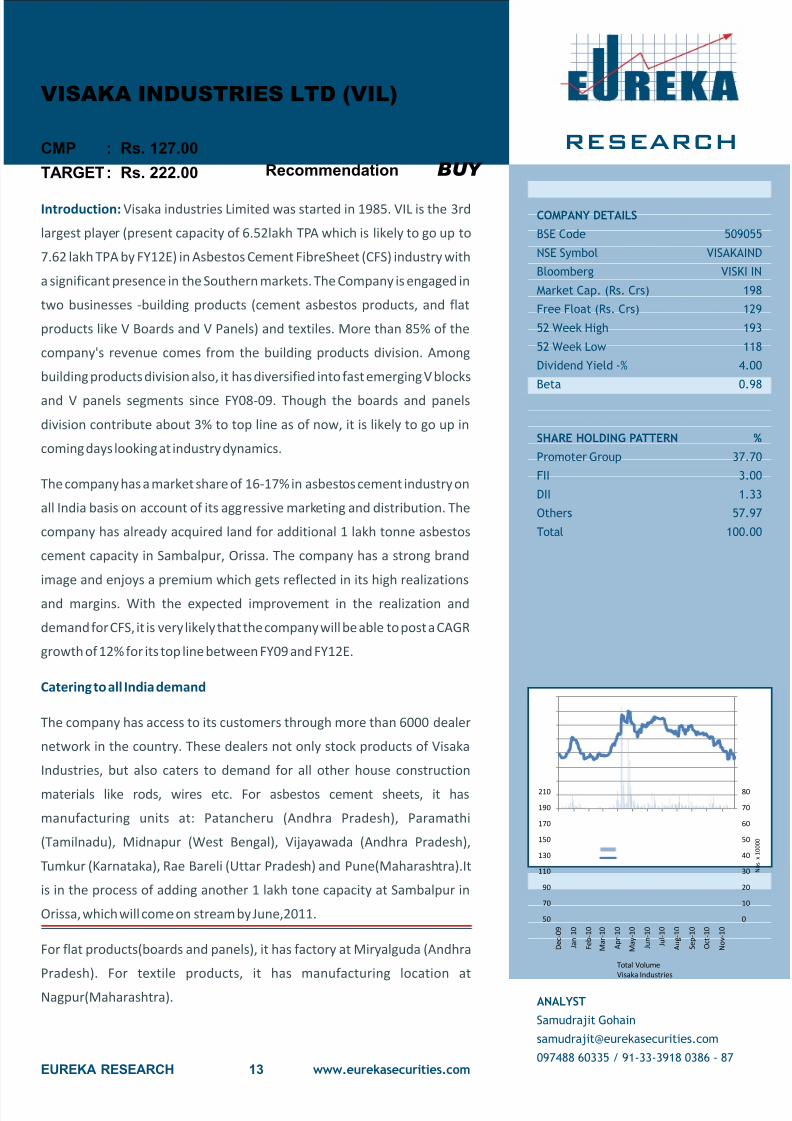
Visaka industries Limited was started in 1985. VIL is the 3rd
largest player (present capacity of 6.52lakh TPA which is likely to go up to
7.62 lakh TPA by FY12E) in Asbestos Cement FibreSheet (CFS) industry with
a significant presence in the Southern markets. The Company is engaged in
two businesses -building products (cement asbestos products, and flat
products like V Boards and V Panels) and textiles. More than 85% of the
company's revenue comes from the building products division. Among
building products division also, it has diversified into fast emerging V blocks
and V panels segments since FY08-09. Though the boards and panels
division contribute about 3% to top line as of now, it is likely to go up in
coming days looking at industry dynamics.
The company has a market share of 16-17% in asbestos cement industry on
all India basis on account of its aggressive marketing and distribution. The
company has already acquired land for additional 1 lakh tonne asbestos
cement capacity in Sambalpur, Orissa. The company has a strong brand
image and enjoys a premium which gets reflected in its high realizations
and margins. With the expected improvement in the realization and
demand for CFS, it is very likely that the company will be able to post a CAGR
growth of 12% for its top line between FY09 and FY12E.
The company has access to its customers through more than 6000 dealer
network in the country. These dealers not only stock products of Visaka
Industries, but also caters to demand for all other house construction
materials like rods, wires etc. For asbestos cement sheets, it has
manufacturing units at: Patancheru (Andhra Pradesh), Paramathi
(Tamilnadu), Midnapur (West Bengal), Vijayawada (Andhra Pradesh),
Tumkur (Karnataka), Rae Bareli (Uttar Pradesh) and Pune(Maharashtra).It
is in the process of adding another 1 lakh tone capacity at Sambalpur in
Orissa, which will come on stream by June,2011.
For flat products(boards and panels), it has factory at Miryalguda (Andhra
Pradesh). For textile products, it has manufacturing location at
Nagpur(Maharashtra).
RESEARCH
EUREKA RESEARCH www.eurekasecurities.com
BUY
VISAKA INDUSTRIES LTD (VIL)
Recommendation
CMP
TARGET
: Rs. 127.00
: Rs. 222.00
COMPANY DETAILS
SHARE HOLDING PATTERN %
BSE Code
NSE Symbol
Bloomberg
Market Cap. (Rs. Crs)
Free Float (Rs. Crs)
52 Week High
52 Week Low
Dividend Yield -%
Beta
Promoter Group
FII
DII
Others
Total
509055
VISAKAIND
VISKI IN
198
129
193
118
4.00
0.98
37.70
3.00
1.33
57.97
100.00
0
10
20
30
40
50
60
70
80
50
70
90
110
130
150
170
190
210
D e c - 0 9
J a n - 1 0
F e b - 1 0
M a r - 1 0
A p r - 1 0
M a y - 1 0
J u n - 1 0
J u l - 1 0
A u g - 1 0
S e p - 1 0
O c t - 1 0
N o v - 1 0
N o s . x 1 0 0 0 0
Total Volume
Visaka Industries
ANALYST
Samudrajit Gohain
097488 60335 / 91-33-3918 0386 - 87
13
8/8/2019 Asbestos Industry Dec10
http://slidepdf.com/reader/full/asbestos-industry-dec10 14/31
EUREKA RESEARCH 14
VISAKA
15th December, 2010
www.eurekasecurities.com
VIL has a presence in synthetic yarn for the past 15 years and is one of the leading producers of yarn in the country. VIL has a
capacity of 1816 spindle positions and produces over 10000 tons of yarn with exports of about 4000 tons globally.. The
segment is tax exempt and generates free cash flows. This segment is contributing ~20% of the revenue and enjoys EBIT
margin of 9-10% on sustainable basis.The Company is present in niche segments of what is widely perceived as a commodity
business. It makes polyester spun yarns as well as counts that range from 30s to 76s counts (double yarn) used in the value-
added segment of home textiles.
The company's synthetic yarn business is a legacy business, which it had to foray to diversify as fresh licenses for expansion in
asbestos cement division was not allowed in 80's and 90's.The company found synthetic yarn division to put to good use its
considerable free cash flow from asbestos cement sheet division in those days. But subsequently this licensing restriction on
fresh capacity addition in asbestos cement was lifted and the company has brought down the contribution from synthetic
yarn division to overall business to less than 20% by FY10. Going forward also, the company is not going to expand more in
yarn division.
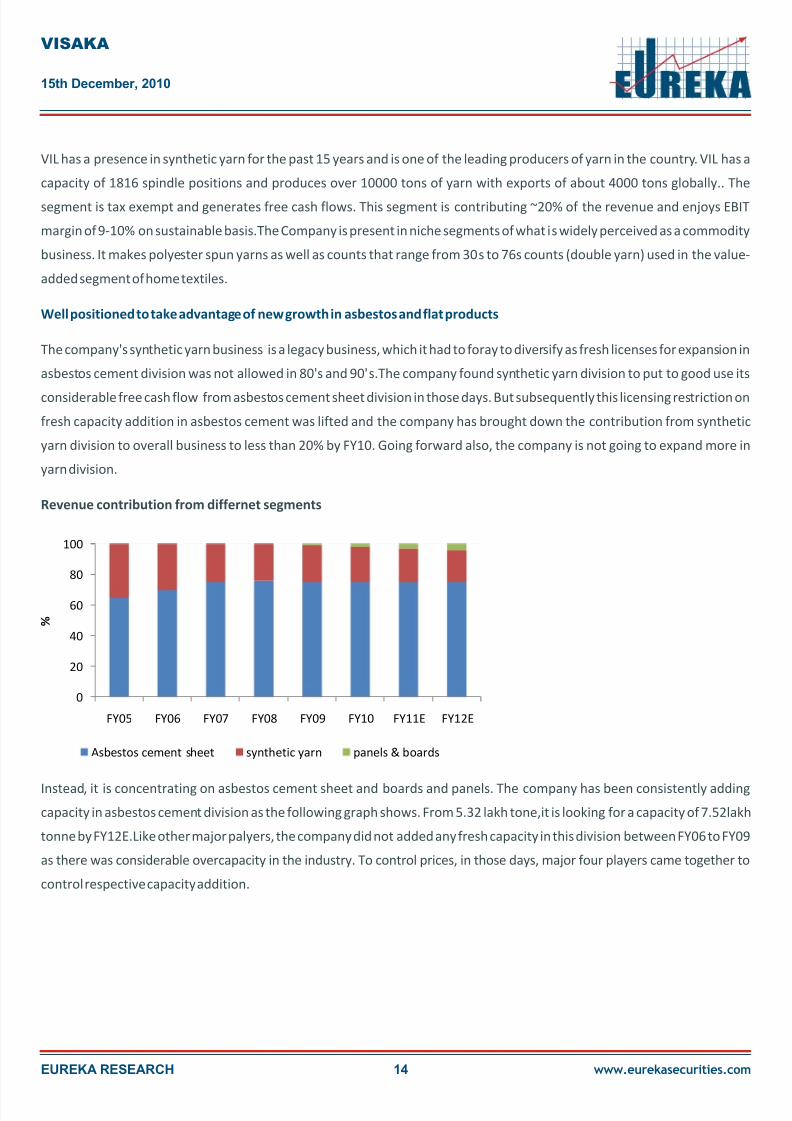
Revenue contribution from differnet segments
Instead, it is concentrating on asbestos cement sheet and boards and panels. The company has been consistently adding
capacity in asbestos cement division as the following graph shows. From 5.32 lakh tone,it is looking for a capacity of 7.52lakh
tonne by FY12E.Like other major palyers, the company did not added any fresh capacity in this division between FY06 to FY09
as there was considerable overcapacity in the industry. To control prices, in those days, major four players came together to
control respective capacity addition.
Well positioned to take advantage of new growth in asbestos and flat products
0
20
40
60
80
100
FY05 FY06 FY07 FY08 FY09 FY10 FY11E FY12E
%
Asbestos cement sheet synthetic yarn panels & boards

8/8/2019 Asbestos Industry Dec10
http://slidepdf.com/reader/full/asbestos-industry-dec10 15/31
The company was one of the first in the asbestos cement industry to take note of considerable demand and growth of non
asbestos products catering to urban and corporate requirements. The company started V boards segment in FY09 and it sold
about 10,000tons at an average realization of more than Rs9000/ton. The company has started supplying these V boards to
Middle East and Australia where there is considerable demand for this product.
The company is looking for about 7500-9000 tons of V board's production every month since Q3FY11. On the other hand, it
has started commercial sale of V panels only from Q1FY11.This panel is also becoming fast popular among corporate as it is
very good substitute for plywood. The panels generally come at a size of 1.8 square meter dimension. The pricing of V panels
at the consumer end is per panel. But at the company's end, we measure it by tonnage.
For example, if the company produces 400 panels of 1.8 square meter and 32 kg weight for 29 days in a month, the monthlytonnage will be (400*1.8*32*29/1000) 668.16.
In FY11E, the boards and panel division is likely to contribute Rs25Cr to the top line and another Rs40Cr in FY12E.The
operating margin for FY11E for boards and panels will be about 11-12% which is likely to go up to 17-18% in FY12E as volumes
pick up.
EUREKA RESEARCH 15
VISAKA
15th December, 2010
www.eurekasecurities.com
5.32 5.44 5.446.52 6.52
7.52
0
2
4
6
8
FY07 FY08 FY09 FY10 FY11E FY12E
l a k h t o n n e
Asbestos cement sheet capacity
10050
16806
6029 6200
2000022000
874 950 1200 1300
0
5000
10000
15000
20000
25000
FY09 FY10 Q1FY11 Q2FY11 Q3FY11 Q4FY11
t o n e s
boards sold panels sold

8/8/2019 Asbestos Industry Dec10
http://slidepdf.com/reader/full/asbestos-industry-dec10 16/31
Company enjoys a very comfortable working capital cycle
The asbestos cement business has a very comfortable debtor days of 30-40 days.The debtor days cycle is improving fromabout 45 days to less than 30 days in recent days. The finshed goods inventory period is 45 days. This is because, the company
has to cure asbestos cement sheets for 15 days after manufacturing.Except asbestos fiber, which is an imported product,
most other raw materials are procured as and when required.Asbestos fiber is stored for a period from 3-6 months
depending upon inward ship freight condition. Thus overall inventory days has been hovering around 60 days so far. But as V
boards and V panels production and sales pick up in coming days, overall inventory days are likely to come down further as all
the raw materials required for V boards and panels are locally produced.
Huge improvement in operating and free cash flow since FY09.
Like all other companies producing asbestos cement sheets between FY05 to FY08, the company had negligible operating
cash flow compared to sales and negative free cash flow. Since then both the parameters are improving dramatically. The
initial capital requirement for both asbestos cement sheets and boards/panels is not very significant (Rs3000-3500/ton for
asbestos cement sheet and Rs10, 000/boards).All future expansion in next few years are likely to be funded by internal
accruals and debt. ByFY12E, the debt equity ratio is likely to be around 0.3. Hence company will have significant leeway for
leverage.
EUREKA RESEARCH 16
VISAKA
15th December, 2010
www.eurekasecurities.com
63
71
62
69
5559
54 56
30 30 32
40
32 30 31 30
0
10
20
30
40
50
6070
80
FY05 FY06 FY07 FY08 FY09 FY10 FY11E FY12E
Inventory days Debtor days
-60
-40
-20
0
20
40
60
80
100
120
140
FY05 FY06 FY07 FY08 FY09 FY10 FY11E FY12E
R s . C r
operating cash flow free cash flow

8/8/2019 Asbestos Industry Dec10
http://slidepdf.com/reader/full/asbestos-industry-dec10 17/31
Healthy margins and return ratios
The FY10 was a very good year for major asbestos manufacturers in terms of margin. During that year, the company clockedEBITDA margin of about 22%. This was contributed by benign raw material prices and significant demand uptick. Since then
raw material prices especially asbestos fiber, transportation cost and wood pulp cost have significantly gone up. For
example, asbestos fiber price has gone up from about Rs32000/ton from FY10 to more than Rs38000/ton recently. As
asbestos cement manufacturers can not equally pass on raw material price hike, going forward we are likely to witness more
sustainable 16-17% EBITDA margin.
But as margins for boards and panels are high compared to that of asbestos cement sheet, may be margins may improve
after FY12 if there is significant capacity addition in boards and panels division.
Likewise, ROCE and ROE are likely to hover around 20% in coming days. This was the range companies enjoyed till FY06-07 .
Hence we are very much confident that at least pre recession return ratios will be achieved by the company in coming days,
with possibility for upside.
EUREKA RESEARCH 17
VISAKA
15th December, 2010
www.eurekasecurities.com
0
5
10
15
20
25
30
%
ROE ROCE
0
2
4
6
8
10
12
14
16
18
20
%
EBITDA PAT
8/8/2019 Asbestos Industry Dec10
http://slidepdf.com/reader/full/asbestos-industry-dec10 18/31
EUREKA RESEARCH 18
VISAKA
15th December, 2010
www.eurekasecurities.com
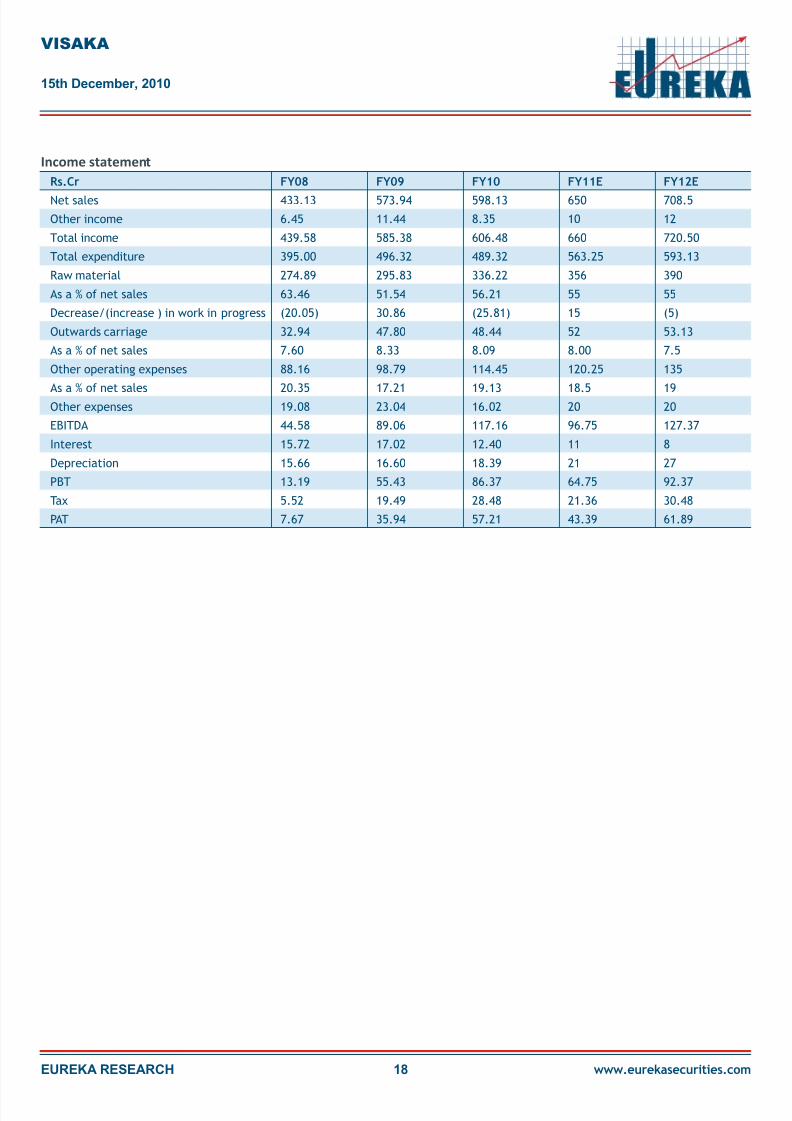
Rs.Cr
Net sales
Other income
Total income
Total expenditure
Raw material
As a % of net sales
Decrease/(increase ) in work in progress
Outwards carriage
As a % of net sales
Other operating expenses
As a % of net salesOther expenses
EBITDA
Interest
Depreciation
PBT
Tax
PAT
FY08
433.13
6.45
439.58
395.00
274.89
63.46
(20.05)
32.94
7.60
88.16
20.3519.08
44.58
15.72
15.66
13.19
5.52
7.67
FY09
573.94
11.44
585.38
496.32
295.83
51.54
30.86
47.80
8.33
98.79
17.2123.04
89.06
17.02
16.60
55.43
19.49
35.94
FY10
598.13
8.35
606.48
489.32
336.22
56.21
(25.81)
48.44
8.09
114.45
19.1316.02
117.16
12.40
18.39
86.37
28.48
57.21
FY11E
650
10
660
563.25
356
55
15
52
8.00
120.25
18.520
96.75
11
21
64.75
21.36
43.39
FY12E
708.5
12
720.50
593.13
390
55
(5)
53.13
7.5
135
1920
127.37
8
27
92.37
30.48
61.89
Income statement

8/8/2019 Asbestos Industry Dec10
http://slidepdf.com/reader/full/asbestos-industry-dec10 19/31

8/8/2019 Asbestos Industry Dec10
http://slidepdf.com/reader/full/asbestos-industry-dec10 20/31
Recommendation
The company is well on its track for profitable expansion trajectory. The company is likely to post around 9% growth in its top
line and more than 40% growth in bottom-line between FY11E and FY12E. The company will have significant cash and
equivalents (around Rs50/share) by FY12E. Thus company is likely to enjoy considerable yearly free cash flow for next couple
of years as rural demand is unlikely to dip meaningfully and there is more mutual understanding among top three players in
the asbestos cement industry these days to mitigate price damage from overcapacity.
Currently the management has about 38% stake in the company. We believe that there is significant possibility of share
buyback or increase in dividend payout ratio (currently 50%).
As revenue contribution from non asbestos products pick up in next couple of years, there is significant possibility of rerating
of the company.
The company is likely to post about Rs39 EPS in FY12E. Applying a P/E multiple of 5.5 to FY12E EPS, we arrive a target price of
Rs209.On the other hand applying a EV/EBITDA of 3, we arrive a target price of Rs235.Taking average of both these prices,
we arrive at a target price of Rs222.
EUREKA RESEARCH 20
VISAKA
15th December, 2010
www.eurekasecurities.com
Key ratios
D/E
Debtor days
Inventory turnover ratio(x)
Fixed asset turnover ratio(x)
Working capital turnover(x)
RONW
ROCE
EV/sales
EV/EBITDA
P/BV
P/E
FY08
1.2
45.2
4.6
1.6
2.8
6.2
9.76
0.9
9.99
1.3
27.4
FY09
0.9
33.8
6.4
1.8
3.7
20.71
20.67
0.6
4.3
1.1
5.8
FY10
0.78
30
6.2
1.99
3.14
27.02
26.19
0.6
3.2
1
4.2
FY11E
0.5
31
6.7
1.95
3.45
21
19
0.4
2.73
0.8
4.7
FY12E
0.3
30
6.5
1.86
3.94
19.28
18.50
0.3
1.66
0.6
3.3
8/8/2019 Asbestos Industry Dec10
http://slidepdf.com/reader/full/asbestos-industry-dec10 21/31
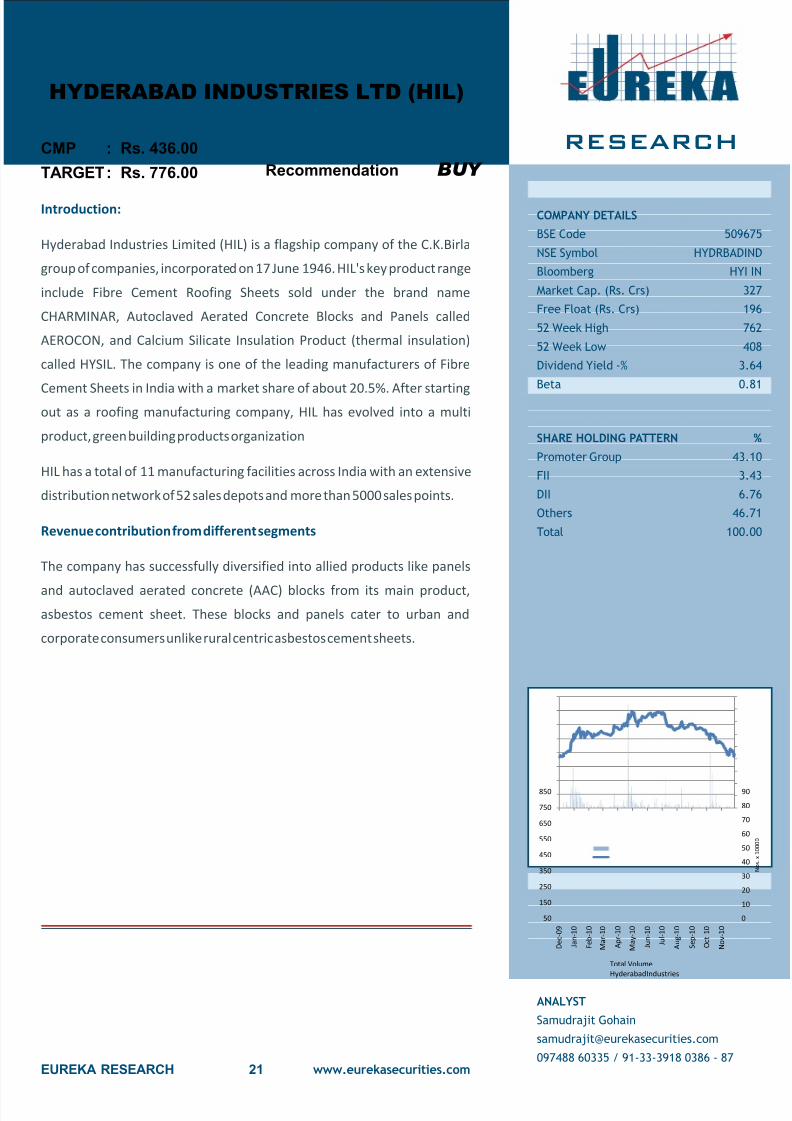
Introduction:
Revenue contribution from different segments
Hyderabad Industries Limited (HIL) is a flagship company of the C.K.Birla
group of companies, incorporated on 17 June 1946. HIL's key product range
include Fibre Cement Roofing Sheets sold under the brand name
CHARMINAR, Autoclaved Aerated Concrete Blocks and Panels called
AEROCON, and Calcium Silicate Insulation Product (thermal insulation)
called HYSIL. The company is one of the leading manufacturers of Fibre
Cement Sheets in India with a market share of about 20.5%. After startingout as a roofing manufacturing company, HIL has evolved into a multi
product, green building products organization
HIL has a total of 11 manufacturing facilities across India with an extensive
distribution network of 52 sales depots and more than 5000 sales points.
The company has successfully diversified into allied products like panels
and autoclaved aerated concrete (AAC) blocks from its main product,
asbestos cement sheet. These blocks and panels cater to urban and
corporate consumers unlike rural centric asbestos cement sheets.
RESEARCH
EUREKA RESEARCH www.eurekasecurities.com
BUY
HYDERABAD INDUSTRIES LTD (HIL)
Recommendation
CMP
TARGET
: Rs. 436.00
: Rs. 776.00
COMPANY DETAILS
SHARE HOLDING PATTERN %
BSE Code
NSE Symbol
Bloomberg
Market Cap. (Rs. Crs)
Free Float (Rs. Crs)
52 Week High
52 Week Low
Dividend Yield -%
Beta
Promoter Group
FII
DII
Others
Total
509675
HYDRBADIND
HYI IN
327
196
762
408
3.64
0.81
43.10
3.43
6.76
46.71
100.00
ANALYST
Samudrajit Gohain
097488 60335 / 91-33-3918 0386 - 87
21
0
10
20
30
40
50
60
70
80
90
50
150
250
350
450
550
650
750
850
D e c - 0 9
J a n - 1 0
F e b - 1 0
M a r - 1 0
A p r - 1 0
M a y - 1 0
J u n - 1 0
J u l - 1 0
A u g - 1 0
S e p - 1 0
O c t - 1 0
N o v - 1 0
N o s . x 1 0 0 0 0
Total Volume
Hyderabad Industries

8/8/2019 Asbestos Industry Dec10
http://slidepdf.com/reader/full/asbestos-industry-dec10 22/31
But still value wise, the contribution of its asbestos cement sheet is the highest. This is followed by AAC blocks, thermalinsulation products and panels.
The company is likely to maintain asbestos cement division's contribution to top line at about 86-87% in coming days. The
company is trying to cater to urban and corporate demand through AAC blocks and panels. On the other hand, thermal
insulation products cater to industrial demand. With pickup in demand from real estate and industrial capex, both these
divisions are expected to do well in future.
Revenue contribution from different segments
EUREKA RESEARCH 22
HYDERABAD INDUSTRIES LTD. (HIL)
15th December, 2010
www.eurekasecurities.com
Thermal insulation products
Panels
AAC blocks
Asbestos cement sheet
cement, power, petrochemical,
fertilizer plants etc.
Partition, Prefabricated House,
Mezzanine flooring, Schools and
Low cost housing
Residential apartments,
Commercial complex, Industrial
complex, mall etc.
Industrial sheds, Agricultural
buildings, Warehouses, Poultry
farms, Garage, Verandahs etc.
uses
HYSIL
Aerocon
Aerocon
Charminar, Malabar
Brand name
89 87.5 86 86.5 87 87 86
3.3 67 6.5 5.2 5.5
6
32.3 2 2.2 3.1 3.3 3.5
4.7 4.2 5 4.8 4.7 4.2 4.5
75
80
85
90
95
100
FY06 FY07 FY08 FY09 FY10 FY11E FY12E
r e v e n u e c o n
t r i b u t i o n ( % )
cement fibre sheet AAC blocks panels thermal insulation products
8/8/2019 Asbestos Industry Dec10
http://slidepdf.com/reader/full/asbestos-industry-dec10 23/31
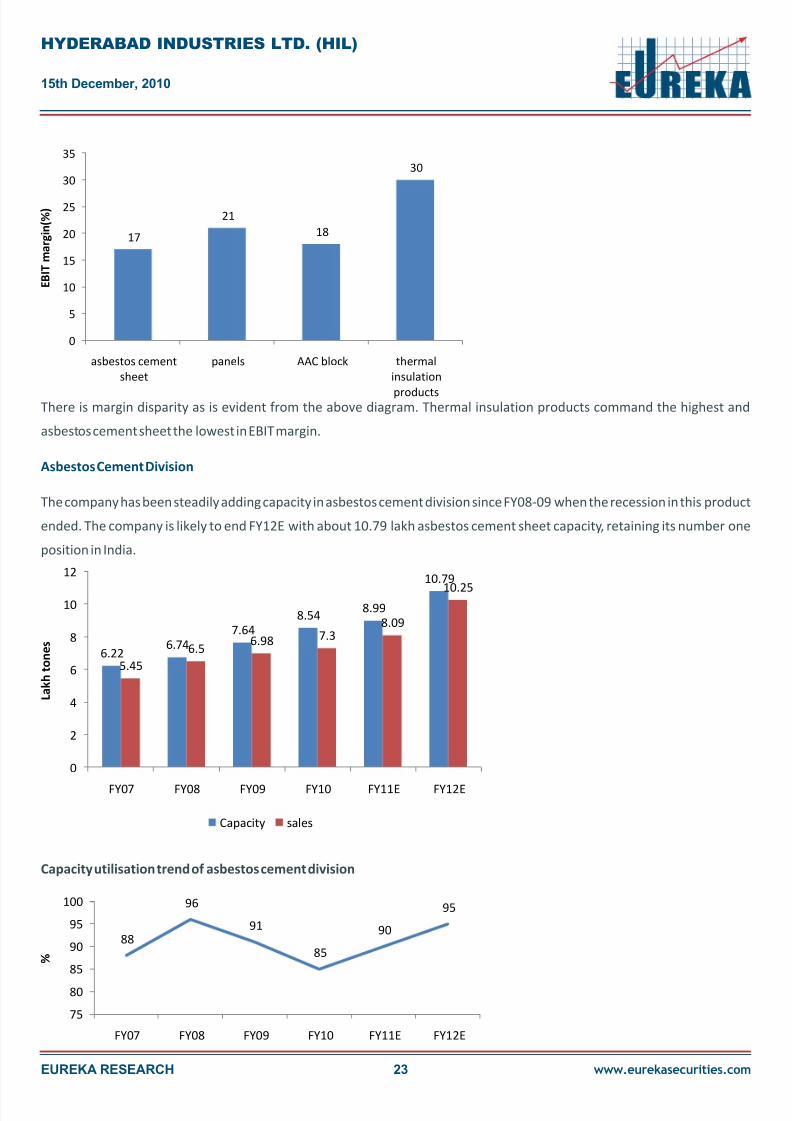
There is margin disparity as is evident from the above diagram. Thermal insulation products command the highest and
asbestos cement sheet the lowest in EBIT margin.
The company has been steadily adding capacity in asbestos cement division since FY08-09 when the recession in this product
ended. The company is likely to end FY12E with about 10.79 lakh asbestos cement sheet capacity, retaining its number one
position in India.
Capacity utilisation trend of asbestos cement division
Asbestos Cement Division
EUREKA RESEARCH 23
HYDERABAD INDUSTRIES LTD. (HIL)
15th December, 2010
www.eurekasecurities.com
6.226.74
7.648.54
8.99
10.79
5.45
6.56.98 7.3
8.09
10.25
0
2
4
6
8
10
12
FY07 FY08 FY09 FY10 FY11E FY12E
L a k h t o n e s
Capacity sales
88
96
91
85
90
95
75
80
85
90
95
100
FY07 FY08 FY09 FY10 FY11E FY12E
%
17
21
18
30
0
5
10
15
20
25
30
35
asbestos cement
sheet
panels AAC block thermal
insulation
products
E B I T m a r g i n ( % )
8/8/2019 Asbestos Industry Dec10
http://slidepdf.com/reader/full/asbestos-industry-dec10 24/31
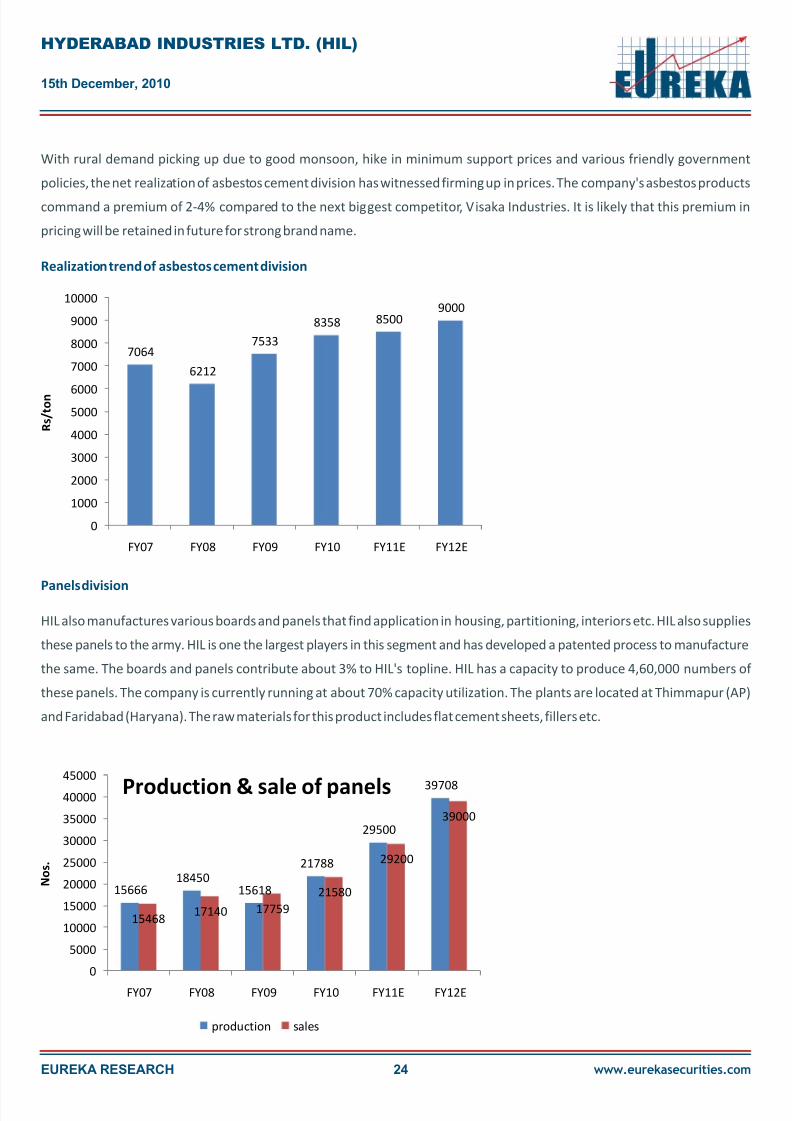
With rural demand picking up due to good monsoon, hike in minimum support prices and various friendly government
policies, the net realization of asbestos cement division has witnessed firming up in prices. The company's asbestos products
command a premium of 2-4% compared to the next biggest competitor, Visaka Industries. It is likely that this premium in
pricing will be retained in future for strong brand name.
HIL also manufactures various boards and panels that find application in housing, partitioning, interiors etc. HIL also supplies
these panels to the army. HIL is one the largest players in this segment and has developed a patented process to manufacture
the same. The boards and panels contribute about 3% to HIL's topline. HIL has a capacity to produce 4,60,000 numbers of
these panels. The company is currently running at about 70% capacity utilization. The plants are located at Thimmapur (AP)
and Faridabad (Haryana). The raw materials for this product includes flat cement sheets, fillers etc.
Realization trend of asbestos cement division
Panels division
EUREKA RESEARCH 24
HYDERABAD INDUSTRIES LTD. (HIL)
15th December, 2010
www.eurekasecurities.com
7064
6212
7533
8358 85009000
0
1000
2000
3000
4000
50006000
7000
8000
9000
10000
FY07 FY08 FY09 FY10 FY11E FY12E
R s / t o n
1566618450
15618
21788
29500
39708
1546817140 17759
21580
29200
39000
0
5000
10000
15000
20000
25000
30000
35000
40000
45000
FY07 FY08 FY09 FY10 FY11E FY12E
N o s .
Production & sale of panels
production sales

8/8/2019 Asbestos Industry Dec10
http://slidepdf.com/reader/full/asbestos-industry-dec10 25/31
Realisation Trend of Panels
AAC blocks are lightweight, building material that provides structure, insulation, fire and mold resistance in a single material.
AAC's high resource efficiency gives it low environmental impact in all phases of its life cycle, from processing of raw
materials to the disposal of AAC waste. AAC's lightweight also saves energy in transportation. AAC's excellent thermal
efficiency makes a major contribution to environmental protection by sharply reducing the need for space heating and
cooling in buildings. Though initial construction cost is comparatively high, overall energy consumption in terms of
requirement for A.C comes down by 15-20%.Thus there is overall saving apart from comfort.
HIL currently has one AAC block manufacturing plant at Chennai with capacity of 1.5 lakh Cu M (expanded by 50,000 Cu M in
FY10) another new plant at Surat with a capacity of 2.2 lakh Cu.m. These plants cater to the need of Southern and Western
market. Currently, HIL commands 40% of market share in the South. The concept of AAC blocks is more popular in Western
and southern India compared to North and East.The blocks contribute about 5.5% to HIL's topline.. Raw materials for this
product include lime, flyash, cement and some additives. Competitors in this segment include BILT,Mohit Industries , Siporex
etc.
AAC blocks division
EUREKA RESEARCH 25
HYDERABAD INDUSTRIES LTD. (HIL)
15th December, 2010
www.eurekasecurities.com
11494
10158
9781
1017110300
10500
8500
9000
9500
10000
10500
11000
11500
12000
FY07 FY08 FY09 FY10 FY11E FY12E
R s / N o .
1 , 0 0 , 0 0 0
1 , 0 0 , 0 0 0
1 , 0 0 , 0 0 0
1 , 0 0 , 0 0 0
3 , 0 2 , 0 0 0
3 , 0 2 , 0 0 0
7 3 1 3 5
8 1 1 5 7
8 8 0 5 1
7 9 6 6 0
8 5 0 0 0
9 5 0 0 0
7 2 5 1 4
7 9 4 2 1
9 0 3 2 8
7 4 8 8 1
8 2 0 0 0
9 3 0 0 0
0
50,000
1,00,000
1,50,000
2,00,000
2,50,000
3,00,000
3,50,000
FY07 FY08 FY09 FY10 FY11E FY12E
C u . M
capacity production sale

8/8/2019 Asbestos Industry Dec10
http://slidepdf.com/reader/full/asbestos-industry-dec10 26/31
The AAC blocks business has become competitive in recent times with indiscriminate setting of capacities by several small
players and aggressive marketing by them. But it is highly likely that at some point of time in future, quality consciousness
among customers will emerge and they will go for branded and reputed AAC block manufacturers like Hyderabad Industries.
Currently AAC blocks sold by Hyderabad Industries sell at a premium of 4-5% compared to other players.
Cement, power, petrochemical,fertiliser plants etc are typical users of this division. Due to their superior properties and high
quality, the company's products have good acceptance over its substitutes. Calcium silicate is commonly used as a safe
alternative to asbestos for high temperature insulation materials. Industrial grade piping and equipment insulation is often
fabricated from calcium silicate. Efforts are being made for developing new applications to expand the market size. Rawmaterials for this product include lime, calcium silicate and used glass. Power and fuel costs play a major role in the
production of this product. The company had increased the production capacity at its Dharuhera plant to 6,000 MT per
annum, from 3,500 MT per annum in FY09. In FY10, HIL has increased the capacity by another 2,500 MT taking the total
capacity to 8,500 MT as of 1 April 2010. The company is likely to end FY12E with an installed capacity of 9300 tons.This
product contributes about 4.7% to revenue. HIL has a 76% all India market share in this product. Other players include Mega
Insulation and Nuchem.
The company has been steadily increasing its capacity to cater to the growing demand from user industries.This division has
utilisation rate of around 90%. This division has high EBIT margin in the range of 30%.
Realisation trend of AAC blocks
Thermal insulation division
EUREKA RESEARCH 26
HYDERABAD INDUSTRIES LTD. (HIL)
15th December, 2010
www.eurekasecurities.com
2696
3285
3805 39064200
4500
0
500
1000
1500
2000
2500
3000
3500
4000
4500
5000
FY07 FY08 FY09 FY10 FY11E FY12E
R s . C u . M
3 5 0 0
3 5 0 0
6 0 0 0
6 0 0 0
8 5 0 0
9 3 0 0
3 3 3 9
3 8 8 4
4 6 1 6
5 3 5 3
7 2 2 5 8
0 0 0
3 5 7 7
3 9 0 9 4
7 2 8
5 3 3 2
7 2 0 0 7
9 9 0
0
1000
2000
3000
4000
5000
6000
7000
8000
9000
10000
FY07 FY08 FY09 FY10 FY11E FY12E
t o n n e s
capacity production sale
8/8/2019 Asbestos Industry Dec10
http://slidepdf.com/reader/full/asbestos-industry-dec10 27/31
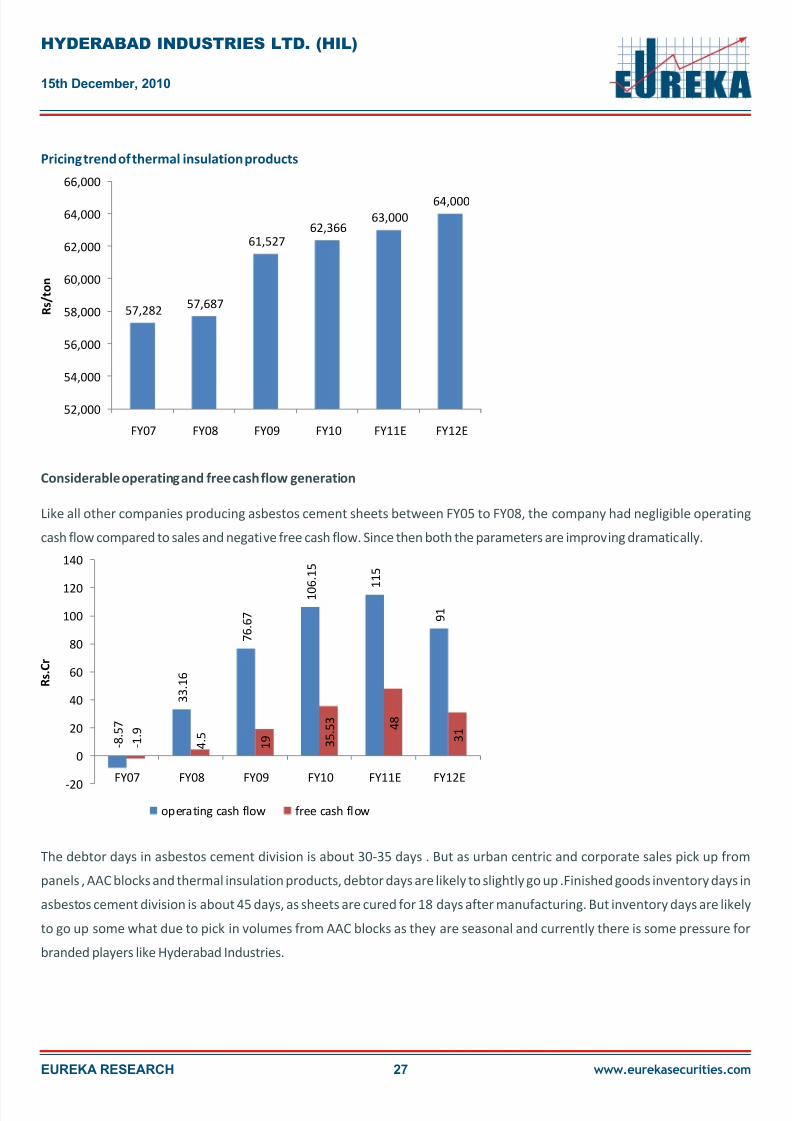
Pricing trend of thermal insulation products
Considerable operating and free cash flow generation
Like all other companies producing asbestos cement sheets between FY05 to FY08, the company had negligible operating
cash flow compared to sales and negative free cash flow. Since then both the parameters are improving dramatically.
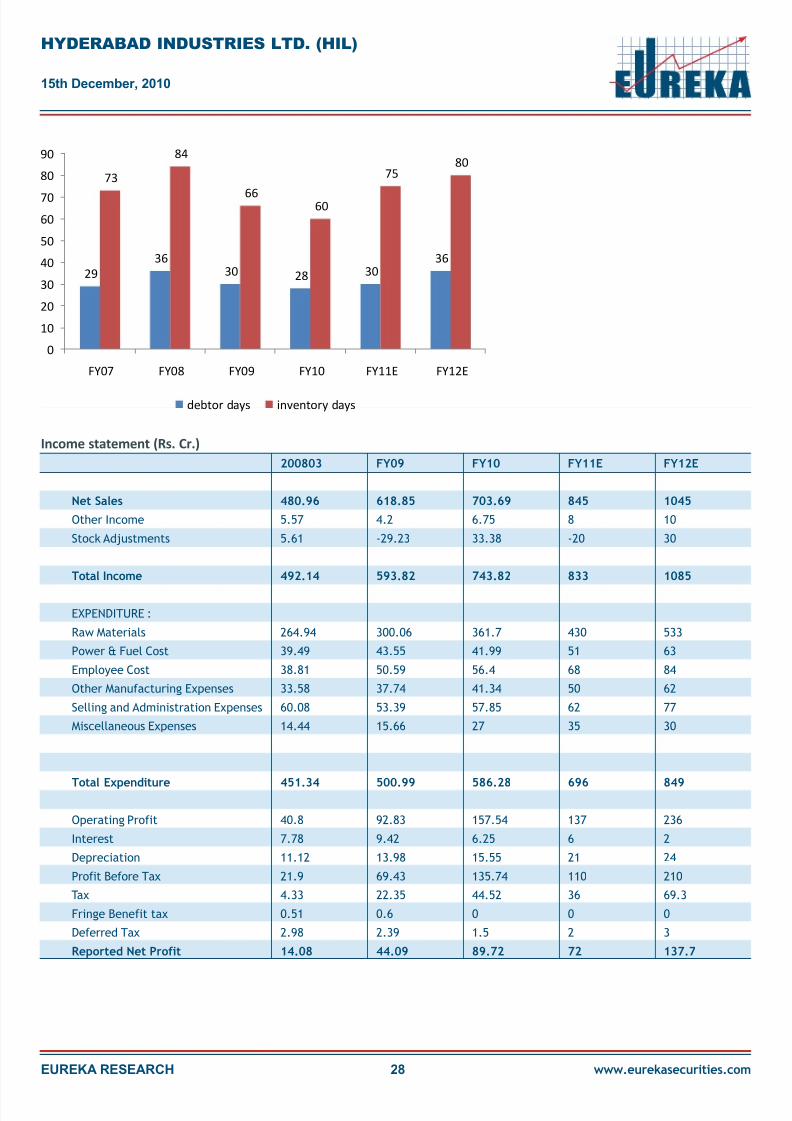
The debtor days in asbestos cement division is about 30-35 days . But as urban centric and corporate sales pick up from
panels , AAC blocks and thermal insulation products, debtor days are likely to slightly go up .Finished goods inventory days in
asbestos cement division is about 45 days, as sheets are cured for 18 days after manufacturing. But inventory days are likely
to go up some what due to pick in volumes from AAC blocks as they are seasonal and currently there is some pressure for
branded players like Hyderabad Industries.
EUREKA RESEARCH 27
HYDERABAD INDUSTRIES LTD. (HIL)
15th December, 2010
www.eurekasecurities.com
57,28257,687
61,52762,366
63,000
64,000
52,000
54,000
56,000
58,000
60,000
62,000
64,000
66,000
FY07 FY08 FY09 FY10 FY11E FY12E
R s / t o n
- 8 . 5 7
3 3 . 1 6
7 6 . 6 7
1 0 6 . 1 5
1 1 5
9 1
- 1 . 9
4 . 5
1 9 3
5 . 5 3
4 8
3 1
-20
0
20
40
60
80
100
120
140
FY07 FY08 FY09 FY10 FY11E FY12E
R s . C r
operating cash flow free cash flow
8/8/2019 Asbestos Industry Dec10
http://slidepdf.com/reader/full/asbestos-industry-dec10 28/31
8/8/2019 Asbestos Industry Dec10
http://slidepdf.com/reader/full/asbestos-industry-dec10 29/31
Net cash from operating activities
Net Cash Used in Investing activities
Net Cash Used in Financing activities
Net Inc/(Dec) in Cash and Cash Equivalent
Cash and Cash Equivalents at End of the year
2008
33.16
-28.66
5.32
9.82
16.28
2009
76.67
-57.68
-24.81
-5.82
10.46
20100
106.15
-70.62
-35.49
0.04
10.5
2011E
115
-67.5
-8
39.5
50
2012E
91
-60
-36
-5
45
Cash flow statement(Rs.Cr)
SOURCES OF FUNDS :Share Capital
Reserves Total
Total Shareholders Funds
Secured Loans
Unsecured Loans
Total Debt
Total Liabilities
APPLICATION OF FUNDS :
Gross Block
Less : Accumulated Depreciation
Net Block
Capital Work in Progress
Investments
Current Assets, Loans & Advances
Inventories
Sundry Debtors
Cash and Bank
Loans and Advances
Total Current AssetsLess : Current Liabilities and Provisions
Current Liabilities
Provisions
Total Current Liabilities
Net Current Assets
Deferred Tax Assets
Deferred Tax Liability
Net Deferred Tax
Total Assets
FY08
7.49
143.52
151.01
70.31
21.46
91.77
242.78
238.36
109.14
129.22
22.99
9.45
113.48
47.89
16.28
22.07
199.72
91.9
10.39
102.29
97.43
4.62
20.93
-16.31
242.78
FY09
7.49
178.71
186.2
46.84
33.48
80.32
266.52
282.21
122.41
159.8
36.53
9.34
111.53
50.61
10.46
19.03
191.63
97.52
14.57
112.09
79.54
4.31
23
-18.69
266.52
FY10
7.49
254.29
261.78
32.02
32.61
64.63
326.41
321.11
137.51
183.6
69.08
9.23
138.51
52.49
10.5
21.77
223.27
123.59
14.99
138.58
84.69
5.14
25.33
-20.19
326.41
FY11E
7.49
319
326.49
20
36
56
382.49
420
150
270
18
9.23
174
70
50
30
324
190
25
215
109
6
30
-24
382.49
FY12E
7.49
444
451.49
5
15
20
471.49
480
167
313
20
9.23
224
105
45
36
410
209
40
249
161
8
40
-32
471.49
Balance sheet(Rs.Cr)
EUREKA RESEARCH 29
HYDERABAD INDUSTRIES LTD. (HIL)
15th December, 2010
www.eurekasecurities.com
8/8/2019 Asbestos Industry Dec10
http://slidepdf.com/reader/full/asbestos-industry-dec10 30/31
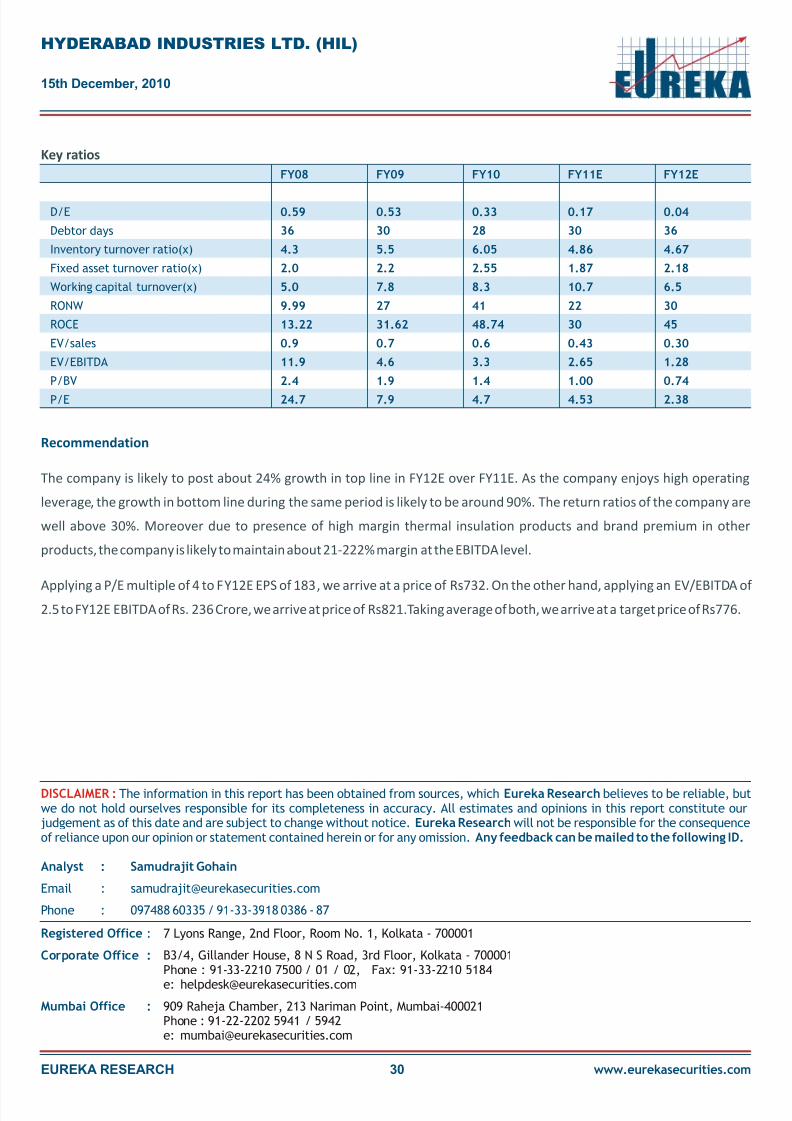
Recommendation
The company is likely to post about 24% growth in top line in FY12E over FY11E. As the company enjoys high operating
leverage, the growth in bottom line during the same period is likely to be around 90%. The return ratios of the company are
well above 30%. Moreover due to presence of high margin thermal insulation products and brand premium in other
products, the company is likely to maintain about 21-222% margin at the EBITDA level.
Applying a P/E multiple of 4 to FY12E EPS of 183, we arrive at a price of Rs732. On the other hand, applying an EV/EBITDA of 2.5 to FY12E EBITDA of Rs. 236 Crore, we arrive at price of Rs821.Taking average of both, we arrive at a target price of Rs776.
HYDERABAD INDUSTRIES LTD. (HIL)
15th December, 2010
EUREKA RESEARCH 30 www.eurekasecurities.com
Registered Office :
Corporate Office :
Mumbai Office :
7 Lyons Range, 2nd Floor, Room No. 1, Kolkata - 700001
B3/4, Gillander House, 8 N S Road, 3rd Floor, Kolkata - 700001Phone : 91-33-2210 7500 / 01 / 02, Fax: 91-33-2210 5184
909 Raheja Chamber, 213 Nariman Point, Mumbai-400021Phone : 91-22-2202 5941 / 5942e: [email protected]
DISCLAIMER : The information in this report has been obtained from sources, which Eureka Research believes to be reliable, butwe do not hold ourselves responsible for its completeness in accuracy. All estimates and opinions in this report constitute ourjudgement as of this date and are subject to change without notice. Eureka Researchwill not be responsible for the consequenceof reliance upon our opinion or statement contained herein or for any omission. Any feedback can be mailed to the following ID.
Analyst : Samudrajit Gohain
Email : [email protected]
Phone : 097488 60335 / 91-33-3918 0386 - 87
D/E
Debtor days
Inventory turnover ratio(x)
Fixed asset turnover ratio(x)
Working capital turnover(x)
RONW
ROCE
EV/sales
EV/EBITDA
P/BV
P/E
FY08
0.59
36
4.3
2.0
5.0
9.99
13.22
0.9
11.9
2.4
24.7
FY09
0.53
30
5.5
2.2
7.8
27
31.62
0.7
4.6
1.9
7.9
FY10
0.33
28
6.05
2.55
8.3
41
48.74
0.6
3.3
1.4
4.7
FY11E
0.17
30
4.86
1.87
10.7
22
30
0.43
2.65
1.00
4.53
FY12E
0.04
36
4.67
2.18
6.5
30
45
0.30
1.28
0.74
2.38
Key ratios

8/8/2019 Asbestos Industry Dec10
http://slidepdf.com/reader/full/asbestos-industry-dec10 31/31