ascendere associates llc innovative long/short equity … · 4/1/2016 · y/y change 0.1% 14.1%...
TRANSCRIPT

Ascendere Associates LLC [email protected] J. Stephen Castellano Page 1 March 31, 2016
Ascendere Associates LLC Innovative Long/Short Equity Research
Model Portfolio Monthly Update: March 31, 2016 There are limitations inherent in our theoretical model results, particularly with the fact that such results do not represent actual trading and they may not reflect the impact material economic and market factors might have had on our decision making if we were actually managing client money. Please see additional disclaimers and disclosures at the back of this report. We highlight stocks that demonstrate solid growth at a reasonable price (GARP). Stocks selected for our model portfolio strategies all rank highly for the following metrics, with an emphasis on proxies for cash flow growth and ROIC:
• Relative Value • Operating Momentum • Analyst Revision Momentum • Fundamental Quality
Pages 2-6 contain brief commentary and highlights of a few stocks that seem particularly attractive. Page 7 contains rebalancing actions for our long-only model portfolio. Page 8 contains rebalancing actions for our short-only model portfolio. Target and stop prices, as well as updated return data, to be provided in our daily reports that will follow.
Ascendere Associates LLC [email protected] J. Stephen Castellano Page 2 March 31, 2016
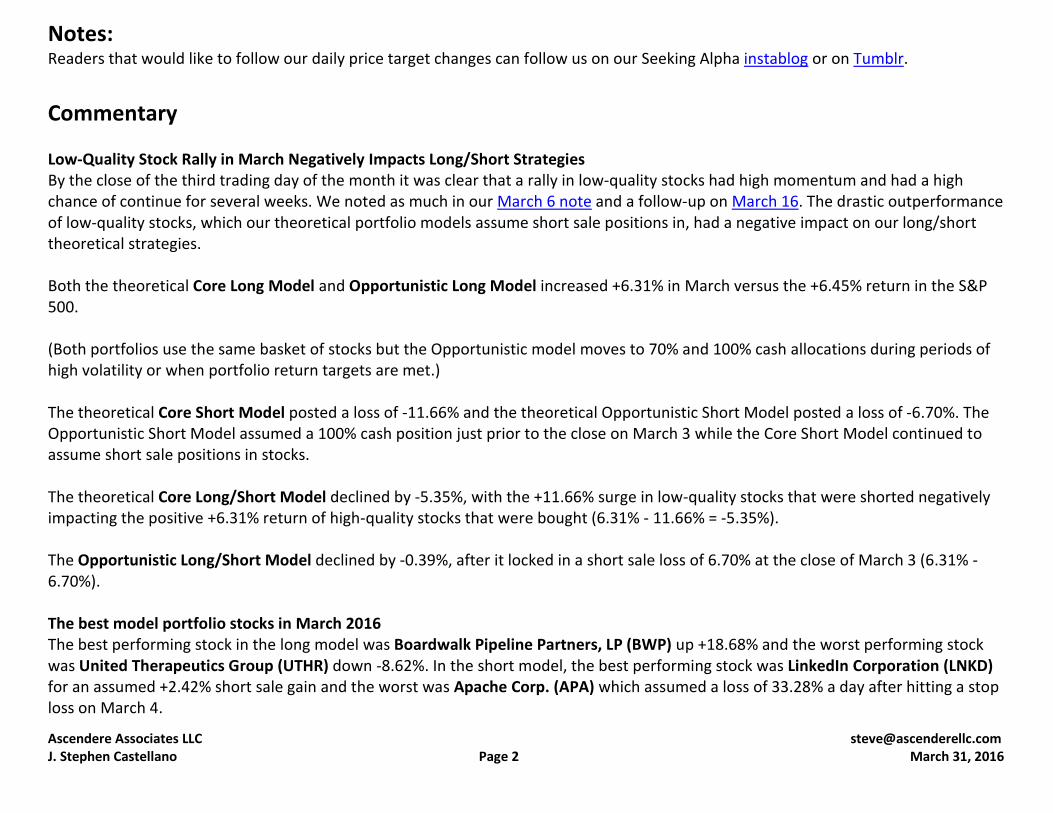
Notes: Readers that would like to follow our daily price target changes can follow us on our Seeking Alpha instablog or on Tumblr.
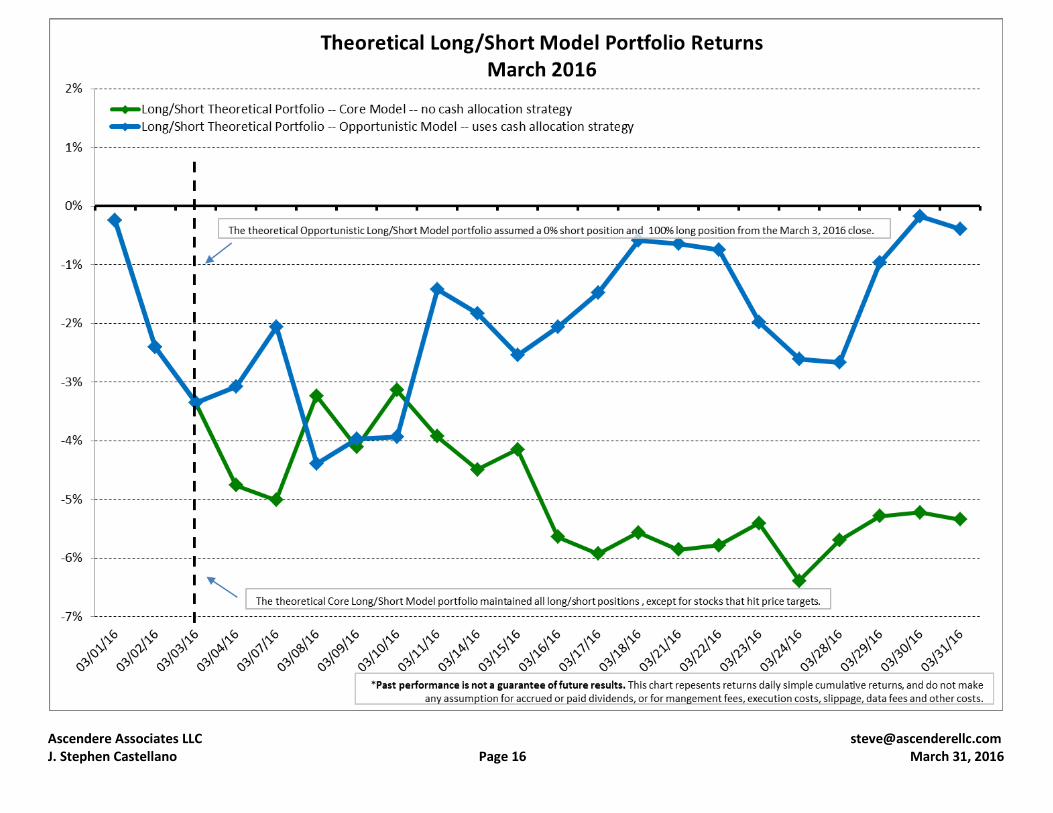
Commentary Low-Quality Stock Rally in March Negatively Impacts Long/Short Strategies By the close of the third trading day of the month it was clear that a rally in low-quality stocks had high momentum and had a high chance of continue for several weeks. We noted as much in our March 6 note and a follow-up on March 16. The drastic outperformance of low-quality stocks, which our theoretical portfolio models assume short sale positions in, had a negative impact on our long/short theoretical strategies. Both the theoretical Core Long Model and Opportunistic Long Model increased +6.31% in March versus the +6.45% return in the S&P 500. (Both portfolios use the same basket of stocks but the Opportunistic model moves to 70% and 100% cash allocations during periods of high volatility or when portfolio return targets are met.) The theoretical Core Short Model posted a loss of -11.66% and the theoretical Opportunistic Short Model posted a loss of -6.70%. The Opportunistic Short Model assumed a 100% cash position just prior to the close on March 3 while the Core Short Model continued to assume short sale positions in stocks. The theoretical Core Long/Short Model declined by -5.35%, with the +11.66% surge in low-quality stocks that were shorted negatively impacting the positive +6.31% return of high-quality stocks that were bought (6.31% - 11.66% = -5.35%). The Opportunistic Long/Short Model declined by -0.39%, after it locked in a short sale loss of 6.70% at the close of March 3 (6.31% - 6.70%). The best model portfolio stocks in March 2016 The best performing stock in the long model was Boardwalk Pipeline Partners, LP (BWP) up +18.68% and the worst performing stock was United Therapeutics Group (UTHR) down -8.62%. In the short model, the best performing stock was LinkedIn Corporation (LNKD) for an assumed +2.42% short sale gain and the worst was Apache Corp. (APA) which assumed a loss of 33.28% a day after hitting a stop loss on March 4.

Ascendere Associates LLC [email protected] J. Stephen Castellano Page 3 March 31, 2016
Last month our favorite long idea was Lowe's Companies, Inc. (LOW), which finished the month up 12.17%. Our favorite short idea for March was Autodesk, Inc. (ADSK), which was up 12.70% for the equivalent short sale loss. Looking ahead to April 2016 As of the March 31, 2016 close, 6 stocks have left the long-only model, 8 have been added, and 15 were assumed to have been rebalanced. A preliminary rebalancing model was provided close to 2pm on March 31. This final version is unchanged except for the addition of one stock.
Ascendere Associates LLC [email protected] J. Stephen Castellano Page 4 March 31, 2016
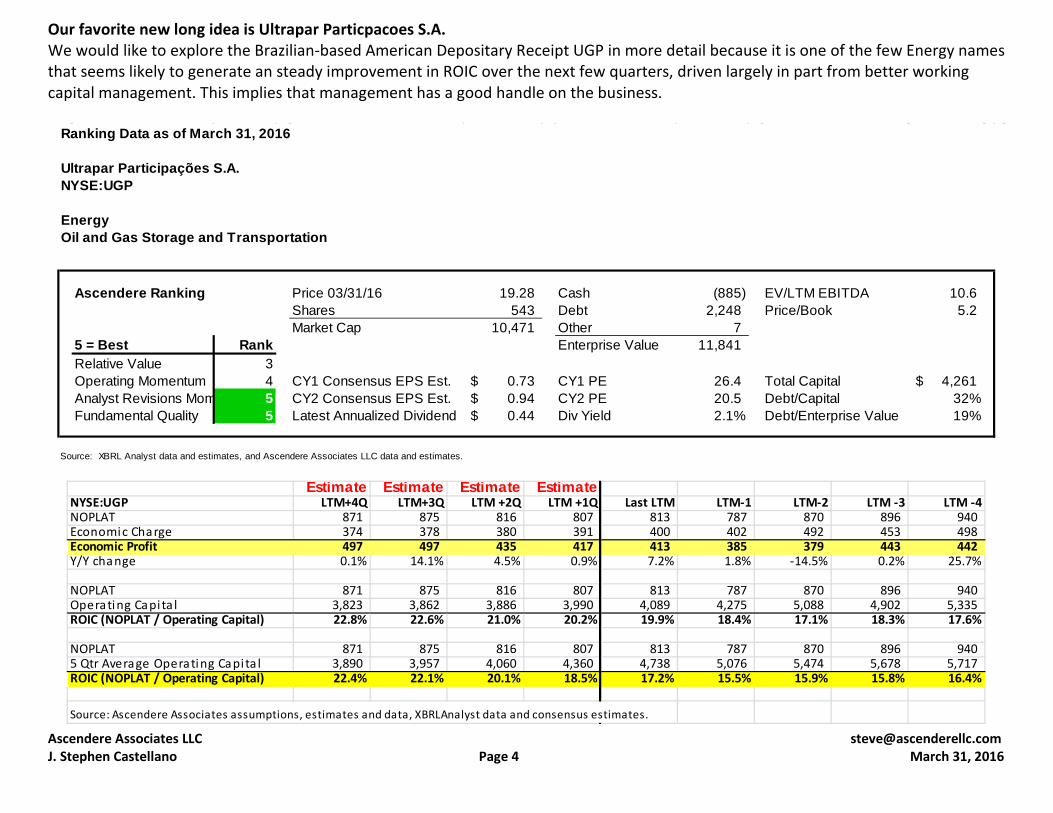
Our favorite new long idea is Ultrapar Particpacoes S.A. We would like to explore the Brazilian-based American Depositary Receipt UGP in more detail because it is one of the few Energy names that seems likely to generate an steady improvement in ROIC over the next few quarters, driven largely in part from better working capital management. This implies that management has a good handle on the business.
Ranking Data as of March 31, 2016
Ultrapar Participações S.A.NYSE:UGP
EnergyOil and Gas Storage and Transportation
Ascendere Ranking Price 03/31/16 19.28 Cash (885) EV/LTM EBITDA 10.6 Shares 543 Debt 2,248 Price/Book 5.2 Market Cap 10,471 Other 7
5 = Best Rank Enterprise Value 11,841 Relative Value 3Operating Momentum 4 CY1 Consensus EPS Est. 0.73$ CY1 PE 26.4 Total Capital 4,261$ Analyst Revisions Mom 5 CY2 Consensus EPS Est. 0.94$ CY2 PE 20.5 Debt/Capital 32%Fundamental Quality 5 Latest Annualized Dividend 0.44$ Div Yield 2.1% Debt/Enterprise Value 19%
Source: XBRL Analyst data and estimates, and Ascendere Associates LLC data and estimates.
Estimate Estimate Estimate EstimateNYSE:UGP LTM+4Q LTM+3Q LTM +2Q LTM +1Q Last LTM LTM-1 LTM-2 LTM -3 LTM -4NOPLAT 871 875 816 807 813 787 870 896 940 Economic Charge 374 378 380 391 400 402 492 453 498 Economic Profit 497 497 435 417 413 385 379 443 442 Y/Y change 0.1% 14.1% 4.5% 0.9% 7.2% 1.8% -14.5% 0.2% 25.7%
NOPLAT 871 875 816 807 813 787 870 896 940 Operating Capita l 3,823 3,862 3,886 3,990 4,089 4,275 5,088 4,902 5,335 ROIC (NOPLAT / Operating Capital) 22.8% 22.6% 21.0% 20.2% 19.9% 18.4% 17.1% 18.3% 17.6%
NOPLAT 871 875 816 807 813 787 870 896 940 5 Qtr Average Operating Capita l 3,890 3,957 4,060 4,360 4,738 5,076 5,474 5,678 5,717 ROIC (NOPLAT / Operating Capital) 22.4% 22.1% 20.1% 18.5% 17.2% 15.5% 15.9% 15.8% 16.4%
Source: Ascendere Associates assumptions, estimates and data, XBRLAnalyst data and consensus estimates.

Ascendere Associates LLC [email protected] J. Stephen Castellano Page 5 March 31, 2016
Our favorite short idea EnLink Midstream Partners, LP EnLink Midstream Partners, LP (ENLK) reported a bad December quarter and consensus estimates imply that a recovery to positive ROIC within a year is unlikely. If oil prices keep rising shorts will likely be burned. If oil declines or flattens this idea may work out well, so it deserves further study.
Ranking Data as of March 31, 2016
EnLink Midstream Partners, LPNYSE:ENLK
EnergyOil and Gas Refining and Marketing
Ascendere Ranking Price 03/31/16 12.07 Cash (6) EV/LTM EBITDA 11.8 Shares 369 Debt 3,090 Price/Book 1.0 Market Cap 4,452 Other 236
5 = Best Rank Enterprise Value 7,773 Relative Value 1Operating Momentum 2 CY1 Consensus EPS Est. 0.25$ CY1 PE 47.5 Total Capital 7,532$ Analyst Revisions Mom 1 CY2 Consensus EPS Est. 0.45$ CY2 PE 27.1 Debt/Capital 41%Fundamental Quality 1 Latest Annualized Dividend 1.56$ Div Yield 12.8% Debt/Enterprise Value 40%
Source: XBRL Analyst data and estimates, and Ascendere Associates LLC data and estimates.
Estimate Estimate Estimate EstimateNYSE:ENLK LTM+4Q LTM+3Q LTM +2Q LTM +1Q Last LTM LTM-1 LTM-2 LTM -3 LTM -4NOPLAT (604) (575) (384) (230) (1,218) (423) 393 398 411 Economic Charge 638 638 638 635 632 690 817 786 780 Economic Profit (1,243) (1,213) (1,022) (865) (1,850) (1,113) (424) (388) (369) Y/Y change 2.5% 18.7% 18.1% -53.2% 66.2% 162.3% 9.4% 5.1% -6.6%
NOPLAT (604) (575) (384) (230) (1,218) (423) 393 398 411 Operating Capita l 7,820 7,816 7,814 7,777 7,747 8,284 9,143 8,898 8,304 ROIC (NOPLAT / Operating Capital) -7.7% -7.4% -4.9% -3.0% -15.7% -5.1% 4.3% 4.5% 5.0%
NOPLAT (604) (575) (384) (230) (1,218) (423) 393 398 411 5 Qtr Average Operating Capita l 7,807 7,789 7,906 8,238 8,475 8,437 8,260 7,878 6,669 ROIC (NOPLAT / Operating Capital) -7.7% -7.4% -4.9% -2.8% -14.4% -5.0% 4.8% 5.1% 6.2%
Source: Ascendere Associates assumptions, estimates and data, XBRLAnalyst data and consensus estimates.

Ascendere Associates LLC [email protected] J. Stephen Castellano Page 6 March 31, 2016
Long running advice regarding the use of our model portfolio report Wayne Gretzky said it best – “skate to where the puck is going to be, not where it has been.” Quantitative screens like the one in this report show where a stock has been and assume the trajectory is fixed. Of course, this is not always the case. The best investors will use this model portfolio as guidance, and not the end all. At the same time, the model does well enough on its own, often beating the indices with ease (though not this past month). With a little effort, we hope that active fundamental portfolio managers will do even better.
Ascendere Associates LLC [email protected] J. Stephen Castellano Page 7 March 31, 2016
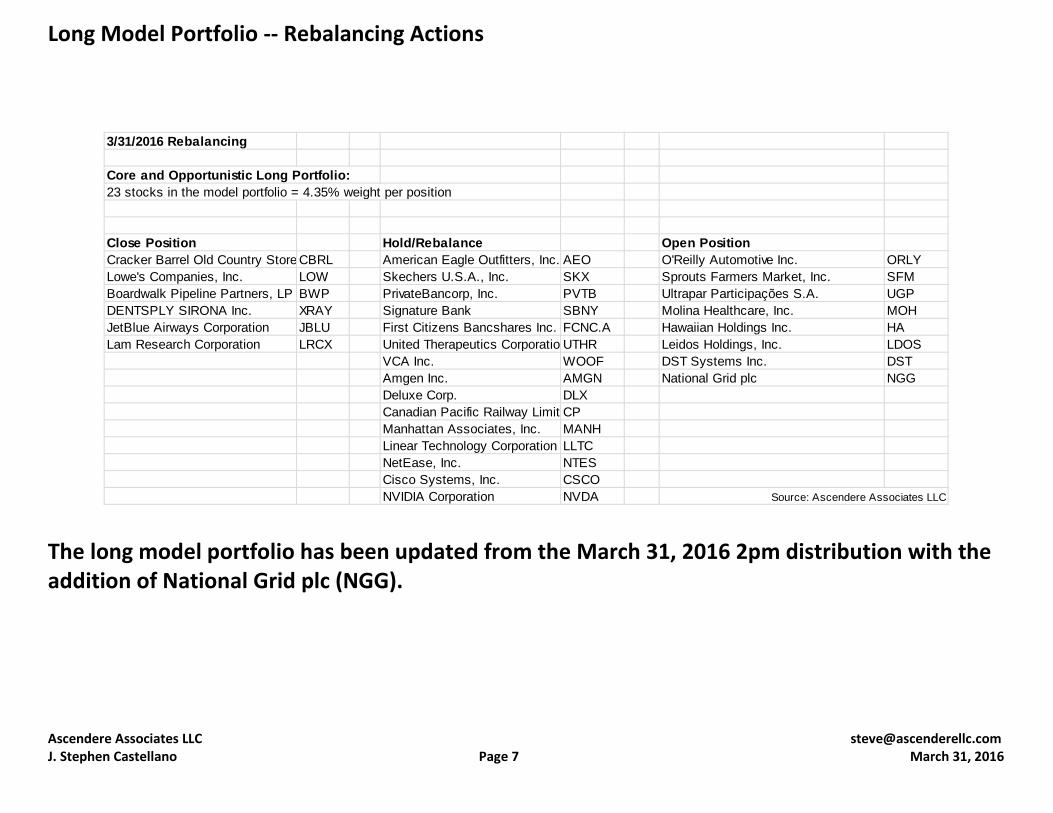
Long Model Portfolio -- Rebalancing Actions
The long model portfolio has been updated from the March 31, 2016 2pm distribution with the addition of National Grid plc (NGG).
3/31/2016 Rebalancing
Core and Opportunistic Long Portfolio:23 stocks in the model portfolio = 4.35% weight per position
Close Position Hold/Rebalance Open PositionCracker Barrel Old Country Store CBRL American Eagle Outfitters, Inc. AEO O'Reilly Automotive Inc. ORLYLowe's Companies, Inc. LOW Skechers U.S.A., Inc. SKX Sprouts Farmers Market, Inc. SFMBoardwalk Pipeline Partners, LP BWP PrivateBancorp, Inc. PVTB Ultrapar Participações S.A. UGPDENTSPLY SIRONA Inc. XRAY Signature Bank SBNY Molina Healthcare, Inc. MOHJetBlue Airways Corporation JBLU First Citizens Bancshares Inc. FCNC.A Hawaiian Holdings Inc. HALam Research Corporation LRCX United Therapeutics CorporationUTHR Leidos Holdings, Inc. LDOS
VCA Inc. WOOF DST Systems Inc. DSTAmgen Inc. AMGN National Grid plc NGGDeluxe Corp. DLXCanadian Pacific Railway LimiteCPManhattan Associates, Inc. MANHLinear Technology Corporation LLTCNetEase, Inc. NTESCisco Systems, Inc. CSCONVIDIA Corporation NVDA Source: Ascendere Associates LLC

Ascendere Associates LLC [email protected] J. Stephen Castellano Page 8 March 31, 2016
Short Model Portfolio -- Rebalancing Actions When the market anticipates an improving economy from low price levels, low-quality stocks will at times out-perform high-quality stocks as the expected improvements in fundamentals are discounted from a relatively more depressed price level.
The short model portfolio has been updated from the March 31, 2016 2pm distribution with the removal of Deutsche Bank (DB) and the retention of Legg Mason (LM).
3/31/2016 Rebalancing
Core and Opportunistic Short Portfolio:28 stocks in the model portfolio = 3.57% weight per position
Close Position Hold/Rebalance Open Short SaleMelco Crown Entertainment LimitMPEL Tesla Motors, Inc. TSLA Qunar Cayman Islands Limited QUNRTarga Resources Corp. TRGP TripAdvisor Inc. TRIP EnLink Midstream Partners, LP ENLKVermilion Energy Inc. VET Concho Resources, Inc. CXO Marathon Oil Corporation MRORPC Inc. RES Apache Corp. APA RSP Permian, Inc. RSPPIonis Pharmaceuticals, Inc. IONS National Oilwell Varco, Inc. NOV MPLX LP MPLXYandex N.V. YNDX Devon Energy Corporation DVN Parsley Energy, Inc. PE
Royal Dutch Shell plc RDS.B Kennedy-Wilson Holdings, Inc. KWNoble Energy, Inc. NBL Middleby Corp. MIDDHess Corporation HES Zebra Technologies Corporation ZBRALegg Mason Inc. LMSensata Technologies Holding STQorvo, Inc. QRVONCR Corporation NCRLinkedIn Corporation LNKDAutodesk, Inc. ADSKYahoo! Inc. YHOOTableau Software, Inc. DATAAlbemarle Corporation ALBMethanex Corporation MEOH Source: Ascendere Associates LLC

Ascendere Associates LLC [email protected] J. Stephen Castellano Page 9 March 31, 2016

Ascendere Associates LLC [email protected] J. Stephen Castellano Page 10 March 31, 2016
Return Data
Core & Opportunistic Long Model MTD Theoretical Lo 2/29/2016 to 3/31/2016
Target/ Date+1 Sector Company Ticker 2/29/2016 3/31/2016 Performance Stop Date Sell Price ReturnEnergy Boardwalk Pipeline Partners, LP BWP 12.42 14.74 18.68%Information Technology NVIDIA Corporation NVDA 31.36 35.63 13.62%Health Care VCA Antech Inc. WOOF 51.03 57.69 13.05%Information Technology LAM Research Corp. LRCX 73.30 82.60 12.69%Financials Privatebancorp Inc. PVTB 34.36 38.60 12.34%Consumer Discretionary Lowe's Companies Inc. LOW 67.53 75.75 12.17%Industrials Canadian Pacific Railway Limited CP 121.19 132.69 9.49%Consumer Discretionary American Eagle Outfitters Inc. AEO 15.26 16.67 9.24%Industrials Deluxe Corp. DLX 57.41 62.49 8.85%Information Technology Cisco Systems, Inc. CSCO 26.18 28.47 8.75%Financials First Citizens Bancshares Inc. FCNC.A 234.13 251.07 7.24%Information Technology Netease.com Inc. NTES 134.61 143.58 6.66%Health Care Amgen Inc. AMGN 142.28 149.93 5.38%Financials Signature Bank SBNY 129.55 136.12 5.07%Consumer Discretionary Cracker Barrel Old Country Store, Inc CBRL 148.05 152.67 3.12%Information Technology Manhattan Associates, Inc. MANH 55.26 56.87 2.91%Information Technology Linear Technology Corp. LLTC 43.62 44.56 2.15%Health Care DENTSPLY SIRONA, Inc. XRAY 60.96 61.63 1.10%Industrials JetBlue Airways Corporation JBLU 22.00 21.12 -4.00%Consumer Discretionary Skechers USA Inc. SKX 32.92 30.45 -7.50%Health Care United Therapeutics Corp. UTHR 121.94 111.43 -8.62%
Ascendere Associates LLC

Ascendere Associates LLC [email protected] J. Stephen Castellano Page 11 March 31, 2016
Core & Opportunistic Short Model MTD shorts hit target 8/4/2011 for 14.84% gain2/29/2016 to 3/31/2016
Target/ Date+1 Sector Company Ticker 2/29/2016 3/31/2016 Performance Stop Date Sell Price ReturnInformation Technology LinkedIn Corporation LNKD 117.19 114.35 -2.42%Information Technology Tableau Software, Inc. DATA 45.65 45.87 0.48%Materials Methanex Corp. MEOH 31.67 32.12 1.42%Energy RPC Inc. RES 13.57 14.18 4.50%Consumer Discretionary Melco Crown Entertainment Ltd. MPEL 15.79 16.51 4.56%Energy Cameco Corporation CCJ 12.11 12.84 6.03%Consumer Discretionary TripAdvisor LLC TRIP 62.60 66.50 6.23%Energy National Oilwell Varco, Incorporated NOV 29.27 31.10 6.25% 3/7/2016 31.50$ 7.62%Energy Noble Energy, Inc. NBL 29.50 31.41 6.47%Energy Vermilion Energy Inc. VET 27.16 29.22 7.58% 3/17/2016 31.38$ 15.54%Energy Royal Dutch Shell plc RDS.B 45.71 49.19 7.61%Information Technology Qorvo, Inc. QRVO 45.08 50.41 11.82%Energy Concho Resources, Inc. CXO 90.24 101.04 11.97%Information Technology Autodesk, Inc. ADSK 51.74 58.31 12.70%Materials Albemarle Corp. ALB 56.22 63.93 13.71% 3/29/2016 63.99$ 13.82%Industrials Sensata Technologies Holding NV ST 34.11 38.84 13.87% 3/29/2016 38.91$ 14.07%Information Technology Yahoo! Inc. YHOO 31.79 36.81 15.79% 3/29/2016 36.56$ 15.00%Health Care Ionis Pharmaceuticals, Inc. IONS 34.56 40.50 17.19%Information Technology Yandex N.V. YNDX 12.92 15.32 18.58% 3/16/2016 15.41$ 19.27%Consumer Discretionary Tesla Motors, Inc. TSLA 191.93 229.77 19.72% 3/16/2016 226.38$ 17.95%Energy Hess Corporation HES 43.60 52.65 20.76% 3/17/2016 53.90$ 23.62%Financials Legg Mason Inc. LM 28.56 34.68 21.43% 3/4/2016 32.98$ 15.48%Energy Apache Corp. APA 38.28 48.81 27.51% 3/4/2016 51.02$ 33.28%Information Technology NCR Corp. NCR 23.36 29.93 28.13% 3/11/2016 26.63$ 14.00%Energy Devon Energy Corporation DVN 19.68 27.44 39.43% 3/14/2016 24.09$ 22.41%
Ascendere Associates LLC

Ascendere Associates LLC [email protected] J. Stephen Castellano Page 12 March 31, 2016
* Return figures are calculated using cumulative simple returns. This table represents returns of several theoretical portfolios that do not assume any costs. This table is not to be construed as advertising for any investment service. Real portfolios that attempt to exactly replicate these theoretical strategies will generate lower returns relative to these models due to slippage, transaction costs, tax expenses and other costs. There are limitations inherent in our theoretical results, particularly with the fact that such results do not represent actual trading and they may not reflect the impact material economic and market factors might have had on our decision making if we were actually managing client money. We do our best to provide accurate information, but do not guarantee this. Please see additional disclosures and disclaimers.
Theoretical Model Portfolio* 03/31/16 MTD YTDSince
03/31/09 SharpeSimple Returns (No Compounding)
Stock Targets Core ModelLong -0.44% 6.31% -3.33% 156.8% 0.96 Short 0.12% 11.66% -10.78% 53.5% 0.37 Core Long/Short -0.56% -5.35% 7.45% 103.3% 0.92
Stock Targets and Opportunistic ModelPortfolio Targets Long -0.44% 6.31% -4.76% 142.5% 1.13
Short 0.00% 6.70% -15.12% -12.7% (0.10) Opportunistic Long/Short -0.44% -0.39% 10.36% 155.1% 1.44
Stock Targets and Opportunistic Model IIIPortfolio Targets Long Stocks -0.44% 6.31% -4.76% 142.5% 1.13
Long Inverse ETF ^SH 0.00% -5.69% 4.66% -72.0% (0.74) Opportunistic Long/Short III -0.44% 0.62% -0.10% 70.5% 0.76
S&P 500 Index -0.60% 6.45% 1.18% 104.41% 0.90

Ascendere Associates LLC [email protected] J. Stephen Castellano Page 13 March 31, 2016

Ascendere Associates LLC [email protected] J. Stephen Castellano Page 14 March 31, 2016

Ascendere Associates LLC [email protected] J. Stephen Castellano Page 15 March 31, 2016
Ascendere Associates LLC [email protected] J. Stephen Castellano Page 16 March 31, 2016

Ascendere Associates LLC [email protected] J. Stephen Castellano Page 17 March 31, 2016
Core Opportunistic"Dollar
Neutral" 1"Dollar
Neutral" 2
Inception March 31, 2009Long , Stock
Targets
Long, Stock and Portfolio Targets
Long/Short, Stock Targets and Portfolio
Targets
Long, Stock and Portfolio
Targets / Long ^SH ETF S&P 500
3/31/2016 Theoretical Theoretical Theoretical TheoreticalSimple ReturnsToday -0.22% -0.22% -0.22% -0.22% -0.20%MTD 6.31% 6.31% -0.39% 0.62% 6.45%YTD -3.33% -4.76% 10.36% -0.10% 1.18%Cumulative from 3/31/2009 156.76% 142.47% 155.15% 70.49% 104.41%
Absolute RiskDaily Average 0.09% 0.08% 0.09% 0.04% 0.06%Daily Range 16.86% 15.84% 11.84% 12.00% 11.40%Daily Standard Deviation 1.46% 1.13% 0.97% 0.82% 1.04%Daily Return/Standard Deviation 6.10% 7.17% 9.12% 4.86% 5.70%
Average 90-Day T-bill 1.26% 1.26% 1.26% 1.26% 1.26% Annualized Daily Returns 22.42% 20.38% 22.19% 10.08% 14.93% Annualized Standard Deviation 23.2% 17.9% 15.3% 13.1% 16.5%Sharpe Ratio 0.91 1.07 1.37 0.67 0.83
Percentage Down Days 45.3% 34.9% 42.5% 44.2% 44.9%Average Daily Downside Value -1.04% -0.92% -0.65% -0.55% -0.75%Daily Downside Deviation -1.09% -0.92% -0.63% -0.58% -0.78%Daily VAR of 1000 at 95% Conf -23 -18 -15 -13 -17
Benchmark Relative RiskCorrelation 0.91 0.70 (0.04) 0.05R-Squared 0.82 0.49 0.00 0.00Daily Tracking Error 0.68% 0.85% 1.44% 1.29%
RegressionBeta 1.27 0.76 -0.03 0.04Daily Alpha 0.030% 0.022% 0.029% -0.019%Jensen's Daily Alpha 0.038% 0.016% -0.001% -0.001%
Trading Days 1762 1762 1762 1762*Returns calculated by the simple return method (not compounded).
* Portfolio models are theoretical and assume no costs.
* Data collected in real time since 3/31/2009
Source: Ascendere Associates LLC

Ascendere Associates LLC [email protected] J. Stephen Castellano Page 18 March 31, 2016
DISCLOSURES Ascendere is in the business of providing equity research and related consulting services to investors and their advisors. The equity research it provides includes basic quantitative model portfolios and more detailed fundamental research with respect to individual stocks. In addition, the firm manages stock portfolios for itself and clients. Ascendere does not rate stocks on any scale, but does offer individual stock commentary and valuation opinions. With regard to Ascendere's portfolio strategies, "long" or "high-quality" baskets should generally be considered buys, unless otherwise noted. Stocks in our "short" or "low-quality" baskets should generally be considered sells, unless otherwise noted. While exceptions may occasionally occur, typically stocks in the high-quality basket are expected to outperform the S&P 500 over a month's time and stocks in the low-quality basket are expected to underperform. A more relevant benchmark would comprise of all stocks and ADRs that trade on major U.S. stock exchanges with a market cap above $2 billion. Ascendere adheres to professional standards and abides by codes of ethics that put the interests of clients ahead of its own. The following are specific disclosures made by Ascendere: 1) Ascendere may have a financial interest in the companies referred to in this report ("the Companies"). The research analyst covering the Companies and members of the analyst's immediate family have a financial interest in one or more of the Companies. 2) Ascendere generates revenue from research subscription revenue and portfolio management fees. At any given time it may be long or short any of the Companies. 3) Ascendere does not make a market in the securities of any of the Companies. 4) Ascendere has not received compensation from the Companies. 5) Ascendere has not managed or co-managed a public offering for any of the Companies. 6) Neither Ascendere nor any of its officers or any family member of the covering analyst serve as an officer, director or advisory board member of any of the Companies. 7) Neither Ascendere nor any of its officers or any family member of the covering analyst beneficially own 1% or more of any class of securities of any of the Companies. DISCLAIMERS This report is intended for informational purposes only and does not constitute a recommendation, or an offer, to buy or sell any securities or related financial instruments. The report is not intended to be in furtherance of the specific investment objectives, financial situation, or particular needs of any individual recipient. Investment decisions should be based on an individual's own goals, time horizon and tolerance for risk. The information contained herein accurately reflects the opinion of Ascendere at the time the report was released. The opinions of Ascendere are subject to change at any time without notice and without obligation or notification. The officers, affiliates or family members of Ascendere Associates may hold positions in the securities of the Companies. No warranty is made as to the accuracy of the information contained herein. The views and opinions expressed in the market commentary reflect the opinions of the author and may be based upon information obtained from third-party sources believed to be reliable but not guaranteed. These opinions are subject to change at any time based upon market or other conditions. Ascendere disclaims any responsibility to update such views. This information is intended for the sole use of clients of Ascendere. Any other use, distribution or reproduction is strictly prohibited. Investing in stocks includes a high degree of risk, including the risk of total loss. This is for informational purposes only and is not intended to constitute a current or past recommendation, investment advice of any kind, or a solicitation of an offer to buy or sell any securities or investment services. All information, opinions and estimates are current as of original distribution by author and are subject to change at any time without notice. Any companies, securities and/or markets referenced are solely for illustrative purposes. Past performance is not indicative of future performance, and no representation or warranty, express or implied, is made regarding future performance. For Investment Professional use only. NOT FOR FURTHER DISTRIBUTION. Any dissemination or copying of this commentary is strictly prohibited.

Ascendere Associates LLC [email protected] J. Stephen Castellano Page 19 March 31, 2016
J. Stephen Castellano – founded Ascendere Associates LLC to provide innovative equity research and investment advisory services that blends fundamental and quantitative approaches. In general, our approach is quite simple -- we believe that return on invested capital and long-term earnings growth are key to stock valuation. More specifically, we use powerful and unique financial models that combine publicly available data, consensus estimates and our own inputs to generate consistent and actionable stock recommendations.
Among the services that Ascendere provides are: 1) detailed custom equity research analysis; 2) valuation scenario analysis studies; 3) supply /demand studies; 4) long and short stock idea generation; 5) portfolio feedback; 6) detailed fundamental financial modeling services; and 7) additional analytical consulting services. Additional information is available at jstephencastellano.tumblr.com. Mr. Castellano is currently on the Board of Advisors to GovBrain, and is a consultant to two other financial technology startups. Mr. Castellano has over 15 years of experience in equity research and related consulting work. At PaineWebber, Warburg Dillon Read and Credit Lyonnais Securities he developed fundamental equity valuation models and conducted in-depth research on the steel and telecom services industries. At Boston Private Value Investors, he developed quantitative models for stock idea generation and also provided general fundamental equity research coverage. Steve received a MBA from the F. W. Olin School of Business at Babson College (2005) and a BA from Oberlin College (1993). Mr. Castellano's career history is highlighted below:
• Ascendere Associates, LLC (2009-Present) • Boston Private Value Investors , Equity Research, Equity Research Analyst (2005-2009) • Pyramid Research, Contract Consultant, Telecom Services (2002-2003) • Credit Lyonnais Securities (USA), Equity Research, Telecom Services, Vice President (2000-2001) • Warburg Dillon Read, Equity Research, Telecom Services, Research Associate (1999-2000) • PaineWebber, Equity Research, Steel and Nonferrous Metals, Research Associate, Editor (1995-1999)