ascendere associates llc innovative long/short equity research · 5/1/2016 · ascendere associates...
TRANSCRIPT

Ascendere Associates LLC [email protected] J. Stephen Castellano Page 1 April 30, 2016
Ascendere Associates LLC Innovative Long/Short Equity Research
Model Portfolio Monthly Update: April 30, 2016 There are limitations inherent in our theoretical model results, particularly with the fact that such results do not represent actual trading and they may not reflect the impact material economic and market factors might have had on our decision making if we were actually managing client money. Please see additional disclaimers and disclosures at the back of this report. We highlight stocks that demonstrate solid growth at a reasonable price (GARP). Stocks selected for our model portfolio strategies all rank highly for the following metrics, with an emphasis on proxies for cash flow growth and ROIC:
• Relative Value • Operating Momentum • Analyst Revision Momentum • Fundamental Quality
Pages 2-6 contain brief commentary and highlights of a few stocks that seem particularly attractive. Page 7 contains rebalancing actions for our long-only model portfolio. Page 8 contains rebalancing actions for our short-only model portfolio. Target and stop prices, as well as updated return data, to be provided in our daily reports that will follow.

Ascendere Associates LLC [email protected] J. Stephen Castellano Page 2 April 30, 2016
Notes: Readers that would like to follow our daily price target changes can follow us on our Seeking Alpha instablog or on Tumblr.
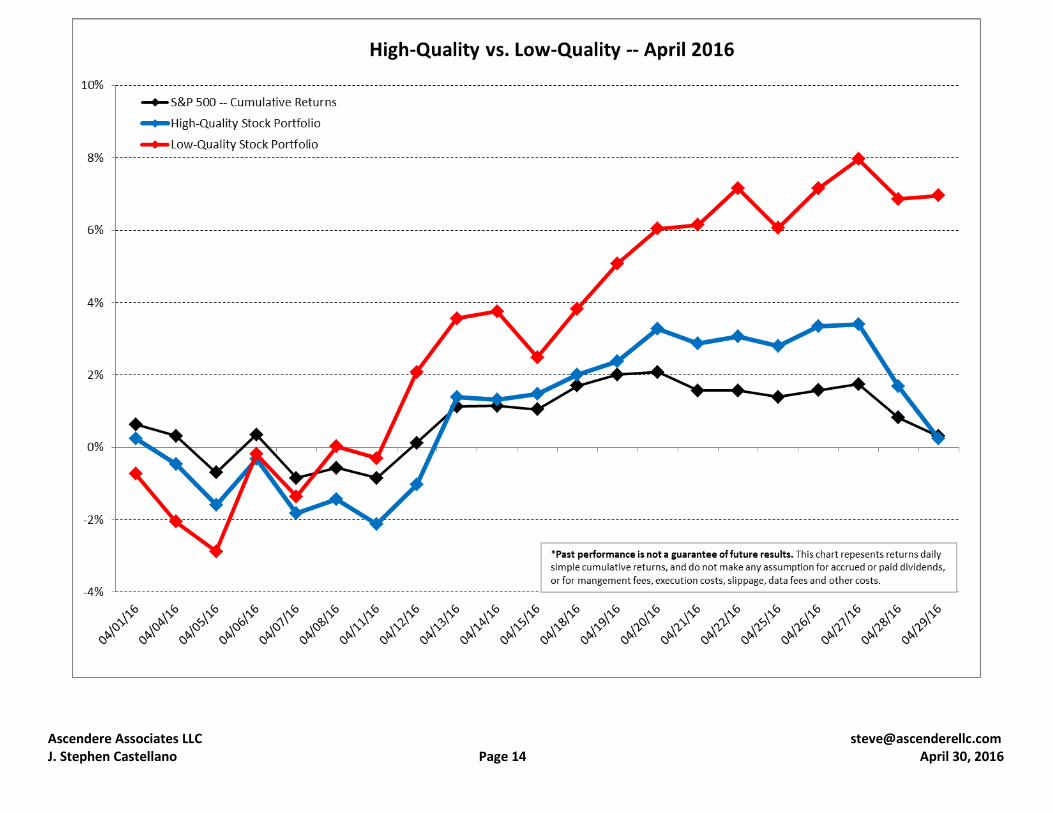
Commentary An ongoing rally in Energy related stocks had a negative impact on our long/short model portfolio strategies this month. Both the theoretical Core Long Model and Opportunistic Long Model increased 0.23% in April versus the 0.31% return in the S&P 500. (Both portfolios use the same basket of stocks but the Opportunistic model moves to 70% and 100% cash allocations during periods of high volatility or when portfolio return targets are met.) The theoretical Core Short Model posted a loss of -6.96% and theoretical Opportunistic Short Model posted a loss of -6.04%. The Opportunistic Short Model assumed a 100% cash position just prior to the close on April 20 while the Core Short Model continued to assume short sale positions in stocks. The theoretical Core Long/Short Model declined by -6.72%, with the 0.23% return of long positions in high-quality stocks not close to compensating for the +6.96% surge in low-quality stocks were shorted. (0.23% - 6.96% =6.72%). The Opportunistic Long/Short Model declined by -5.81%, after it locked in a short sale loss of 6.04% at the close of April 20 (0.23% - 6.04% = -5.81%). The best model portfolio stocks in April 2016 The best performing stock in the long model was VCA Antech Inc. (WOOF) up 9.15% and the worst was Molina Healthcare (MOH) down 19.74%. In the short model, the best performing stock was Qorvo, Inc. (QRVO) for an assumed 10.67% short sale gain and the worst was Marathon Oil Corp. (MRO) which assumed a loss of -26.21% after hitting a stop loss on April 19. Last month our favorite long idea was Ultrapar Particpacoes S.A. (UGP), which finished the month up 8.82%. Our favorite short idea for April was EnLink Midstream Partners, LP (ENLK), which finished the month up 16.65% for the equivalent assumed short sale loss.

Ascendere Associates LLC [email protected] J. Stephen Castellano Page 3 April 30, 2016
Looking ahead to May 2016 As of the April 29, 2016 close, 12 stocks have left the long-only model, 15 have been added, and 11 have been assumed rebalanced.

Ascendere Associates LLC [email protected] J. Stephen Castellano Page 4 April 30, 2016
Our favorite new long idea is PRA Health Sciences, Inc. PRA Health Sciences is likely to show an impressive uptick in economic profit and ROIC over the next year. Despite this it still trades at a decent relative value. This stock deserves a closer look as a solid long idea.
Ranking Data as of April 30, 2016
PRA Health Sciences, Inc.NasdaqGS:PRAH
HealthcareLife Sciences Tools and Services
Ascendere Ranking Price 05/01/16 47.45 Cash (98) EV/LTM EBITDA 14.3 Shares 61 Debt 882 Price/Book 4.1 Market Cap 2,873 Other -
5 = Best Rank Enterprise Value 3,658 Relative Value 3Operating Momentum 4 CY1 Consensus EPS Est. 2.41$ CY1 PE 19.7 Total Capital 1,591$ Analyst Revisions Mom 5 CY2 Consensus EPS Est. 2.80$ CY2 PE 16.9 Debt/Capital 49%Fundamental Quality 4 Latest Annualized Dividend -$ Div Yield 0.0% Debt/Enterprise Value 24%
Source: XBRL Analyst data and estimates, and Ascendere Associates LLC data and estimates.
Estimate Estimate Estimate EstimateNasdaqGS:PRAH LTM+4Q LTM+3Q LTM +2Q LTM +1Q Last LTM LTM-1 LTM-2 LTM -3 LTM -4NOPLAT 274 264 242 229 173 222 178 158 143 Economic Charge 141 142 143 144 145 144 122 125 120 Economic Profit 133 122 99 85 29 79 55 34 23 Y/Y change 8.5% 23.1% 16.7% 198.4% -63.7% 41.7% 65.2% 47.9% -154.1%
NOPLAT 274 264 242 229 173 222 178 158 143 Operating Capita l 1,795 1,806 1,816 1,827 1,838 1,846 1,869 1,901 1,879 ROIC (NOPLAT / Operating Capital) 15.3% 14.6% 13.3% 12.5% 9.4% 12.0% 9.5% 8.3% 7.6%
NOPLAT 274 264 242 229 173 222 178 158 143 5 Qtr Average Operating Capita l 1,811 1,822 1,832 1,845 1,866 1,881 1,905 1,938 1,971 ROIC (NOPLAT / Operating Capital) 15.1% 14.5% 13.2% 12.4% 9.3% 11.8% 9.3% 8.2% 7.3%
Source: Ascendere Associates assumptions, estimates and data, XBRLAnalyst data and consensus estimates.

Ascendere Associates LLC [email protected] J. Stephen Castellano Page 5 April 30, 2016
Our favorite short idea Superior Energy Services Superior Energy Services (SPN) is one of the few names on the low-quality stock list that does not show a likely resurgence in ROIC over the next year. Therefore we believe this stock deserves further attention as a short idea.
Ranking Data as of April 30, 2016
Superior Energy Services, Inc.NYSE:SPN
EnergyOil and Gas Equipment and Services
Ascendere Ranking Price 05/01/16 16.86 Cash (559) EV/LTM EBITDA 14.1 Shares 151 Debt 1,615 Price/Book 1.2 Market Cap 2,553 Other (0)
5 = Best Rank Enterprise Value 3,608 Relative Value 1Operating Momentum 1 CY1 Consensus EPS Est. (2.14)$ CY1 PE (7.9) Total Capital 3,722$ Analyst Revisions Mom 1 CY2 Consensus EPS Est. (1.51)$ CY2 PE (11.2) Debt/Capital 28%Fundamental Quality 1 Latest Annualized Dividend -$ Div Yield 1.4% Debt/Enterprise Value 45%
Source: XBRL Analyst data and estimates, and Ascendere Associates LLC data and estimates.
Estimate Estimate Estimate EstimateNYSE:SPN LTM+4Q LTM+3Q LTM +2Q LTM +1Q Last LTM LTM-1 LTM-2 LTM -3 LTM -4NOPLAT (2,014) (2,060) (2,059) (1,884) (2,094) (1,968) (1,635) (620) 379 Economic Charge 276 287 302 318 336 337 363 531 613 Economic Profit (2,290) (2,347) (2,361) (2,202) (2,430) (2,306) (1,998) (1,151) (234) Y/Y change -2.4% -0.6% 7.2% -9.4% 5.4% 15.4% 73.5% 391.0% 40.3%
NOPLAT (2,014) (2,060) (2,059) (1,884) (2,094) (1,968) (1,635) (620) 379 Operating Capita l 3,189 3,313 3,489 3,677 3,882 4,054 4,523 5,463 6,455 ROIC (NOPLAT / Operating Capital) -63.1% -62.2% -59.0% -51.2% -53.9% -48.6% -36.1% -11.4% 5.9%
NOPLAT (2,014) (2,060) (2,059) (1,884) (2,094) (1,968) (1,635) (620) 379 5 Qtr Average Operating Capita l 3,417 3,590 3,775 4,034 4,875 5,391 5,920 6,379 6,648 ROIC (NOPLAT / Operating Capital) -58.9% -57.4% -54.5% -46.7% -43.0% -36.5% -27.6% -9.7% 5.7%
Source: Ascendere Associates assumptions, estimates and data, XBRLAnalyst data and consensus estimates.

Ascendere Associates LLC [email protected] J. Stephen Castellano Page 6 April 30, 2016
Long running advice regarding the use of our model portfolio report Wayne Gretzky said it best – “skate to where the puck is going to be, not where it has been.” Quantitative screens like the one in this report show where a stock has been and assume the trajectory is fixed. Of course, this is not always the case. The best investors will use this model portfolio as guidance, and not the end all. At the same time, the model does well enough on its own, often beating the indices with ease (though not this past month). With a little effort, we hope that active fundamental portfolio managers will do even better.

Ascendere Associates LLC [email protected] J. Stephen Castellano Page 7 April 30, 2016
Long Model Portfolio -- Rebalancing Actions
4/30/2016 Rebalancing
Core and Opportunistic Long Portfolio:26 stocks in the model portfolio = 3.85% weight per position
Close Position Hold/Rebalance Open PositionSkechers U.S.A., Inc. SKX American Eagle Outfitters, Inc. AEO Tenneco Inc. TENSignature Bank SBNY O'Reilly Automotive Inc. ORLY Ford Motor Co. FFirst Citizens Bancshares Inc. FCNC.A Sprouts Farmers Market, Inc. SFM Omnicom Group Inc. OMCUnited Therapeutics Corporation UTHR Ultrapar Participações S.A. UGP First Horizon National Corporation FHNMolina Healthcare, Inc. MOH PrivateBancorp, Inc. PVTD Affiliated Managers Group Inc. AMGVCA Inc. WOOF Manhattan Associates, Inc. MANH Cincinnati Financial Corp. CINFAmgen Inc. AMGN Leidos Holdings, Inc. LDOS Northern Trust Corporation NTRSHawaiian Holdings Inc. HA NetEase, Inc. NTES SunTrust Banks, Inc. STIDeluxe Corp. DLX Cisco Systems, Inc. CSCO MarketAxess Holdings Inc. MKTXCanadian Pacific Railway LimitedCP NVIDIA Corporation NVDA PRA Health Sciences, Inc. PRAHLinear Technology Corporation LLTC National Grid plc NGG Texas Instruments Inc. TXNDST Systems Inc. DST Lam Research Corporation LRCX
Euronet Worldwide, Inc. EEFTMaxim Integrated Products, Inc. MXIM
Source: Ascendere Associates LLC CenturyLink, Inc. CTL

Ascendere Associates LLC [email protected] J. Stephen Castellano Page 8 April 30, 2016
Short Model Portfolio -- Rebalancing Actions When the market anticipates an improving economy from low price levels, low-quality stocks will at times out-perform high-quality stocks as the expected improvements in fundamentals are discounted from a relatively more depressed price level.
4/30/2016 Rebalancing
Core and Opportunistic Short Portfolio:30 stocks in the model portfolio = 3.33% weight per position
Close Position Hold/Rebalance Open Short SaleNational Oilwell Varco, Inc. NOV Tesla Motors, Inc. TSLA Melco Crown Entertainment Limited MPELRoyal Dutch Shell plc RDS.B TripAdvisor Inc. TRIP EnLink Midstream, LLC ENLCMPLX LP MPLX Qunar Cayman Islands Limited QUNR Enable Midstream Partners, LP ENBLParsley Energy, Inc. PE Concho Resources, Inc. CXO Superior Energy Services, Inc. SPNLegg Mason Inc. LM Apache Corp. APA ConocoPhillips COPNCR Corporation NCR EnLink Midstream Partners, LPENLK OneMain Holdings, Inc. OMFLinkedIn Corporation LNKD Devon Energy Corporation DVN Deutsche Bank AG DBAutodesk, Inc. ADSK Marathon Oil Corporation MRO Woodward, Inc. WWDMethanex Corporation MEOH Noble Energy, Inc. NBL SunPower Corporation SPWR
Hess Corporation HES Olin Corp. OLNRSP Permian, Inc. RSPPKennedy-Wilson Holdings, Inc. KWMiddleby Corp. MIDDSensata Technologies Holding STZebra Technologies CorporationZBRAQorvo, Inc. QRVOYahoo! Inc. YHOOTableau Software, Inc. DATAAlbemarle Corporation ALB Source: Ascendere Associates LLC

Ascendere Associates LLC [email protected] J. Stephen Castellano Page 9 April 30, 2016
Return Data
Core & Opportunistic Long Model MTD Theoretical Lo 3/31/2016 to 4/29/2016
Target/ Date+1 Sector Company Ticker 3/31/2016 4/29/2016 Performance Stop Date Sell Price ReturnHealth Care VCA Antech Inc. WOOF 57.69 62.97 9.15%Energy Ultrapar Holdings Inc. UGP 19.28 20.98 8.82%Industrials Canadian Pacific Railway Limited CP 132.69 144.25 8.71%Consumer Discretionary Skechers USA Inc. SKX 30.45 33.05 8.54%Financials Privatebancorp Inc. PVTB 38.60 41.61 7.80%Information Technology DST Systems Inc. DST 112.77 120.68 7.01%Information Technology Manhattan Associates, Inc. MANH 56.87 60.54 6.45%Health Care Amgen Inc. AMGN 149.93 158.30 5.58%Financials First Citizens Bancshares Inc. FCNC.A 251.07 255.00 1.57%Financials Signature Bank SBNY 136.12 137.83 1.26%Utilities National Grid plc NGG 71.42 72.01 0.83%Industrials Deluxe Corp. DLX 62.49 62.78 0.46%Information Technology Linear Technology Corp. LLTC 44.56 44.48 -0.18%Information Technology NVIDIA Corporation NVDA 35.63 35.53 -0.28%Information Technology Leidos Holdings, Inc. LDOS 50.32 49.61 -1.41%Information Technology Netease.com Inc. NTES 143.58 140.70 -2.01%Consumer Staples Sprouts Farmers Market, Inc. SFM 29.04 28.07 -3.34%Information Technology Cisco Systems, Inc. CSCO 28.47 27.49 -3.44%Consumer Discretionary O'Reilly Automotive Inc. ORLY 273.66 262.68 -4.01%Health Care United Therapeutics Corp. UTHR 111.43 105.20 -5.59%Industrials Hawaiian Holdings Inc. HA 47.19 42.07 -10.85%Consumer Discretionary American Eagle Outfitters Inc. AEO 16.67 14.31 -14.16%Health Care Molina Healthcare Inc. MOH 64.49 51.76 -19.74%
Ascendere Associates LLC

Ascendere Associates LLC [email protected] J. Stephen Castellano Page 10 April 30, 2016
Core & Opportunistic Short Model MTD shorts hit target 8/4/2011 for 14.84% gain3/31/2016 to 4/29/2016
Target/ Date+1 Sector Company Ticker 3/31/2016 4/29/2016 Performance Stop Date Sell Price ReturnInformation Technology Qorvo, Inc. QRVO 50.41 45.03 -10.67%Information Technology Zebra Technologies Corp. ZBRA 69.00 62.56 -9.33%Financials Legg Mason Inc. LM 34.68 32.11 -7.41%Industrials Sensata Technologies Holding NV ST 38.84 37.67 -3.01%Consumer Discretionary TripAdvisor LLC TRIP 66.50 64.59 -2.87%Information Technology NCR Corp. NCR 29.93 29.09 -2.81%Financials Kennedy-Wilson Holdings, Inc. KW 21.90 21.61 -1.32%Information Technology Yahoo! Inc. YHOO 36.81 36.60 -0.57%Information Technology Autodesk, Inc. ADSK 58.31 59.82 2.59%Industrials Middleby Corp. MIDD 106.77 109.64 2.69%Consumer Discretionary Qunar Cayman Islands Limited QUNR 39.70 40.81 2.80%Materials Albemarle Corp. ALB 63.93 66.16 3.49%Energy Parsley Energy, Inc. PE 22.60 23.42 3.63%Consumer Discretionary Tesla Motors, Inc. TSLA 229.77 240.76 4.78% 4/6/2016 257.20$ 11.94%Energy RSP Permian, Inc. RSPP 29.04 30.61 5.41%Energy MPLX LP MPLX 29.69 32.19 8.42%Energy Royal Dutch Shell plc RDS.B 49.19 53.35 8.46% 4/27/2016 53.45$ 8.66%Materials Methanex Corp. MEOH 32.12 34.96 8.84%Information Technology LinkedIn Corporation LNKD 114.35 125.31 9.58%Energy Apache Corp. APA 48.81 54.40 11.45% 4/27/2016 55.43$ 13.56%Information Technology Tableau Software, Inc. DATA 45.87 51.70 12.71%Energy Hess Corporation HES 52.65 59.62 13.24% 4/22/2016 61.87$ 17.51%Energy Noble Energy, Inc. NBL 31.41 36.11 14.96% 4/26/2016 37.11$ 18.15%Energy Concho Resources, Inc. CXO 101.04 116.17 14.97% 4/26/2016 121.51$ 20.26%Energy National Oilwell Varco, Incorporated NOV 31.10 36.04 15.88%Energy EnLink Midstream Partners, LP ELNK 12.07 14.08 16.65%Energy Devon Energy Corporation DVN 27.44 34.68 26.38% 4/20/2016 33.93$ 23.65%Energy Marathon Oil Corp. MRO 11.14 14.09 26.48% 4/19/2016 14.06$ 26.21%
Ascendere Associates LLC

Ascendere Associates LLC [email protected] J. Stephen Castellano Page 11 April 30, 2016
* Return figures are calculated using cumulative simple returns. This table represents returns of several theoretical portfolios that do not assume any costs. This table is not to be construed as advertising for any investment service. Real portfolios that attempt to exactly replicate these theoretical strategies will generate lower returns relative to these models due to slippage, transaction costs, tax expenses and other costs. There are limitations inherent in our theoretical results, particularly with the fact that such results do not represent actual trading and they may not reflect the impact material economic and market factors might have had on our decision making if we were actually managing client money. We do our best to provide accurate information, but do not guarantee this. Please see additional disclosures and disclaimers.
Theoretical Model Portfolio* 04/29/16 MTD YTDSince
03/31/09 SharpeSimple Returns (No Compounding)
Stock Targets Core ModelLong -0.44% 0.23% -3.10% 157.0% 0.96 Short 0.12% 6.96% -3.82% 60.4% 0.41 Core Long/Short -0.56% -6.72% 0.73% 96.6% 0.85
Stock Targets and Opportunistic ModelPortfolio Targets Long -0.44% 0.23% -4.52% 142.7% 1.12
Short 0.00% 6.04% -9.08% -6.6% (0.05) Opportunistic Long/Short -0.44% -5.81% 4.56% 149.3% 1.37
Stock Targets and Opportunistic Model IIIPortfolio Targets Long Stocks -0.44% 0.23% -4.52% 142.7% 1.12
Long Inverse ETF ^SH 0.00% -1.16% 3.50% -73.1% (0.75) Opportunistic Long/Short III -0.44% -0.92% -1.02% 69.6% 0.75
S&P 500 Index -0.60% 0.31% 1.49% 104.72% 0.89

Ascendere Associates LLC [email protected] J. Stephen Castellano Page 12 April 30, 2016

Ascendere Associates LLC [email protected] J. Stephen Castellano Page 13 April 30, 2016
Ascendere Associates LLC [email protected] J. Stephen Castellano Page 14 April 30, 2016

Ascendere Associates LLC [email protected] J. Stephen Castellano Page 15 April 30, 2016

Ascendere Associates LLC [email protected] J. Stephen Castellano Page 16 April 30, 2016
Core Opportunistic"Dollar
Neutral" 1"Dollar
Neutral" 2
Inception March 31, 2009Long , Stock
Targets
Long, Stock and Portfolio Targets
Long/Short, Stock Targets and Portfolio
Targets
Long, Stock and Portfolio
Targets / Long ^SH ETF S&P 500
4/29/2016 Theoretical Theoretical Theoretical TheoreticalSimple ReturnsToday -1.45% -1.45% -1.45% -1.45% -0.51%MTD 0.23% 0.23% -5.81% -0.92% 0.31%YTD -3.10% -4.52% 4.56% -1.02% 1.49%Cumulative from 3/31/2009 156.99% 142.70% 149.34% 69.57% 104.72%
Absolute RiskDaily Average 0.09% 0.08% 0.08% 0.04% 0.06%Daily Range 16.86% 15.84% 11.84% 12.00% 11.40%Daily Standard Deviation 1.45% 1.13% 0.96% 0.82% 1.04%Daily Return/Standard Deviation 6.05% 7.11% 8.68% 4.75% 5.67%
Average 90-Day T-bill 1.26% 1.26% 1.26% 1.26% 1.26% Annualized Daily Returns 22.19% 20.17% 21.11% 9.83% 14.80% Annualized Standard Deviation 23.1% 17.9% 15.3% 13.0% 16.5%Sharpe Ratio 0.91 1.06 1.30 0.66 0.82
Percentage Down Days 45.3% 35.0% 42.8% 44.3% 44.9%Average Daily Downside Value -1.04% -0.91% -0.65% -0.55% -0.75%Daily Downside Deviation -1.09% -0.91% -0.63% -0.58% -0.78%Daily VAR of 1000 at 95% Conf -23 -18 -15 -13 -16
Benchmark Relative RiskCorrelation 0.91 0.70 (0.03) 0.06R-Squared 0.82 0.49 0.00 0.00Daily Tracking Error 0.68% 0.84% 1.44% 1.29%
RegressionBeta 1.27 0.76 -0.03 0.04Daily Alpha 0.029% 0.021% 0.025% -0.020%Jensen's Daily Alpha 0.037% 0.016% -0.001% -0.001%
Trading Days 1783 1783 1783 1783*Returns calculated by the simple return method (not compounded).
* Portfolio models are theoretical and assume no costs.
* Data collected in real time since 3/31/2009
Source: Ascendere Associates LLC

Ascendere Associates LLC [email protected] J. Stephen Castellano Page 17 April 30, 2016
DISCLOSURES Ascendere is in the business of providing equity research and related consulting services to investors and their advisors. The equity research it provides includes basic quantitative model portfolios and more detailed fundamental research with respect to individual stocks. In addition, the firm manages stock portfolios for itself and clients. Ascendere does not rate stocks on any scale, but does offer individual stock commentary and valuation opinions. With regard to Ascendere's portfolio strategies, "long" or "high-quality" baskets should generally be considered buys, unless otherwise noted. Stocks in our "short" or "low-quality" baskets should generally be considered sells, unless otherwise noted. While exceptions may occasionally occur, typically stocks in the high-quality basket are expected to outperform the S&P 500 over a month's time and stocks in the low-quality basket are expected to underperform. A more relevant benchmark would comprise of all stocks and ADRs that trade on major U.S. stock exchanges with a market cap above $2 billion. Ascendere adheres to professional standards and abides by codes of ethics that put the interests of clients ahead of its own. The following are specific disclosures made by Ascendere: 1) Ascendere may have a financial interest in the companies referred to in this report ("the Companies"). The research analyst covering the Companies and members of the analyst's immediate family have a financial interest in one or more of the Companies. 2) Ascendere generates revenue from research subscription revenue and portfolio management fees. At any given time it may be long or short any of the Companies. 3) Ascendere does not make a market in the securities of any of the Companies. 4) Ascendere has not received compensation from the Companies. 5) Ascendere has not managed or co-managed a public offering for any of the Companies. 6) Neither Ascendere nor any of its officers or any family member of the covering analyst serve as an officer, director or advisory board member of any of the Companies. 7) Neither Ascendere nor any of its officers or any family member of the covering analyst beneficially own 1% or more of any class of securities of any of the Companies. DISCLAIMERS This report is intended for informational purposes only and does not constitute a recommendation, or an offer, to buy or sell any securities or related financial instruments. The report is not intended to be in furtherance of the specific investment objectives, financial situation, or particular needs of any individual recipient. Investment decisions should be based on an individual's own goals, time horizon and tolerance for risk. The information contained herein accurately reflects the opinion of Ascendere at the time the report was released. The opinions of Ascendere are subject to change at any time without notice and without obligation or notification. The officers, affiliates or family members of Ascendere Associates may hold positions in the securities of the Companies. No warranty is made as to the accuracy of the information contained herein. The views and opinions expressed in the market commentary reflect the opinions of the author and may be based upon information obtained from third-party sources believed to be reliable but not guaranteed. These opinions are subject to change at any time based upon market or other conditions. Ascendere disclaims any responsibility to update such views. This information is intended for the sole use of clients of Ascendere. Any other use, distribution or reproduction is strictly prohibited. Investing in stocks includes a high degree of risk, including the risk of total loss. This is for informational purposes only and is not intended to constitute a current or past recommendation, investment advice of any kind, or a solicitation of an offer to buy or sell any securities or investment services. All information, opinions and estimates are current as of original distribution by author and are subject to change at any time without notice. Any companies, securities and/or markets referenced are solely for illustrative purposes. Past performance is not indicative of future performance, and no representation or warranty, express or implied, is made regarding future performance. For Investment Professional use only. NOT FOR FURTHER DISTRIBUTION. Any dissemination or copying of this commentary is strictly prohibited.

Ascendere Associates LLC [email protected] J. Stephen Castellano Page 18 April 30, 2016
J. Stephen Castellano – founded Ascendere Associates LLC to provide innovative equity research and investment advisory services that blends fundamental and quantitative approaches. In general, our approach is quite simple -- we believe that return on invested capital and long-term earnings growth are key to stock valuation. More specifically, we use powerful and unique financial models that combine publicly available data, consensus estimates and our own inputs to generate consistent and actionable stock recommendations.
Among the services that Ascendere provides are: 1) detailed custom equity research analysis; 2) valuation scenario analysis studies; 3) supply /demand studies; 4) long and short stock idea generation; 5) portfolio feedback; 6) detailed fundamental financial modeling services; and 7) additional analytical consulting services. Additional information is available at jstephencastellano.tumblr.com. Mr. Castellano is currently on the Board of Advisors to GovBrain, and is a consultant to two other financial technology startups. Mr. Castellano has over 15 years of experience in equity research and related consulting work. At PaineWebber, Warburg Dillon Read and Credit Lyonnais Securities he developed fundamental equity valuation models and conducted in-depth research on the steel and telecom services industries. At Boston Private Value Investors, he developed quantitative models for stock idea generation and also provided general fundamental equity research coverage. Steve received a MBA from the F. W. Olin School of Business at Babson College (2005) and a BA from Oberlin College (1993). Mr. Castellano's career history is highlighted below:
• Ascendere Associates, LLC (2009-Present) • Boston Private Value Investors , Equity Research, Equity Research Analyst (2005-2009) • Pyramid Research, Contract Consultant, Telecom Services (2002-2003) • Credit Lyonnais Securities (USA), Equity Research, Telecom Services, Vice President (2000-2001) • Warburg Dillon Read, Equity Research, Telecom Services, Research Associate (1999-2000) • PaineWebber, Equity Research, Steel and Nonferrous Metals, Research Associate, Editor (1995-1999)