asean agri bites-march 2011 tushar-newagri-bites | asean tanuj shori / ken arieff wong nomura 3 23...
TRANSCRIPT
23 March 2011 Nomura 1
Any authors named on this report are research analysts unless otherwise indicated. See the important disclosures and analyst certifications on pages 61 to 65.
Agri-Bites | A S E A N CONSUMER RELATED/AGRI RELATED
Tanuj Shori +65 6433 6981 [email protected]
Ken Arieff Wong +60 3 2027 6895 [email protected]
Ploenjai Jirajarus (Capital Nomura Securities)
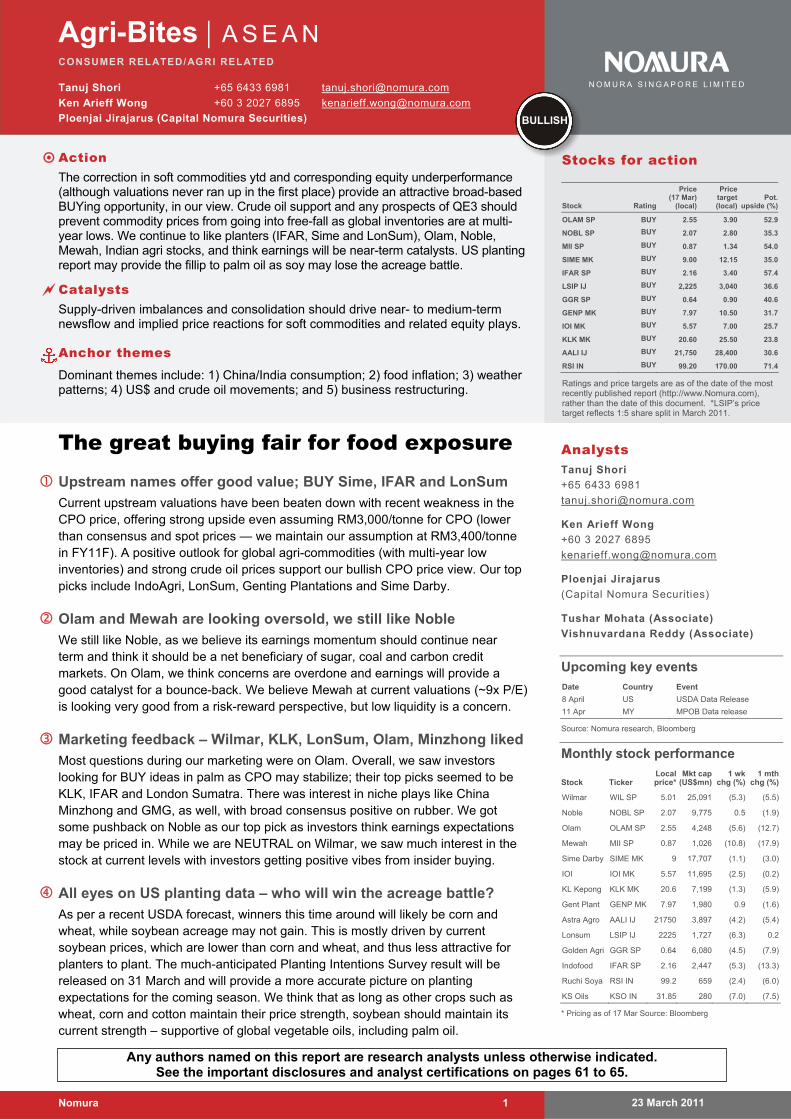
Action
The correction in soft commodities ytd and corresponding equity underperformance (although valuations never ran up in the first place) provide an attractive broad-based BUYing opportunity, in our view. Crude oil support and any prospects of QE3 should prevent commodity prices from going into free-fall as global inventories are at multi-year lows. We continue to like planters (IFAR, Sime and LonSum), Olam, Noble, Mewah, Indian agri stocks, and think earnings will be near-term catalysts. US planting report may provide the fillip to palm oil as soy may lose the acreage battle.
Catalysts
Supply-driven imbalances and consolidation should drive near- to medium-term newsflow and implied price reactions for soft commodities and related equity plays.
Anchor themes
Dominant themes include: 1) China/India consumption; 2) food inflation; 3) weather patterns; 4) US$ and crude oil movements; and 5) business restructuring.
The great buying fair for food exposure Upstream names offer good value; BUY Sime, IFAR and LonSum
Current upstream valuations have been beaten down with recent weakness in the CPO price, offering strong upside even assuming RM3,000/tonne for CPO (lower than consensus and spot prices — we maintain our assumption at RM3,400/tonne in FY11F). A positive outlook for global agri-commodities (with multi-year low inventories) and strong crude oil prices support our bullish CPO price view. Our top picks include IndoAgri, LonSum, Genting Plantations and Sime Darby.
Olam and Mewah are looking oversold, we still like Noble
We still like Noble, as we believe its earnings momentum should continue near term and think it should be a net beneficiary of sugar, coal and carbon credit markets. On Olam, we think concerns are overdone and earnings will provide a good catalyst for a bounce-back. We believe Mewah at current valuations (~9x P/E) is looking very good from a risk-reward perspective, but low liquidity is a concern.
Marketing feedback – Wilmar, KLK, LonSum, Olam, Minzhong liked
Most questions during our marketing were on Olam. Overall, we saw investors looking for BUY ideas in palm as CPO may stabilize; their top picks seemed to be KLK, IFAR and London Sumatra. There was interest in niche plays like China Minzhong and GMG, as well, with broad consensus positive on rubber. We got some pushback on Noble as our top pick as investors think earnings expectations may be priced in. While we are NEUTRAL on Wilmar, we saw much interest in the stock at current levels with investors getting positive vibes from insider buying.
All eyes on US planting data – who will win the acreage battle?
As per a recent USDA forecast, winners this time around will likely be corn and wheat, while soybean acreage may not gain. This is mostly driven by current soybean prices, which are lower than corn and wheat, and thus less attractive for planters to plant. The much-anticipated Planting Intentions Survey result will be released on 31 March and will provide a more accurate picture on planting expectations for the coming season. We think that as long as other crops such as wheat, corn and cotton maintain their price strength, soybean should maintain its current strength – supportive of global vegetable oils, including palm oil.
N O M U R A S I N G A P O R E L I M I T E D
Stocks for action
BULLISH
Stock Rating
Price (17 Mar)
(local)
Price target(local)
Pot.upside (%)
OLAM SP BUY 2.55 3.90 52.9
NOBL SP BUY 2.07 2.80 35.3
MII SP BUY 0.87 1.34 54.0
SIME MK BUY 9.00 12.15 35.0
IFAR SP BUY 2.16 3.40 57.4
LSIP IJ BUY 2,225 3,040 36.6
GGR SP BUY 0.64 0.90 40.6
GENP MK BUY 7.97 10.50 31.7
IOI MK BUY 5.57 7.00 25.7
KLK MK BUY 20.60 25.50 23.8
AALI IJ BUY 21,750 28,400 30.6
RSI IN BUY 99.20 170.00 71.4
Ratings and price targets are as of the date of the most recently published report (http://www.Nomura.com), rather than the date of this document. *LSIP’s price target reflects 1:5 share split in March 2011.
Analysts Tanuj Shori
+65 6433 6981
Ken Arieff Wong
+60 3 2027 6895
Ploenjai Jirajarus
(Capital Nomura Securities)
Tushar Mohata (Associate)
Vishnuvardana Reddy (Associate)
Upcoming key events Date Country Event
8 April US USDA Data Release
11 Apr MY MPOB Data release
Source: Nomura research, Bloomberg
Monthly stock performance
Stock Ticker Local price*
Mkt cap (US$mn)
1 wk chg (%)
1 mth chg (%)
Wilmar WIL SP 5.01 25,091 (5.3) (5.5)
Noble NOBL SP 2.07 9,775 0.5 (1.9)
Olam OLAM SP 2.55 4,248 (5.6) (12.7)
Mewah MII SP 0.87 1,026 (10.8) (17.9)
Sime Darby SIME MK 9 17,707 (1.1) (3.0)
IOI IOI MK 5.57 11,695 (2.5) (0.2)
KL Kepong KLK MK 20.6 7,199 (1.3) (5.9)
Gent Plant GENP MK 7.97 1,980 0.9 (1.6)
Astra Agro AALI IJ 21750 3,897 (4.2) (5.4)
Lonsum LSIP IJ 2225 1,727 (6.3) 0.2
Golden Agri GGR SP 0.64 6,080 (4.5) (7.9)
Indofood IFAR SP 2.16 2,447 (5.3) (13.3)
Ruchi Soya RSI IN 99.2 659 (2.4) (6.0)
KS Oils KSO IN 31.85 280 (7.0) (7.5)
* Pricing as of 17 Mar Source: Bloomberg
Agri-Bites | ASEAN Tanuj Shori / Ken Arieff Wong
23 March 2011 Nomura 2
Contents
Nomura ASEAN Soft Commodity Team 4
The great buying fair 5 In line with commodities, equities have underperformed as well… 6 CPO price has corrected 14% from its peak, but equities punished further – unwarranted in our view 6 CPO price assumption maintained 7 CPO discount to soybean oil comes off, lending some comfort 8 All eyes on US spring planting season; USDA expects little change in hectarage for soybean, with most gains in to be made in corn and wheat 8 Impact of Japanese earthquake on agri-commodities 9 Long positions of “managed money” in soy oil futures withdraws as risk appetite withdraws 10
Stocks: what we like and what we don’t 12 Upstream planters severely punished – offer ‘deep value’ 12 Midstream: we continue to like Noble, Olam and Mewah, but are cautious on Wilmar 12 We also like Indian edible oil players – Ruchi Soya and KS Oils 13 Thai Food & Agri: CNS prefers food processors CPF and GFPT on global demand for high-quality processed foods and benefit from soft commodity price drop 13
Other data points for the month 14 Malaysian February palm oil data — production and exports down, prices fairly reflect inventory levels 14 China soybean crushing margins fell in February, US margins almost at parity 14 Palm oil industry refining margins spike 15 Major news flow for the month 16
Round-up of Feb-March 2011 17 Last month’s commodity price performance: negative 17 Stock performance generally negative, agri inputs and midstream lead fall 17 Consensus downgrades occur on price correction, profit taking 17
Valuation snapshot 18
Valuation charts 24
The ups and downs 26 Last month’s commodity price performance: negative 26 Stock performance generally negative, agri inputs and midstream lead fall 27 YTD 2011 recap: generally negative returns by agri stocks 27 Consensus downgrades occur due to price correction, profit taking 28
Ears to the ground 30 Important events/news flow summary 30 Company news flow summary 32 Highlights of our published research 33

Agri-Bites | ASEAN Tanuj Shori / Ken Arieff Wong
23 March 2011 Nomura 3
Commodity snippets 34
Palm oil 35 What you need to know for the month of March 35
Soybean, soy meal and soy oil 39 USDA forecasts improving soybean supply in 2010/11F, consumption to rise more 39 World protein meal supply to grow in tandem with disappearance; vegetable oil disappearance to outpace supply growth 40 World soybean production to fall slightly in 2010/11F 41 Brazil and US to capture share of Argentine soybean exports in 2010/11F 42 Soybean consumption to grow at 8.1% in 2010/11F; same as 09/10F 42 China continues to be a substantial consumer of soy products 44 China soybean crushing margins fall in February-March 45
Sugar 47 ISO further cuts sugar surplus forecast for 2010/11F on Australian floods and China weather 47 Thai sugar export volume and price up in Jan-11 47 World sugar prices fell m-m in March 2011 due to expected sugar surplus from India 48
Grains — rice, wheat and corn 49 Grain stock usage ratios to tighten in for wheat and corn while improving for rice in 2010/11F 49 World rice price continues to be weak y-y and m-m in Mar-11 50 Thai rice export volume up in Jan 11 51 Wheat exports in major producing regions to drop in 2009/10F and 2010/11F 51 US corn production to fall, but offset by gains in China 52
Rubber 53 Global natural rubber to grow 4.6% in 2011F and 3.8% in 2012F 53 Thai rubber export volume down but export price up in Jan 11 53 Future rubber price down m-m on worry about car industry in China and the impact from the earthquake in Japan 53
Appendix 1: crop calendar 55
Appendix 2: monthly weather update 56
Valuation methodologies 57 Risks to our investment view 58

Agri-Bites | ASEAN Tanuj Shori / Ken Arieff Wong
23 March 2011 Nomura 4
Nomura ASEAN Soft Commodity Team
Tanuj SHORI ASEAN Commodity Supply Chain +65 6433 6981 [email protected]
Ken Arieff WONG ASEAN Plantations +60 3 2027 6895 [email protected]
Ploenjai JIRAJARUS Capital Nomura Securities +662 638 5772 [email protected]
Tushar MOHATA +91 22 6723 4042 [email protected]
Vishnuvardana REDDY +91 22 3053 2847 [email protected]

Agri-Bites | ASEAN Tanuj Shori / Ken Arieff Wong
23 March 2011 Nomura 5
What’s in this issue of our Agri-Bites
The great buying fair After a strong 2H10, we have so far seen a weak 2011, with agri-commodity prices and stocks both having corrected considerably year to date. Amongst soft-commodities, tea, wheat, rubber and sugar have seen the worst falls in thus far in 2011, whereas a very few — like cotton and cocoa — have bucked the trend and are up year to date.
Exhibit 1. Commodity performance – YTD 2011
(30)
(20)
(10)
0
10
20
30
40
Tea
US
Whe
at
Rub
ber
Su
gar
US
Ric
e
US
Soy
Mea
l
Mal
aysi
aC
PO
US
Soy
bean
Can
ola
Oil
Ref
ined
Pa
lm O
ilU
SS
oybe
anO
ilC
hina
Soy
Mea
l
Tha
iland
Ric
eC
hina
Rap
esee
dO
il
Alm
onds
Chi
naS
oybe
anO
il Cor
n
Chi
naS
oybe
an
Su
nflo
wer
Oil
Coc
oa
Cot
ton
(%)
Source: Bloomberg
This has been in contrast to the gains seen in hard commodities such as crude oil and coal. We see this divergence stemming from two things:
Withdrawal of speculative funds from agri-commodities, as risk appetite deflates
Fears of a demand slowdown for agri-commodities from MENA countries (geo-political concerns), as well as impact from the recent events in Japan.
Hard commodities on the other hand have seen a revival in prices stemming from fears of supply disruption (mainly for crude oil).
To an extent, we find the withdrawal of speculative funds unsurprising (we have acknowledged the increasing amount of long positions in our past notes), and we think that agri-prices could stabilise at current levels for the near term assuming that there are no new major developments from a global supply/demand perspective.
The good part in our view is, global agri-demand is relatively inelastic, and any concerns on demand are usually more infrastructure driven — eg, trade and ports cut-off (bottlenecks).
Positive catalysts for agri-commodities:
Stability leading to improved sentiment and demand outlook for agri-commodities.
Continued strength in crude oil prices supporting biofuel demand in the US.
Spring planting intentions which could spur prices further in the fight for acreage.
Negative catalysts for agri-commodities:
Further geopolitical concerns damaging sentiment and global demand outlook.
Withdrawal of ‘Quantitative Easing II’ liquidity in the US (likely by end-June 2011) driving prices lower
Stronger production in 2H11 of palm oil, as well as higher-than-expected planting intentions for a specific crop (eg, soybeans).

Agri-Bites | ASEAN Tanuj Shori / Ken Arieff Wong
23 March 2011 Nomura 6
In line with commodities, equities have underperformed as well… In-line with weak commodity performance in 2011, equities have been weak since the beginning of the year, as well. However, a key difference in our view is that equities never had re-rated as strongly as commodities had in the first place. Indeed, almost all of the stocks under our coverage — from Singapore midstream names (down 10% ytd vs index down 8%) to upstream planters (Malaysian names down 1% vs index down 1%, Indonesian names down 18% vs index down 6%) — are down ytd. (Please see page 26 for a list of stock P/Es.)
Exhibit 2. Sectoral performance YTD
(30)
(25)
(20)
(15)
(10)
(5)
0
5
10
1-J
an
8-J
an
15-J
an
22-J
an
29-J
an
5-F
eb
12-F
eb
19-F
eb
26-F
eb
5-M
ar
12-M
ar
Singapore Commodity SCM Malaysian Planters
Indonesian Planters Indian Agri
Thai Agri
(%)
Source: Bloomberg
Exhibit 3. Soft commodity stocks: recent performance
Company Closing price 7-month high High attained on
Fall from highs (%)
Target Price Upside (%) EPS CAGR (CY10-12F)
(%)
P/E (CY11F)
P/E (CY12F)
Wilmar 5.02 6.88 9-Nov-10 (27.0) 5.60 11.6 22.0 17.2 14.9
Noble 2.04 2.34 16-Jan-11 (12.8) 2.80 37.3 26.6 13.7 11.9
Olam 2.58 3.38 9-Nov-10 (23.7) 3.90 51.2 20.2 16.5 13.9
Mewah 0.87 1.20 18-Jan-11 (27.5) 1.34 54.0 6.5 9.5 8.1
Sime Darby 9.01 9.46 4-Jan-11 (4.8) 12.15 34.9 40.6 14.4 12.9
IOI 5.78 6.05 4-Jan-11 (4.5) 7.00 21.1 17.3 16.0 14.2
KLK 20.64 22.86 20-Jan-11 (9.7) 25.50 23.5 24.5 15.4 12.9
Genting Plant 8.00 9.03 4-Jan-11 (11.4) 10.50 31.3 23.9 13.7 12.2
Golden Agri 0.64 0.82 3-Jan-11 (22.0) 0.90 40.6 28.1 11.0 9.9
Indo Agri 2.12 2.95 4-Jan-11 (28.1) 3.40 60.4 36.7 10.0 9.3
London Sumatra 2,225 2,570 2-Jan-11 (13.4) 3,040 36.6 26.8 11.2 10.5
Astra Agro 22,100 27,100 9-Dec-10 (18.5) 28,400 28.5 33.0 12.4 11.0
Note: As on 18-March-2011
Source: Bloomberg, Nomura estimates
CPO price has corrected 14% from its peak, but equities punished further – unwarranted in our view Palm oil prices have corrected by 14.2% from the recent peak of RM3,930/tonne in mid-February. This withdrawal coincided largely with weakness seen in other agri-commodities, including vegetable oils (soy), oilseeds and meals, grains and rubber.
Agri-Bites | ASEAN Tanuj Shori / Ken Arieff Wong
23 March 2011 Nomura 7
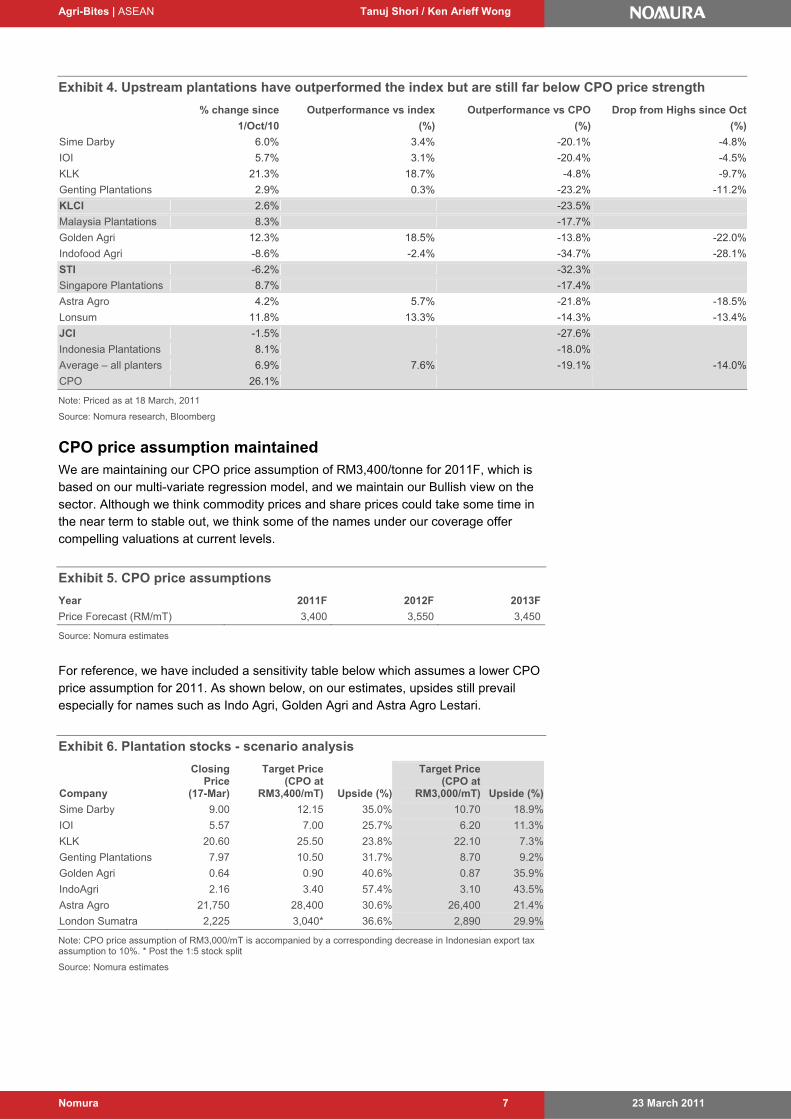
Exhibit 4. Upstream plantations have outperformed the index but are still far below CPO price strength
% change since Outperformance vs index Outperformance vs CPO Drop from Highs since Oct
1/Oct/10 (%) (%) (%)
Sime Darby 6.0% 3.4% -20.1% -4.8%
IOI 5.7% 3.1% -20.4% -4.5%
KLK 21.3% 18.7% -4.8% -9.7%
Genting Plantations 2.9% 0.3% -23.2% -11.2%
KLCI 2.6% -23.5%
Malaysia Plantations 8.3% -17.7%
Golden Agri 12.3% 18.5% -13.8% -22.0%
Indofood Agri -8.6% -2.4% -34.7% -28.1%
STI -6.2% -32.3%
Singapore Plantations 8.7% -17.4%
Astra Agro 4.2% 5.7% -21.8% -18.5%
Lonsum 11.8% 13.3% -14.3% -13.4%
JCI -1.5% -27.6%
Indonesia Plantations 8.1% -18.0%
Average – all planters 6.9% 7.6% -19.1% -14.0%
CPO 26.1% Note: Priced as at 18 March, 2011
Source: Nomura research, Bloomberg
CPO price assumption maintained We are maintaining our CPO price assumption of RM3,400/tonne for 2011F, which is based on our multi-variate regression model, and we maintain our Bullish view on the sector. Although we think commodity prices and share prices could take some time in the near term to stable out, we think some of the names under our coverage offer compelling valuations at current levels.
Exhibit 5. CPO price assumptions
Year 2011F 2012F 2013F
Price Forecast (RM/mT) 3,400 3,550 3,450
Source: Nomura estimates
For reference, we have included a sensitivity table below which assumes a lower CPO price assumption for 2011. As shown below, on our estimates, upsides still prevail especially for names such as Indo Agri, Golden Agri and Astra Agro Lestari.
Exhibit 6. Plantation stocks - scenario analysis
Company
Closing Price
(17-Mar)
Target Price (CPO at
RM3,400/mT) Upside (%)
Target Price (CPO at
RM3,000/mT) Upside (%)
Sime Darby 9.00 12.15 35.0% 10.70 18.9%
IOI 5.57 7.00 25.7% 6.20 11.3%
KLK 20.60 25.50 23.8% 22.10 7.3%
Genting Plantations 7.97 10.50 31.7% 8.70 9.2%
Golden Agri 0.64 0.90 40.6% 0.87 35.9%
IndoAgri 2.16 3.40 57.4% 3.10 43.5%
Astra Agro 21,750 28,400 30.6% 26,400 21.4%
London Sumatra 2,225 3,040* 36.6% 2,890 29.9%
Note: CPO price assumption of RM3,000/mT is accompanied by a corresponding decrease in Indonesian export tax assumption to 10%. * Post the 1:5 stock split
Source: Nomura estimates

Agri-Bites | ASEAN Tanuj Shori / Ken Arieff Wong
23 March 2011 Nomura 8
CPO discount to soybean oil comes off, lending some comfort Following the recent correction in the CPO price, the CPO price discount to soy oil has widened to around ~10% from previous tightness of ~5%. This, we think, leaves some room for CPO prices to stabilise (and possibly trend upwards slightly), as palm oil should be able to maintain its price competitiveness.
Exhibit 7. CPO price widens discount to 10-15% vs soybean oil and rapeseed
-25%
-20%
-15%
-10%
-5%
0%
1-J
an-1
0
22-J
an-1
0
12-F
eb-1
0
5-M
ar-1
0
26-M
ar-1
0
16-A
pr-1
0
7-M
ay-1
0
28-M
ay-1
0
18-J
un-1
0
9-Ju
l-10
30-J
ul-1
0
20-A
ug-1
0
10-S
ep-1
0
1-O
ct-1
0
22-O
ct-1
0
12-N
ov-1
0
3-D
ec-1
0
24-D
ec-1
0
14-J
an-1
1
4-F
eb-1
1
25-F
eb-1
1
18-M
ar-1
1
Palm Oil Disc to Rape Oil Palm Oil Disc to Soy Oil
Source: Bloomberg
All eyes on US spring planting season; USDA expects little change in hectarage for soybean, with most gains in to be made in corn and wheat The U.S. Department of Agriculture (USDA) recently disclosed its expectations for acreage (USDA forecasts – not based on a survey). The winners this time around according the results will likely be corn (+4% y-y) to 92mn acres and wheat at 57mn acres (+6% y-y), although soybean acreage looks to remain unchanged at 78mn acres (+1%). This is mostly driven by current soybean prices, which are lower than corn and wheat, and therefore less attractive for planters to plant. The much-anticipated Planting Intentions Survey result will be released on 31 March and will provide a more accurate picture on the plantings expectations for the coming season.
Additionally, in its 2011 Agri Outlook, the USDA believes that the three main factors shaping 2011 will be tight supplies of corn and soybeans, the small supply cushion for corn and soybeans in the event of adverse weather and the expected strong exports of corn, wheat and soybean.
We think that as long as other crops such as wheat, corn and cotton maintain their price strength, soybean should maintain its current strength – supportive of global vegetable oils, including palm oil.

Agri-Bites | ASEAN Tanuj Shori / Ken Arieff Wong
23 March 2011 Nomura 9
Exhibit 8. USDA: Acreage forecast
79.2 78.3 93.5 86.0 86.5 88.2 92.0
64.2 75.5 64.7 75.7 77.5 77.4 78.0
75.1 57.3 60.5 63.2 59.2 53.6 57.0
42.3 32.3 29.1 28.2 25.9 26.0 28.1
34.536.0 36.8 34.6 33.7 31.4 31.9
0.0
50.0
100.0
150.0
200.0
250.0
300.0
350.0
1996 …. 2006 2007 2008 2009 2010 2011F
Corn Soybeans Wheat Other Feed Grains, Rice & Cotton CRP(mn acre)
Source: USDA Agricultural Outlook Forum
Exhibit 9. Soy-corn ratio (below average)
0.0
0.5
1.0
1.5
2.0
2.5
3.0
3.5
4.0
4.5
Sep
-98
Sep
-99
Sep
-00
Sep
-01
Sep
-02
Sep
-03
Sep
-04
Sep
-05
Sep
-06
Sep
-07
Sep
-08
Sep
-09
Sep
-10
Soy to corn ratio Average=2.65
Source: Nomura, Bloomberg
Exhibit 10. Soy-cotton ratio (below average)
0.00
0.05
0.10
0.15
0.20
0.25
0.30
0.35
0.40
0.45
0.50
Sep
-98
Sep
-99
Sep
-00
Sep
-01
Sep
-02
Sep
-03
Sep
-04
Sep
-05
Sep
-06
Sep
-07
Sep
-08
Sep
-09
Sep
-10
Soy to cotton ratio Average=0.22
Source: Nomura, Bloomberg
Impact of Japanese earthquake on agri-commodities We think the recent earthquake and tsunami in Japan could have a meaningful impact on the world trade and prices of various agri-commodities. The situation is currently unfolding, and it is uncertain how much of the port capacity or agricultural land has been affected. However any prolonged disruption to trade flow / agricultural production in Japan could impact prices, in our view. Japan is predominantly an importer and a net consumer of soft commodities. In our view, the commodities most likely to face downward pressure in prices given import delays might be corn, rapeseed, cottonseed and soymeal, given Japan’s large share of world imports in these commodities. However, we also flag that since this questions supply of food, disruption, if any, should be minimal, in our view.
Regarding supplies, the most obvious impact would be on rice, given that one of the biggest agricultural products in Japan is rice. Estimates for crop damage to rice have varied, with some estimates (USDA economists) saying the impacted area accounts for 6-10% of rice production in Japan with others putting estimates as high as 26%. Plantings for rice take place end of April to late June, with harvesting in September. This leads us to believe any impact will likely be seen in the next planting/harvesting season – and more from salt water poisoning (as rice is not as tolerant as wheat and barley to salt).

Agri-Bites | ASEAN Tanuj Shori / Ken Arieff Wong
23 March 2011 Nomura 10
Exhibit 11. Japan as % of world commodities supply demand
Production Imports Exports Consumption
Grains
Rice, Milled 1.7 2.4 0.7 1.9
Wheat 0.1 4.1 0.2 0.9
Corn n.m. 17.8 n.m. 2.0
Oilseeds
Oilseed, Copra n.m. n.m. n.m. n.m.
Oilseed, Cottonseed n.m. 20.1 n.m. 0.3
Oilseed, Peanut 0.1 5.7 n.m. 0.4
Oilseed, Rapeseed n.m. 21.5 n.m. 3.8
Oilseed, Soybean 0.1 3.9 n.m. 1.6
Protein Meals
Meal, Copra n.m. 2.4 n.m. 1.0
Meal Cottonseed 0.1 1.5 n.m. 0.1
Meal,Fish 7.1 12.4 0.3 13.0
Meal,Peanut n.m. n.m. n.m. n.m.
Meal, Rapeseed 3.8 1.6 n.m. 3.9
Meal,Soybean 1.2 4.0 n.m. 2.5
Vegetable oils
Oil,Coconut n.m. 2.2 n.m. 1.3
Oil, Cottonseed 0.1 4.2 n.m. 0.2
Oil, Palm n.m. 1.7 n.m. 1.3
Oil, Palm Kernel n.m. 3.4 n.m. 1.6
Oil, Peanut n.m. 0.6 n.m. n.m.
Oil, Rapeseed 4.0 0.3 n.m. 4.1
Oil, Soybean 1.2 0.3 n.m. 1.3
Oil, Sunflowerseed n.m. 0.8 n.m. 0.3
Others
Coffee, Green n.m. 7.4 n.m. 5.7
Cotton n.m. 0.8 n.m. 0.3
Sugar, Centrifugal 0.7 3.1 n.m. n.m.
Note: 2009/10 crop year. n.m. implies very low or not meaningful
Source: USDA FAS
Long positions of “managed money” in soy oil futures withdraws as risk appetite withdraws Based on our review of CFTC data, US CBOT soy oil futures held by managed money (eg, portfolio funds and not hedgers and traders) have fallen 22% from their peak – close to early-October levels. This was in line with the overall weakness in commodities, as risk appetite declined with geopolitical concerns and fears of slower global demand stemming from Japan’s natural disasters.
Though we actually find it comforting that some speculative liquidity has left the market, we still think the risk remains whereby commodity prices could recede very quickly with a turn in sentiment. In the near term, we think that liquidity should remain supported so long as QE II liquidity remains intact (ie, to last through 1H11) and fundamentals for the sector (which in the case of palm oil are currently driven by tight supplies) remain supportive.

Agri-Bites | ASEAN Tanuj Shori / Ken Arieff Wong
23 March 2011 Nomura 11
Exhibit 12. CFTC data – Increasing managed money positions demonstrate speculation declining
0
20,000
40,000
60,000
80,000
100,000
120,000
140,000
160,000
180,0005
-Jan
-10
19-J
an-1
02
-Feb
-10
16-F
eb-1
02
-Mar
-10
16-M
ar-1
030
-Mar
-10
13-A
pr-1
027
-Apr
-10
11-M
ay-1
025
-May
-10
8-J
un-1
022
-Jun
-10
6-Ju
l-10
20-
Jul-1
03
-Aug
-10
17-A
ug-1
031
-Aug
-10
14-S
ep-1
028
-Sep
-10
12-O
ct-1
026
-Oct
-10
9-N
ov-1
023
-Nov
-10
7-D
ec-1
021
-Dec
-10
4-J
an-1
118
-Jan
-11
1-F
eb-1
115
-Feb
-11
1-M
ar-1
1
30
35
40
45
50
55
60
65Managed Money Long Positions (LHS)
Managed Money Short Positions (LHS)
CBOT Soy Oil Prices (RHS)
Source: Commodity Futures Trading Commission

Agri-Bites | ASEAN Tanuj Shori / Ken Arieff Wong
23 March 2011 Nomura 12
Our stock calls
Stocks: what we like and what we don’t This section summarises our stock action points for the month.
Upstream planters severely punished – offer ‘deep value’ We still believe that CPO prices will be supported at least through 1H11 and believe that the market has taken too negative a view on CPO upstream plays – having punished names like IndoAgri and Golden Agri, down 22-27% from the peaks. Revisiting our CPO price assumption, even at an assumption of RM3,000/tonne (below consensus view of RM3,100/tonne (based on a Reuters published poll), these names offer good value and upside.
BUY London Sumatra, Indo Agri and Golden Agri, after the recent sell-down. Sensitivities show that they are still compelling BUYs, even with a lower CPO price assumption of RM3,000/tonne. We also like Sime Darby on a positive outlook for all its divisions (apart from oil & gas). We like IndoFood Agri for its strong CPO production growth, coupled with higher leverage to CPO prices (being purer plantation plays), while London Sumatra offers good leverage to CPO prices, as well as exposure to the Indonesian market (where our strategist Wilianto Ie is positive) at compelling valuations (cheapest within our upstream palm oil coverage). Golden Agri is the most liquid CPO name in our coverage, with pure leverage to CPO prices. Sime Darby, in our view, also offers a strong re-rating story given its recent lag (relative to CPO price strength), while low-hanging fruit presents potentially easy wins in terms of earnings upside. Further, Sime Darby’s large market weighting and high liquidity could increasingly be used as a proxy for improving sentiment on Malaysia, especially given a relatively low foreign shareholding of ~15%.
Midstream: we continue to like Noble, Olam and Mewah, but are cautious on Wilmar Noble: Among the midstream space, we like Noble, as we think that the current commodity price upcycle, along with strong performance in agri, energy and locked margins in FY11F should ensure a good FY11 for the company. The company also stands to benefit from high coal prices due to Australian floods, as its mines in NSW are relatively insulated from the floods. It should also be a net beneficiary of any rising coal prices due to higher Japanese demand post the earthquake.
We like Olam, as its asset strategy continues to surprise positively and it is trading at extremely attractive valuations post the recent correction on export incentives. Its recent investments in Africa, such as the Gabon fertiliser project and the sugar refinery in Nigeria, if executed well, could act as a substantial boost to the bottom line, in our view. In its recent NDR with us, Olam reiterated the recent uptick in its growth guidance helped by faster-than-expected contributions of various assets, such as almonds, tomato processing and wheat milling. Moreover, NZFSU and PureCircle can turn around in ~2 years, according to management, which could present potential upside surprise.
Although we think there is inherent dilution risk (to fund expansion), we believe the recent correction is overdone and presents buying opportunity. It is now trading at 16.5x CY11 P/E, de-rating from peak of ~21x CY1 P/E, and at all-time low discounting the time during financial crisis
However, we remain NEUTRAL on Wilmar, as we expect a shrinking valuation premium due to non-core investments in property and weak earnings to continue in 1QFY11. We think that the stock should remain rangebound in the near term on the back of a lack of catalysts. During our recent marketing, we saw a great deal of interest in the stock at current levels, with investors getting positive vibes from recent insider buying.
BUY Indo Agri, Golden Agri and LonSum for good leverage to CPO prices; we also have a BUY on Sime Darby on possible restructuring improvements

Agri-Bites | ASEAN Tanuj Shori / Ken Arieff Wong
23 March 2011 Nomura 13
We also like recently cited Mewah for its leadership in West Africa pack oil, scale in palm refining, cheap valuation compared to peers and likely high capex intensity post listing, but low liquidity remains a concern.
We also like Indian edible oil players – Ruchi Soya and KS Oils We also like Indian edible oil players Ruchi Soya and KS Oils and think that they will benefit from the rising per capita edible oil consumption in India, a larger percentage of branded sales, increasing capacity utilisation through incremental consolidation in the industry, greater economies of scale and upstream participation. We shift our preference to Ruchi Soya as a strong soybean crop in 4Q CY10–1Q CY11 will likely boost the company’s margins and volume, resulting in a positive earnings surprise, in our view.
Thai Food & Agri: CNS prefers food processors CPF and GFPT on global demand for high-quality processed foods and benefit from soft commodity price drop Regarding Thai agricultural and food companies, Capital Nomura Securities analyst Ploenjai Jirajarus maintains a Neutral rating for the sector. She this month prefers food processors with high-quality products — names like CPF and GFPT. The tense politic situation in the Middle East, high crude price and the Japan earthquake have given rise to worries of global economic uncertainty and therefore, led to a fall in soft commodity price. Thus, CNS’ analyst prefers CPF and GFPT because they are beneficiaries of rising demand for high-quality processed foods for export. Moreover, a slowdown in soft commodities — eg, soybean and corn — will also lower feed costs.
CNS feels that CPF and GFPT are likely to see upward revision in consensus earnings estimates thanks to higher-than-expected demand for processed chicken products exported to Japan and the Middle East. Moreover, the slowdown in global soybean price should ease their feed costs.
CNS also likes TVO as because expected rising export volume for processed chicken products will increase demand for Thailand animal farming and feed mills, and TVO should then be able to sell more soybean meal as a result. Although a fall in soybean and soybean meal prices might be negative to TVO, CNS believes rising demand for both soybean meal and soybean oil will raise production utilisation and, therefore, reduce fix cost per unit.

Agri-Bites | ASEAN Tanuj Shori / Ken Arieff Wong
23 March 2011 Nomura 14
Other data points for the month
Other data points for the month Malaysian February palm oil data — production and exports down, prices fairly reflect inventory levels Malaysian CPO production for the month saw the lowest February reading in the last three years at 1.09mn mT (-5% y-y), though exports fell a sharper 8.5% m-m, partly on the back of the shorter month in February and festive holidays. This brought inventories to 1.5mn tonnes, closer to 2007 levels.
We continue to flag that the CPO production recovery that many people on the Street are expecting (and pricing in) may see headwinds, in our view, and in turn, support CPO prices at current high levels. CPO inventories are likely to fall in the next few months, we believe, as production enters the lean season and demand recovers post winter. In our view, poor soft commodity production, strengthening crude oil prices and a weak US dollar continue to create the perfect storm for the sector.
Exhibit 13. Malaysian palm oil data for February 2011
Palm Oil Feb-2011 m-m (%) y-y (%) YTD (%)
Production (mT) 1,094,473 3.5% -5.4% -13.1%
Closing Stock (mT) 1,478,793 4.2% -17.3% n.m.
Exports (mT) 1,114,202 -8.5% -14.0% -15.4%
FFB Yield (mT/Ha) 1.20 4.3% -1.6% -11.7%
CPO Yield (mT/Ha) 0.24 4.3% -7.7% -16.1%
Source: Malaysian Palm Oil Board (MPOB), Nomura research
China soybean crushing margins fell in February, US margins almost at parity Chinese soybean crushing margins dropped in February-March due to a sharp jump in the price of soybeans and weak soymeal prices, despite soyoil prices also rising. We think this might act as a dampener for 1Q11F earnings at the processors under our coverage, which had faced benign crushing margins in 4Q10. However, with the aid of locked-in margins, Noble group might benefit in 1Q11, in our view. US crushing margins are almost zero at the moment, due to high prices of raw beans.
Chinese soybean imports were down 55% m-m in February, due to higher raw soybean production domestically. We believe that China will continue to have an insatiable demand for soybeans going forward and will likely drive world soy prices in the medium term.
Exhibit 14. Soybean crushing margins
(40)(20)
020406080
100120140160180
Jun
-09
Jul-0
9
Aug
-09
Sep
-09
Oct
-09
Nov
-09
Dec
-09
Jan
-10
Feb
-10
Ma
r-10
Apr
-10
May
-10
Jun
-10
Jul-1
0
Aug
-10
Sep
-10
Oct
-10
Nov
-10
Dec
-10
Jan
-11
Feb
-11
Ma
r-11
US soybean crush margin (US$/MT)
China soybean crush margin (US$/MT)
China soybean crush margin imported (US$/MT)
Note: Assuming zero processing cost; Source: Bloomberg, Nomura estimates
Crushing margins fell slightly
Agri-Bites | ASEAN Tanuj Shori / Ken Arieff Wong
23 March 2011 Nomura 15
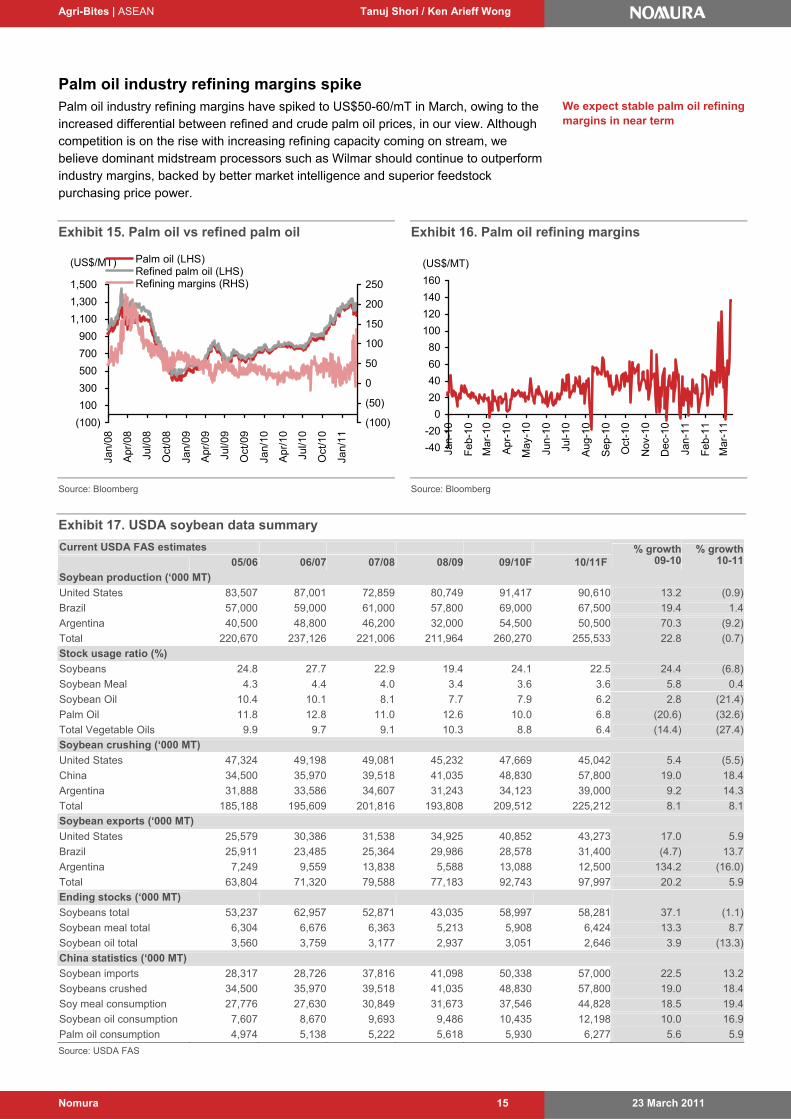
Palm oil industry refining margins spike Palm oil industry refining margins have spiked to US$50-60/mT in March, owing to the increased differential between refined and crude palm oil prices, in our view. Although competition is on the rise with increasing refining capacity coming on stream, we believe dominant midstream processors such as Wilmar should continue to outperform industry margins, backed by better market intelligence and superior feedstock purchasing price power.
Exhibit 15. Palm oil vs refined palm oil
(100)
100
300
500
700
900
1,100
1,300
1,500
Jan/
08
Apr
/08
Jul/0
8
Oct
/08
Jan/
09
Apr
/09
Jul/0
9
Oct
/09
Jan/
10
Apr
/10
Jul/1
0
Oct
/10
Jan/
11
(US$/MT)
(100)
(50)
0
50
100
150
200
250
Palm oil (LHS)Refined palm oil (LHS)Refining margins (RHS)
Source: Bloomberg
Exhibit 16. Palm oil refining margins
-40
-20
0
20
40
60
80
100
120
140
160
Jan-
10
Feb
-10
Mar
-10
Apr
-10
May
-10
Jun-
10
Jul-1
0
Aug
-10
Sep
-10
Oct
-10
Nov
-10
Dec
-10
Jan-
11
Feb
-11
Mar
-11
(US$/MT)
Source: Bloomberg
Exhibit 17. USDA soybean data summary
Current USDA FAS estimates
05/06 06/07 07/08 08/09 09/10F 10/11F % growth
09-10% growth
10-11
Soybean production (‘000 MT)
United States 83,507 87,001 72,859 80,749 91,417 90,610 13.2 (0.9)
Brazil 57,000 59,000 61,000 57,800 69,000 67,500 19.4 1.4
Argentina 40,500 48,800 46,200 32,000 54,500 50,500 70.3 (9.2)
Total 220,670 237,126 221,006 211,964 260,270 255,533 22.8 (0.7)
Stock usage ratio (%)
Soybeans 24.8 27.7 22.9 19.4 24.1 22.5 24.4 (6.8)
Soybean Meal 4.3 4.4 4.0 3.4 3.6 3.6 5.8 0.4
Soybean Oil 10.4 10.1 8.1 7.7 7.9 6.2 2.8 (21.4)
Palm Oil 11.8 12.8 11.0 12.6 10.0 6.8 (20.6) (32.6)
Total Vegetable Oils 9.9 9.7 9.1 10.3 8.8 6.4 (14.4) (27.4)
Soybean crushing (‘000 MT)
United States 47,324 49,198 49,081 45,232 47,669 45,042 5.4 (5.5)
China 34,500 35,970 39,518 41,035 48,830 57,800 19.0 18.4
Argentina 31,888 33,586 34,607 31,243 34,123 39,000 9.2 14.3
Total 185,188 195,609 201,816 193,808 209,512 225,212 8.1 8.1
Soybean exports (‘000 MT)
United States 25,579 30,386 31,538 34,925 40,852 43,273 17.0 5.9
Brazil 25,911 23,485 25,364 29,986 28,578 31,400 (4.7) 13.7
Argentina 7,249 9,559 13,838 5,588 13,088 12,500 134.2 (16.0)
Total 63,804 71,320 79,588 77,183 92,743 97,997 20.2 5.9
Ending stocks (‘000 MT)
Soybeans total 53,237 62,957 52,871 43,035 58,997 58,281 37.1 (1.1)
Soybean meal total 6,304 6,676 6,363 5,213 5,908 6,424 13.3 8.7
Soybean oil total 3,560 3,759 3,177 2,937 3,051 2,646 3.9 (13.3)
China statistics (‘000 MT)
Soybean imports 28,317 28,726 37,816 41,098 50,338 57,000 22.5 13.2
Soybeans crushed 34,500 35,970 39,518 41,035 48,830 57,800 19.0 18.4
Soy meal consumption 27,776 27,630 30,849 31,673 37,546 44,828 18.5 19.4
Soybean oil consumption 7,607 8,670 9,693 9,486 10,435 12,198 10.0 16.9
Palm oil consumption 4,974 5,138 5,222 5,618 5,930 6,277 5.6 5.9
Source: USDA FAS
We expect stable palm oil refining margins in near term

Agri-Bites | ASEAN Tanuj Shori / Ken Arieff Wong
23 March 2011 Nomura 16
Major news flow for the month
Exhibit 18. Major news flow
Noble Raises US$500mn in new equity
Noble Group raised US$500mn in new equity in a share placement, with CIC investing pro-rata stake. (Source: Company filing)
Nomura comment: We believe Noble’s intention to maintain investment-grade ratings has led to this capital raising, esp after recent sugar asset acquisitions. We continue to expect strong near-term performance led by a positive macro environment.
Sime Darby sued by Oil & Gas services company for US$178mn – Sime management says claim has 'no basis whatsoever in law'
The press reported that Sime is being sued by Emirates International Energy Services (EMAS) for ~US$178mn. EMAS (a consultant to Sime Darby Engineering–SDE) has accused SDE of backing out of project tenders to help other foreign companies win the tenders, and claims that it had lost expected revenues due to SDE’s withdrawals. (Source: The National, 14 Feb)
Nomura comment: Sime’s mgmt views EMAS’ claims as ‘baseless allegations,' according to the report. Based on our understanding, we do not think it warrants any provision for contingent liability.
Olam to Boost Financial Commodity Unit With ‘Half Dozen Funds’
Olam International Ltd., among the world’s three biggest suppliers of rice and cotton, plans to expand a pilot fund that invests in commodities more than fourfold and add about six new investment vehicles. Using its market knowledge as supplier of more than 20 raw materials, the Singapore-based trader will grow its Ektimo Commodity Relative Value Fund LP to $250 million from $60 million currently, Olam Chief Executive Officer Sunny Verghese said in an interview. “Tailor-made” commodity funds will follow, he said. (Source: Bloomberg)
Sime Hasn’t Signed Agreement to Invest in Oil Palm in Cameroon
Sime Darby Bhd. hasn’t signed any agreement to invest in an oil palm plantation in Cameroon, the Malaysian company said in a statement. “The company does from time to time explore investment opportunities relating to its core businesses as part of the continuous expansion plan of the group,” Sime said. (Source: Company filing)
Ruchi Group lines up $150mn for overseas expansion
In tune with Indian corporates looking abroad to source their raw material needs abroad, Indore-based Ruchi Group plans to grow oil palm in Cambodia. The group has signed a memorandum of understanding with Phnom Penh for this and, initially, oil palm will be cultivated in 20,000 hectares, a company official said. Ruchi Group plans a total investment of $150 million in the next three years to expand globally, while in the country, it plans to spend Rs 80-100 crore for expansion. In Ethiopia, Ruchi has cultivated soyabean on a pilot basis and the result has been good. It plans commercial cultivation of soyabean on 25,000 hectares there. During the pilot project, the yield was two tonnes a hectare. (Source: BusinessLine)
KLK drops plans to issue US$300mn bonds
KUALA Lumpur Kepong Bhd (KLK) has dropped plans to issue US$300 million (RM912 million) bonds based on the company's current financial condition. KLK feels it no longer requires the planned US$300 million, five-year unsecured guaranteed exchangeable bonds with an over- allotment option to increase the issue by US$100 million (RM304 million). (Source: Bloomberg).
Source: Various media reports, company announcements, Nomura research

Agri-Bites | ASEAN Tanuj Shori / Ken Arieff Wong
23 March 2011 Nomura 17
Recap for the last month
Round-up of Feb-March 2011 Here we summarise key developments from last month.
Last month’s commodity price performance: negative Commodity price performance was generally negative over the past month, due to concerns over the impact of events in Japan and expectations of supply recovery capping prices. Prices of oils such as CPO (-14.1% m-m), refined palm oil (-11.1% m-m), US soybean (-10.6% m-m), US wheat (-26.6% m-m) and rubber (-25.2% m-m) were lower. We witnessed a secular downtick in commodity prices across the board. The S&P GSCI Agri Index was down 12.3% last month.
Stock performance generally negative, agri inputs and midstream lead fall Over the past month, commodity stocks have generally corrected, with agri inputs and midstream stocks showing the greatest fall, on the back of commodity price corrections and concerns on the impact of the Japanese earthquake on the world economy. Downstream stocks like CP Foods, Want Want and China Minzhong have showed positive performance. Olam has lagged on concerns over export incentives and accounting reclassifications. We think that this correction has been overdone, and many of these stocks may now be trading at attractive valuations from a long-term perspective.
Review of stock performance
Exhibit 19. Top- and bottom-five performers over last month
Top five Bottom five
Name Absolute (%) Relative (%) Name Absolute (%) Relative (%)
CP Foods 16.8 11.2 China XLX (22.6) (18.3)
Want Want 13.9 14.6 Chaoda Modern (19.0) (18.3)
GFPT 10.7 5.1 Mewah (18.7) (14.5)
China Minzhong 7.7 11.9 Olam (15.9) (11.7)
Tingyi 6.3 7.0 Indofood Agri (15.6) (11.3)
Source: Bloomberg, Nomura research
Consensus downgrades occur on price correction, profit taking Overall, the Street cut earnings estimates and price targets for many agri companies, pointing to a weaker environment ahead (consensus source: Bloomberg). Wilmar also saw its consensus earnings and PT cut owing to continued weak results. Conversely, Noble’s recommendation spread was upped due to bullish 4Q10 momentum.
Commodity price performance was generally negative over the past month

Agri-Bites | ASEAN Tanuj Shori / Ken Arieff Wong
23 March 2011 Nomura 18
Valuation
Valuation snapshot
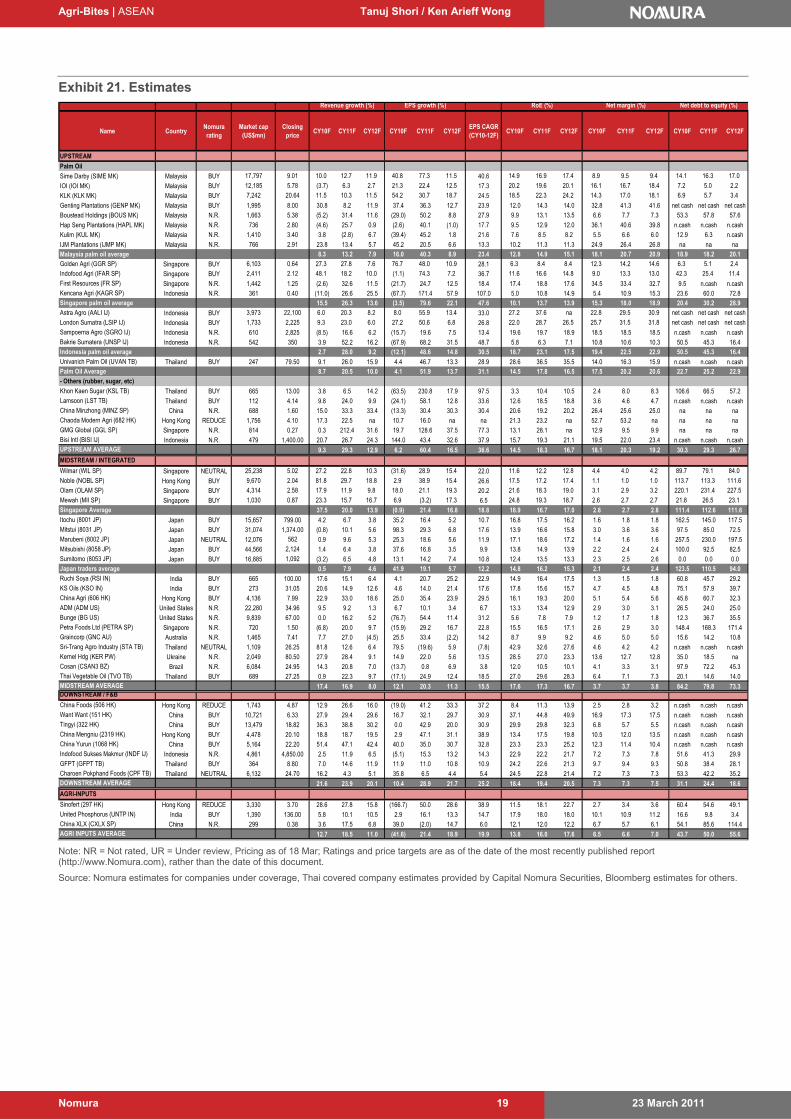
Exhibit 20. Valuations
Name CountryNomura rating
Market cap (US$mn)
Closing price
CY10F CY11F CY12F CY10F CY11F CY12F CY10F CY11F CY12FPEG (CY11
P/E vs CY10-12F CAGR)
CY10F CY11F CY12F
UPSTREAMPalm OilSime Darby (SIME MK) Malaysia BUY 17,797 9.01 25.6 14.4 12.9 2.5 2.3 2.2 13.2 8.3 7.6 0.4 2.0 3.7 4.3IOI (IOI MK) Malaysia BUY 12,185 5.78 19.5 16.0 14.2 3.3 3.0 2.7 12.4 10.9 9.7 0.9 2.1 2.4 2.8KLK (KLK MK) Malaysia BUY 7,242 20.64 20.1 15.4 12.9 3.6 3.3 3.0 12.5 9.8 8.3 0.6 3.1 3.9 4.6Genting Plantations (GENP MK) Malaysia BUY 1,995 8.00 18.7 13.7 12.2 2.1 1.8 1.6 12.2 9.2 8.0 0.6 1.1 1.7 1.9 Boustead Holdings (BOUS MK) Malaysia N.R. 1,663 5.38 13.2 8.8 8.1 1.3 1.5 1.6 12.2 8.6 7.6 0.3 5.8 8.0 8.3 Hap Seng Plantations (HAPL MK) Malaysia N.R. 736 2.80 13.5 9.7 9.8 1.3 1.2 1.1 9.4 6.8 6.9 0.5 4.9 6.1 5.9 Kulim (KUL MK) Malaysia N.R. 1,410 3.40 18.1 12.5 12.2 1.2 1.1 1.0 6.9 5.2 5.1 0.6 1.2 1.6 1.7 IJM Plantations (IJMP MK) Malaysia N.R. 766 2.91 17.5 14.5 13.6 1.8 1.7 1.6 10.8 9.0 8.7 1.1 2.8 3.3 3.6 Malaysia palm oil average 18.3 13.1 12.0 2.1 2.0 1.9 11.2 8.5 7.7 0.6 2.9 3.8 4.1 Golden Agri (GGR SP) Singapore BUY 6,103 0.64 16.3 11.0 9.9 1.0 0.9 0.8 10.3 7.4 6.5 0.4 1.2 1.8 2.0Indofood Agri (IFAR SP) Singapore BUY 2,411 2.12 17.4 10.0 9.3 1.8 1.5 1.3 8.3 5.3 4.6 0.3 0.0 0.0 0.0First Resources (FR SP) Singapore N.R. 1,442 1.25 12.8 10.3 9.1 2.1 1.8 1.5 8.1 6.4 5.8 0.6 1.5 2.3 2.9 Kencana Agri (KAGR SP) Indonesia N.R. 361 0.40 45.0 16.6 10.5 1.6 1.7 1.4 22.4 10.5 7.3 0.2 0.6 1.9 2.9 Singapore palm oil average 22.9 11.9 9.7 1.6 1.5 1.3 12.2 7.4 6.0 0.3 0.8 1.5 1.9 Astra Agro (AALI IJ) Indonesia BUY 3,973 22,100 19.4 12.4 11.0 5.0 4.4 3.9 12.0 8.1 7.0 0.4 3.1 5.2 5.9London Sumatra (LSIP IJ) Indonesia BUY 1,733 2,225 16.9 11.2 10.5 3.5 3.0 2.6 10.4 7.4 6.8 0.4 2.4 4.0 4.8Sampoerna Agro (SGRO IJ) Indonesia N.R. 610 2,825 14.0 11.7 10.9 2.6 2.2 2.0 na na na 0.9 1.8 2.5 2.7 Bakrie Sumatera (UNSP IJ) Indonesia N.R. 542 350 16.2 9.6 7.3 0.6 0.6 0.5 na na na 0.2 1.0 1.6 2.8 Indonesia palm oil average 16.6 11.2 9.9 2.9 2.5 2.2 11.2 7.7 6.9 0.5 2.1 3.3 4.0 Univanich Palm Oil (UVAN TB) Thailand BUY 247 79.50 12.3 8.4 7.4 3.4 2.8 2.5 7.8 5.4 4.8 0.3 5.9 8.7 9.8 Palm Oil Average 18.6 12.1 10.7 2.3 2.0 1.8 11.2 7.9 7.0 0.5 2.4 3.5 3.9 - Others (rubber, sugar, etc)Khon Kaen Sugar (KSL TB) Thailand BUY 665 13.00 71.1 21.5 18.2 2.4 2.0 1.9 20.8 15.7 15.5 0.2 0.8 1.2 1.4 Lamsoon (LST TB) Thailand BUY 112 4.14 12.5 7.9 7.0 1.5 1.4 1.3 9.2 6.1 5.6 0.2 4.6 7.2 8.2 China Minzhong (MINZ SP) China N.R. 688 1.60 10.5 8.1 6.2 2.0 1.5 1.2 5.9 4.3 3.3 0.3 na 0.2 0.3 Chaoda Modern Agri (682 HK) Hong Kong REDUCE 1,756 4.10 2.9 2.5 na 0.5 0.5 na 1.9 1.5 na na 2.0 2.6 naGMG Global (GGL SP) Singapore N.R. 814 0.27 19.3 8.4 6.1 na na na 10.7 4.6 3.3 0.1 1.5 3.0 4.1 Bisi Intl (BISI IJ) Indonesia N.R. 479 1,400.00 23.0 16.0 12.1 3.5 3.0 2.5 15.6 11.9 9.1 0.4 na 0.7 1.2 UPSTREAM AVERAGE 19.8 11.8 10.5 2.2 2.0 1.8 11.1 7.7 7.1 0.4 2.4 3.2 3.7 MIDSTREAM / INTEGRATEDWilmar (WIL SP) Singapore NEUTRAL 25,238 5.02 22.1 17.2 14.9 2.1 1.9 1.8 19.1 14.3 13.4 0.8 1.4 1.5 1.7Noble (NOBL SP) Hong Kong BUY 9,670 2.04 19.0 13.7 11.9 2.4 2.1 1.9 13.3 9.7 8.9 0.5 1.4 1.6 2.2Olam (OLAM SP) Singapore BUY 4,314 2.58 20.0 16.5 13.9 2.8 2.5 2.2 13.1 11.2 10.4 0.8 1.6 1.7 2.1Mewah (MII SP) Singapore BUY 1,030 0.87 9.2 9.5 8.1 1.8 1.7 1.4 8.8 7.6 6.3 1.5 2.5 na naSingapore Average 17.6 14.2 12.2 2.3 2.1 1.8 13.5 10.7 9.7 0.9 1.7 1.6 2.0 Itochu (8001 JP) Japan BUY 15,657 799.00 6.8 5.8 5.6 1.1 1.0 0.8 10.2 8.2 7.8 0.5 2.6 3.1 3.2 Mitstui (8031 JP) Japan BUY 31,074 1,374.00 8.1 6.2 5.8 1.1 1.0 0.9 9.5 7.9 7.7 0.4 2.8 3.7 3.9 Marubeni (8002 JP) Japan NEUTRAL 12,076 562 7.8 6.6 6.3 1.3 1.2 1.0 11.5 9.9 9.4 0.6 2.0 2.3 2.5 Mitsubishi (8058 JP) Japan BUY 44,566 2,124 8.5 7.3 7.1 1.3 1.2 1.1 12.4 9.8 9.8 0.7 2.7 3.1 3.2 Sumitomo (8053 JP) Japan BUY 16,885 1,092 7.1 6.2 5.8 0.9 0.8 0.7 11.7 9.9 9.4 0.6 3.1 3.9 4.3 Japan traders average 7.7 6.4 6.1 1.1 1.0 0.9 11.0 9.1 8.8 0.6 2.6 3.2 3.4 Ruchi Soya (RSI IN) India BUY 665 100.00 14.3 11.8 9.4 1.7 1.6 1.3 7.4 6.2 5.1 0.5 0.8 1.0 1.2 KS Oils (KSO IN) India BUY 273 31.05 6.6 5.8 4.7 0.9 0.8 0.6 4.1 3.6 3.0 0.3 0.8 0.9 1.1 China Agri (606 HK) Hong Kong BUY 4,136 7.99 12.3 9.1 7.3 1.8 1.5 1.2 14.8 10.2 8.1 0.3 2.1 3.0 3.8 ADM (ADM US) United States N.R. 22,280 34.96 11.2 10.1 9.8 1.4 1.3 1.2 9.4 8.6 8.2 1.5 1.7 1.8 1.8 Bunge (BG US) United States N.R. 9,839 67.00 17.8 11.5 10.3 0.9 0.8 0.8 10.2 8.2 7.7 0.4 1.3 1.3 1.4 Petra Foods Ltd (PETRA SP) Singapore N.R. 720 1.50 18.2 14.1 12.1 2.5 2.2 2.0 13.0 10.9 9.4 0.6 2.3 2.9 3.1 Graincorp (GNC AU) Australia N.R. 1,465 7.41 14.3 10.7 11.0 1.1 1.1 1.0 7.5 5.9 6.1 0.8 3.9 4.7 4.7 Sri-Trang Agro Industry (STA TB) Thailand NEUTRAL 1,109 26.25 6.8 8.5 8.0 2.5 2.5 2.0 na na na (1.1) na na naKernel Hdg (KER PW) Ukraine N.R. 2,049 80.50 11.2 9.2 8.7 3.0 2.3 1.9 10.2 8.2 7.6 0.7 0.0 0.4 1.0 Cosan (CSAN3 BZ) Brazil N.R. 6,084 24.95 14.5 14.4 13.4 1.9 1.7 1.6 7.4 7.3 7.8 3.8 1.7 2.1 2.8 Thai Vegetable Oil (TVO TB) Thailand BUY 689 27.25 14.0 11.2 10.0 3.5 3.0 2.7 13.0 9.5 8.5 0.6 5.0 6.2 7.0 MIDSTREAM AVERAGE 12.5 10.3 9.2 1.8 1.6 1.4 10.9 8.8 8.1 0.7 2.1 2.5 2.8 DOWNSTREAM / F&BChina Foods (506 HK) Hong Kong REDUCE 1,743 4.87 28.6 20.3 15.2 2.4 2.2 2.0 15.0 11.8 9.5 0.5 1.2 1.6 2.3 Want Want (151 HK) China BUY 10,721 6.33 29.0 21.9 16.9 10.7 9.1 7.7 22.4 16.4 12.2 0.7 2.7 3.7 4.8 Tingyi (322 HK) China BUY 13,479 18.82 34.5 24.1 20.1 6.9 6.0 5.0 15.1 11.8 9.4 0.8 1.7 2.1 2.5 China Mengniu (2319 HK) Hong Kong BUY 4,478 20.10 24.2 16.4 12.5 3.1 2.7 2.3 12.5 8.7 6.9 0.4 0.9 1.4 1.8 China Yurun (1068 HK) China BUY 5,164 22.20 15.9 11.7 9.0 2.9 2.4 2.0 18.7 12.3 8.8 0.4 1.6 2.2 2.8 Indofood Sukses Makmur (INDF IJ) Indonesia N.R. 4,861 4,850.00 15.2 13.2 11.7 3.2 2.8 2.4 na na na 0.9 2.0 2.5 3.0 GFPT (GFPT TB) Thailand BUY 364 8.80 9.2 8.3 7.5 2.0 1.7 1.5 7.0 6.2 6.4 0.8 3.1 3.5 3.9 Charoen Pokphand Foods (CPF TB) Thailand NEUTRAL 6,132 24.70 12.6 11.9 11.4 3.1 2.7 2.5 12.0 11.3 11.2 2.2 4.0 5.1 5.3 DOWNSTREAM AVERAGE 21.2 16.0 13.0 4.3 3.7 3.2 14.7 11.2 9.2 0.8 1.7 2.2 2.6 AGRI-INPUTSSinofert (297 HK) Hong Kong REDUCE 3,330 3.70 22.2 14.8 11.5 1.7 1.5 1.4 21.0 11.6 9.6 0.4 0.6 1.0 1.3 United Phosphorus (UNTP IN) India BUY 1,390 136.00 10.8 9.3 8.2 1.8 1.6 1.4 6.5 5.8 5.3 0.6 2.0 3.3 4.8 China XLX (CXLX SP) China N.R. 299 0.38 9.8 10.0 8.7 1.2 1.1 1.0 7.9 6.7 5.7 1.7 2.5 2.2 2.6 AGRI INPUTS AVERAGE 14.3 11.4 9.5 1.5 1.4 1.3 11.8 8.0 6.8 0.9 1.7 2.2 2.9
P/B EV/EBITDA Div yld (%)P/E
Note: NR = Not rated, UR = Under review, Pricing as of 18 Mar; Ratings and price targets are as of the date of the most recently published report (http://www.Nomura.com), rather than the date of this document.
Source: Nomura estimates for companies under coverage, Thai covered company estimates provided by Capital Nomura Securities, Bloomberg estimates for others.
Agri-Bites | ASEAN Tanuj Shori / Ken Arieff Wong
23 March 2011 Nomura 19
Exhibit 21. Estimates
Name CountryNomura rating
Market cap (US$mn)
Closing price
CY10F CY11F CY12F CY10F CY11F CY12FEPS CAGR (CY10-12F)
CY10F CY11F CY12F CY10F CY11F CY12F CY10F CY11F CY12F
UPSTREAM
Palm Oil
Sime Darby (SIME MK) Malaysia BUY 17,797 9.01 10.0 12.7 11.9 40.8 77.3 11.5 40.6 14.9 16.9 17.4 8.9 9.5 9.4 14.1 16.3 17.0
IOI (IOI MK) Malaysia BUY 12,185 5.78 (3.7) 6.3 2.7 21.3 22.4 12.5 17.3 20.2 19.6 20.1 16.1 16.7 18.4 7.2 5.0 2.2
KLK (KLK MK) Malaysia BUY 7,242 20.64 11.5 10.3 11.5 54.2 30.7 18.7 24.5 18.5 22.3 24.2 14.3 17.0 18.1 6.9 5.7 3.4
Genting Plantations (GENP MK) Malaysia BUY 1,995 8.00 30.8 8.2 11.9 37.4 36.3 12.7 23.9 12.0 14.3 14.0 32.8 41.3 41.6 net cash net cash net cashBoustead Holdings (BOUS MK) Malaysia N.R. 1,663 5.38 (5.2) 31.4 11.6 (29.0) 50.2 8.8 27.9 9.9 13.1 13.5 6.6 7.7 7.3 53.3 57.8 57.6
Hap Seng Plantations (HAPL MK) Malaysia N.R. 736 2.80 (4.6) 25.7 0.9 (2.6) 40.1 (1.0) 17.7 9.5 12.9 12.0 36.1 40.6 39.8 n.cash n.cash n.cashKulim (KUL MK) Malaysia N.R. 1,410 3.40 3.8 (2.8) 6.7 (39.4) 45.2 1.8 21.6 7.6 8.5 8.2 5.5 6.6 6.0 12.9 6.3 n.cash
IJM Plantations (IJMP MK) Malaysia N.R. 766 2.91 23.8 13.4 5.7 45.2 20.5 6.6 13.3 10.2 11.3 11.3 24.9 26.4 26.8 na na naMalaysia palm oil average 8.3 13.2 7.9 16.0 40.3 8.9 23.4 12.8 14.9 15.1 18.1 20.7 20.9 18.9 18.2 20.1 Golden Agri (GGR SP) Singapore BUY 6,103 0.64 27.3 27.8 7.6 76.7 48.0 10.9 28.1 6.3 8.4 8.4 12.3 14.2 14.6 6.3 5.1 2.4Indofood Agri (IFAR SP) Singapore BUY 2,411 2.12 48.1 18.2 10.0 (1.1) 74.3 7.2 36.7 11.6 16.6 14.8 9.0 13.3 13.0 42.3 25.4 11.4
First Resources (FR SP) Singapore N.R. 1,442 1.25 (2.6) 32.6 11.5 (21.7) 24.7 12.5 18.4 17.4 18.8 17.6 34.5 33.4 32.7 9.5 n.cash n.cashKencana Agri (KAGR SP) Indonesia N.R. 361 0.40 (11.0) 26.6 25.5 (67.7) 171.4 57.9 107.0 5.0 10.8 14.9 5.4 10.9 15.3 23.6 60.0 72.8 Singapore palm oil average 15.5 26.3 13.6 (3.5) 79.6 22.1 47.6 10.1 13.7 13.9 15.3 18.0 18.9 20.4 30.2 28.9 Astra Agro (AALI IJ) Indonesia BUY 3,973 22,100 6.0 20.3 8.2 8.0 55.9 13.4 33.0 27.2 37.6 na 22.8 29.5 30.9 net cash net cash net cash
London Sumatra (LSIP IJ) Indonesia BUY 1,733 2,225 9.3 23.0 6.0 27.2 50.6 6.8 26.8 22.0 28.7 26.5 25.7 31.5 31.8 net cash net cash net cashSampoerna Agro (SGRO IJ) Indonesia N.R. 610 2,825 (8.5) 16.6 6.2 (15.7) 19.6 7.5 13.4 19.6 19.7 18.9 18.5 18.5 18.5 n.cash n.cash n.cashBakrie Sumatera (UNSP IJ) Indonesia N.R. 542 350 3.9 52.2 16.2 (67.9) 68.2 31.5 48.7 5.8 6.3 7.1 10.8 10.6 10.3 50.5 45.3 16.4 Indonesia palm oil average 2.7 28.0 9.2 (12.1) 48.6 14.8 30.5 18.7 23.1 17.5 19.4 22.5 22.9 50.5 45.3 16.4 Univanich Palm Oil (UVAN TB) Thailand BUY 247 79.50 9.1 26.0 15.9 4.4 46.7 13.3 28.9 28.6 36.5 35.5 14.0 16.3 15.9 n.cash n.cash n.cashPalm Oil Average 8.7 20.5 10.0 4.1 51.9 13.7 31.1 14.5 17.8 16.5 17.5 20.2 20.6 22.7 25.2 22.9 - Others (rubber, sugar, etc)
Khon Kaen Sugar (KSL TB) Thailand BUY 665 13.00 3.8 6.5 14.2 (63.5) 230.8 17.9 97.5 3.3 10.4 10.5 2.4 8.0 8.3 106.6 66.5 57.2 Lamsoon (LST TB) Thailand BUY 112 4.14 9.8 24.0 9.9 (24.1) 58.1 12.8 33.6 12.6 18.5 18.8 3.6 4.6 4.7 n.cash n.cash n.cashChina Minzhong (MINZ SP) China N.R. 688 1.60 15.0 33.3 33.4 (13.3) 30.4 30.3 30.4 20.6 19.2 20.2 26.4 25.6 25.0 na na naChaoda Modern Agri (682 HK) Hong Kong REDUCE 1,756 4.10 17.3 22.5 na 10.7 16.0 na na 21.3 23.2 na 52.7 53.2 na na na naGMG Global (GGL SP) Singapore N.R. 814 0.27 0.3 212.4 31.6 19.7 128.6 37.5 77.3 13.1 28.1 na 12.9 9.5 9.9 na na naBisi Intl (BISI IJ) Indonesia N.R. 479 1,400.00 20.7 26.7 24.3 144.0 43.4 32.6 37.9 15.7 19.3 21.1 19.5 22.0 23.4 n.cash n.cash n.cashUPSTREAM AVERAGE 9.3 29.3 12.9 6.2 60.4 16.5 36.6 14.5 18.3 16.7 18.1 20.3 19.2 30.3 29.3 26.7
MIDSTREAM / INTEGRATED
Wilmar (WIL SP) Singapore NEUTRAL 25,238 5.02 27.2 22.8 10.3 (31.6) 28.9 15.4 22.0 11.6 12.2 12.8 4.4 4.0 4.2 89.7 79.1 84.0
Noble (NOBL SP) Hong Kong BUY 9,670 2.04 81.8 29.7 18.8 2.9 38.9 15.4 26.6 17.5 17.2 17.4 1.1 1.0 1.0 113.7 113.3 111.6Olam (OLAM SP) Singapore BUY 4,314 2.58 17.9 11.9 9.8 18.0 21.1 19.3 20.2 21.6 18.3 19.0 3.1 2.9 3.2 220.1 231.4 227.5
Mewah (MII SP) Singapore BUY 1,030 0.87 23.3 15.7 16.7 6.9 (3.2) 17.3 6.5 24.8 19.3 18.7 2.6 2.7 2.7 21.8 26.5 23.1Singapore Average 37.5 20.0 13.9 (0.9) 21.4 16.8 18.8 18.9 16.7 17.0 2.8 2.7 2.8 111.4 112.6 111.6 Itochu (8001 JP) Japan BUY 15,657 799.00 4.2 6.7 3.8 35.2 16.4 5.2 10.7 16.8 17.5 16.2 1.6 1.8 1.8 162.5 145.0 117.5 Mitstui (8031 JP) Japan BUY 31,074 1,374.00 (0.8) 10.1 5.6 98.3 29.3 6.8 17.6 13.9 16.6 15.8 3.0 3.6 3.6 97.5 85.0 72.5 Marubeni (8002 JP) Japan NEUTRAL 12,076 562 0.9 9.6 5.3 25.3 18.6 5.6 11.9 17.1 18.6 17.2 1.4 1.6 1.6 257.5 230.0 197.5 Mitsubishi (8058 JP) Japan BUY 44,566 2,124 1.4 6.4 3.8 37.6 16.8 3.5 9.9 13.8 14.9 13.9 2.2 2.4 2.4 100.0 92.5 82.5 Sumitomo (8053 JP) Japan BUY 16,885 1,092 (3.2) 6.5 4.8 13.1 14.2 7.4 10.8 12.4 13.5 13.3 2.3 2.5 2.6 0.0 0.0 0.0 Japan traders average 0.5 7.9 4.6 41.9 19.1 5.7 12.2 14.8 16.2 15.3 2.1 2.4 2.4 123.5 110.5 94.0 Ruchi Soya (RSI IN) India BUY 665 100.00 17.6 15.1 6.4 4.1 20.7 25.2 22.9 14.9 16.4 17.5 1.3 1.5 1.8 60.8 45.7 29.2 KS Oils (KSO IN) India BUY 273 31.05 20.6 14.9 12.6 4.6 14.0 21.4 17.6 17.8 15.6 15.7 4.7 4.5 4.8 75.1 57.9 39.7 China Agri (606 HK) Hong Kong BUY 4,136 7.99 22.9 33.0 18.6 25.0 35.4 23.9 29.5 16.1 19.3 20.0 5.1 5.4 5.6 45.8 60.7 32.3 ADM (ADM US) United States N.R. 22,280 34.96 9.5 9.2 1.3 6.7 10.1 3.4 6.7 13.3 13.4 12.9 2.9 3.0 3.1 26.5 24.0 25.0 Bunge (BG US) United States N.R. 9,839 67.00 0.0 16.2 5.2 (76.7) 54.4 11.4 31.2 5.6 7.8 7.9 1.2 1.7 1.8 12.3 36.7 35.5 Petra Foods Ltd (PETRA SP) Singapore N.R. 720 1.50 (6.8) 20.0 9.7 (15.9) 29.2 16.7 22.8 15.5 16.5 17.1 2.6 2.9 3.0 148.4 168.3 171.4 Graincorp (GNC AU) Australia N.R. 1,465 7.41 7.7 27.0 (4.5) 25.5 33.4 (2.2) 14.2 8.7 9.9 9.2 4.6 5.0 5.0 15.6 14.2 10.8 Sri-Trang Agro Industry (STA TB) Thailand NEUTRAL 1,109 26.25 81.8 12.6 6.4 79.5 (19.6) 5.9 (7.8) 42.9 32.6 27.6 4.6 4.2 4.2 n.cash n.cash n.cashKernel Hdg (KER PW) Ukraine N.R. 2,049 80.50 27.9 28.4 9.1 14.9 22.0 5.6 13.5 28.5 27.0 23.3 13.6 12.7 12.8 35.0 18.5 naCosan (CSAN3 BZ) Brazil N.R. 6,084 24.95 14.3 20.8 7.0 (13.7) 0.8 6.9 3.8 12.0 10.5 10.1 4.1 3.3 3.1 97.9 72.2 45.3 Thai Vegetable Oil (TVO TB) Thailand BUY 689 27.25 0.9 22.3 9.7 (17.1) 24.9 12.4 18.5 27.0 29.6 28.3 6.4 7.1 7.3 20.1 14.6 14.0 MIDSTREAM AVERAGE 17.4 16.9 8.0 12.1 20.3 11.3 15.5 17.6 17.3 16.7 3.7 3.7 3.8 84.2 79.8 73.3 DOWNSTREAM / F&B
China Foods (506 HK) Hong Kong REDUCE 1,743 4.87 12.9 26.6 16.0 (19.0) 41.2 33.3 37.2 8.4 11.3 13.9 2.5 2.8 3.2 n.cash n.cash n.cashWant Want (151 HK) China BUY 10,721 6.33 27.9 29.4 29.6 16.7 32.1 29.7 30.9 37.1 44.8 49.9 16.9 17.3 17.5 n.cash n.cash n.cashTingyi (322 HK) China BUY 13,479 18.82 36.3 38.8 30.2 0.0 42.9 20.0 30.9 29.9 29.8 32.3 6.8 5.7 5.5 n.cash n.cash n.cashChina Mengniu (2319 HK) Hong Kong BUY 4,478 20.10 18.8 18.7 19.5 2.9 47.1 31.1 38.9 13.4 17.5 19.8 10.5 12.0 13.5 n.cash n.cash n.cashChina Yurun (1068 HK) China BUY 5,164 22.20 51.4 47.1 42.4 40.0 35.0 30.7 32.8 23.3 23.3 25.2 12.3 11.4 10.4 n.cash n.cash n.cashIndofood Sukses Makmur (INDF IJ) Indonesia N.R. 4,861 4,850.00 2.5 11.9 6.5 (5.1) 15.3 13.2 14.3 22.9 22.2 21.7 7.2 7.3 7.8 51.6 41.3 29.9 GFPT (GFPT TB) Thailand BUY 364 8.80 7.0 14.6 11.9 11.9 11.0 10.8 10.9 24.2 22.6 21.3 9.7 9.4 9.3 50.8 38.4 28.1 Charoen Pokphand Foods (CPF TB) Thailand NEUTRAL 6,132 24.70 16.2 4.3 5.1 35.8 6.5 4.4 5.4 24.5 22.8 21.4 7.2 7.3 7.3 53.3 42.2 35.2 DOWNSTREAM AVERAGE 21.6 23.9 20.1 10.4 28.9 21.7 25.2 18.4 19.4 20.5 7.3 7.3 7.5 31.1 24.4 18.6
AGRI-INPUTS
Sinofert (297 HK) Hong Kong REDUCE 3,330 3.70 28.6 27.8 15.8 (166.7) 50.0 28.6 38.9 11.5 18.1 22.7 2.7 3.4 3.6 60.4 54.6 49.1 United Phosphorus (UNTP IN) India BUY 1,390 136.00 5.8 10.1 10.5 2.9 16.1 13.3 14.7 17.9 18.0 18.0 10.1 10.9 11.2 16.6 9.8 3.4 China XLX (CXLX SP) China N.R. 299 0.38 3.6 17.5 6.8 39.0 (2.0) 14.7 6.0 12.1 12.0 12.2 6.7 5.7 6.1 54.1 85.6 114.4 AGRI INPUTS AVERAGE 12.7 18.5 11.0 (41.6) 21.4 18.9 19.9 13.8 16.0 17.6 6.5 6.6 7.0 43.7 50.0 55.6
RoE (%) Net debt to equity (%)EPS growth (%) Net margin (%)Revenue growth (%)
Note: NR = Not rated, UR = Under review, Pricing as of 18 Mar; Ratings and price targets are as of the date of the most recently published report (http://www.Nomura.com), rather than the date of this document.
Source: Nomura estimates for companies under coverage, Thai covered company estimates provided by Capital Nomura Securities, Bloomberg estimates for others.
Agri-Bites | ASEAN Tanuj Shori / Ken Arieff Wong
23 March 2011 Nomura 20
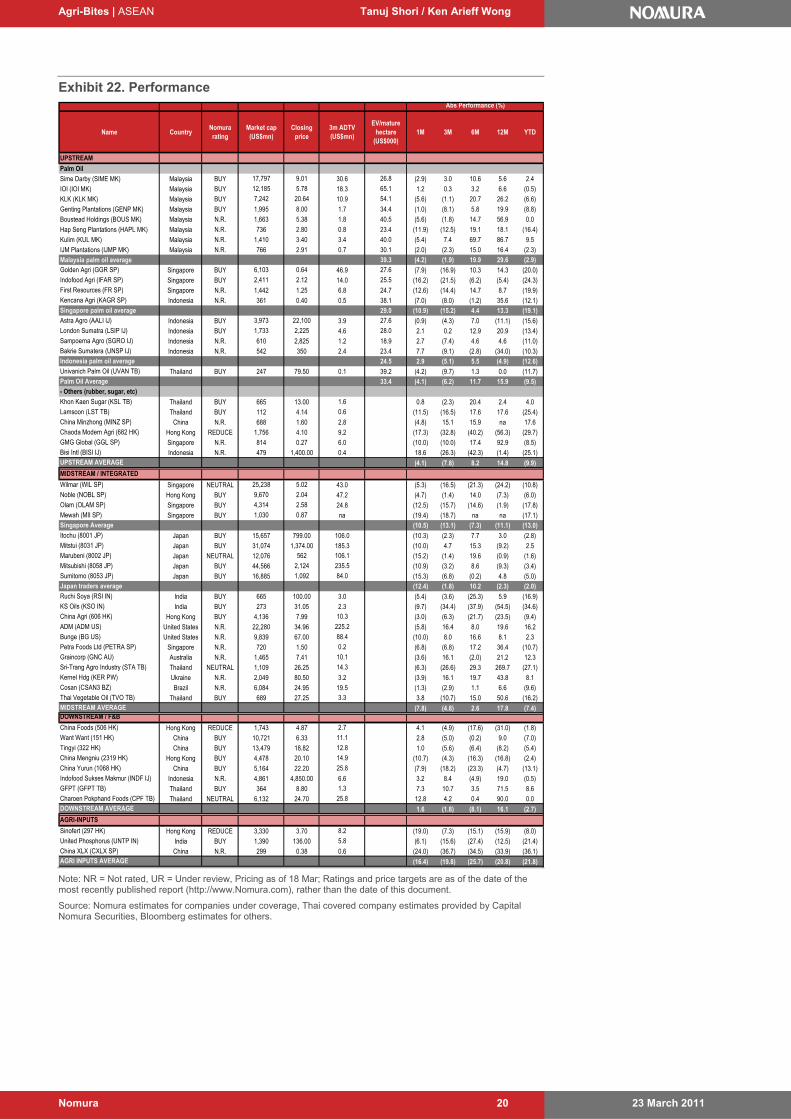
Exhibit 22. Performance
Name CountryNomura rating
Market cap (US$mn)
Closing price
3m ADTV (US$mn)
EV/mature hectare
(US$000)1M 3M 6M 12M YTD
UPSTREAM
Palm Oil
Sime Darby (SIME MK) Malaysia BUY 17,797 9.01 30.6 26.8 (2.9) 3.0 10.6 5.6 2.4 IOI (IOI MK) Malaysia BUY 12,185 5.78 18.3 65.1 1.2 0.3 3.2 6.6 (0.5)KLK (KLK MK) Malaysia BUY 7,242 20.64 10.9 54.1 (5.6) (1.1) 20.7 26.2 (6.6)Genting Plantations (GENP MK) Malaysia BUY 1,995 8.00 1.7 34.4 (1.0) (8.1) 5.8 19.9 (8.8)Boustead Holdings (BOUS MK) Malaysia N.R. 1,663 5.38 1.8 40.5 (5.6) (1.8) 14.7 56.9 0.0
Hap Seng Plantations (HAPL MK) Malaysia N.R. 736 2.80 0.8 23.4 (11.9) (12.5) 19.1 18.1 (16.4)Kulim (KUL MK) Malaysia N.R. 1,410 3.40 3.4 40.0 (5.4) 7.4 69.7 86.7 9.5 IJM Plantations (IJMP MK) Malaysia N.R. 766 2.91 0.7 30.1 (2.0) (2.3) 15.0 16.4 (2.3)Malaysia palm oil average 39.3 (4.2) (1.9) 19.9 29.6 (2.9)Golden Agri (GGR SP) Singapore BUY 6,103 0.64 46.9 27.6 (7.9) (16.9) 10.3 14.3 (20.0)Indofood Agri (IFAR SP) Singapore BUY 2,411 2.12 14.0 25.5 (16.2) (21.5) (6.2) (5.4) (24.3)First Resources (FR SP) Singapore N.R. 1,442 1.25 6.8 24.7 (12.6) (14.4) 14.7 8.7 (19.9)Kencana Agri (KAGR SP) Indonesia N.R. 361 0.40 0.5 38.1 (7.0) (8.0) (1.2) 35.6 (12.1)Singapore palm oil average 29.0 (10.9) (15.2) 4.4 13.3 (19.1)Astra Agro (AALI IJ) Indonesia BUY 3,973 22,100 3.9 27.6 (0.9) (4.3) 7.0 (11.1) (15.6)London Sumatra (LSIP IJ) Indonesia BUY 1,733 2,225 4.6 28.0 2.1 0.2 12.9 20.9 (13.4)Sampoerna Agro (SGRO IJ) Indonesia N.R. 610 2,825 1.2 18.9 2.7 (7.4) 4.6 4.6 (11.0)Bakrie Sumatera (UNSP IJ) Indonesia N.R. 542 350 2.4 23.4 7.7 (9.1) (2.8) (34.0) (10.3)Indonesia palm oil average 24.5 2.9 (5.1) 5.5 (4.9) (12.6)Univanich Palm Oil (UVAN TB) Thailand BUY 247 79.50 0.1 39.2 (4.2) (9.7) 1.3 0.0 (11.7)Palm Oil Average 33.4 (4.1) (6.2) 11.7 15.9 (9.5)- Others (rubber, sugar, etc)
Khon Kaen Sugar (KSL TB) Thailand BUY 665 13.00 1.6 0.8 (2.3) 20.4 2.4 4.0 Lamsoon (LST TB) Thailand BUY 112 4.14 0.6 (11.5) (16.5) 17.6 17.6 (25.4)China Minzhong (MINZ SP) China N.R. 688 1.60 2.8 (4.8) 15.1 15.9 na 17.6 Chaoda Modern Agri (682 HK) Hong Kong REDUCE 1,756 4.10 9.2 (17.3) (32.8) (40.2) (56.3) (29.7)GMG Global (GGL SP) Singapore N.R. 814 0.27 6.0 (10.0) (10.0) 17.4 92.9 (8.5)Bisi Intl (BISI IJ) Indonesia N.R. 479 1,400.00 0.4 18.6 (26.3) (42.3) (1.4) (25.1)UPSTREAM AVERAGE (4.1) (7.8) 8.2 14.8 (9.9)
MIDSTREAM / INTEGRATED
Wilmar (WIL SP) Singapore NEUTRAL 25,238 5.02 43.0 (5.3) (16.5) (21.3) (24.2) (10.8)Noble (NOBL SP) Hong Kong BUY 9,670 2.04 47.2 (4.7) (1.4) 14.0 (7.3) (6.0)Olam (OLAM SP) Singapore BUY 4,314 2.58 24.8 (12.5) (15.7) (14.6) (1.9) (17.8)Mewah (MII SP) Singapore BUY 1,030 0.87 na (19.4) (18.7) na na (17.1)Singapore Average (10.5) (13.1) (7.3) (11.1) (13.0)Itochu (8001 JP) Japan BUY 15,657 799.00 106.0 (10.3) (2.3) 7.7 3.0 (2.8)Mitstui (8031 JP) Japan BUY 31,074 1,374.00 185.3 (10.0) 4.7 15.3 (9.2) 2.5 Marubeni (8002 JP) Japan NEUTRAL 12,076 562 106.1 (15.2) (1.4) 19.6 (0.9) (1.6)Mitsubishi (8058 JP) Japan BUY 44,566 2,124 235.5 (10.9) (3.2) 8.6 (9.3) (3.4)Sumitomo (8053 JP) Japan BUY 16,885 1,092 84.0 (15.3) (6.8) (0.2) 4.8 (5.0)Japan traders average (12.4) (1.8) 10.2 (2.3) (2.0)Ruchi Soya (RSI IN) India BUY 665 100.00 3.0 (5.4) (3.6) (25.3) 5.9 (16.9)KS Oils (KSO IN) India BUY 273 31.05 2.3 (9.7) (34.4) (37.9) (54.5) (34.6)China Agri (606 HK) Hong Kong BUY 4,136 7.99 10.3 (3.0) (6.3) (21.7) (23.5) (9.4)ADM (ADM US) United States N.R. 22,280 34.96 225.2 (5.8) 16.4 8.0 19.6 16.2 Bunge (BG US) United States N.R. 9,839 67.00 88.4 (10.0) 8.0 16.6 8.1 2.3 Petra Foods Ltd (PETRA SP) Singapore N.R. 720 1.50 0.2 (6.8) (6.8) 17.2 36.4 (10.7)Graincorp (GNC AU) Australia N.R. 1,465 7.41 10.1 (3.6) 16.1 (2.0) 21.2 12.3 Sri-Trang Agro Industry (STA TB) Thailand NEUTRAL 1,109 26.25 14.3 (6.3) (26.6) 29.3 269.7 (27.1)Kernel Hdg (KER PW) Ukraine N.R. 2,049 80.50 3.2 (3.9) 16.1 19.7 43.8 8.1 Cosan (CSAN3 BZ) Brazil N.R. 6,084 24.95 19.5 (1.3) (2.9) 1.1 6.6 (9.6)Thai Vegetable Oil (TVO TB) Thailand BUY 689 27.25 3.3 3.8 (10.7) 15.0 50.6 (16.2)MIDSTREAM AVERAGE (7.8) (4.8) 2.6 17.8 (7.4)DOWNSTREAM / F&B
China Foods (506 HK) Hong Kong REDUCE 1,743 4.87 2.7 4.1 (4.9) (17.6) (31.0) (1.8)Want Want (151 HK) China BUY 10,721 6.33 11.1 2.8 (5.0) (0.2) 9.0 (7.0)Tingyi (322 HK) China BUY 13,479 18.82 12.8 1.0 (5.6) (6.4) (8.2) (5.4)China Mengniu (2319 HK) Hong Kong BUY 4,478 20.10 14.9 (10.7) (4.3) (16.3) (16.8) (2.4)China Yurun (1068 HK) China BUY 5,164 22.20 25.8 (7.9) (18.2) (23.3) (4.7) (13.1)Indofood Sukses Makmur (INDF IJ) Indonesia N.R. 4,861 4,850.00 6.6 3.2 8.4 (4.9) 19.0 (0.5)GFPT (GFPT TB) Thailand BUY 364 8.80 1.3 7.3 10.7 3.5 71.5 8.6 Charoen Pokphand Foods (CPF TB) Thailand NEUTRAL 6,132 24.70 25.8 12.8 4.2 0.4 90.0 0.0 DOWNSTREAM AVERAGE 1.6 (1.8) (8.1) 16.1 (2.7)
AGRI-INPUTS
Sinofert (297 HK) Hong Kong REDUCE 3,330 3.70 8.2 (19.0) (7.3) (15.1) (15.9) (8.0)United Phosphorus (UNTP IN) India BUY 1,390 136.00 5.8 (6.1) (15.6) (27.4) (12.5) (21.4)China XLX (CXLX SP) China N.R. 299 0.38 0.6 (24.0) (36.7) (34.5) (33.9) (36.1)AGRI INPUTS AVERAGE (16.4) (19.8) (25.7) (20.8) (21.8)
Abs Performance (%)
Note: NR = Not rated, UR = Under review, Pricing as of 18 Mar; Ratings and price targets are as of the date of the most recently published report (http://www.Nomura.com), rather than the date of this document.
Source: Nomura estimates for companies under coverage, Thai covered company estimates provided by Capital Nomura Securities, Bloomberg estimates for others.

Agri-Bites | ASEAN Tanuj Shori / Ken Arieff Wong
23 March 2011 Nomura 21
Exhibit 23. Valuation: P/E vs EPS CAGR (2010-12F)
IOI
KLK
Golden Agri
Indofood
Astra Agro
London Sumatra
Univanich Palm Oil
Chaoda Modern Agri
Wilmar
Noble
Olam
Mewah
Itochu
Mitstui
Marubeni
Mitsubishi Sumitomo
Ruchi Soya
KS Oils
China Agri
Thai Vegetable Oil
China Foods
Want Want
Tingyi
China Mengniu
China Yurun
GFPT
Charoen Pokphand Foods
Sinofert
United Phosphorus
China XLX
0.0
5.0
10.0
15.0
20.0
25.0
30.0
35.0
40.0
0.0 5.0 10.0 15.0 20.0 25.0 30.0
P/E (CY11F)
EP
S C
AG
R (
CY
10-
12F
)
Source: Bloomberg, Nomura estimates. Estimates for Thai Vegetable Oil and Khon Kaen Sugar provided by Capital Nomura Securities

Agri-Bites | ASEAN Tanuj Shori / Ken Arieff Wong
23 March 2011 Nomura 22
Exhibit 24. Valuation: P/BV (CY11F) vs ROE (CY11F)
China XLX
United Phosphorus Sinofert
Charoen Pokphand FoodsGFPT
China Yurun
China Mengniu
China Foods
Thai Vegetable Oil
Sri-Trang Agro Industry
China Agri
KS Oils Ruchi Soya
Sumitomo
Mitsubishi
Marubeni
Mitstui Itochu
Mewah Olam Noble
Wilmar
Chaoda Modern Agri
Lamsoon
Khon Kaen Sugar
Univanich Palm Oil
London Sumatra
Indofood
Golden Agri
KLK IOI
Sime Darby
0.0
5.0
10.0
15.0
20.0
25.0
30.0
35.0
40.0
45.0
50.0
0.0 0.5 1.0 1.5 2.0 2.5 3.0 3.5 4.0
P/B (CY11F)
RoE
(C
Y11
F)
Source: Bloomberg, Nomura estimates. Estimates for Khon Kaen Sugar and Thai Vegetable Oil provided by Capital Nomura Securities

Agri-Bites | ASEAN Tanuj Shori / Ken Arieff Wong
23 March 2011 Nomura 23
Exhibit 25. Valuation: EV/EBITDA vs EBITDA CAGR (2010-12F)
Sime Darby
IOI
KLK Golden Agri
Indofood
Astra Agro
London Sumatra
Univanich Palm Oil
Khon Kaen Sugar
Lamsoon
Chaoda Modern Agri
Wilmar
Noble
Olam
Mewah
Itochu
Mitstui Marubeni
Mitsubishi
Sumitomo
Ruchi Soya KS Oils
China Agri
Sri-Trang Agro Industry
Thai Vegetable Oil
China Foods
Want Want
Tingyi
China Mengniu
China Yurun
GFPT Charoen Pokphand Foods
Sinofert
United Phosphorus
China XLX
0.0
10.0
20.0
30.0
40.0
50.0
60.0
0.0 5.0 10.0 15.0 20.0 25.0 30.0 35.0 40.0
EV/EBITDA (CY11F)
EB
ITD
A C
AG
R (
CY
10-1
2F)
Source: Bloomberg, Nomura estimates. Estimates for Khon Kaen Sugar provided by Capital Nomura Securities

Agri-Bites | ASEAN Tanuj Shori / Ken Arieff Wong
23 March 2011 Nomura 24
P/E charts
Valuation charts
Exhibit 26. Wilmar — forward P/E
0
1
2
3
4
5
6
7
8
9
10
Jan-
07
Ap
r-07
Jul-0
7
Oct
-07
Jan-
08
Ap
r-08
Jul-0
8
Oct
-08
Jan-
09
Ap
r-09
Jul-0
9
Oct
-09
Jan-
10
Ap
r-10
Jul-1
0
Oct
-10
Jan-
11
(S$)
25x
20x
15x
10x
5x
Source: Bloomberg
Exhibit 27. Noble — forward P/E
0.0
0.5
1.0
1.5
2.0
2.5
3.0
3.5
4.0
4.5
Jan
-07
Ap
r-07
Jul-0
7
Oct
-07
Jan
-08
Ap
r-08
Jul-0
8
Oct
-08
Jan
-09
Ap
r-09
Jul-0
9
Oct
-09
Jan
-10
Ap
r-10
Jul-1
0
Oct
-10
Jan
-11
(S$)
25x
20x
15x
10x
5x
Source: Bloomberg
Exhibit 28. Olam — forward P/E
0.0
1.0
2.0
3.0
4.0
5.0
6.0
Feb
05
Aug
05
Feb
06
Aug
06
Feb
07
Aug
07
Feb
08
Aug
08
Feb
09
Aug
09
Feb
10
Aug
10
Feb
11
(S$)
10x15x
20x
25x
30x
Source: Bloomberg
Exhibit 29. Mewah — forward P/E
0.0
0.2
0.4
0.6
0.8
1.0
1.2
1.4
26-N
ov-1
0
06-D
ec-1
0
16-D
ec-1
0
26-D
ec-1
0
05-J
an-1
1
15-J
an-1
1
25-J
an-1
1
04-F
eb-1
1
14-F
eb-1
1
24-F
eb-1
1
06-M
ar-1
1
16-M
ar-1
1
(S$)
11x
9x
7x
5x
3x
Source: Bloomberg
Exhibit 30. Sime Darby — forward P/E
10
15
20
25
30
35
Nov
-07
Feb
-08
May
-08
Aug
-08
Nov
-08
Feb
-09
May
-09
Aug
-09
Nov
-09
Feb
-10
May
-10
Aug
-10
Nov
-10
Feb
-11
0
500
1,000
1,500
2,000
2,500
3,000
3,500
4,000
4,500
P/E (LHS) CPO (RHS)
-1SD = 15.2
(x)
+1SD = 25.0
Average = 20.1
(RM/mT
Source: Bloomberg
Exhibit 31. IOI — forward P/E
0
5
10
15
20
25
30
35
Jan-
04
Jan-
05
Jan-
06
Jan-
07
Jan-
08
Jan-
09
Jan-
10
Jan-
11
0
500
1,000
1,500
2,000
2,500
3,000
3,500
4,000
4,500PER (LHS)
CPO (RHS)
+1SD=20
Average=15.4
-1SD=10.8
(RM/Mt)
Source: Bloomberg
Agri-Bites | ASEAN Tanuj Shori / Ken Arieff Wong
23 March 2011 Nomura 25
Exhibit 32. KLK — forward P/E
5
10
15
20
25
30
Jan-
04
Jul-0
4
Jan-
05
Jul-0
5
Jan-
06
Jul-0
6
Jan-
07
Jul-0
7
Jan-
08
Jul-0
8
Jan-
09
Jul-0
9
Jan-
10
Jul-1
0
Jan-
11
0
500
1,000
1,500
2,000
2,500
3,000
3,500
4,000
4,500PE (LHS) CPO (RHS) (RM/mT)
+1SD=17.3
Average=13.9
Source: Bloomberg
Exhibit 33. Genting Plantations — forward P/E
0
5
10
15
20
25
Jan
04
Jan
05
Jan
06
Jan
07
Jan
08
Jan
09
Jan
10
Jan
11
05001,0001,5002,0002,5003,0003,5004,0004,500
P/E CPO (RM/mT) -RHS
-1SD = 8.5
(x)
+1SD = 15.1
Average = 11.8
Source: Bloomberg
Exhibit 34. Golden Agri — forward P/E
0.0
5.0
10.0
15.0
20.0
25.0
30.0
Dec
05
Jun
06
Dec
06
Jun
07
Dec
07
Jun
08
Dec
08
Jun
09
Dec
09
Jun
10
Dec
10
0
1,000
2,000
3,000
4,000
5,000
P/E CPO (RM/mT) - RHS
-1SD = 7.3
(x)
+1SD = 17.0
Average = 12.1
Source: Bloomberg
Exhibit 35. Indofood Agri — forward P/E
0
5
10
15
20
25
Mar
-07
Sep
-07
Mar
-08
Sep
-08
Mar
-09
Sep
-09
Mar
-10
Sep
-10
Mar
-11
1,500
2,000
2,500
3,000
3,500
4,000
4,500
PER (LHS) CPO (RHS) (RM/mT)
+1SD = 16.2
Average = 11.9
-1SD = 7.4
(x
Source: Bloomberg
Exhibit 36. Lonsum — forward P/E
0.0
5.0
10.0
15.0
20.0
25.0
Jan
05
Jul 0
5
Jan
06
Jul 0
6
Jan
07
Jul 0
7
Jan
08
Jul 0
8
Jan
09
Jul 0
9
Jan
10
Jul 1
0
Jan
11
0
500
1,000
1,500
2,000
2,500
3,000
3,500
4,000
4,500
P/E CPO (RM/mT) - RHS
-1SD = 8.6
(x)
+1SD = 15.4
Mean = 12.0
Source: Bloomberg
Exhibit 37. Astra Agro — forward P/E
0
5
10
15
20
25
Jan
04
Jan
05
Jan
06
Jan
07
Jan
08
Jan
09
Jan
10
Jan
11
05001,0001,5002,0002,5003,0003,5004,0004,500
P/E CPO (RM/mT) -RHS
-1SD = 6.6
(x)
+1SD = 16.2
Average = 11.4
Source: Bloomberg

Agri-Bites | ASEAN Tanuj Shori / Ken Arieff Wong
23 March 2011 Nomura 26
What went up, what went down
The ups and downs In this section, we track valuation changes and price performances of the regional agri-players and key soft commodities. We also keep tabs on consensus expectations on earnings and price performance for the companies under our coverage.
Last month’s commodity price performance: negative Commodity price performance was generally negative over the past month, due to concerns on the Japanese earthquake and tsunami impact and expectations of supply recovery capping prices. Prices of oils such as CPO (-14.1% m-m), refined palm oil (-11.1% m-m), US soybean (-10.6% m-m), US wheat (-26.6% m-m) and rubber (-25.2% m-m) were lower. We witnessed a secular downtick in commodity prices across the board. The S&P GSCI Agri Index was down 12.3% last month.
Exhibit 38. Commodity price performance
Commodity name Current price Unit % chg m-m % chg ytd % chg y-y Description
Vegetable Oils
Malaysia Crude Palm Oil 3,369.5 MYR/metric tonne (14.1) (10.3) 28.2 Malaysian Palm Oil Board Crude Palm Oil fob Spot Price
Refined Palm Oil 1,162.5 USD/Metric Tonne (11.1) (7.0) 44.0 RBD Palm Oil (Fully Refined) FOB Malaysia Spot Price
US Soybean Oil 50.01 USd/pound (9.4) (6.7) 40.9 USDA Crude Soybean Oil Spot Price/Illinois
China Soybean Oil 9,950 CNY/MT (3.9) 1.5 36.3 China No. 4 Soybean Oil Spot Price Dalian
China Rapeseed Oil 10,100 CNY/MT (3.8) (1.0) 20.2 China No. 4 Grade Rapeseed Oil Spot Price Jiangsu
Canola Oil 58.63 USD(Cent)/pound (6.8) (7.2) 31.0 Fully Refined Canola Oil Delivered New York Spot Price USD
Sunflower Oil 11,200 UAH/metric tonne (0.9) 6.7 71.0 UkrAgroConsult Domestic Sunflower oil Price
Average (7.1) (3.4) 38.8
Oilseeds & Protein Meals
US Soybean 12.44 USD/bushel (56 lb) (10.6) (7.9) 36.1 USDA No. 1 Yellow Soybeans Spot Price/FOB Chicago Illinois
US Soy Meal 329.30 USD/short ton (9.7) (10.6) 22.4 USDA 48% Soybean Meal Rail Delivery Spot Price/Illinois
China Soybean 4,260 CNY/MT 0.0 5.2 17.4 China No. 2 Yellow Soybean Spot Price Dalian
China Soy Meal 3,120 CNY/MT (9.3) (6.6) 3.3 China Soybean Meal Spot Price Dalian
Average (7.4) (5.0) 19.8
Grains
US Rice 26.25 USD/cwt (7.1) (11.0) 6.1 USDA No. 2 Long Grain Rice Spot Price/Arkansas
Thailand Rice 511.0 USD per M/T (5.7) (5.0) 2.8 Thailand White Rice 5%
US Wheat 6.13 USD/bushel (60lb) (26.6) (16.0) 41.9 USDA No. 2 Soft Red Winter Wheat Spot Price/Chicago
Corn 6.04 USD/bushel (56 lb) (10.9) 3.1 82.2 USDA Illinois North Central No.2 Yellow Corn Spot Price
Average (12.6) (7.2) 33.3
Breakfast Commodities
Sugar 31.29 USd/pound (9.1) (13.4) 48.5 CSCE No. 11 Sugar Spot Price/Global
Cocoa 270.39 No unit (0.1) 11.0 16.7 MLCX - 01 Cocoa Spot
Tea 275 INR per kg (14.1) (26.7) (19.1) NNS Tea Darjelling price INR/kg Kolkata/India
Average (7.7) (9.7) 15.4
Others
WTI Crude Oil 97.18 USD/barrel 13.6 6.3 21.8 Bloomberg West Texas Intermediate (WTI) Cushing Crude Oil
Coal 130.85 USD/metric tonne 8.4 3.8 39.1 McCloskey Newcastle 6700 kc GAD fob Steam Coal Spot
Almonds 3.17 Eur/Kg 0.6 0.6 na Unshelled Almonds Producer Price Eur/Kg
Brazil Ethanol Fuel 0.83 USD/liter 20.6 30.4 77.6 ESALQ Brazil Ethanol Fuel Weekly Spot Price/Sao Paulo USD
Cotton 189.71 USd/pound 1.8 35.7 141.9 USDA Middling Grade Cotton Average Spot Price
Rubber 1,278.75 MYr/kilogram (25.2) (14.4) 23.2 Malaysian Rubber Board Standard Rubber No. 20 FOB
Average 3.3 10.4 60.7
Fertiliser
Urea 480 USD/MT 2.1 20.0 23.1 ICIS Pricing Ammonia Fertilizer fob Yuzhnyy Spot Price
Potash 375 USD/MT 0.0 17.2 17.2 ICIS Pricing Standard Grade MOP Potash Vancouver Spot
Phosphate 620 USD/MT 3.3 5.1 30.5 ICIS Pricing Phosphate DAP Bulk US Gulf fob Spot Price
Average 1.8 14.1 23.6
Commodity/Freight Indices
CRB Index 338.1 0.1 1.6 24.9
RBS Soft Commodity Index 145.0 (12.5) (7.8) 32.8
Baltic Dry Index 1,548.0 31.4 (12.7) (56.7)
CRB Food Index 490.9 (0.8) 11.5 39.4
S&P GSCI Agri Index 490.3 (12.3) (4.0) 59.4
Merrill Lynch Commodity Index 428.0 (1.8) (1.5) 70.6
Average 0.7 (2.1) 28.4
Overall Average (4.1) (0.7) 32.4
Note: Pricing as on 15 March 2011
Source: Bloomberg
Commodity price performance was generally negative over the past month
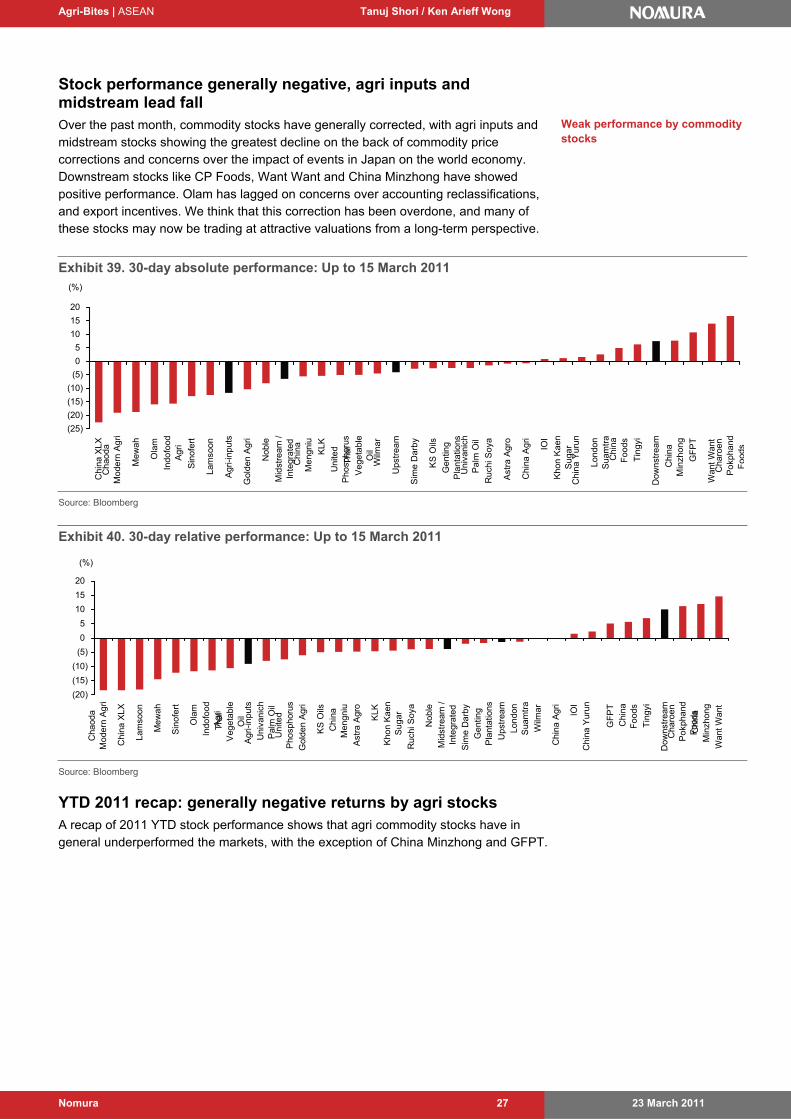
Agri-Bites | ASEAN Tanuj Shori / Ken Arieff Wong
23 March 2011 Nomura 27
Stock performance generally negative, agri inputs and midstream lead fall Over the past month, commodity stocks have generally corrected, with agri inputs and midstream stocks showing the greatest decline on the back of commodity price corrections and concerns over the impact of events in Japan on the world economy. Downstream stocks like CP Foods, Want Want and China Minzhong have showed positive performance. Olam has lagged on concerns over accounting reclassifications, and export incentives. We think that this correction has been overdone, and many of these stocks may now be trading at attractive valuations from a long-term perspective.
Exhibit 39. 30-day absolute performance: Up to 15 March 2011
(25)
(20)
(15)
(10)
(5)
0
5
10
15
20
Chi
na X
LX
Cha
oda
Mod
ern
Agr
i
Mew
ah
Ola
m
Indo
food
Agr
i
Sin
ofer
t
Lam
soon
Agr
i-inp
uts
Gol
den
Ag
ri
Nob
le
Mid
stre
am /
Inte
grat
edC
hina
Men
gniu
KLK
Uni
ted
Pho
spho
rus
Tha
iV
eget
able
Oil
Wilm
ar
Ups
trea
m
Sim
e D
arby
KS
Oils
Gen
ting
Pla
ntat
ions
Uni
vani
chP
alm
Oil
Ruc
hi S
oya
Ast
ra A
gro
Chi
na A
gri
IOI
Kho
n K
aen
Sug
arC
hina
Yur
un
Lond
onS
uam
tra
Chi
naF
oods
Tin
gyi
Dow
nstr
eam
Chi
naM
inzh
ong
GF
PT
Wan
t W
ant
Cha
roen
Pok
phan
dF
oods
(%)
Source: Bloomberg
Exhibit 40. 30-day relative performance: Up to 15 March 2011
(20)
(15)
(10)
(5)
0
5
10
15
20
Cha
oda
Mo
dern
Ag
ri
Ch
ina
XLX
Lam
soo
n
Me
wa
h
Sin
ofer
t
Ola
m
Indo
food
Agr
iT
hai
Veg
eta
ble
Oil
Ag
ri-in
puts
Uni
vani
chP
alm
Oil
Uni
ted
Pho
sph
orus
Gol
den
Agr
i
KS
Oils
Ch
ina
Men
gniu
Ast
ra A
gro
KLK
Kho
n K
aen
Sug
ar
Ru
chi S
oya
Nob
le
Mid
stre
am /
Inte
grat
ed
Sim
e D
arb
y
Ge
ntin
gP
lant
atio
ns
Up
stre
am
Lon
don
Sua
mtr
a
Wilm
ar
Chi
na
Agr
i
IOI
Chi
na Y
urun
GF
PT
Chi
naF
ood
s
Tin
gyi
Do
wns
trea
mC
haro
enP
okph
and
Foo
ds
Chi
naM
inzh
ong
Wan
t W
ant
(%)
Source: Bloomberg
YTD 2011 recap: generally negative returns by agri stocks A recap of 2011 YTD stock performance shows that agri commodity stocks have in general underperformed the markets, with the exception of China Minzhong and GFPT.
Weak performance by commodity stocks

Agri-Bites | ASEAN Tanuj Shori / Ken Arieff Wong
23 March 2011 Nomura 28
Exhibit 41. YTD 2011 absolute performance
(40)
(30)
(20)
(10)
0
10
20
30
Chi
na X
LX
KS
Oils
C
hao
daM
ode
rn A
gri
Un
ited
Ph
osph
orus
Lam
soo
n
Indo
food
Agr
i
Gol
den
Ag
ri
Ola
m
Ru
chi S
oya
T
hai
Ve
geta
ble
Oil
Ast
ra A
gro
Agr
i-in
puts
Me
wa
h
Lon
don
Sua
mtr
aU
niv
ani
chP
alm
Oil
Mid
stre
am /
Inte
grat
ed
Wilm
ar
Gen
ting
Pla
nta
tions
Ch
ina
Ag
ri
Nob
le
Ups
trea
m
KLK
Sin
ofe
rt
Chi
na Y
urun
IOI
Ch
ina
Fo
ods
Tin
gyi
Dow
nst
ream
Chi
naM
eng
niu
C
har
oen
Po
kpha
ndF
ood
s W
ant
Wa
nt
Kh
on K
aen
Sug
ar
Sim
e D
arb
y
GF
PT
Chi
naM
inzh
ong
(%)
Source: Bloomberg
Exhibit 42. YTD 2011 relative performance
(40)
(30)
(20)
(10)
0
10
20
30
40
Ch
aod
aM
oder
n A
gri
Chi
na
XLX
Lam
soon
KS
Oils
Indo
food
Agr
iU
nite
dP
hosp
horu
sT
hai
Ve
geta
ble
Oil
Go
lden
Agr
i
Ola
m
Ast
ra A
gro
Uni
vani
chP
alm
Oil
Agr
i-inp
uts
Chi
na A
gri
Lon
don
Sua
mtr
a
Ruc
hi S
oya
Gen
ting
Pla
nta
tions
Mew
ah
Mid
stre
am /
Inte
grat
ed
Sin
ofe
rt
KLK
Ch
ina
Yu
run
Wilm
ar
No
ble
Chi
na
Foo
ds
Ups
trea
m
Tin
gyi
IOI
Chi
naM
eng
niu
Wan
t W
ant
C
haro
enP
okp
han
dF
ood
s D
owns
tre
am
Kho
n K
aen
Su
gar
Sim
e D
arby
GF
PT
Chi
naM
inzh
ong
(%)
Source: Bloomberg
Consensus downgrades occur due to price correction, profit taking Overall, the Street cut its earnings estimates and price targets for most companies, pointing to a weaker environment ahead (consensus source: Bloomberg). Wilmar also saw its consensus earnings and PT cut owing to continued weak results. Conversely, Noble’s recommendation spread was upped due to bullish 4Q10 momentum.
Exhibit 43. % change in CY11F consensus EPS
(7)
(6)
(5)
(4)
(3)
(2)
(1)
0
1
2
Chi
na F
oods
Sin
ofer
t
Chi
na A
gri
Chi
na X
LX
Nob
le
Chi
na M
engn
iu
Ast
ra A
gro
Cha
oda
Mod
ern
Agr
i
Kho
n K
aen
Sug
ar
Gen
ting
Pla
ntat
ions IOI
Uni
ted
Pho
spho
rus
GF
PT
Indo
food
Agr
i
Gol
den
Agr
i
Uni
vani
ch P
alm
Oil
Lam
soon
Wilm
ar
Ola
m
Mew
ah
Ruc
hi S
oya
KS
Oils
Tha
i Veg
etab
le O
il
Wan
t Wan
t
Tin
gyi
Cha
roen
Pok
phan
d F
oods
Lond
on S
uam
tra
Chi
na Y
urun
Chi
na M
inzh
ong
KLK
Sim
e D
arby
Source: Bloomberg
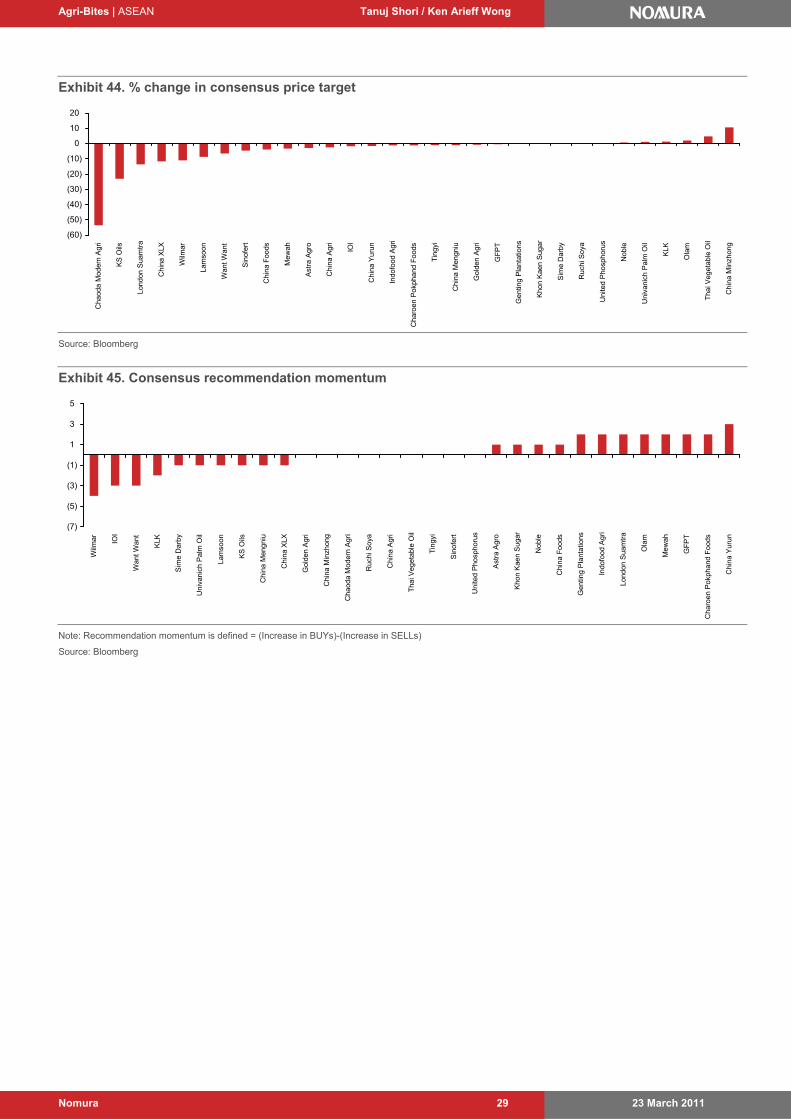
Agri-Bites | ASEAN Tanuj Shori / Ken Arieff Wong
23 March 2011 Nomura 29
Exhibit 44. % change in consensus price target
(60)
(50)
(40)
(30)
(20)
(10)
0
10
20
Cha
oda
Mod
ern
Ag
ri
KS
Oils
Lond
on S
uam
tra
Chi
na X
LX
Wilm
ar
Lam
soo
n
Wan
t Wan
t
Sin
ofer
t
Chi
na
Foo
ds
Mew
ah
Ast
ra A
gro
Chi
na A
gri
IOI
Chi
na
Yu
run
Indo
food
Agr
i
Ch
aroe
n P
okph
and
Fo
ods
Tin
gyi
Ch
ina
Men
gniu
Gol
den
Agr
i
GF
PT
Ge
ntin
g P
lant
atio
ns
Kh
on K
aen
Sug
ar
Sim
e D
arby
Ru
chi S
oya
Uni
ted
Pho
sph
orus
Nob
le
Uni
vani
ch P
alm
Oil
KLK
Ola
m
Tha
i Veg
etab
le O
il
Ch
ina
Min
zhon
g
Source: Bloomberg
Exhibit 45. Consensus recommendation momentum
(7)
(5)
(3)
(1)
1
3
5
Wilm
ar
IOI
Wan
t Wan
t
KLK
Sim
e D
arby
Uni
vani
ch P
alm
Oil
Lam
soon
KS
Oils
Chi
na M
engn
iu
Chi
na X
LX
Gol
den
Agr
i
Chi
na M
inzh
ong
Cha
oda
Mod
ern
Agr
i
Ruc
hi S
oya
Chi
na A
gri
Tha
i Veg
etab
le O
il
Tin
gyi
Sin
ofer
t
Uni
ted
Pho
spho
rus
Ast
ra A
gro
Kho
n K
aen
Sug
ar
Nob
le
Chi
na F
oods
Gen
ting
Pla
ntat
ions
Indo
food
Agr
i
Lond
on S
uam
tra
Ola
m
Mew
ah
GF
PT
Cha
roen
Pok
phan
d F
oods
Chi
na Y
urun
Note: Recommendation momentum is defined = (Increase in BUYs)-(Increase in SELLs)
Source: Bloomberg

Agri-Bites | ASEAN Tanuj Shori / Ken Arieff Wong
23 March 2011 Nomura 30
Keeping track of important news flow
Ears to the ground The following sections are designed to help investors keep abreast of important newsflow and events surrounding the key commodities and stocks under our coverage. We also present highlights of recent earnings announcements and our published research on these stocks.
Important events/news flow summary
Exhibit 46. Important events/news flow summary (Feb-March)
Sector News / event Details Source
Soybean World Soybean-Inventory Estimate Raised on Brazil Crop Outlook
World soybean inventories before the next Northern Hemisphere harvests will be larger than forecast in February because of increased production from Brazil, the U.S. Department of Agriculture said. Stockpiles will total 58.33 million metric tons at the end of the marketing year on Sept. 30, compared with 58.21 million forecast a month ago, the USDA said today in a report. Brazil will harvest 70 million tons, the department said, more than the 68.5 million projected in February.
Bloomberg
Soy, Grains Called Lower as Japan Disaster Reduces Demand
Soybean futures may trade lower on the Chicago Board of Trade on concern that the nuclear disaster in Japan will reduce demand.
Bloomberg
China 2011 Soybean Imports May Rise to 60 Million Tons
China’s soybean imports may rise to more than 60 million tons this year, the Guangzhou Daily reported today, citing Chen Xiwen, deputy head of the Central Rural Work Leading Group. Soybean prices may rise on China’s demand and U.S. farmers’ willingness to grow more corn than soybeans, the report said, citing Chen. U.S. farmers prefer planting corn because of increasing corn prices driven by ethanol fuel demand, Chen said, according to the report.
Bloomberg
Soybean Traders Increase Bets on Price Rise, CFTC Data Shows
Hedge-fund managers and other large speculators increased their net-long position in Chicago soybean futures in the week ended March 8, according to U.S. Commodity Futures Trading Commission data. Speculative long positions outnumbered short positions by 178,533 contracts on the Chicago Board of Trade, the Washington-based commission said in its Commitments of Traders report. Net-long positions rose by 13,693 contracts, or 8 percent, from a week earlier.
Bloomberg
China's soybean imports down 21% in Feb
China's General Administration of Customs announced that the country's soybean imports hit 2.32 million metric tons in February, down 21% compared with the corresponding period of last year, sources reported. The imports in February were 54.86% less than in January, according to the administration.
Bloomberg
Palm oil MPOB: Only 10 biodiesel plants operating
The government has issued 60 biodiesel manufacturing licences as at end-February 2011 but only less than one fifth has started production. Biodiesel (B5) in Malaysia is a blend of 5 per cent palm methyl ester and regular diesel. According to the Malaysian Palm Oil Board (MPOB) data, only 10 biodiesel plants were operating last year, despite some 29 biodiesel plants having been established with total production capacity of 3.37 million tonnes per year. "These plants were operating on and off, with three or four plants operating each month, due to the lack of demand for biodiesel exports and high palm oil prices in the second half of 2010," MPOB director general Datuk Dr Choo Yuen May said.
Bloomberg
Indonesia May Increase Palm-Oil Output, Exports, USDA Unit Says
Indonesia may produce 25.4 million metric tons of palm oil in the marketing year that begins Oct. 1, up from an estimated 23.6 million in the current year, a unit of the U.S. Department of Agriculture said in a report posted today on its website. Exports may rise to 19.35 million tons from an estimated 17.85 million this year, the USDA’s Foreign Agricultural Service said.
Bloomberg
Nigeria Plans to Revive Palm Oil Production, Compass Reports
Nigeria plans to revive palm oil production, from which it could earn over $50 million a year from exports, Compass newspaper reported, citing Peter Onwualu, director general of Materials Research and Development Council. Palm oil production in Nigeria is currently held back by the age of trees, predominance of wild palm grooves, erratic rainfall and poor education of farmers, the western Ogun state- based newspaper said.
Bloomberg
Call to speed up approval of foreign workers for harvest season
The Federal and Sabah state governments have been urged to quickly approve new applications of foreign workers to harvest fresh fruit bunches in the months ahead. This is to enable the industry to achieve the 17.6 million tonnes crude palm oil output target this year.
Bloomberg
Malaysia Palm Oil Output to be 17.59 Million Tons, Dompok Says
Palm oil output in Malaysia, the world’s second-biggest producer, will expand to 17.59 million metric tons this year, from 16.99 million last year, as yields improve, Malaysia Plantation & Commodities Minister Bernard Dompok said at a conference in Kuala Lumpur today.
Bloomberg
Rubber China Car Sales Growth at Slowest Pace in More Than Two Years
After the government ended vehicle-buying incentives and a week-long national holiday stymied demand, wholesales of passenger cars including multipurpose and sport-utility vehicles increased 2.6 percent from a year earlier to 967,200 units last month, the China Association of Automobile Manufacturers said today in a statement. This is the slowest pace of growth since January 2009, when car purchases fell 7.8 percent.
www.bloomberg.com
China Association To Seek To Stabilize Rubber Prices
The International Rubber Consortium (IRCo), which represents the Southeast Asian countries that produce two thirds of the world's natural rubber, will work with the China Rubber Industry Association (CRIA) to counter rubber price volatility. The CRIA made the request to work together with IRCo so as to reduce price volatility. They will be coming up with a joint work plan in the future. They said they were suffering due to record high rubber prices earlier. China is the world's largest natural rubber consumer and importer. IRCo is comprised of Thailand, Indonesia and Malaysia, which together account for 70% of global natural rubber output.
The Wall Street Journal
IRSG forecast world rubber demand to reach 26.1mn tones in 2011F and 27.5mn tones in 2012F
International Rubber Study Group (IRSG) reported on 11 March 2011 that global rubber demand is forecast to reach 26.1 million tons in 2011 and 27.5 million tons in 2012. Global SR demand is expected to grow by 8.6% in 2011 and 6.4% in 2012, while global NR demand is forecast to rise by 4.6% in 2011 and 3.8% in 2012. Partly due to the impact of higher prices, and assuming normal growing conditions, global NR production is forecast to rise by 6.2% in 2011 and 6.5% in 2012.
www. rubberstudy.com
Thailand’s Deputy Prime Minister has ordered a
Thailand’s Deputy Prime Minister and chairman of the National Rubber Policy Committee Suthep Thaugsuban said he has ordered a temporary halt to rubber exports until the price
Bangkok Post
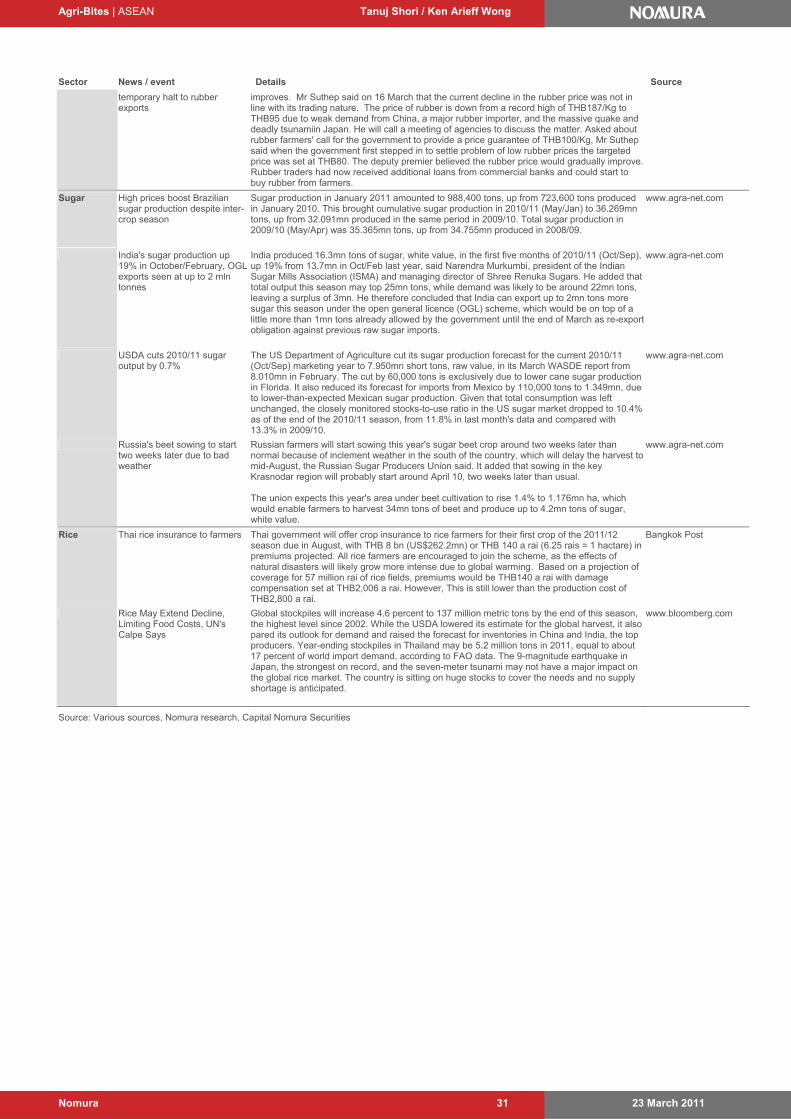
Agri-Bites | ASEAN Tanuj Shori / Ken Arieff Wong
23 March 2011 Nomura 31
Sector News / event Details Source
temporary halt to rubber exports
improves. Mr Suthep said on 16 March that the current decline in the rubber price was not in line with its trading nature. The price of rubber is down from a record high of THB187/Kg to THB95 due to weak demand from China, a major rubber importer, and the massive quake and deadly tsunamiin Japan. He will call a meeting of agencies to discuss the matter. Asked about rubber farmers' call for the government to provide a price guarantee of THB100/Kg, Mr Suthep said when the government first stepped in to settle problem of low rubber prices the targeted price was set at THB80. The deputy premier believed the rubber price would gradually improve. Rubber traders had now received additional loans from commercial banks and could start to buy rubber from farmers.
Sugar High prices boost Brazilian sugar production despite inter-crop season
Sugar production in January 2011 amounted to 988,400 tons, up from 723,600 tons produced in January 2010. This brought cumulative sugar production in 2010/11 (May/Jan) to 36.269mn tons, up from 32.091mn produced in the same period in 2009/10. Total sugar production in 2009/10 (May/Apr) was 35.365mn tons, up from 34.755mn produced in 2008/09.
www.agra-net.com
India's sugar production up 19% in October/February, OGL exports seen at up to 2 mln tonnes
India produced 16.3mn tons of sugar, white value, in the first five months of 2010/11 (Oct/Sep), up 19% from 13.7mn in Oct/Feb last year, said Narendra Murkumbi, president of the Indian Sugar Mills Association (ISMA) and managing director of Shree Renuka Sugars. He added that total output this season may top 25mn tons, while demand was likely to be around 22mn tons, leaving a surplus of 3mn. He therefore concluded that India can export up to 2mn tons more sugar this season under the open general licence (OGL) scheme, which would be on top of a little more than 1mn tons already allowed by the government until the end of March as re-export obligation against previous raw sugar imports.
www.agra-net.com
USDA cuts 2010/11 sugar output by 0.7%
The US Department of Agriculture cut its sugar production forecast for the current 2010/11 (Oct/Sep) marketing year to 7.950mn short tons, raw value, in its March WASDE report from 8.010mn in February. The cut by 60,000 tons is exclusively due to lower cane sugar production in Florida. It also reduced its forecast for imports from Mexico by 110,000 tons to 1.349mn, due to lower-than-expected Mexican sugar production. Given that total consumption was left unchanged, the closely monitored stocks-to-use ratio in the US sugar market dropped to 10.4% as of the end of the 2010/11 season, from 11.8% in last month's data and compared with 13.3% in 2009/10.
www.agra-net.com
Russia's beet sowing to start two weeks later due to bad weather
Russian farmers will start sowing this year's sugar beet crop around two weeks later than normal because of inclement weather in the south of the country, which will delay the harvest to mid-August, the Russian Sugar Producers Union said. It added that sowing in the key Krasnodar region will probably start around April 10, two weeks later than usual. The union expects this year's area under beet cultivation to rise 1.4% to 1.176mn ha, which would enable farmers to harvest 34mn tons of beet and produce up to 4.2mn tons of sugar, white value.
www.agra-net.com
Rice Thai rice insurance to farmers Thai government will offer crop insurance to rice farmers for their first crop of the 2011/12 season due in August, with THB 8 bn (US$262.2mn) or THB 140 a rai (6.25 rais = 1 hactare) in premiums projected. All rice farmers are encouraged to join the scheme, as the effects of natural disasters will likely grow more intense due to global warming. Based on a projection of coverage for 57 million rai of rice fields, premiums would be THB140 a rai with damage compensation set at THB2,006 a rai. However, This is still lower than the production cost of THB2,800 a rai.
Bangkok Post
Rice May Extend Decline, Limiting Food Costs, UN's Calpe Says
Global stockpiles will increase 4.6 percent to 137 million metric tons by the end of this season, the highest level since 2002. While the USDA lowered its estimate for the global harvest, it also pared its outlook for demand and raised the forecast for inventories in China and India, the top producers. Year-ending stockpiles in Thailand may be 5.2 million tons in 2011, equal to about 17 percent of world import demand, according to FAO data. The 9-magnitude earthquake in Japan, the strongest on record, and the seven-meter tsunami may not have a major impact on the global rice market. The country is sitting on huge stocks to cover the needs and no supply shortage is anticipated.
www.bloomberg.com
Source: Various sources, Nomura research, Capital Nomura Securities

Agri-Bites | ASEAN Tanuj Shori / Ken Arieff Wong
23 March 2011 Nomura 32
Company news flow summary
Exhibit 47. Company news flow summary
Sector News / Event Nomura comment Source
Wilmar Wilmar International Begins Offer for Stock in Ghana’s Benso Oil
Wilmar International Ltd., the world’s biggest palm-oil processor, said it commenced an offer to buy all 34.8 million shares Benso Oil Palm Plantation Ltd. of Ghana at 83 pesewas per share. The offer, which is on behalf of its wholly-owned subsidiary Wilmar Africa Ltd., ends on March 22, the Singapore- based company said in a statement published in the Daily Graphic newspaper today.
Bloomberg
Olam Olam to Boost Financial Commodity Unit With ‘Half Dozen Funds’
Olam International Ltd., among the world’s three biggest suppliers of rice and cotton, plans to expand a pilot fund that invests in commodities more than fourfold and add about six new investment vehicles. Using its markets knowledge as supplier of more than 20 raw materials, the Singapore-based trader will grow its Ektimo Commodity Relative Value Fund LP to $250 million from $60 million currently, Olam Chief Executive Officer Sunny Verghese said in an interview. “Tailor-made” commodity funds will follow, he said.
Bloomberg
Noble Raised US$500mn in new equity
Noble Group raised US$500mn in new equity in a share placement, with CIC investing pro-rata stake.
Bloomberg
Sime Darby Sime Hasn’t Signed Agreement to Invest in Oil Palm in Cameroon
Sime Darby Bhd. hasn’t signed any agreement to invest in an oil palm plantation in Cameroon, the Malaysian company said in a statement. “The company does from time to time explore investment opportunities relating to its core businesses as part of the continuous expansion plan of the group,” Sime said.
Press release
KLK KLK drops plans to issue US$200m bonds
KUALA Lumpur Kepong Bhd (KLK) has dropped plans to issue US$300 million (RM912 million) bonds based on the company's current financial condition. KLK feels it no longer requires the planned US$300 million, five-year unsecured guaranteed exchangeable bonds with an over- allotment option to increase the issue by US$100 million (RM304 million).
Bloomberg
Ruchi Soya Ruchi Group lines up $150mn for overseas expansion
In tune with Indian corporates looking abroad to source their raw material needs abroad, Indore-based Ruchi Group plans to grow oil palm in Cambodia. The group has signed a memorandum of understanding with Phnom Penh for this and, initially, oil palm will be cultivated in 20,000 hectares, a company official said. Ruchi Group plans a total investment of $150 million in the next three years to expand globally, while in the country, it plans to spend Rs 80-100 crore for expansion. In Ethiopia, Ruchi has cultivated soyabean on a pilot basis and the result has been good. It plans commercial cultivation of soyabean on 25,000 hectares there. During the pilot project, the yield was two tonnes a hectare.
BusinessLine
Thailand’s agro and food companies
Impact from Japan earthquake Positive for CPF, GFPT and TUF: Survivors of Japan's devastating earthquake and tsunami began to hoard ready-to-eat food. In the short term, this should be positive for CPF (NEUTRAL), GFPT (BUY) and TUF (BUY) as their exports to Japan are expected to account for 5%, 17% and 12% of their total sales for FY2011F, respectively. Negative for STA: If the destructive earthquake and tsunami were to severely affect Japan’s economic growth, STA (NEUTRAL) would be hit hardest, in our view, among agro-and-food companies under CNS as its customers in the automobile industry in Japan that contributes to around 10% of its total sales in FY2011F may delay their orders.
Capital Nomura Securities
Source: Various sources, Nomura research, Capital Nomura Securities

Agri-Bites | ASEAN Tanuj Shori / Ken Arieff Wong
23 March 2011 Nomura 33
Highlights of our published research
Exhibit 48. Recently published research
Date Title Link
10-Mar MPOB Feb 2011 data http://www.nomura.com/research/getpub.aspx?pid=423903
9-Mar Palm Oil Conference 2011 http://www.nomura.com/research/getpub.aspx?pid=423559
8-Mar Genting Plantations: Initiate with BUY: Best of both worlds http://www.nomura.com/research/getpub.aspx?pid=423434
4-Mar Noble: Management meet quick feed http://www.nomura.com/research/getpub.aspx?pid=422947
4-Mar Glencore results readacross http://www.nomura.com/research/getpub.aspx?pid=422844
3-Mar Sime Darby: Plantation estate visit http://www.nomura.com/research/getpub.aspx?pid=422758
3-Mar Noble: The investment grade debate http://www.nomura.com/research/getpub.aspx?pid=422703
1-Mar Noble: The earnings home run http://www.nomura.com/research/getpub.aspx?pid=422078
1-Mar Noble: Earnings hit a home run http://www.nomura.com/research/getpub.aspx?pid=422063
28-Feb Golden Agri: 4Q10 results http://www.nomura.com/research/getpub.aspx?pid=421988
25-Feb IFAR: 4Q10 results http://www.nomura.com/research/getpub.aspx?pid=421568
25-Feb Mewah: 4Q10 results http://www.nomura.com/research/getpub.aspx?pid=421457
24-Feb Lonsum: 4Q10 results http://www.nomura.com/research/getpub.aspx?pid=421426
24-Feb Astra Agro: 4Q10 results http://www.nomura.com/research/getpub.aspx?pid=421425
24-Feb Sime Darby: 2Q11 results http://www.nomura.com/research/getpub.aspx?pid=421424
24-Feb Wilmar: 4Q120 results http://www.nomura.com/research/getpub.aspx?pid=421167
24-Feb KLK: 1Q11 results http://www.nomura.com/research/getpub.aspx?pid=421164
23-Feb Olam: Olam’s defense appears convincing, BUY http://www.nomura.com/research/getpub.aspx?pid=421136
16-Feb IOI: 2Q11 results http://www.nomura.com/research/getpub.aspx?pid=419830
16-Feb Noble: GCL’s 1H11 results a sign of good times to come http://www.nomura.com/research/getpub.aspx?pid=419704
14-Feb Olam: Operationally strong, dilution risk http://www.nomura.com/research/getpub.aspx?pid=419284
14-Feb Sime Darby sued for US$200mn http://www.nomura.com/research/getpub.aspx?pid=419258
11-Feb KS Oils: 3Q11 inline http://www.nomura.com/research/getpub.aspx?pid=418777
10-Feb MPOB Jan 2011 data http://www.nomura.com/research/getpub.aspx?pid=418551
9-Feb Palm Oil: This CPO party is far from over http://www.nomura.com/research/getpub.aspx?pid=418208
4-Feb Noble: Earnings power of the network http://www.nomura.com/research/getpub.aspx?pid=417292
31-Jan Egypt unrest a negative risk for palm oil exports from Malaysia http://www.nomura.com/research/getpub.aspx?pid=415630
28-Jan Sime Darby: Caterpillar FY10 earnings beat estimates http://www.nomura.com/research/getpub.aspx?pid=415488
20-Jan Palm Oil: Still bullish on palm oil http://www.nomura.com/research/getpub.aspx?pid=413275
18-Jan Ruchi Soya: 3Q11 results http://www.nomura.com/research/getpub.aspx?pid=412985
12-Jan ASEAN Agri-Bites: 2011: Another good year in reckoning http://www.nomura.com/research/getpub.aspx?pid=411812
10-Jan MPOB Dec 2010 data http://www.nomura.com/research/getpub.aspx?pid=411452
10-Jan Wilmar: NEUTRAL from Buy, profits aren’t everything http://www.nomura.com/research/getpub.aspx?pid=411433
20-Dec Noble: US$950mn acquisition of Brazil sugarcane mills http://www.nomura.com/research/getpub.aspx?pid=409435
15-Dec Olam: Acquisition of tt Timber http://www.nomura.com/research/getpub.aspx?pid=408760
15-Dec London Sumatra: Initiation: Cheapest planter in coverage http://www.nomura.com/research/getpub.aspx?pid=408527
10-Dec MPOB Nov stats http://www.nomura.com/research/getpub.aspx?pid=407976
8-Dec IFAR: Places 8% of Lonsum http://www.nomura.com/research/getpub.aspx?pid=407531
7-Dec Mewah: Initiation: The price and space are right http://www.nomura.com/research/getpub.aspx?pid=407271
3-Dec Olam: US$200mn sugar refinery in Nigeria http://www.nomura.com/research/getpub.aspx?pid=406842
2-Dec Wilmar: Acquisition of 20% of PPB’s flour business http://www.nomura.com/research/getpub.aspx?pid=406598
30-Nov Palm Oil 3Q10 result wrap http://www.nomura.com/research/getpub.aspx?pid=406074
29-Nov KLK: 4Q10 results http://www.nomura.com/research/getpub.aspx?pid=405786
26-Nov Sime Darby: 1Q11 results http://www.nomura.com/research/getpub.aspx?pid=405464
24-Nov KS Oils: 2Q11 results http://www.nomura.com/research/getpub.aspx?pid=405065
23-Nov ASEAN Soft commodities: marketing feedback http://www.nomura.com/research/getpub.aspx?pid=404867
18-Nov IOI: 1Q11 results http://www.nomura.com/research/getpub.aspx?pid=404216
18-Nov Olam: The African safari continues http://www.nomura.com/research/getpub.aspx?pid=403987
17-Nov Sime Darby: An eventful AGM http://www.nomura.com/research/getpub.aspx?pid=403951
17-Nov Palm Oil: Biofuel storage demand down? http://www.nomura.com/research/getpub.aspx?pid=403735
14-Nov Olam: US$1.54bn investment in urea and palm http://www.nomura.com/research/getpub.aspx?pid=403006
11-Nov Olam 1Q10 results http://www.nomura.com/research/getpub.aspx?pid=402630
11-Nov GGR 3Q10 results http://www.nomura.com/research/getpub.aspx?pid=402532
10-Nov Wilmar: 3Q10 results http://www.nomura.com/research/getpub.aspx?pid=402320
Source: Nomura research
Agri-Bites | ASEAN Tanuj Shori / Ken Arieff Wong
23 March 2011 Nomura 34
Macro data metrics on palm oil, soy and grains
Commodity snippets In this section, we closely monitor macro data changes for key commodities such as palm oil, soybean, soy meal, soy oil, rice, wheat, corn, rubber and sugar. Please note that we primarily refer to the USDA and Malaysian Palm Oil Board (MPOB) in tracking metrics changes.
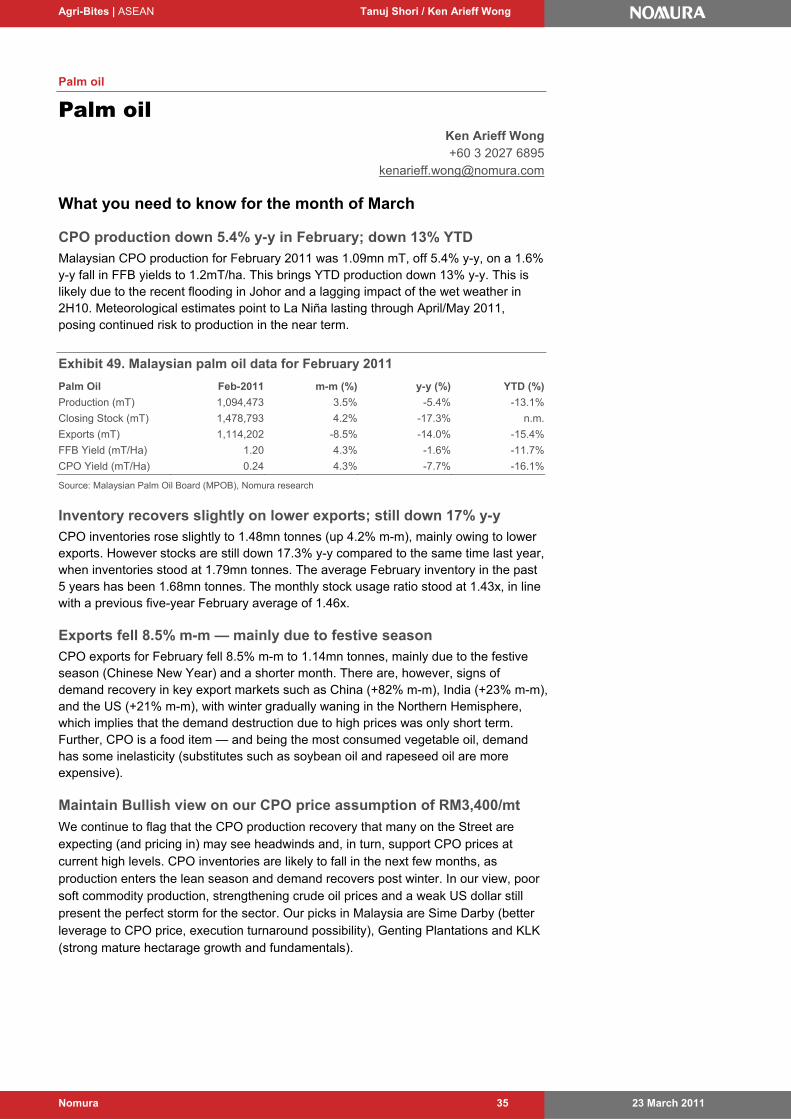
Agri-Bites | ASEAN Tanuj Shori / Ken Arieff Wong
23 March 2011 Nomura 35
Palm oil
Palm oil Ken Arieff Wong +60 3 2027 6895
What you need to know for the month of March
CPO production down 5.4% y-y in February; down 13% YTD
Malaysian CPO production for February 2011 was 1.09mn mT, off 5.4% y-y, on a 1.6% y-y fall in FFB yields to 1.2mT/ha. This brings YTD production down 13% y-y. This is likely due to the recent flooding in Johor and a lagging impact of the wet weather in 2H10. Meteorological estimates point to La Niña lasting through April/May 2011, posing continued risk to production in the near term.
Exhibit 49. Malaysian palm oil data for February 2011
Palm Oil Feb-2011 m-m (%) y-y (%) YTD (%)
Production (mT) 1,094,473 3.5% -5.4% -13.1%
Closing Stock (mT) 1,478,793 4.2% -17.3% n.m.
Exports (mT) 1,114,202 -8.5% -14.0% -15.4%
FFB Yield (mT/Ha) 1.20 4.3% -1.6% -11.7%
CPO Yield (mT/Ha) 0.24 4.3% -7.7% -16.1%
Source: Malaysian Palm Oil Board (MPOB), Nomura research
Inventory recovers slightly on lower exports; still down 17% y-y
CPO inventories rose slightly to 1.48mn tonnes (up 4.2% m-m), mainly owing to lower exports. However stocks are still down 17.3% y-y compared to the same time last year, when inventories stood at 1.79mn tonnes. The average February inventory in the past 5 years has been 1.68mn tonnes. The monthly stock usage ratio stood at 1.43x, in line with a previous five-year February average of 1.46x.
Exports fell 8.5% m-m — mainly due to festive season
CPO exports for February fell 8.5% m-m to 1.14mn tonnes, mainly due to the festive season (Chinese New Year) and a shorter month. There are, however, signs of demand recovery in key export markets such as China (+82% m-m), India (+23% m-m), and the US (+21% m-m), with winter gradually waning in the Northern Hemisphere, which implies that the demand destruction due to high prices was only short term. Further, CPO is a food item — and being the most consumed vegetable oil, demand has some inelasticity (substitutes such as soybean oil and rapeseed oil are more expensive).
Maintain Bullish view on our CPO price assumption of RM3,400/mt
We continue to flag that the CPO production recovery that many on the Street are expecting (and pricing in) may see headwinds and, in turn, support CPO prices at current high levels. CPO inventories are likely to fall in the next few months, as production enters the lean season and demand recovers post winter. In our view, poor soft commodity production, strengthening crude oil prices and a weak US dollar still present the perfect storm for the sector. Our picks in Malaysia are Sime Darby (better leverage to CPO price, execution turnaround possibility), Genting Plantations and KLK (strong mature hectarage growth and fundamentals).

Agri-Bites | ASEAN Tanuj Shori / Ken Arieff Wong
23 March 2011 Nomura 36
Exhibit 50. Malaysian palm oil ending stock up 4.2% m-m in February 2011
0.6
0.8
1.0
1.2
1.4
1.6
1.8
2.0
2.2
2.4
Jan-
00
Jul-0
0
Jan-
01
Jul-0
1
Jan-
02
Jul-0
2
Jan-
03
Jul-0
3
Jan-
04
Jul-0
4
Jan-
05
Jul-0
5
Jan-
06
Jul-0
6
Jan-
07
Jul-0
7
Jan-
08
Jul-0
8
Jan-
09
Jul-0
9
Jan-
10
Jul-1
0
Jan-
11
500
1,000
1,500
2,000
2,500
3,000
3,500
4,000
4,500Ending stock (LHS) CPO price (RHS) (RM per tonne)(mn tonnes)
Source: Malaysian Palm Oil Board (MPOB), Bloomberg, Nomura research
Exhibit 51. Malaysian FFB yields, down 1.6% y-y in February 2011
0.0
0.5
1.0
1.5
2.0
2.5
Jan-
06
Ap
r-06
Jul-0
6
Oct
-06
Jan-
07
Ap
r-07
Jul-0
7
Oct
-07
Jan-
08
Ap
r-08
Jul-0
8
Oct
-08
Jan-
09
Ap
r-09
Jul-0
9
Oct
-09
Jan-
10
Ap
r-10
Jul-1
0
Oct
-10
Jan-
11
FFB Yield (tonne/ha)
Source: Malaysian Palm Oil Board (MPOB), Nomura research
Exhibit 52. Malaysian palm oil exports down 8.5% m-m in February 2011
0
200,000
400,000
600,000
800,000
1,000,000
1,200,000
1,400,000
1,600,000
1,800,000
Jan-
06
May
-06
Se
p-06
Jan-
07
May
-07
Se
p-07
Jan-
08
May
-08
Se
p-08
Jan-
09
May
-09
Se
p-09
Jan-
10
May
-10
Se
p-10
Jan-
11
Total Palm Oil Exports (tonne)
Source: Malaysian Palm Oil Board (MPOB), Nomura research
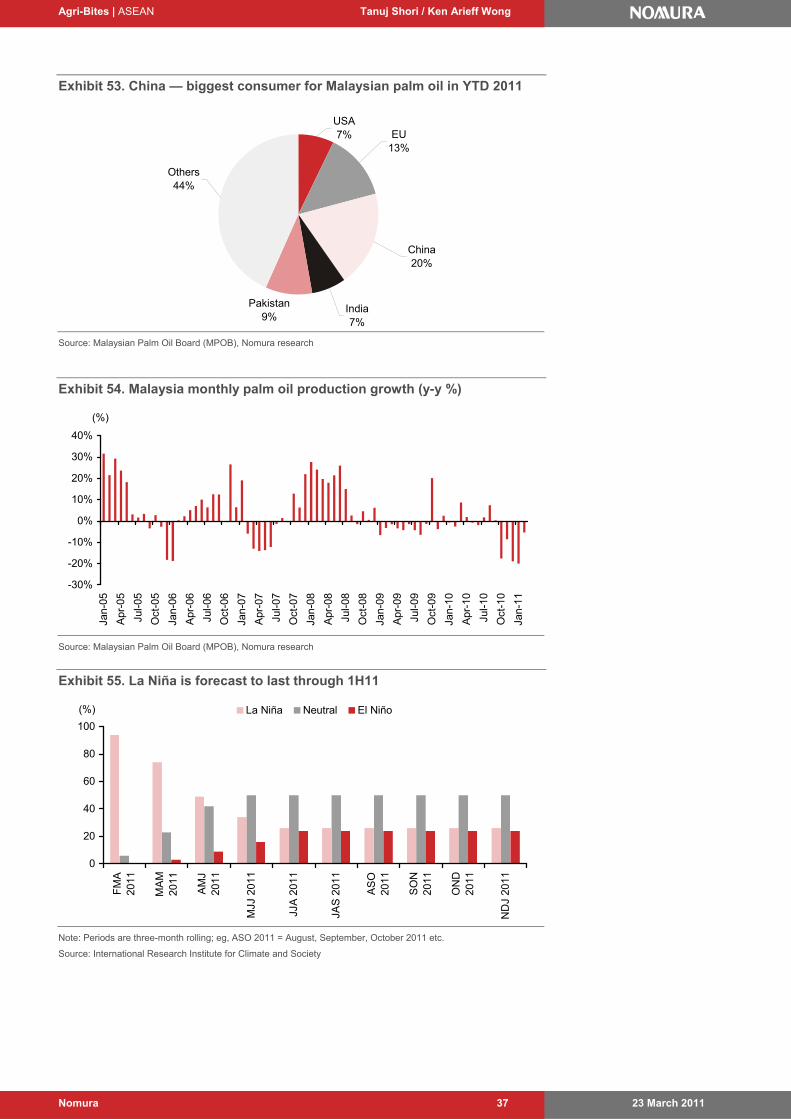
Agri-Bites | ASEAN Tanuj Shori / Ken Arieff Wong
23 March 2011 Nomura 37
Exhibit 53. China — biggest consumer for Malaysian palm oil in YTD 2011
USA7% EU
13%
China20%
India7%
Pakistan9%
Others44%
Source: Malaysian Palm Oil Board (MPOB), Nomura research
Exhibit 54. Malaysia monthly palm oil production growth (y-y %)
-30%
-20%
-10%
0%
10%
20%
30%
40%
Jan-
05
Apr
-05
Jul-0
5
Oct
-05
Jan-
06
Apr
-06
Jul-0
6
Oct
-06
Jan-
07
Apr
-07
Jul-0
7
Oct
-07
Jan-
08
Apr
-08
Jul-0
8
Oct
-08
Jan-
09
Apr
-09
Jul-0
9
Oct
-09
Jan-
10
Apr
-10
Jul-1
0
Oct
-10
Jan-
11
(%)
Source: Malaysian Palm Oil Board (MPOB), Nomura research
Exhibit 55. La Niña is forecast to last through 1H11
0
20
40
60
80
100
FM
A20
11
MA
M20
11
AM
J20
11
MJJ
201
1
JJA
201
1
JAS
201
1
AS
O20
11
SO
N20
11
ON
D20
11
ND
J 20
11
La Niña Neutral El Niño(%)
Note: Periods are three-month rolling; eg, ASO 2011 = August, September, October 2011 etc.
Source: International Research Institute for Climate and Society
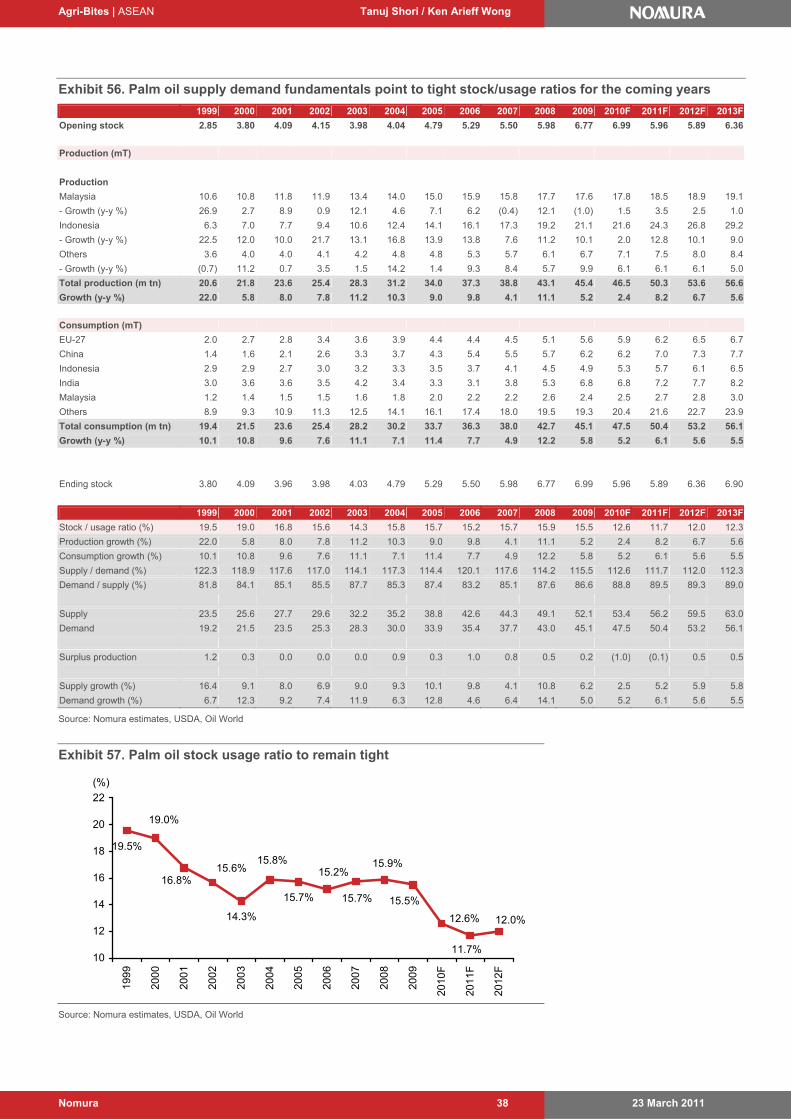
Agri-Bites | ASEAN Tanuj Shori / Ken Arieff Wong
23 March 2011 Nomura 38
Exhibit 56. Palm oil supply demand fundamentals point to tight stock/usage ratios for the coming years
1999 2000 2001 2002 2003 2004 2005 2006 2007 2008 2009 2010F 2011F 2012F 2013F
Opening stock 2.85 3.80 4.09 4.15 3.98 4.04 4.79 5.29 5.50 5.98 6.77 6.99 5.96 5.89 6.36
Production (mT)
Production
Malaysia 10.6 10.8 11.8 11.9 13.4 14.0 15.0 15.9 15.8 17.7 17.6 17.8 18.5 18.9 19.1
- Growth (y-y %) 26.9 2.7 8.9 0.9 12.1 4.6 7.1 6.2 (0.4) 12.1 (1.0) 1.5 3.5 2.5 1.0
Indonesia 6.3 7.0 7.7 9.4 10.6 12.4 14.1 16.1 17.3 19.2 21.1 21.6 24.3 26.8 29.2
- Growth (y-y %) 22.5 12.0 10.0 21.7 13.1 16.8 13.9 13.8 7.6 11.2 10.1 2.0 12.8 10.1 9.0
Others 3.6 4.0 4.0 4.1 4.2 4.8 4.8 5.3 5.7 6.1 6.7 7.1 7.5 8.0 8.4
- Growth (y-y %) (0.7) 11.2 0.7 3.5 1.5 14.2 1.4 9.3 8.4 5.7 9.9 6.1 6.1 6.1 5.0
Total production (m tn) 20.6 21.8 23.6 25.4 28.3 31.2 34.0 37.3 38.8 43.1 45.4 46.5 50.3 53.6 56.6
Growth (y-y %) 22.0 5.8 8.0 7.8 11.2 10.3 9.0 9.8 4.1 11.1 5.2 2.4 8.2 6.7 5.6
Consumption (mT)
EU-27 2.0 2.7 2.8 3.4 3.6 3.9 4.4 4.4 4.5 5.1 5.6 5.9 6.2 6.5 6.7
China 1.4 1.6 2.1 2.6 3.3 3.7 4.3 5.4 5.5 5.7 6.2 6.2 7.0 7.3 7.7
Indonesia 2.9 2.9 2.7 3.0 3.2 3.3 3.5 3.7 4.1 4.5 4.9 5.3 5.7 6.1 6.5
India 3.0 3.6 3.6 3.5 4.2 3.4 3.3 3.1 3.8 5.3 6.8 6.8 7.2 7.7 8.2
Malaysia 1.2 1.4 1.5 1.5 1.6 1.8 2.0 2.2 2.2 2.6 2.4 2.5 2.7 2.8 3.0
Others 8.9 9.3 10.9 11.3 12.5 14.1 16.1 17.4 18.0 19.5 19.3 20.4 21.6 22.7 23.9
Total consumption (m tn) 19.4 21.5 23.6 25.4 28.2 30.2 33.7 36.3 38.0 42.7 45.1 47.5 50.4 53.2 56.1
Growth (y-y %) 10.1 10.8 9.6 7.6 11.1 7.1 11.4 7.7 4.9 12.2 5.8 5.2 6.1 5.6 5.5
Ending stock 3.80 4.09 3.96 3.98 4.03 4.79 5.29 5.50 5.98 6.77 6.99 5.96 5.89 6.36 6.90
1999 2000 2001 2002 2003 2004 2005 2006 2007 2008 2009 2010F 2011F 2012F 2013F
Stock / usage ratio (%) 19.5 19.0 16.8 15.6 14.3 15.8 15.7 15.2 15.7 15.9 15.5 12.6 11.7 12.0 12.3
Production growth (%) 22.0 5.8 8.0 7.8 11.2 10.3 9.0 9.8 4.1 11.1 5.2 2.4 8.2 6.7 5.6
Consumption growth (%) 10.1 10.8 9.6 7.6 11.1 7.1 11.4 7.7 4.9 12.2 5.8 5.2 6.1 5.6 5.5
Supply / demand (%) 122.3 118.9 117.6 117.0 114.1 117.3 114.4 120.1 117.6 114.2 115.5 112.6 111.7 112.0 112.3
Demand / supply (%) 81.8 84.1 85.1 85.5 87.7 85.3 87.4 83.2 85.1 87.6 86.6 88.8 89.5 89.3 89.0
Supply 23.5 25.6 27.7 29.6 32.2 35.2 38.8 42.6 44.3 49.1 52.1 53.4 56.2 59.5 63.0
Demand 19.2 21.5 23.5 25.3 28.3 30.0 33.9 35.4 37.7 43.0 45.1 47.5 50.4 53.2 56.1
Surplus production 1.2 0.3 0.0 0.0 0.0 0.9 0.3 1.0 0.8 0.5 0.2 (1.0) (0.1) 0.5 0.5
Supply growth (%) 16.4 9.1 8.0 6.9 9.0 9.3 10.1 9.8 4.1 10.8 6.2 2.5 5.2 5.9 5.8
Demand growth (%) 6.7 12.3 9.2 7.4 11.9 6.3 12.8 4.6 6.4 14.1 5.0 5.2 6.1 5.6 5.5
Source: Nomura estimates, USDA, Oil World
Exhibit 57. Palm oil stock usage ratio to remain tight
19.5%
14.3%
15.7%
15.9%15.8%
19.0%
16.8%15.6% 15.2%
15.7% 15.5%
12.6%
11.7%
12.0%
% 10
% 12
% 14
% 16
% 18
% 20
% 22
199
9
200
0
200
1
200
2
200
3
200
4
200
5
200
6
200
7
200
8
200
9
2010
F
2011
F
2012
F
(%)
Source: Nomura estimates, USDA, Oil World
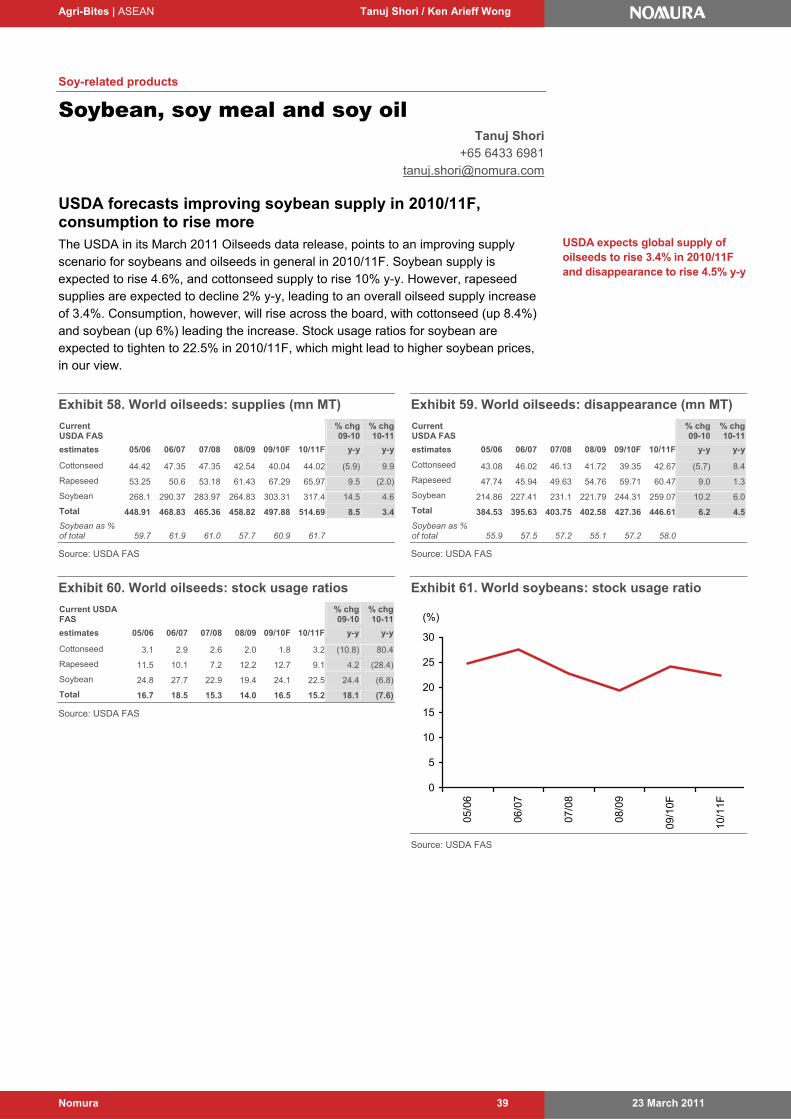
Agri-Bites | ASEAN Tanuj Shori / Ken Arieff Wong
23 March 2011 Nomura 39
Soy-related products
Soybean, soy meal and soy oil Tanuj Shori
+65 6433 6981 [email protected]
USDA forecasts improving soybean supply in 2010/11F, consumption to rise more The USDA in its March 2011 Oilseeds data release, points to an improving supply scenario for soybeans and oilseeds in general in 2010/11F. Soybean supply is expected to rise 4.6%, and cottonseed supply to rise 10% y-y. However, rapeseed supplies are expected to decline 2% y-y, leading to an overall oilseed supply increase of 3.4%. Consumption, however, will rise across the board, with cottonseed (up 8.4%) and soybean (up 6%) leading the increase. Stock usage ratios for soybean are expected to tighten to 22.5% in 2010/11F, which might lead to higher soybean prices, in our view.
Exhibit 58. World oilseeds: supplies (mn MT)
Current USDA FAS
% chg 09-10
% chg 10-11
estimates 05/06 06/07 07/08 08/09 09/10F 10/11F y-y y-y
Cottonseed 44.42 47.35 47.35 42.54 40.04 44.02 (5.9) 9.9
Rapeseed 53.25 50.6 53.18 61.43 67.29 65.97 9.5 (2.0)
Soybean 268.1 290.37 283.97 264.83 303.31 317.4 14.5 4.6
Total 448.91 468.83 465.36 458.82 497.88 514.69 8.5 3.4
Soybean as % of total 59.7 61.9 61.0 57.7 60.9 61.7 Source: USDA FAS
Exhibit 59. World oilseeds: disappearance (mn MT)
Current USDA FAS
% chg 09-10
% chg 10-11
estimates 05/06 06/07 07/08 08/09 09/10F 10/11F y-y y-y
Cottonseed 43.08 46.02 46.13 41.72 39.35 42.67 (5.7) 8.4
Rapeseed 47.74 45.94 49.63 54.76 59.71 60.47 9.0 1.3
Soybean 214.86 227.41 231.1 221.79 244.31 259.07 10.2 6.0
Total 384.53 395.63 403.75 402.58 427.36 446.61 6.2 4.5
Soybean as % of total 55.9 57.5 57.2 55.1 57.2 58.0 Source: USDA FAS
Exhibit 60. World oilseeds: stock usage ratios
Current USDA FAS
% chg 09-10
% chg 10-11
estimates 05/06 06/07 07/08 08/09 09/10F 10/11F y-y y-y
Cottonseed 3.1 2.9 2.6 2.0 1.8 3.2 (10.8) 80.4
Rapeseed 11.5 10.1 7.2 12.2 12.7 9.1 4.2 (28.4)
Soybean 24.8 27.7 22.9 19.4 24.1 22.5 24.4 (6.8)
Total 16.7 18.5 15.3 14.0 16.5 15.2 18.1 (7.6) Source: USDA FAS
Exhibit 61. World soybeans: stock usage ratio
0
5
10
15
20
25
30
05/0
6
06/0
7
07/0
8
08/0
9
09/1
0F
10/1
1F
(%)
Source: USDA FAS
USDA expects global supply of oilseeds to rise 3.4% in 2010/11F and disappearance to rise 4.5% y-y

Agri-Bites | ASEAN Tanuj Shori / Ken Arieff Wong
23 March 2011 Nomura 40
World protein meal supply to grow in tandem with disappearance; vegetable oil disappearance to outpace supply growth The USDA forecasts world protein meal supplies will increase by 6.5% in 2010/11F, which is equal to expected disappearance growth of 6.5%, leading to steady stock usage ratios of 3% in 2010/11F. Soybean meal stock usage ratios are expected to stay steady in 2010/11F, suggesting that meal prices might remain benign during that time period. Soybean oil prices are expected to however rise, owing to a lower SU ratio of 6.2% in 2010/11F vs 7.9% in 2009/10F, due to demand outpacing supply.
The USDA expects the SU ratio for palm oil to tighten from 12.6% in 2008/09 to 10% in 2009/10F and 6.8% in 2010/11F. This is in line with our view that CPO supply will likely remain tight, and this might support CPO prices at the current high levels, with production not growing at rates envisaged earlier.
Exhibit 62. World protein meals: supplies (mn MT)
Current USDA FAS
% chg 09-10
% chg 10-11
estimates 05/06 06/07 07/08 08/09 09/10F 10/11F y-y y-y
Cottonseed 14.78 15.6 15.87 14.59 14.03 15.05 (3.8) 7.3
Rapeseed 27.03 26.51 27.88 31.08 33.9 34.35 9.1 1.3
Soybean 152.23 160.18 165.04 158.65 170.49 184.55 7.5 8.2
Total 224.33 232.25 239.1 237.14 250.45 266.75 5.6 6.5
Soybeans as % of total 67.9 69.0 69.0 66.9 68.1 69.2 Source: USDA FAS
Exhibit 63. World protein meals: disappearance (mn MT)
Current USDA FAS
% chg 09-10
% chg 10-11
estimates 05/06 06/07 07/08 08/09 09/10F 10/11F y-y y-y
Cottonseed 14.51 15.38 15.72 14.48 13.87 14.89 (4.2) 7.4
Rapeseed 26.43 26.27 27.63 30.84 33.67 34.07 9.2 1.2
Soybean 145.93 153.5 158.68 153.44 164.58 178.13 7.3 8.2
Total 216.26 224.3 231.41 230.46 243.2 259 5.5 6.5
Soybeans as % of total 67.5 68.4 68.6 66.6 67.7 68.8 Source: USDA FAS
Exhibit 64. World protein meals: stock usage ratios
Current USDA FAS
% chg 09-10
% chg 10-11
estimates 05/06 06/07 07/08 08/09 09/10F 10/11F y-y y-y
Cottonseed 1.9 1.4 1.0 0.8 1.2 1.1 51.9 (6.9)
Rapeseed 2.3 0.9 0.9 0.8 0.7 0.8 (12.2) 20.3
Soybean 4.3 4.4 4.0 3.4 3.6 3.6 5.8 0.4
Total 3.7 3.5 3.3 2.9 3.0 3.0 2.8 0.4
Source: USDA FAS
Exhibit 65. World soybean meal: stock usage ratio
0.0
0.5
1.0
1.5
2.0
2.5
3.0
3.5
4.0
4.5
5.0
05/06 06/07 07/08 08/09 09/10F 10/11F
(%)
Source: USDA FAS
Exhibit 66. World oils: supplies (mn MT)
Current USDA FAS
% chg 09-10
% chg 10-11
estimates 05/06 06/07 07/08 08/09 09/10F 10/11F y-y y-y
Palm 39.31 41.48 45.73 48.46 51.29 52.64 5.8 2.6
Rapeseed 17.83 17.81 18.89 21.22 23.43 24.1 10.4 2.9
Soybean 37.72 40.01 41.38 38.84 41.54 45.18 7.0 8.8
Total 128.98 133.46 140.36 145.31 153.6 158.77 5.7 3.4
Soybeans as % of total 29.2 30.0 29.5 26.7 27.0 28.5 Source: USDA FAS
Exhibit 67. World oils: disappearance (mn MT)
Current USDA FAS
% chg 09-10
% chg 10-11
estimates 05/06 06/07 07/08 08/09 09/10F 10/11F y-y y-y
Palm 35.16 36.77 41.21 43.03 46.62 49.31 8.3 5.8
Rapeseed 17.15 17.35 18.16 20.14 21.98 23.2 9.1 5.6
Soybean 34.16 36.34 38.28 36.06 38.49 42.53 6.7 10.5
Total 117.34 121.65 128.65 131.79 141.2 149.26 7.1 5.7
Soybean as % of total 29.1 29.9 29.8 27.4 27.3 28.5 Source: USDA FAS
The SU ratios for protein meal and vegetable oils are expected to remain tight due to demand rising with production

Agri-Bites | ASEAN Tanuj Shori / Ken Arieff Wong
23 March 2011 Nomura 41
Exhibit 68. World oils: stock usage ratios
Current USDA FAS
% chg 09-10
% chg 10-11
estimates 05/06 06/07 07/08 08/09 09/10F 10/11F y-y y-y
Palm 11.8 12.8 11.0 12.6 10.0 6.8 (20.6) (32.6)
Rapeseed 4.0 2.7 4.0 5.4 6.6 3.9 23.0 (41.2)
Soybean 10.4 10.1 8.1 7.7 7.9 6.2 2.8 (21.4)
Total 9.9 9.7 9.1 10.3 8.8 6.4 (14.4) (27.4)
Source: USDA FAS
Exhibit 69. World soybean oil: stock usage ratio
0
2
4
6
8
10
12
05/06 06/07 07/08 08/09 09/10F 10/11F
(%)
Source: USDA FAS
World soybean production to fall slightly in 2010/11F According to the USDA, world soybean production will rise 22.8% y-y to record highs during 2009/10F owing to a recovery in Argentine (+70% y-y) and Brazilian soybean production (+19% y-y). This strong crop is expected to decline slightly in 2010/11F, with production overall to be relatively flat (largest producer US: -0.9% y-y, Brazil +1.4% y-y and Argentina -9.2% y-y). There has been a switch in USDA expectations at Brazil and Argentina, due to normal weather at Brazil and droughts at Argentina. Brazil is expected to have a stronger crop, whereas the Argentine crop is expected to decline. Total production in 2010/11F is expected to remain at its second-highest level historically, at 258mn mT.
Exhibit 70. Soybean production by country (‘000 MT)
Current USDA FAS
% chg 09-10
% chg 10-11
estimates 05/06 06/07 07/08 08/09 09/10F 10/11F y-y y-y
US 83,507 87,001 72,859 80,749 91,417 90,610 13.2 (0.9)
Brazil 57,000 59,000 61,000 57,800 69,000 70,000 19.4 1.4
Argentina 40,500 48,800 46,200 32,000 54,500 49,500 70.3 (9.2)
Total 220,670 237,126 221,006 211,964 260,270 258,402 22.8 (0.7)
China as % of total 7.4 6.7 6.3 7.3 5.8 5.9 Source: USDA FAS
Exhibit 71. Global soybean production
0
50,000
100,000
150,000
200,000
250,000
300,000
05/06 06/07 07/08 08/09 09/10F 10/11F
('000 MT)
(10)
(5)
0
5
10
15
20
25
(%)Total (LHS) y-y growth (RHS)
Source: USDA FAS
Soybean production likely to rise to record highs in 2009/10F but recede slightly in 2010/11F season. Raw soybean stock, however, should be healthy for both seasons

Agri-Bites | ASEAN Tanuj Shori / Ken Arieff Wong
23 March 2011 Nomura 42
Brazil and US to capture share of Argentine soybean exports in 2010/11F
In the current month’s data release, the USDA expects Argentine soybean exports to drop 16% in 2010/11F due to a lower crop, and thinks the US and Brazil will capture this share of falling Argentine exports (US +6% y-y, Brazil +14% y-y). China will likely remain the largest soybean importer, with imports increasing by 22.5% y-y in 2009/10F and 13.2% y-y in 2010/11F. Japanese share of soybean imports at 3.45mn mT might increase following the earthquake and tsunami damage.
Exhibit 72. Soybean exports by country (‘000 MT)
Current USDA FAS
% chg 09-10
% chg 10-11
estimates 05/06 06/07 07/08 08/09 09/10F 10/11F y-y y-y
US 25,579 30,386 31,538 34,925 40,852 43,273 17.0 5.9
Brazil 25,911 23,485 25,364 29,986 28,578 32,500 (4.7) 13.7
Argentina 7,249 9,559 13,838 5,588 13,088 11,000 134.2 (16.0)
Total 63,804 71,320 79,588 77,183 92,743 98,258 20.2 5.9 Source: USDA FAS
Exhibit 73. Soybean exports by major exporters
0
10,000
20,000
30,000
40,000
50,000
60,000
70,000
80,000
90,000
100,000
05/06 06/07 07/08 08/09 09/10F 10/11F
('000 MT)
(2)
0
2
4
6
8
10
12
14
16
18
(%)US+Brazil+Argentina (LHS)
y-y growth (RHS)
Source: USDA FAS
Exhibit 74. Soybean imports by country (‘000 MT)
Current USDA FAS
% chg 09-10
% chg 10-11
estimates 05/06 06/07 07/08 08/09 09/10F 10/11F y-y y-y
China 28,317 28,726 37,816 41,098 50,338 57,000 22.5 13.2
EU-27 13,937 15,291 15,123 13,213 12,609 14,000 (4.6) 11.0
Japan 3,962 4,094 4,014 3,396 3,402 3,450 0.2 1.4
Total 64,129 69,062 78,137 77,200 87,439 95,789 13.3 9.5
China as % of total 28,317 28,726 37,816 41,098 50,338 57,000 22.5 13.2
Source: USDA FAS
Exhibit 75. China soybean imports
0
10,000
20,000
30,000
40,000
50,000
60,000
05/06 06/07 07/08 08/09 09/10F 10/11F
('000 MT)
0
5
10
15
20
25
30
35
(%)China (LHS)
China % growth (RHS)
Source: USDA FAS
Soybean consumption to grow at 8.1% in 2010/11F; same as 09/10F According to USDA estimates, soybean consumption will grow at 8.1% in 2009/10F and 2010/11F, lead by a 19%/18.4% demand growth in China in the two years. Soy meal consumption is expected to grow at 19% in China and 10% in the EU-27, leading to overall consumption growth of 9.2% y-y. Similarly, soy oil consumption will likely grow at 17% in China and 8% in the US in 2010/11F, leading to overall growth of 10% y-y. Soybean crushing volumes are expected to increase with the pace of soybean crop expansion, aided by strong demand in emerging countries like China, which import and crush soybeans locally. Domestic soybean crush in Argentina is also expected to increase by 9% y-y in 2009-10F and 14% in 2010/11F.

Agri-Bites | ASEAN Tanuj Shori / Ken Arieff Wong
23 March 2011 Nomura 43
Exhibit 76. Soybean crushing by country (‘000 MT)
Current USDA FAS
% chg 09-10
% chg 10-11
estimates 05/06 06/07 07/08 08/09 09/10F 10/11F y-y y-y
China 34,500 35,970 39,518 41,035 48,830 57,800 19.0 18.4
US 47,324 49,198 49,081 45,232 47,669 45,042 5.4 (5.5)
Argentina 31,888 33,586 34,607 31,243 34,123 39,000 9.2 14.3
Total 185,188 195,609 201,816 193,808 209,512 226,481 8.1 8.1
China as % of total 18.6 18.4 19.6 21.2 23.3 25.5 Source: USDA FAS
Exhibit 77. Soybean crushing: China vs world
0
50,000
100,000
150,000
200,000
250,000
05/06 06/07 07/08 08/09 09/10F 10/11F
('000 MT)
(10)
(5)
0
5
10
15
20
25
(%)China (LHS)
Total (LHS)
China % growth (RHS)
World % growth (RHS)
Source: USDA FAS
Exhibit 78. Soy meal consumption by country (‘000 MT)
Current USDA FAS
% chg 09-10
% chg 10-11
estimates 05/06 06/07 07/08 08/09 09/10F 10/11F y-y y-y
China 27,776 27,630 30,849 31,673 37,546 44,828 18.5 19.4
EU-27 32,875 33,228 35,169 31,579 30,138 33,256 (4.6) 10.3
US 30,114 31,166 30,148 27,891 27,777 27,669 (0.4) (0.4)
Total 145,448 152,114 157,189 152,449 160,613 175,455 5.4 9.2
China as % of total 19.1 18.2 19.6 20.8 23.4 25.5 Source: USDA FAS
Exhibit 79. Global soy meal consumption
0
20,000
40,000
60,000
80,000
100,000
120,000
140,000
160,000
180,000
200,000
05/06 06/07 07/08 08/09 09/10F 10/11F
('000 MT)
(4)
(2)
0
2
4
6
8
10
(%)Total (LHS)
% total growth (RHS)
Source: USDA FAS
Exhibit 80. Soy oil consumption by country (‘000 MT)
Current USDA FAS
% chg 09-10
% chg 10-11
estimates 05/06 06/07 07/08 08/09 09/10F 10/11F y-y y-y
China 7,607 8,670 9,693 9,486 10,435 12,198 10.0 16.9
US 8,147 8,426 8,317 7,432 7,195 7,757 (3.2) 7.8
Brazil 3,113 3,395 3,920 4,274 4,970 5,190 16.3 4.4
Total 33,572 35,501 37,730 35,912 38,250 42,063 6.5 10.0
China as % of total 22.7 24.4 25.7 26.4 27.3 29.0
Source: USDA FAS
Exhibit 81. Global soy oil consumption
0
5,000
10,000
15,000
20,000
25,000
30,000
35,000
40,000
45,000
05/06 06/07 07/08 08/09 09/10F 10/11F
('000 MT)
(6)
(4)
(2)
0
2
4
6
8
10
12
(%) Total (LHS)
% total growth (RHS)
Source: USDA FAS
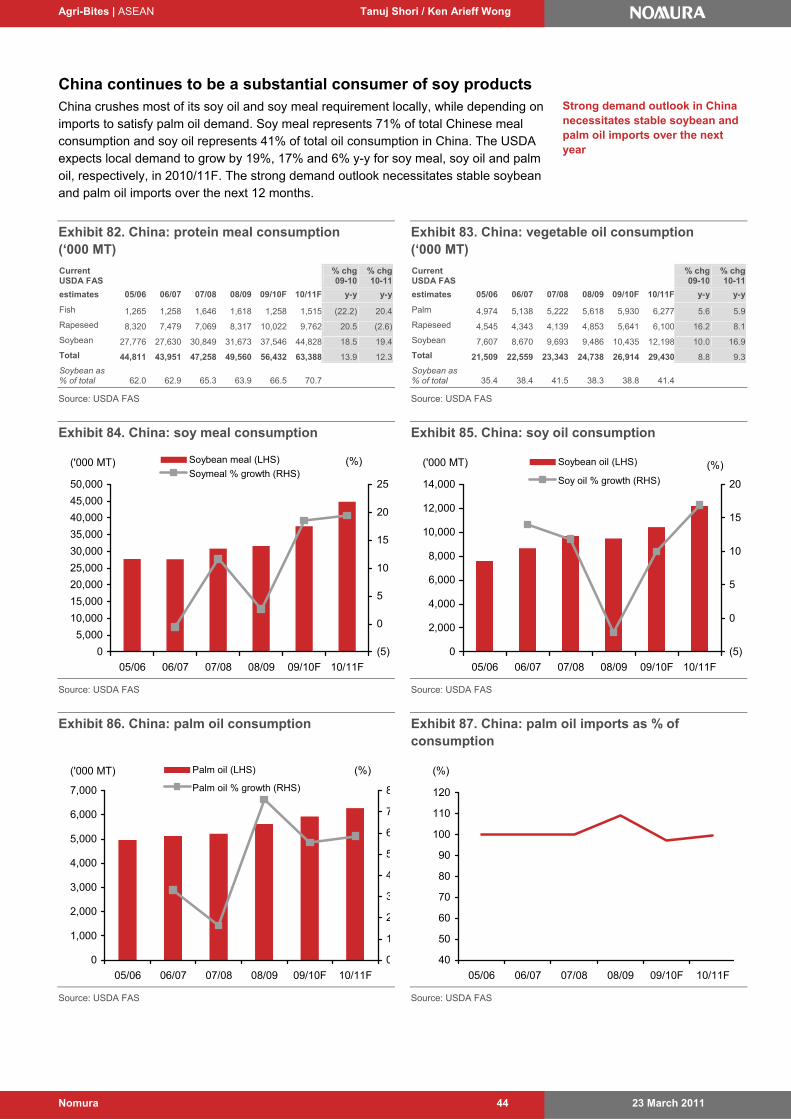
Agri-Bites | ASEAN Tanuj Shori / Ken Arieff Wong
23 March 2011 Nomura 44
China continues to be a substantial consumer of soy products China crushes most of its soy oil and soy meal requirement locally, while depending on imports to satisfy palm oil demand. Soy meal represents 71% of total Chinese meal consumption and soy oil represents 41% of total oil consumption in China. The USDA expects local demand to grow by 19%, 17% and 6% y-y for soy meal, soy oil and palm oil, respectively, in 2010/11F. The strong demand outlook necessitates stable soybean and palm oil imports over the next 12 months.
Exhibit 82. China: protein meal consumption (‘000 MT)
Current USDA FAS
% chg 09-10
% chg 10-11
estimates 05/06 06/07 07/08 08/09 09/10F 10/11F y-y y-y
Fish 1,265 1,258 1,646 1,618 1,258 1,515 (22.2) 20.4
Rapeseed 8,320 7,479 7,069 8,317 10,022 9,762 20.5 (2.6)
Soybean 27,776 27,630 30,849 31,673 37,546 44,828 18.5 19.4
Total 44,811 43,951 47,258 49,560 56,432 63,388 13.9 12.3
Soybean as % of total 62.0 62.9 65.3 63.9 66.5 70.7 Source: USDA FAS
Exhibit 83. China: vegetable oil consumption (‘000 MT)
Current USDA FAS
% chg 09-10
% chg 10-11
estimates 05/06 06/07 07/08 08/09 09/10F 10/11F y-y y-y
Palm 4,974 5,138 5,222 5,618 5,930 6,277 5.6 5.9
Rapeseed 4,545 4,343 4,139 4,853 5,641 6,100 16.2 8.1
Soybean 7,607 8,670 9,693 9,486 10,435 12,198 10.0 16.9
Total 21,509 22,559 23,343 24,738 26,914 29,430 8.8 9.3
Soybean as % of total 35.4 38.4 41.5 38.3 38.8 41.4 Source: USDA FAS
Exhibit 84. China: soy meal consumption
0
5,000
10,000
15,000
20,000
25,000
30,000
35,000
40,000
45,000
50,000
05/06 06/07 07/08 08/09 09/10F 10/11F
('000 MT)
(5)
0
5
10
15
20
25
(%)Soybean meal (LHS)
Soymeal % growth (RHS)
Source: USDA FAS
Exhibit 85. China: soy oil consumption
0
2,000
4,000
6,000
8,000
10,000
12,000
14,000
05/06 06/07 07/08 08/09 09/10F 10/11F
('000 MT)
(5)
0
5
10
15
20
(%)Soybean oil (LHS)
Soy oil % growth (RHS)
Source: USDA FAS
Exhibit 86. China: palm oil consumption
0
1,000
2,000
3,000
4,000
5,000
6,000
7,000
05/06 06/07 07/08 08/09 09/10F 10/11F
('000 MT)
0
1
2
3
4
5
6
7
8
(%)Palm oil (LHS)
Palm oil % growth (RHS)
Source: USDA FAS
Exhibit 87. China: palm oil imports as % of consumption
40
50
60
70
80
90
100
110
120
05/06 06/07 07/08 08/09 09/10F 10/11F
(%)
Source: USDA FAS
Strong demand outlook in China necessitates stable soybean and palm oil imports over the next year
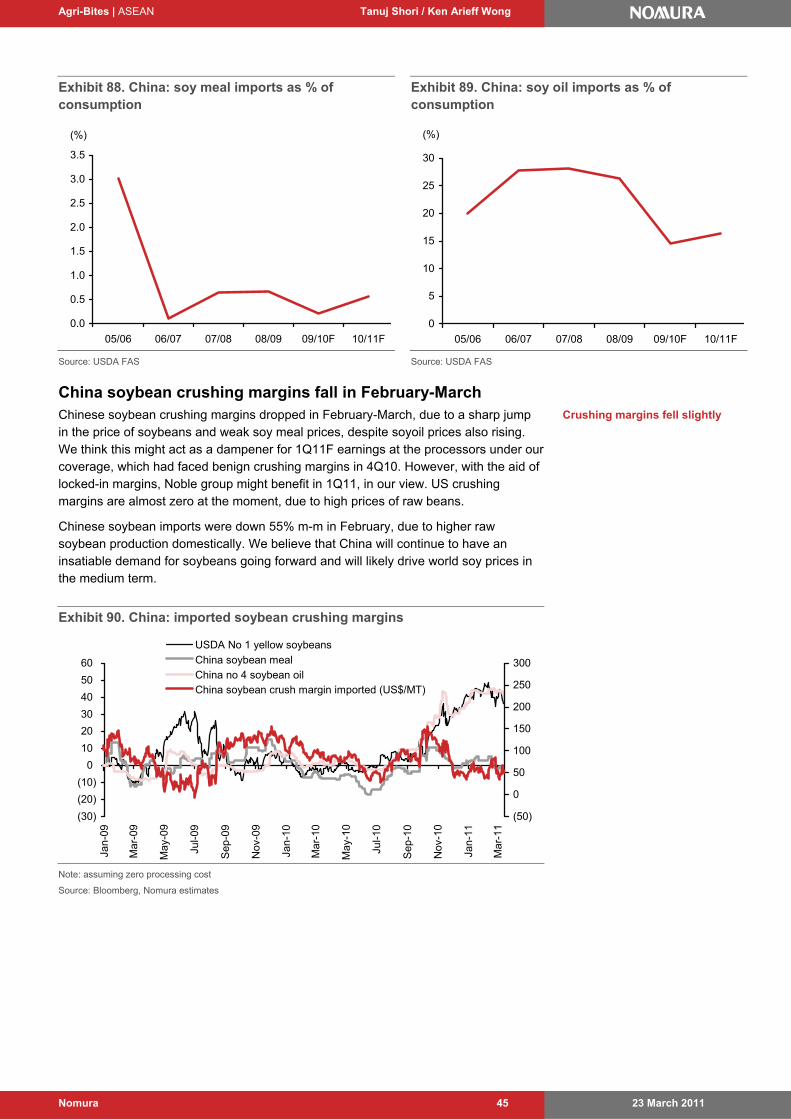
Agri-Bites | ASEAN Tanuj Shori / Ken Arieff Wong
23 March 2011 Nomura 45
Exhibit 88. China: soy meal imports as % of consumption
0.0
0.5
1.0
1.5
2.0
2.5
3.0
3.5
05/06 06/07 07/08 08/09 09/10F 10/11F
(%)
Source: USDA FAS
Exhibit 89. China: soy oil imports as % of consumption
0
5
10
15
20
25
30
05/06 06/07 07/08 08/09 09/10F 10/11F
(%)
Source: USDA FAS
China soybean crushing margins fall in February-March Chinese soybean crushing margins dropped in February-March, due to a sharp jump in the price of soybeans and weak soy meal prices, despite soyoil prices also rising. We think this might act as a dampener for 1Q11F earnings at the processors under our coverage, which had faced benign crushing margins in 4Q10. However, with the aid of locked-in margins, Noble group might benefit in 1Q11, in our view. US crushing margins are almost zero at the moment, due to high prices of raw beans.
Chinese soybean imports were down 55% m-m in February, due to higher raw soybean production domestically. We believe that China will continue to have an insatiable demand for soybeans going forward and will likely drive world soy prices in the medium term.
Exhibit 90. China: imported soybean crushing margins
(30)
(20)
(10)
0
10
20
30
40
50
60
Jan
-09
Ma
r-09
May
-09
Jul-0
9
Sep
-09
Nov
-09
Jan
-10
Ma
r-10
May
-10
Jul-1
0
Sep
-10
Nov
-10
Jan
-11
Ma
r-11
(50)
0
50
100
150
200
250
300
USDA No 1 yellow soybeans
China soybean meal
China no 4 soybean oilChina soybean crush margin imported (US$/MT)
Note: assuming zero processing cost
Source: Bloomberg, Nomura estimates
Crushing margins fell slightly
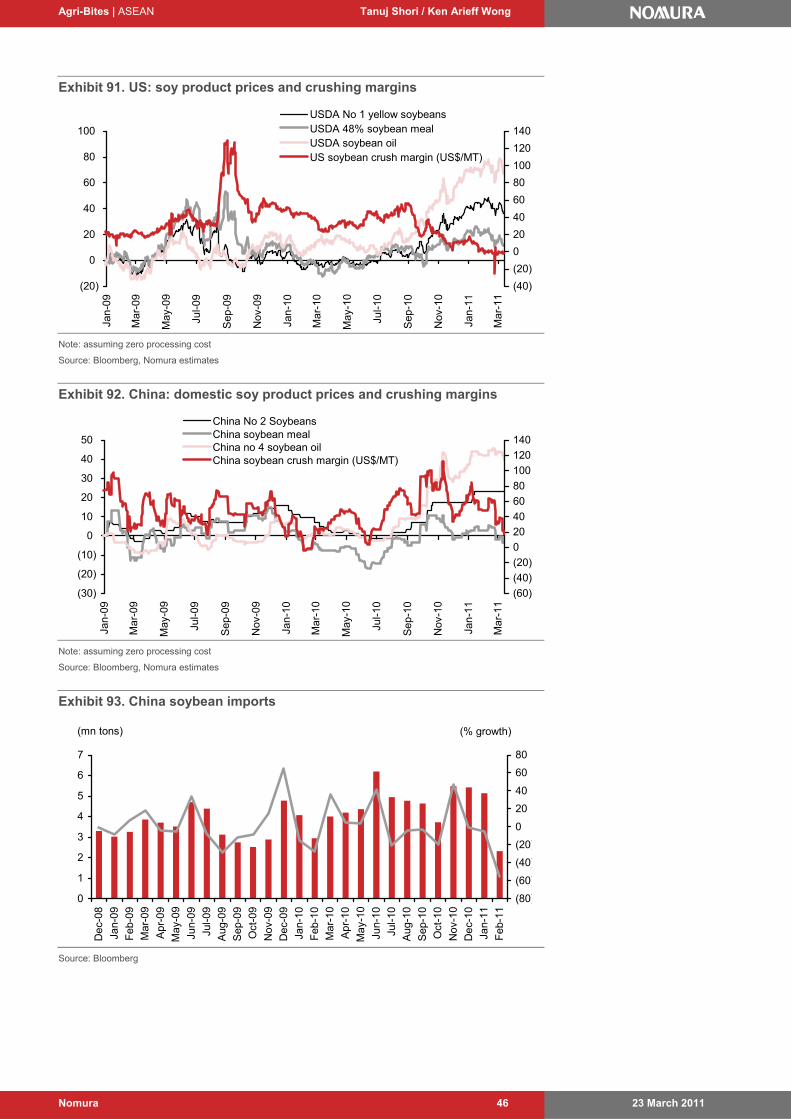
Agri-Bites | ASEAN Tanuj Shori / Ken Arieff Wong
23 March 2011 Nomura 46
Exhibit 91. US: soy product prices and crushing margins
(20)
0
20
40
60
80
100
Jan
-09
Ma
r-09
May
-09
Jul-0
9
Sep
-09
Nov
-09
Jan
-10
Ma
r-10
May
-10
Jul-1
0
Sep
-10
Nov
-10
Jan
-11
Ma
r-11
(40)
(20)
0
20
40
60
80
100
120
140
USDA No 1 yellow soybeansUSDA 48% soybean meal USDA soybean oil US soybean crush margin (US$/MT)
Note: assuming zero processing cost
Source: Bloomberg, Nomura estimates
Exhibit 92. China: domestic soy product prices and crushing margins
(30)
(20)
(10)
0
10
20
30
40
50
Jan
-09
Ma
r-09
May
-09
Jul-0
9
Sep
-09
Nov
-09
Jan
-10
Ma
r-10
May
-10
Jul-1
0
Sep
-10
Nov
-10
Jan
-11
Ma
r-11
(60)
(40)
(20)
0
20
40
60
80
100
120
140
China No 2 Soybeans China soybean meal China no 4 soybean oilChina soybean crush margin (US$/MT)
Note: assuming zero processing cost
Source: Bloomberg, Nomura estimates
Exhibit 93. China soybean imports
0
1
2
3
4
5
6
7
De
c-08
Jan-
09
Feb
-09
Ma
r-09
Ap
r-09
May
-09
Jun-
09
Jul-0
9
Aug
-09
Sep
-09
Oct
-09
No
v-09
De
c-09
Jan-
10
Feb
-10
Ma
r-10
Ap
r-10
May
-10
Jun-
10
Jul-1
0
Aug
-10
Sep
-10
Oct
-10
No
v-10
De
c-10
Jan-
11
Feb
-11
(mn tons)
(80)
(60)
(40)
(20)
0
20
40
60
80
(% growth)
Source: Bloomberg

Agri-Bites | ASEAN Tanuj Shori / Ken Arieff Wong
23 March 2011 Nomura 47
Sugar
Sugar Ploenjai Jirajarus
Capital Nomura Securities
Tushar Mohata (Associate)
ISO further cuts sugar surplus forecast for 2010/11F on Australian floods and China weather According to the International Sugar Organization’s world sugar balance report (February), the sugar surplus expected in 2010/11F will be lower at 0.2mn mT, cut 85% from the November estimate of 1.3mn mT, which was earlier expected by ISO. World sugar supplies are expected to turn to surplus in 2010/11F (October 2010-September 2011), after two years of running at a deficit.
ISO cut raw sugar production estimates due to cold weather and heavy sleet last month which reduced China's output potential, while last summer's drought hurt Ukraine's beet crop more than expected. The ISO also downgraded its estimate for output in Australia, the third-largest exporter, by 700,000 tonnes, citing rainy weather which left significant quantities of cane uncut even before the arrival of Cyclone Yasi, which destroyed an estimated 25% of the north Queensland crop.
Overall, raw sugar production estimates were cut 0.5% to 168mn mT. Stock usage ratios are still expected to hover around 35% for 2010/11F, lower than recent historical levels. (Source: ISO, http://www.agrimoney.com/printnews.php?id=2874&area=n).
Exhibit 94. ISO world sugar balance
% chg in est
(mn mT) 99/00 00/01 01/02 02/03 03/04 04/05 05/06 06/07 07/08 08/09 09/10F 10/11F 09/10F 10/11F
Total production 131.7 130.6 137.2 148.5 142.3 140.3 150.4 166.3 166.3 150.6 160.6 168.0 0.0 (0.5)
Total consumption 127.6 131.3 136.1 141.7 143.7 147.7 153.3 156.7 159.6 160.9 164.5 167.8 0.1 0.1
Surplus/deficit 4.1 (0.7) 1.1 6.7 (1.4) (7.3) (2.9) 9.6 6.6 (10.3) (4.0) 0.2 3.8 (84.8)
Import demand 37.3 39.7 43.3 45.2 45.2 48.0 48.7 48.9 48.3 48.1 53.4 50.3 0.9 0.3
Export availability 37.5 39.6 43.9 45.2 45.1 48.5 49.2 48.8 48.5 47.9 53.0 50.5 0.3 (0.4)
End stocks 61.5 61.3 62.5 69.1 67.8 60.0 56.3 66.0 72.4 62.4 58.8 58.8 2.6 1.3
Stocks/ consumption ratio in % 48.2 46.7 45.9 48.8 47.2 40.7 36.7 42.1 45.4 38.8 35.7 35.0 2.4 1.1
Note: (October-September year), raw value
Source: ISO World Sugar Balance February 2011
Thai sugar export volume and price up in Jan-11 Thailand’s sugar export volume in January 11 was 339,21 8 tons, up 18.9% y-y from 285,404 tons in January 10, while the export price in the period rose by 11.6% y-y to US$521/ton from US$467/ton. The y-y growth in export volume was a result of rising output of new sugar crop start harvesting from December 2010.
Moreover, Thailand’s sugar export volume in 2010 was 4.50mn tons, down 10.9% from 5.05mn tons in 2009, while the export price in the period rose by 35.6% to US$484/ton from US$357/ton in a year earlier. The tight sugar supply situation during early 2010 in India and Thailand, combined with the tight sugar supply situation during late 2010 in Brazil, caused export sugar price increases for the whole year of 2010.
Thailand’s sugar export volume and price up y-y in Jan 11 due to rising output in new crop starting from December 2010

Agri-Bites | ASEAN Tanuj Shori / Ken Arieff Wong
23 March 2011 Nomura 48
World sugar prices fell m-m in March 2011 due to expected sugar surplus from India Future price of world raw sugar delivery in May 11 was 25.65 cents/pound on 15 March 2011, up 50.3% y-y but down 12.2% m-m. The m-m drop in price was caused by the relief of India’s supply as Indian Sugar Mills Assocation commented that India will have 3mn tons of sugar surplus in 2010/11F which will enable India to export more sugar in this season.
Exhibit 95. Sugar (#11) price
Sugar #11 World (US$cent/lb)
10
15
20
25
30
35
Jun-
08
Se
p-08
De
c-08
Ma
r-09
Jun-
09
Se
p-09
De
c-09
Ma
r-10
Jun-
10
Se
p-10
De
c-10
Ma
r-11
Source: Bloomberg
Exhibit 96. Thailand: sugar export volume and price
0
100,000
200,000
300,000
400,000
500,000
600,000
700,000
800,000
De
c-08
Jan-
09F
eb-
09M
ar-
09A
pr-
09M
ay-
Jun-
09Ju
l-09
Au
g-09
Se
p-09
Oct
-09
No
v-09
De
c-09
Jan-
10F
eb-
10M
ar-
10A
pr-
10M
ay-
Jun-
10Ju
l-10
Au
g-10
Se
p-10
Oct
-10
No
v-10
De
c-10
Jan-
11
250
300
350
400
450
500
550
600
650Sugar volume (LHS)
Sugar price (RHS)
(Tons) (US$/ton)
Source: Bank of Thailand
World sugar price fell m-m due to expected sugar surplus in India

Agri-Bites | ASEAN Tanuj Shori / Ken Arieff Wong
23 March 2011 Nomura 49
Grains
Grains — rice, wheat and corn Grain stock usage ratios to tighten in for wheat and corn while improving for rice in 2010/11F The USDA slightly increased is estimates for wheat and corn production in 2009/10F. Improved weather conditions in China and faster production recovery in Australia led to improvement in wheat supply, and with demand continuing to grow at ~2% pa in 2010/11F, aided by Chinese and Indian demand, the stock usage ratios for wheat and corn should fall in 2010/11F, while for rice, it should rise on the back of higher production. The USDA estimates show corn production increasing 4.3% in 2009/10F and 2.4% in 2010/11F, while wheat and rice production are likely to fall in 2009/10F, owing to Pakistan floods and EU drought. The USDA expects rice production to recover ~2.5% in 2010/11F. However, the demand for corn is expected to increase at a higher rate of 4.3% in 2009/10F.Thus, stock usage ratios are likely to fall for wheat and corn in 2010/11F, indicating strengthening prices, and in the case of rice, improving stock usage ratio indicates easing prices .
Exhibit 97. Wheat, rice and corn summary
(mn MT) 07/08 08/09 09/10F 10/11F % chg 09-10
% chg 10-11
Production
Wheat 611.0 683.1 682.6 647.6 (0.1) (5.1)
Rice, milled 433.6 447.9 440.9 451.5 (1.6) 2.4
Corn 793.6 798.0 812.4 813.8 1.8 0.2
Domestic consumption
Wheat 616.8 641.7 652.5 663.0 1.7 1.6
Rice, milled 428.1 436.9 438.1 447.0 0.3 2.0
Corn 772.5 781.9 815.7 835.2 4.3 2.4
Exports
Wheat 116.7 143.1 134.2 124.3 (6.2) (7.4)
Rice, milled 29.7 29.1 31.1 30.2 6.8 (3.1)
Corn 98.3 84.1 93.2 92.1 10.8 (1.2)
Ending Stocks
Wheat 124.8 167.2 197.3 181.9 18.0 (7.8)
Rice, milled 80.3 91.5 94.3 98.8 3.0 4.8
Corn 131.4 147.8 144.5 123.1 (2.2) (14.8)
S.U. Ratios (%)
Wheat 20.2 26.1 30.2 27.4 16.0 (9.3)
Rice, milled 18.8 20.9 21.5 22.1 2.8 2.7
Corn 17.0 18.9 17.7 14.7 (6.3) (16.8)
Source: USDA FAS
Exhibit 98. Wheat stock usage ratio
14
16
18
20
22
24
26
28
30
3207
/08
08/0
9
09/1
0F
10/1
1F
(%)
Source: USDA FAS
Exhibit 99. Rice stock usage ratio
17.0
18.0
19.0
20.0
21.0
22.0
23.0
07/0
8
08/0
9
09/1
0F
10/1
1F
(%)
Source: USDA FAS
Exhibit 100. Corn stock usage ratio
14
15
16
17
18
19
20
07/
08
08/
09
09/1
0F
10/1
1F
(%)
Source: USDA FAS

Agri-Bites | ASEAN Tanuj Shori / Ken Arieff Wong
23 March 2011 Nomura 50
USDA revised up global rice stock forecast for 2010/11F USDA released the monthly world markets and trade for grain in March 2011, forecasting 2.4% growth in global rice production in 2010/11F and 2.0% growth in global rice consumption in 2010/11F. Compare with data in the February 2011 edition, the USDA revised down its consumption forecast by 1.2% from 452.3mn tons to 447.0mn tons for the global rice market in 2010/11F. The agency revised down consumption forecasts for India and Vietnam. As a result, it revised up its global ending stocks forecast for 2010/11F by 5.2% from 93.85mn tons to 98.77mn tons mainly from the revised down consumption forecast in India.
Exhibit 101. Top rice producers
(‘000 MT) 05/06 06/07 07/08 08/09
09/10F 10/11F % chg 09-10
% chg10-11
Production
China 126,414 127,200 130,224 134,330 136,570 139,300 1.7 2.0
India 91,790 93,350 96,690 99,180 89,130 94,500 (10.1) 6.0
Indonesia 34,959 35,300 37,000 38,300 36,370 37,500 (5.0) 3.1
Total 418,507 420,310 433,580 447,883 440,917 451,518 (1.6) 2.4 Source: USDA FAS
Exhibit 102. Top rice consumers
(‘000 MT) 05/06 06/07 07/08 08/09
09/10F 10/11F% chg 09-10
% chg 10-11
Consumption
China 128,000 127,200 127,450 133,000 134,320 136,000 1.0 1.3
India 85,088 86,700 90,466 91,080 85,730 91,000 (5.9) 6.1
Indonesia 35,739 35,900 36,350 37,090 38,000 38,850 2.5 2.2
Total 415,643 421,735 428,101 436,946 438,142 447,004 0.3 2.0 Source: USDA FAS
Exhibit 103. Top rice exporters
(‘000 MT) 05/06 06/07 07/08 08/09
09/10F 10/11F % chg 09-10
% chg 10-11
Exports
Thailand 7,376 9,557 10,011 8,570 9,000 10,000 5.0 11.1
Vietnam 4,705 4,522 4,649 5,950 6,734 6,000 13.2 (10.9)
Pakistan 3,579 2,696 3,000 3,000 4,000 2,650 33.3 (33.8)
Total 29,098 31,851 29,689 29,147 31,130 30,170 6.8 (3.1) Source: USDA FAS
Exhibit 104. Top rice importers
(‘000 MT) 05/06 06/07 07/08 08/09
09/10F 10/11F% chg 09-10
% chg 10-11
Imports
Philippines 1,791 1,900 2,500 2,000 2,400 1,500 20.0 (37.5)
Iran 1,500 2,000 350 250 1,150 1,750 360.0 52.2
Nigeria 1,600 1,550 1,800 2,000 2,100 1,900 5.0 (9.5)
Total 29,098 31,851 29,689 29,147 31,130 30,170 6.8 (3.1) Source: USDA FAS
World rice price continues to be weak y-y and m-m in Mar-11 On the Chicago Board of Trade, the price of rough rice was US$13.07/100lb on 16 March 2011, down up 12.8% y-y and 2.7% m-m. The price fall was a result of the USDA’s upward revision for global rice ending stock in 2010/11F. This stock revision from 93.85mn tons to 98.77mn tons was made mainly by downward revision of India rice consumption forecast by 4.2% from 95.0mn tons to 91.0mn tons. India is the world’s second rice producer and consumer. Capital Nomura Securities’ analyst Ploenjai Jirajarus anticipates that rough rice price will be under downward pressure because the new crop from Vietnam is coming to the market. Moreover, the Vietnam Food Association said to reduce the minimum export price for 5% broken rice to $500 a metric ton from $520/ton and that of 25% broken rice to $480/ton from $490/ton, free on board.
Exhibit 105. Global price of wheat and corn
300
400
500
600
700
800
900
1000
Apr
-10
May
-10
Jun-
10
Jul-1
0
Aug
-10
Sep
-10
Oct
-10
Nov
-10
Dec
-10
Jan-
11
Feb
-11
Mar
-11
Wheat CornUScent/Bushes
Source: Bloomberg
Exhibit 106. Global price of wheat and rice
300
400
500
600
700
800
900
1000
Apr
-10
May
-10
Jun-
10
Jul-1
0
Aug
-10
Sep
-10
Oct
-10
Nov
-10
Dec
-10
Jan-
11
Feb
-11
Mar
-11
10
11
12
13
14
15
16
17Wheat RiceUscent/Bushel US$/Cw t
Source: Bloomberg
Global rice production and consumption expected to increase 2.4% and 2%
World rough rice price fell y-y and m-m in Mar-11 due to USDA’s upward revision of world rice stock
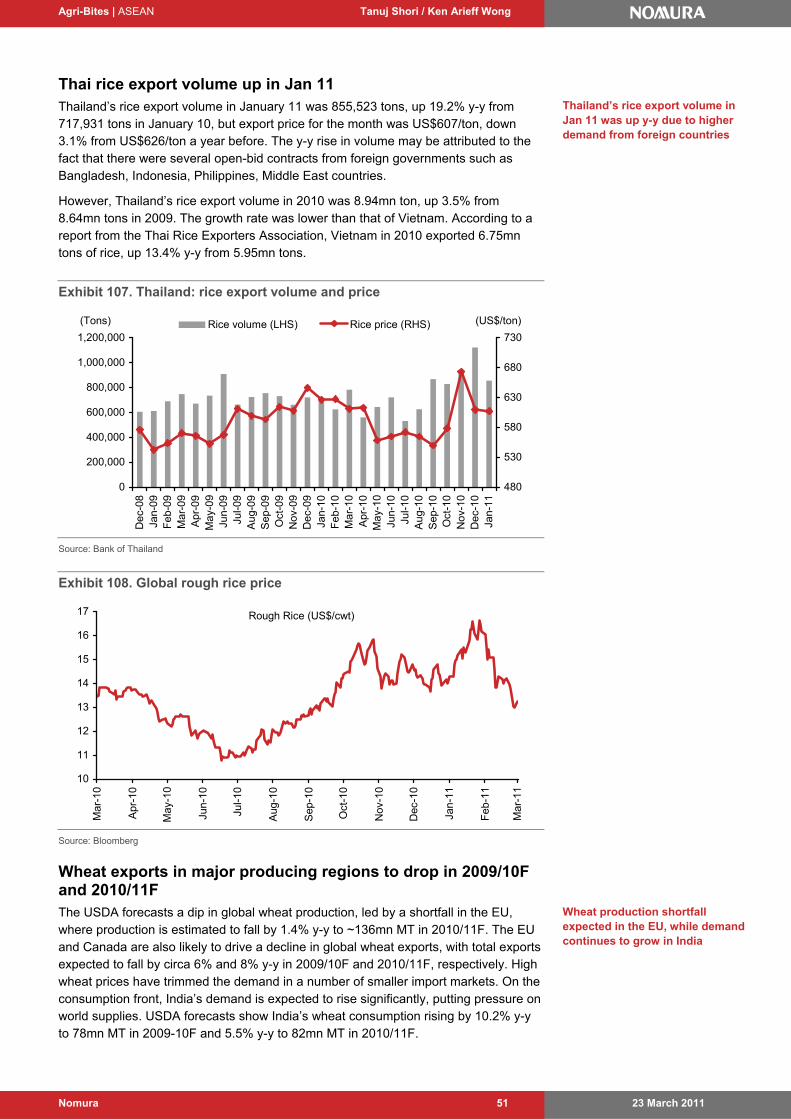
Agri-Bites | ASEAN Tanuj Shori / Ken Arieff Wong
23 March 2011 Nomura 51
Thai rice export volume up in Jan 11 Thailand’s rice export volume in January 11 was 855,523 tons, up 19.2% y-y from 717,931 tons in January 10, but export price for the month was US$607/ton, down 3.1% from US$626/ton a year before. The y-y rise in volume may be attributed to the fact that there were several open-bid contracts from foreign governments such as Bangladesh, Indonesia, Philippines, Middle East countries.
However, Thailand’s rice export volume in 2010 was 8.94mn ton, up 3.5% from 8.64mn tons in 2009. The growth rate was lower than that of Vietnam. According to a report from the Thai Rice Exporters Association, Vietnam in 2010 exported 6.75mn tons of rice, up 13.4% y-y from 5.95mn tons.
Exhibit 107. Thailand: rice export volume and price
0
200,000
400,000
600,000
800,000
1,000,000
1,200,000
De
c-08
Jan-
09F
eb-
09M
ar-
09A
pr-
09M
ay-0
9Ju
n-09
Jul-0
9A
ug-
09S
ep-
09O
ct-0
9N
ov-
09D
ec-
09Ja
n-10
Fe
b-10
Ma
r-10
Ap
r-10
May
-10
Jun-
10Ju
l-10
Au
g-10
Se
p-10
Oct
-10
No
v-10
De
c-10
Jan-
11480
530
580
630
680
730Rice volume (LHS) Rice price (RHS)(Tons) (US$/ton)
Source: Bank of Thailand
Exhibit 108. Global rough rice price
Rough Rice (US$/cwt)
10
11
12
13
14
15
16
17
Ma
r-10
Apr
-10
May
-10
Jun
-10
Jul-1
0
Aug
-10
Sep
-10
Oct
-10
Nov
-10
Dec
-10
Jan
-11
Feb
-11
Ma
r-11
Source: Bloomberg
Wheat exports in major producing regions to drop in 2009/10F and 2010/11F The USDA forecasts a dip in global wheat production, led by a shortfall in the EU, where production is estimated to fall by 1.4% y-y to ~136mn MT in 2010/11F. The EU and Canada are also likely to drive a decline in global wheat exports, with total exports expected to fall by circa 6% and 8% y-y in 2009/10F and 2010/11F, respectively. High wheat prices have trimmed the demand in a number of smaller import markets. On the consumption front, India’s demand is expected to rise significantly, putting pressure on world supplies. USDA forecasts show India’s wheat consumption rising by 10.2% y-y to 78mn MT in 2009-10F and 5.5% y-y to 82mn MT in 2010/11F.
Wheat production shortfall expected in the EU, while demand continues to grow in India
Thailand’s rice export volume in Jan 11 was up y-y due to higher demand from foreign countries

Agri-Bites | ASEAN Tanuj Shori / Ken Arieff Wong
23 March 2011 Nomura 52
Exhibit 109. Top wheat producers
(‘000 MT) 05/06 06/07 07/08 08/09
09/10F 10/11F % chg 09-10
% chg 10-11
Production
EU-27 132,356 124,870 120,133 151,004 138,051 136,078 (8.6) (1.4)
China 97,445 108,466 109,298 112,464 115,120 114,500 2.4 (0.5)
India 68,640 69,350 75,810 78,570 80,680 80,800 2.7 0.1
Total 619,054 595,912 611,019 683,130 682,594 647,597 (0.1) (5.1) Source: USDA FAS
Exhibit 110. Top wheat consumers
(‘000 MT) 05/06 06/07 07/08 08/09
09/10F 10/11F% chg 09-10
% chg 10-11
Consumption
EU-27 127,525 125,500 116,536 127,500 124,500 122,000 (2.4) (2.0)
China 101,500 102,000 106,000 105,500 107,000 108,800 1.4 1.7
India 69,980 73,477 76,423 70,924 78,150 82,475 10.2 5.5
Total 621,997 616,109 616,757 641,704 652,499 663,022 1.7 1.6 Source: USDA FAS
Exhibit 111. Top wheat exporters
(‘000 MT) 05/06 06/07 07/08 08/09
09/10F 10/11F % chg 09-10
% chg 10-11
Exports
US 27,252 25,041 34,328 27,295 24,175 35,000 (11.4) 44.8
EU-27 15,701 13,816 12,271 25,318 22,117 21,000 (12.6) (5.1)
Canada 15,633 19,278 16,561 18,583 18,974 17,500 2.1 (7.8)
Total 114,089 115,610 116,663 143,066 134,246 124,307 (6.2) (7.4) Source: USDA FAS
Exhibit 112. Top wheat importers
(‘000 MT) 05/06 06/07 07/08 08/09
09/10F 10/11F% chg 09-10
% chg 10-11
Imports
Egypt 7,771 7,300 7,700 9,900 10,300 9,800 4.0 (4.9)
EU-27 6,758 5,137 6,942 7,740 5,480 4,500 (29.2) (17.9)
Brazil 5,631 7,743 7,076 6,762 6,667 6,700 (1.4) 0.5
Total 114,089 115,610 116,663 143,066 134,246 124,307 (6.2) (7.4) Source: USDA FAS
US corn production to fall, but offset by gains in China According to the USDA, world corn production is likely to remain flat at 813mn MT in 2010/11F. US corn production is likely to fall 4.9% in 2010/11F, but be offset by a rise in China (+6.3%). Argentine exports are expected to fall 23% y-y in 2010/11F. On the demand side, the US and China will remain the biggest demand drivers of corn, with 4.3% and 1.9% y-y growth, respectively, in 2010/11F.
Exhibit 113. Top corn producers
(‘000 MT) 05/06 06/07 07/08 08/09
09/10F 10/11F % chg 09-10
% chg 10-11
Production
US 282,263 267,503 331,177 307,142 332,549 316,165 8.3 (4.9)
China 139,365 151,600 152,300 165,900 158,000 168,000 (4.8) 6.3
EU-27 60,668 53,829 47,555 62,505 57,147 55,193 (8.6) (3.4)
Total 699,405 713,451 793,615 798,015 812,378 813,778 1.8 0.2 Source: USDA FAS
Exhibit 114. Top corn consumers
(‘000 MT) 05/06 06/07 07/08 08/09
09/10F 10/11F% chg 09-10
% chg 10-11
Consumption
US 232,015 230,674 261,632 259,053 281,423 293,384 8.6 4.3
China 137,000 145,000 149,000 152,000 159,000 162,000 4.6 1.9
EU-27 61,500 62,300 64,000 62,000 60,000 60,500 (3.2) 0.8
Total 706,517 728,094 772,528 781,946 815,658 835,184 4.3 2.4 Source: USDA FAS
Exhibit 115. Top corn exporters
(‘000 MT) 05/06 06/07 07/08 08/09
09/10F 10/11F % chg 09-10
% chg 10-11
Exports
US 56,084 54,214 60,663 47,907 49,887 50,000 4.1 0.2
Brazil 2,826 8,071 7,883 7,178 8,623 10,000 20.1 16.0
Argentina 10,707 15,693 15,676 8,458 16,971 13,000 100.7 (23.4)
Total 82,715 91,474 98,265 84,102 93,172 92,095 10.8 (1.2) Source: USDA FAS
Exhibit 116. Top corn importers
(‘000 MT) 05/06 06/07 07/08 08/09
09/10F 10/11F% chg 09-10
% chg 10-11
Imports
Japan 16,617 16,713 16,614 16,533 15,979 16,100 (3.4) 0.8
Mexico 6,787 8,944 9,556 7,764 8,298 9,000 6.9 8.5
S Korea 8,483 8,731 9,311 7,188 8,461 8,000 17.7 (5.4)
Total 82,715 91,474 98,265 84,102 93,172 92,095 10.8 (1.2) Source: USDA FAS
Agri-Bites | ASEAN Tanuj Shori / Ken Arieff Wong
23 March 2011 Nomura 53
Rubber
Rubber Ploenjai Jirajarus
Capital Nomura Securities
Global natural rubber to grow 4.6% in 2011F and 3.8% in 2012F The International Rubber Study Group (IRSG) reported in March 2011 that global combined natural rubber and synthetic demand is forecast to reach 26.1mn tons in 2011 and 27.5mn tons in 2012. Global synthetic rubber demand is expected to grow by 8.6% in 2011 and 6.4% in 2012, while global natural rubber demand is forecast to rise by 4.6% in 2011 and 3.8% in 2012. Partly due to the impact of higher prices and assuming normal growing conditions, global natural rubber production is forecast to rise by 6.2% in 2011 and 6.5% in 2012. In the longer term, driven largely by strong growth in the emerging markets, global rubber consumption is forecast to reach 33.9mn tonnes by 2020, with natural rubber demand of 15.4mn tonnes.
Thai rubber export volume down but export price up in Jan 11 Thailand’s rubber export volume in January 11 was 255,500 tons, down 10.1% y-y from 284,291 tons in January 10, while the export price of Thai rubber for the month was US$4,121/tonne, up 75.4% y-y from US$2,349/ton in a year before. Low supply of rubber from Thailand due to heavy rain is the major reason for lower export volume and increasing export prices.
However, Thailand’s rubber export volume in 2010 was 2.73mn tonnes, down 0.3% y-y from 2.74mn tons in 2009 while the average price of rubber export in 2010 rose impressively 87.6% y-y to US$2,898/ton from US$1,544/ton in 2009. Both y-y growth in export volume and price were attributed to rising demand from China and supply constraint in Thailand and Indonesia.
Future rubber price down m-m on worry about car industry in China and the impact from the earthquake in Japan On the Singapore Commodity Exchange, the future blocked rubber price was US$4.00/Kg on 16 March 2011, up 32.5% y-y but down 29.3% m-m. Worries of high car inventory in China and economic uncertainty in Japan caused a sharp m-m fall in the price. Smoked sheet rubber in Thailand was hardest hit to THB105/Kg (US$3.44/Kg) on 14 March 2011 after rubber middle men in Thailand refused to buy rubber from farmers on the worry rubber demand in Japan would fall because car factories in Japan will close down due to the earthquake.
Capital Nomura Securities anticipates that rubber prices may rebound in the short term due to supply constraints in Thailand during the winter season in Feb-May 2011. However, rubber prices may be under downward pressure again during the high season of output in Thailand during Jun-Sep 2011.
Thai rubber export volume and price in Jan 11 fell y-y but export price rose y-y due to supply constraint in Thailand
Rubber future price on the Singapore Commodity Exchange is currently off m-m
Global natural rubber demand is forecast to rise by 4.6% in 2011F and 3.8% in 2012F while global synthetic rubber demand is expected to grow by 8.6% and 6.4%, respectively
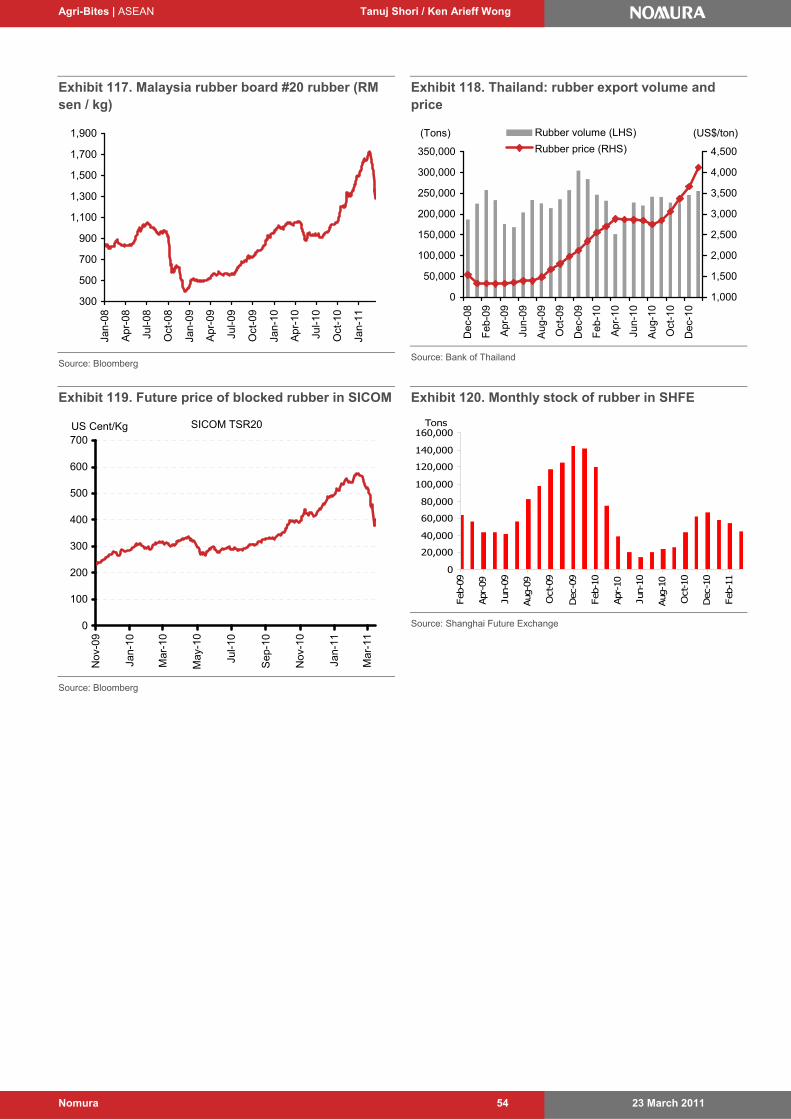
Agri-Bites | ASEAN Tanuj Shori / Ken Arieff Wong
23 March 2011 Nomura 54
Exhibit 117. Malaysia rubber board #20 rubber (RM sen / kg)
300
500
700
900
1,100
1,300
1,500
1,700
1,900
Jan-
08
Ap
r-08
Jul-0
8
Oct
-08
Jan-
09
Ap
r-09
Jul-0
9
Oct
-09
Jan-
10
Ap
r-10
Jul-1
0
Oct
-10
Jan-
11Source: Bloomberg
Exhibit 118. Thailand: rubber export volume and price
0
50,000
100,000
150,000
200,000
250,000
300,000
350,000
Dec
-08
Feb
-09
Apr
-09
Jun-
09
Aug
-09
Oct
-09
Dec
-09
Feb
-10
Apr
-10
Jun-
10
Aug
-10
Oct
-10
Dec
-10
1,000
1,500
2,000
2,500
3,000
3,500
4,000
4,500
Rubber volume (LHS)
Rubber price (RHS)
(Tons) (US$/ton)
Source: Bank of Thailand
Exhibit 119. Future price of blocked rubber in SICOM
SICOM TSR20
0
100
200
300
400
500
600
700
Nov
-09
Jan-
10
Mar
-10
May
-10
Jul-1
0
Sep
-10
Nov
-10
Jan-
11
Mar
-11
US Cent/Kg
Source: Bloomberg
Exhibit 120. Monthly stock of rubber in SHFE
0
20,000
40,000
60,000
80,000
100,000
120,000
140,000
160,000
Feb-09
Apr-09
Jun-09
Aug-09
Oct-09
Dec-09
Feb-10
Apr-10
Jun-10
Aug-10
Oct-10
Dec-10
Feb-11
Tons
Source: Shanghai Future Exchange

Agri-Bites | ASEAN Tanuj Shori / Ken Arieff Wong
23 March 2011 Nomura 55
Crop Calendar
Appendix 1: crop calendar In this section, we summarise the stage of summer and winter crop production across the globe.
Exhibit 121. March normal crop calendar: Summer crops
Source: USDA / NOAA
Exhibit 122. March normal crop calendar: Winter crops
Source: USDA / NOAA

Agri-Bites | ASEAN Tanuj Shori / Ken Arieff Wong
23 March 2011 Nomura 56
Weather summary
Appendix 2: monthly weather update In this section, we summarise global weather conditions and their effects on production of key agricultural crops.
Exhibit 123. Weather condition and crop impact: March
Region Weather Crop Impact
US Wild temperature swings, drought Winter grain in Gulf Coast Unfavourable
South America Near-to-above rainfall Summer grain and oilseeds Favourable
Frequent rainfall in Brazil Soybeans, coffee, sugarcane, citrus
Favourable
Europe Abnormally dry February weather, risk of winterkill
Winter grain and oilseed Unfavourable
Former Soviet Union (Western) Bitterly cold weather but protected by deep snow pack
Winter wheat Unfavourable
Northwest Africa Above-normal February rainfall Winter grain Favourable
Middle east and Turkey Much needed rainfall and snow Winter crop Favourable
South Asia Warm weather and timely rainfall in India
Winter wheat and rapeseed Favourable
Eastern Asia Mild weather All crops Favourable
South East Asia Persistent rainfall Palm oil Unfavourable
Warm weather in Vietnam rice harvesting Favourable
South Africa Drier weather with scattered rainfall
Corn Favourable
Australia Occasional showers Summer crops Favourable
Source: USDA

Agri-Bites | ASEAN Tanuj Shori / Ken Arieff Wong
23 March 2011 Nomura 57
Valuation methodology and investment risks
Valuation methodologies Sime Darby: We value Sime Darby using a SOTP valuation: 1) ascribing a P/E multiple of 18x to its plantations division FY11F PAT, 14x to heavy equipment FY11F PAT, 15x to automobiles FY11F PAT, 10x to Utilities (ex oil and gas) FY11F PAT, and 8x to others; 2) valuing the property business at RNAV, to arrive at our PT of RM12.15.
IOI Corp: Our PT of RM7.00 is derived by pegging our rolling 12M-fwd P/E to 18x and rolling forward to FY11F, being +0.6SD from its mean P/E of 15x.
Kuala Lumpur Kepong: We value KLK on a time-weighted (ie, calendarised) P/E of 18x FY11F EPS, around +1SD above its five-year historical average of 13.9x (unchanged). This is justified, in our view, since KLK has the strongest mature hectarage growth among large-cap Malaysian planters we cover (mature area expected to expand by >6% pa through to FY12F, on our estimates). Our PT is RM25.50, reflecting our FY11F estimates.
Genting Plantations: Our price target of RM10.50 is based on a target FY11F P/E of 18.0x (in line with our multiple for large-cap Malaysian planters). This valuation is +1.6x standard deviations above its historical mean P/E.
Golden Agri: We value the company at 16x FY11F P/E. We believe this mid-cycle valuation of +0.8x SD above the stock’s mean is reasonable in the context of our bullish CPO view. Our PT is S$0.90.
IndoAgri: We value the company at 16x FY11F P/E. We believe this valuation peg of +1x SD above its mean is reasonable, given our bullish CPO view. Our PT is S$3.40.
Astra Agro Lestari: We value Astra Agro on a 12M forward rolling FY11F P/E of 16x. We derive our PT by pegging it at +1SD above the stock’s mean P/E. Our PT is Rp28,400.
London Sumatra: We derive our price target of Rp3,040 (adjusting for a 1:5 share split from the earlier PT of Rp15,200) by pegging it to 15.3x FY11F P/E. This is based on a valuation of +0.9x above its standard deviation, which is fair in the current upcycle.
Wilmar: We value Wilmar on a SOTP basis by ascribing the bracketed multiples to its FY11F earnings from plantation (16x), palm and laurics (15x), consumer pack (20x), oilseed processing (15x), Sucrogen (15x) and other business (12x). We also value the Indonesia sugar business and the rice and flour business by probability adjusted-DCF. Our price target is S$5.60.
Olam: We use a residual dividend model, with an 8.75% cost of equity, a 2.5% terminal growth rate and a long-term ROE of 12% for Olam’s existing business. Building in our earnings estimates arrives at our core business value of S$3.40 for Olam. We add back the DCF value of the urea venture (S$0.40) and palm (S$0.06) to get our price target of S$3.90 (rounded).
Noble: We value Noble using a residual dividend model, with a 8.75% cost of equity, 2.5% terminal growth rate and long-term ROE of 12% to arrive at our price target of S$2.80.
Ruchi Soya: We value the company at 15x FY12F EPS and add Rs35 as the SOTP value of the plantations business to arrive at our PT of Rs170
KS Oils: We value KS Oils at 12x FY12F EPS (at a 20% discount to Ruchi Soya) to account for tax concerns to arrive at our PT of Rs67.
Mewah: We value Mewah on a SOTP basis, ascribing 13x to its bulk segment FY11F earnings (at 20% discount to Wilmar) and 16x to its consumer pack FY11F earnings (at 25% discount to Wilmar and Chinese downstream companies). Our price target is S$1.34.
Agri-Bites | ASEAN Tanuj Shori / Ken Arieff Wong
23 March 2011 Nomura 58
Capital Nomura Securities valuation methodologies
Charoen Pokphand Food: Price target is based on 12xFY11F EPS.
GFPT: GFPT is valued based on 10x FY11F EPS.
Khon Kaen Sugar Industry: Price target is based on DCF valuation, assuming a WACC at 8.0%, an FY11-15F net profit CAGR of 13% and long term growth of 3% .
Lamsoon (Thailand): Price target is based on 14x FY11F EPS.
Sri Trang Agro Industry: Price target is based on 11x FY11F EPS.
Thai Vegetable Oil: Price target is based on a 14x FY11F EPS.
Univanich Palm Oil: Price target is based on 11x to FY11F EPS.
Risks to our investment view Sime Darby: Downside risks include lower-than-expected FFB yields and slower-than-expected turnaround of its energy division.
IOI Corp: Downside risks include lower FFB yields than we expect, a collapse in agri-commodity prices, and poor property sales. Also, we do flag that 2Q FY11 production fell sharply (-20% y-y) relative to other planters – a possible near-term dampener on sentiment
Kuala Lumpur Kepong: Key downside risks include a sharp drop in agri-commodity prices, weaker than-expected production, lower margins at its downstream division, or weak sales at its retail arm.
Genting Plantations: The key risk to any upstream plantations is lower-than-expected CPO prices, lower-than-expected CPO production, not being able to maintain its planting targets, or commercialise the biotechnology venture, or lower-than-expected footfalls in the Johor Premium outlets.
Golden Agri: Downside risks include lower-than-expected production, a sharp fall in CPO prices, or any further environmental pushbacks against the group.
IndoAgri: Downside risks include lower-than-expected FFB production, a sharp fall in CPO prices, or low sugar contribution.
Astra Agro Lestari: Downside risks include lower-than-expected FFB production, a sharp fall in CPO prices and lower-than-expected plasma yields.
London Sumatra: Downside risks include lower-than-our expected CPO prices, weaker production and slower-than-our expected plantings.
Wilmar: Any delay in execution of Indonesian sugar plantation can have downsides to our price target and earnings estimates. Shortage of raw materials (eg, palm oil, oilseed) could hurt trading volumes of Wilmar’s merchandising and processing businesses. Reduced bargaining power attributable to falling demand could hurt profitability. Underlying growth in volumes and profitability could be constrained by the regulatory framework. Major fluctuations in raw material and product prices also represent a risk to profitability. Upside risks include faster-than-expected recovery in margins.
Olam: Any execution delay or substantial underperformance in the Gabon ventures can lead to downside to our price target. We are building in significant volume expansion in existing commodities. Any lower-than-expected contribution could negatively impact our estimates. Other downside risks include lower-than-expected contributions from associates and new investments; supply chain management; commodity and forex fluctuations; and a drop in world trade volumes. Volatility in almond prices could pose downside risk to our NPV calculations.
Agri-Bites | ASEAN Tanuj Shori / Ken Arieff Wong
23 March 2011 Nomura 59
Noble: The key company-specific risk in our view would be execution of its targeted processing facilities to generate more trading volumes. For example, it is targeting ~3mn MT of crushing capacity in Argentina (which would imply roughly 8% of Argentina’s crushing market) — the key risk in our view here would be tapping demand for these additional volumes of soy meal and soy oil. China currently satisfies most of its soy meal and soy oil requirements from soybeans crushed domestically and thus exporting crushed soy meal from Argentina to Europe or China is prone to demand risks.
Similarly, the sugar industry in Brazil is plagued with various regulations and the competition is heating up with global giants such as Bunge entering the market. Sustaining volumes with good profitability will remain a challenge, in our view.
Noble is the most leveraged name to commodity cycle. If commodity prices correct, the company’s earnings potential will get negatively impacted. To add, working capital may be a concern with rising commodity prices.
On the funding side, the interest cost can always be the swing factor because of ~80% leverage.
Ruchi Soya: Delay in ramp up of capacity utilization, muted margin expansion vs expectations, competition taking away volumes, delay in palm hectarage growth pose downside risks to our estimates and PT.
KS Oils: Delay in ramp up of capacity utilization, muted margin expansion vs expectations, competition taking away volumes, and any negative newsflow regarding tax investigations pose downside risks to our estimates and PT.
Mewah: Lower-than-expected volume growth, muted margin expansion, or a de-rating in valuation multiples on macro slowdown are downside risks to our estimates and PT.
Capital Nomura Securities investment risks
Charoen Pokphand Food: Downside risks to the price target include: 1) an increase in the price of feed mill’s raw materials (e.g. soybean meal and corn); 2) a fall in Thai broiler prices, and; 3) outbreak of an animal-related disease that would lower consumer confidence to eat meat products. Upside risks include: 1) outbreak of an animal-related disease in rival countries (eg, Brazil); 2) increasing demand for processed meat products in Europe and Japan, and; 3) an opportunity for Thailand to export fresh chicken meat to Japan and Russia
GFPT: Downside risks to the price target include: 1) an increase in the price of feed mills’ raw materials (eg, soybean meal and corn); 2) a fall in Thai broiler prices, and; 3) outbreak of an animal-related disease that would lower consumer confidence to eat chicken products. Upside risks include: 1) outbreak of an animal-related disease in rival countries (eg, Brazil); 2) increasing demand for processed chicken products in Europe and Japan, and; 3) opportunity for Thailand to export fresh chicken meat to Japan and Russia
Khon Kaen Sugar Industry: Upside risks to the price target include a recovery in world and domestic sugar prices to recent highs. Downside risks include: 1) futher lagging in sugar production at its Laos and Cambodia, and; 2) declining Thai ethanol price and consumption.
Lamsoon (Thailand): Downside risks to the price target include a decline in milling and refining margins of refined palm oil. Upside risks include an increase in the price of soybean oil.
Sri Trang Agro Industry: Downside risks to the price target include economic growth in major car-producing countries such as China, the US, Europe and Japan that is below expectations and decreasing demand for Thai rubber. Rubber price volatility will also impact STA’s gross margin. If the rubber price moves steadily upward, STA would

Agri-Bites | ASEAN Tanuj Shori / Ken Arieff Wong
23 March 2011 Nomura 60
likely have a higher gross margin. However, if rubber price swings up and down, STA would likely be unable to manage its inventory cost.
Thai Vegetable Oil: Downside risks to the price target include a decrease in the crushing margin of soybean meal. Upside risks include the supply and export climate of Argentina’s soybean meal, given that TVO’s rivals usually import soybean meal from low-cost producers in Argentina.
Univanich Palm Oil: Downside risks to the price target include an increase in the price of soybean oil / palm oil.

Agri-Bites | ASEAN Tanuj Shori / Ken Arieff Wong
23 March 2011 Nomura 61
Other Team Members: Tushar Mohata and Vishnuvardana Reddy (Associate) — All enquiries arising from this note should be directed to Tanuj Shori. Ploenjai Jirajarus (Capital Nomura Securities) — All enquiries arising from this note should be directed to Tanuj Shori.
Any Authors named on this report are Research Analysts unless otherwise indicated
Analyst Certification We, Tanuj Shori and Ken Wong, hereby certify (1) that the views expressed in this Research report accurately reflect our personal views about any or all of the subject securities or issuers referred to in this Research report, (2) no part of our compensation was, is or will be directly or indirectly related to the specific recommendations or views expressed in this Research report and (3) no part of our compensation is tied to any specific investment banking transactions performed by Nomura Securities International, Inc., Nomura International plc or any other Nomura Group company.
Important Disclosures Conflict-of-interest disclosures Important disclosures may be accessed through the following website: http://www.nomura.com/research/pages/disclosures/disclosures.aspx . If you have difficulty with this site or you do not have a password, please contact your Nomura Securities International, Inc. salesperson (1-877-865-5752) or email [email protected] for assistance. Online availability of research and additional conflict-of-interest disclosures Nomura Japanese Equity Research is available electronically for clients in the US on NOMURA.COM, REUTERS, BLOOMBERG and THOMSON ONE ANALYTICS. For clients in Europe, Japan and elsewhere in Asia it is available on NOMURA.COM, REUTERS and BLOOMBERG. Important disclosures may be accessed through the left hand side of the Nomura Disclosure web page http://www.nomura.com/research or requested from Nomura Securities International, Inc., on 1-877-865-5752. If you have any difficulties with the website, please email [email protected] for technical assistance. The analysts responsible for preparing this report have received compensation based upon various factors including the firm's total revenues, a portion of which is generated by Investment Banking activities. Industry Specialists identified in some Nomura International plc research reports are employees within the Firm who are responsible for the sales and trading effort in the sector for which they have coverage. Industry Specialists do not contribute in any manner to the content of research reports in which their names appear. Marketing Analysts identified in some Nomura research reports are research analysts employed by Nomura International plc who are primarily responsible for marketing Nomura’s Equity Research product in the sector for which they have coverage. Marketing Analysts may also contribute to research reports in which their names appear and publish research on their sector. Distribution of ratings (Global) Nomura Global Equity Research has 2027 companies under coverage. 48% have been assigned a Buy rating which, for purposes of mandatory disclosures, are classified as a Buy rating; 38% of companies with this rating are investment banking clients of the Nomura Group*. 38% have been assigned a Neutral rating which, for purposes of mandatory disclosures, is classified as a Hold rating; 48% of companies with this rating are investment banking clients of the Nomura Group*. 12% have been assigned a Reduce rating which, for purposes of mandatory disclosures, are classified as a Sell rating; 13% of companies with this rating are investment banking clients of the Nomura Group*. As at 31 December 2010. *The Nomura Group as defined in the Disclaimer section at the end of this report. Explanation of Nomura's equity research rating system in Europe, Middle East and Africa, US and Latin America for ratings published from 27 October 2008 The rating system is a relative system indicating expected performance against a specific benchmark identified for each individual stock. Analysts may also indicate absolute upside to target price defined as (fair value - current price)/current price, subject to limited management discretion. In most cases, the fair value will equal the analyst's assessment of the current intrinsic fair value of the stock using an appropriate valuation methodology such as discounted cash flow or multiple analysis, etc. STOCKS A rating of 'Buy', indicates that the analyst expects the stock to outperform the Benchmark over the next 12 months. A rating of 'Neutral', indicates that the analyst expects the stock to perform in line with the Benchmark over the next 12 months. A rating of 'Reduce', indicates that the analyst expects the stock to underperform the Benchmark over the next 12 months.
Agri-Bites | ASEAN Tanuj Shori / Ken Arieff Wong
23 March 2011 Nomura 62
A rating of 'Suspended', indicates that the rating and target price have been suspended temporarily to comply with applicable regulations and/or firm policies in certain circumstances including when Nomura is acting in an advisory capacity in a merger or strategic transaction involving the company. Benchmarks are as follows: United States/Europe: Please see valuation methodologies for explanations of relevant benchmarks for stocks (accessible through the left hand side of the Nomura Disclosure web page: http://www.nomura.com/research);Global Emerging Markets (ex-Asia): MSCI Emerging Markets ex-Asia, unless otherwise stated in the valuation methodology. SECTORS A 'Bullish' stance, indicates that the analyst expects the sector to outperform the Benchmark during the next 12 months. A 'Neutral' stance, indicates that the analyst expects the sector to perform in line with the Benchmark during the next 12 months. A 'Bearish' stance, indicates that the analyst expects the sector to underperform the Benchmark during the next 12 months. Benchmarks are as follows: United States: S&P 500; Europe: Dow Jones STOXX 600; Global Emerging Markets (ex-Asia): MSCI Emerging Markets ex-Asia. Explanation of Nomura's equity research rating system for Asian companies under coverage ex Japan published from 30 October 2008 and in Japan from 6 January 2009 STOCKS Stock recommendations are based on absolute valuation upside (downside), which is defined as (Target Price - Current Price) / Current Price, subject to limited management discretion. In most cases, the Target Price will equal the analyst's 12-month intrinsic valuation of the stock, based on an appropriate valuation methodology such as discounted cash flow, multiple analysis, etc. A 'Buy' recommendation indicates that potential upside is 15% or more. A 'Neutral' recommendation indicates that potential upside is less than 15% or downside is less than 5%. A 'Reduce' recommendation indicates that potential downside is 5% or more. A rating of 'Suspended' indicates that the rating and target price have been suspended temporarily to comply with applicable regulations and/or firm policies in certain circumstances including when Nomura is acting in an advisory capacity in a merger or strategic transaction involving the subject company. Securities and/or companies that are labelled as 'Not rated' or shown as 'No rating' are not in regular research coverage of the Nomura entity identified in the top banner. Investors should not expect continuing or additional information from Nomura relating to such securities and/or companies. SECTORS A 'Bullish' rating means most stocks in the sector have (or the weighted average recommendation of the stocks under coverage is) a positive absolute recommendation. A 'Neutral' rating means most stocks in the sector have (or the weighted average recommendation of the stocks under coverage is) a neutral absolute recommendation. A 'Bearish' rating means most stocks in the sector have (or the weighted average recommendation of the stocks under coverage is) a negative absolute recommendation. Explanation of Nomura's equity research rating system in Japan published prior to 6 January 2009 (and ratings in Europe, Middle East and Africa, US and Latin America published prior to 27 October 2008) STOCKS A rating of '1' or 'Strong buy', indicates that the analyst expects the stock to outperform the Benchmark by 15% or more over the next six months. A rating of '2' or 'Buy', indicates that the analyst expects the stock to outperform the Benchmark by 5% or more but less than 15% over the next six months. A rating of '3' or 'Neutral', indicates that the analyst expects the stock to either outperform or underperform the Benchmark by less than 5% over the next six months. A rating of '4' or 'Reduce', indicates that the analyst expects the stock to underperform the Benchmark by 5% or more but less than 15% over the next six months. A rating of '5' or 'Sell', indicates that the analyst expects the stock to underperform the Benchmark by 15% or more over the next six months. Stocks labeled 'Not rated' or shown as 'No rating' are not in Nomura's regular research coverage. Nomura might not publish additional research reports concerning this company, and it undertakes no obligation to update the analysis, estimates, projections, conclusions or other information contained herein. SECTORS A 'Bullish' stance, indicates that the analyst expects the sector to outperform the Benchmark during the next six months. A 'Neutral' stance, indicates that the analyst expects the sector to perform in line with the Benchmark during the next six months. A 'Bearish' stance, indicates that the analyst expects the sector to underperform the Benchmark during the next six months. Benchmarks are as follows: Japan: TOPIX; United States: S&P 500, MSCI World Technology Hardware & Equipment; Europe, by sector - Hardware/Semiconductors: FTSE W Europe IT Hardware; Telecoms: FTSE W Europe Business Services; Business Services: FTSE W Europe; Auto & Components: FTSE W Europe Auto & Parts; Communications equipment: FTSE W Europe IT Hardware; Ecology Focus: Bloomberg World Energy Alternate Sources; Global Emerging Markets: MSCI Emerging Markets ex-Asia.

Agri-Bites | ASEAN Tanuj Shori / Ken Arieff Wong
23 March 2011 Nomura 63
Explanation of Nomura's equity research rating system for Asian companies under coverage ex Japan published prior to 30 October 2008 STOCKS Stock recommendations are based on absolute valuation upside (downside), which is defined as (Fair Value - Current Price)/Current Price, subject to limited management discretion. In most cases, the Fair Value will equal the analyst's assessment of the current intrinsic fair value of the stock using an appropriate valuation methodology such as Discounted Cash Flow or Multiple analysis etc. However, if the analyst doesn't think the market will revalue the stock over the specified time horizon due to a lack of events or catalysts, then the fair value may differ from the intrinsic fair value. In most cases, therefore, our recommendation is an assessment of the difference between current market price and our estimate of current intrinsic fair value. Recommendations are set with a 6-12 month horizon unless specified otherwise. Accordingly, within this horizon, price volatility may cause the actual upside or downside based on the prevailing market price to differ from the upside or downside implied by the recommendation. A 'Strong buy' recommendation indicates that upside is more than 20%. A 'Buy' recommendation indicates that upside is between 10% and 20%. A 'Neutral' recommendation indicates that upside or downside is less than 10%. A 'Reduce' recommendation indicates that downside is between 10% and 20%. A 'Sell' recommendation indicates that downside is more than 20%. SECTORS A 'Bullish' rating means most stocks in the sector have (or the weighted average recommendation of the stocks under coverage is) a positive absolute recommendation. A 'Neutral' rating means most stocks in the sector have (or the weighted average recommendation of the stocks under coverage is) a neutral absolute recommendation. A 'Bearish' rating means most stocks in the sector have (or the weighted average recommendation of the stocks under coverage is) a negative absolute recommendation. Explanation of CNS rating system for Thailand companies under coverage published from 2 March 2009: Stocks: Stock recommendations are based on absolute valuation upside (downside), which is defined as (Fair Value - Current Price) / Current Price, subject to limited management discretion. In most cases, the Fair Value will equal the analyst's assessment of the current intrinsic fair value of the stock using an appropriate valuation methodology such as Discounted Cash Flow or Multiple analysis etc. However, if the analyst doesn't think the market will revalue the stock over the specified time horizon due to a lack of events or catalysts, then the fair value may differ from the intrinsic fair value. In most cases, therefore, our recommendation is an assessment of the difference between current market price and our estimate of current intrinsic fair value. Recommendations are set with a 6-12 month horizon unless specified otherwise. Accordingly, within this horizon, price volatility may cause the actual upside or downside based on the prevailing market price to differ from the upside or downside implied by the recommendation. A "Buy" recommendation indicates that potential upside is 15% or more. A "Neutral" recommendation indicates that potential upside is less than 15% or downside is less than 5%. A "Reduce" recommendation indicates that potential downside is 5% or more. Explanation of CNS rating system for Thailand companies under coverage published prior to 28 February 2009: Stocks: Stock recommendations are based on absolute valuation upside (downside), which is defined as (Fair Value - Current Price) / Current Price, subject to limited management discretion. In most cases, the Fair Value will equal the analyst's assessment of the current intrinsic fair value of the stock using an appropriate valuation methodology such as Discounted Cash Flow or Multiple analysis etc. However, if the analyst doesn't think the market will revalue the stock over the specified time horizon due to a lack of events or catalysts, then the fair value may differ from the intrinsic fair value. In most cases, therefore, our recommendation is an assessment of the difference between current market price and our estimate of current intrinsic fair value. Recommendations are set with a 6-12 month horizon unless specified otherwise. Accordingly, within this horizon, price volatility may cause the actual upside or downside based on the prevailing market price to differ from the upside or downside implied by the recommendation. A "Strong Buy" recommendation indicates that upside is more than 20%. A "Buy" recommendation indicates that upside is between 10% and 20%. A "Neutral" recommendation indicates that upside or downside is less than 10%. A "Reduce" recommendation indicates that downside is between 10% and 20%. A "Sell" recommendation indicates that downside is more than 20%. Sectors: (No change) A "Bullish" rating means most stocks in the sector have (or the weighted average recommendation of the stocks under coverage is) a positive absolute recommendation. A "Neutral" rating means most stocks in the sector have (or the weighted average recommendation of the stocks under coverage is) a neutral absolute recommendation. A "Bearish" rating means most stocks in the sector have (or the weighted average recommendation of the stocks under coverage is) a negative absolute recommendation.

Agri-Bites | ASEAN Tanuj Shori / Ken Arieff Wong
23 March 2011 Nomura 64
Target Price A Target Price, if discussed, reflect in part the analyst's estimates for the company's earnings. The achievement of any target price may be impeded by general market and macroeconomic trends, and by other risks related to the company or the market, and may not occur if the company's earnings differ from estimates. Disclaimers This publication contains material that has been prepared by the Nomura entity identified on the banner at the top or the bottom of page 1 herein and, if applicable, with the contributions of one or more Nomura entities whose employees and their respective affiliations are specified on page 1 herein or elsewhere identified in the publication. Affiliates and subsidiaries of Nomura Holdings, Inc. (collectively, the 'Nomura Group'), include: Nomura Securities Co., Ltd. ('NSC') Tokyo, Japan; Nomura International plc, United Kingdom; Nomura Securities International, Inc. ('NSI'), New York, NY; Nomura International (Hong Kong) Ltd., Hong Kong; Nomura Financial Investment (Korea) Co., Ltd., Korea (Information on Nomura analysts registered with the Korea Financial Investment Association ('KOFIA') can be found on the KOFIA Intranet at http://dis.kofia.or.kr ); Nomura Singapore Ltd., Singapore (Registration number 197201440E, regulated by the Monetary Authority of Singapore); Capital Nomura Securities Public Company Limited; Nomura Australia Ltd., Australia (ABN 48 003 032 513), regulated by the Australian Securities and Investment Commission and holder of an Australian financial services licence number 246412; P.T. Nomura Indonesia, Indonesia; Nomura Securities Malaysia Sdn. Bhd., Malaysia; Nomura International (Hong Kong) Ltd., Taipei Branch, Taiwan; Nomura Financial Advisory and Securities (India) Private Limited, Mumbai, India (Registered Address: Ceejay House, Level 11, Plot F, Shivsagar Estate, Dr. Annie Besant Road, Worli, Mumbai- 400 018, India; SEBI Registration No: BSE INB011299030, NSE INB231299034, INF231299034, INE 231299034). THIS MATERIAL IS: (I) FOR YOUR PRIVATE INFORMATION, AND WE ARE NOT SOLICITING ANY ACTION BASED UPON IT; (II) NOT TO BE CONSTRUED AS AN OFFER TO SELL OR A SOLICITATION OF AN OFFER TO BUY ANY SECURITY IN ANY JURISDICTION WHERE SUCH OFFER OR SOLICITATION WOULD BE ILLEGAL; AND (III) BASED UPON INFORMATION THAT WE CONSIDER RELIABLE. NOMURA GROUP DOES NOT WARRANT OR REPRESENT THAT THE PUBLICATION IS ACCURATE, COMPLETE, RELIABLE, FIT FOR ANY PARTICULAR PURPOSE OR MERCHANTABLE AND DOES NOT ACCEPT LIABILITY FOR ANY ACT (OR DECISION NOT TO ACT) RESULTING FROM USE OF THIS PUBLICATION AND RELATED DATA. TO THE MAXIMUM EXTENT PERMISSIBLE ALL WARRANTIES AND OTHER ASSURANCES BY NOMURA GROUP ARE HEREBY EXCLUDED AND NOMURA GROUP SHALL HAVE NO LIABILITY FOR THE USE, MISUSE, OR DISTRIBUTION OF THIS INFORMATION. Opinions expressed are current opinions as of the original publication date appearing on this material only and the information, including the opinions contained herein, are subject to change without notice. Nomura is under no duty to update this publication. If and as applicable, NSI's investment banking relationships, investment banking and non-investment banking compensation and securities ownership (identified in this report as 'Disclosures Required in the United States'), if any, are specified in disclaimers and related disclosures in this report. In addition, other members of the Nomura Group may from time to time perform investment banking or other services (including acting as advisor, manager or lender) for, or solicit investment banking or other business from, companies mentioned herein. Furthermore, the Nomura Group, and/or its officers, directors and employees, including persons, without limitation, involved in the preparation or issuance of this material may, to the extent permitted by applicable law and/or regulation, have long or short positions in, and buy or sell, the securities (including ownership by NSI, referenced above), or derivatives (including options) thereof, of companies mentioned herein, or related securities or derivatives. For financial instruments admitted to trading on an EU regulated market, Nomura Holdings Inc's affiliate or its subsidiary companies may act as market maker or liquidity provider (in accordance with the interpretation of these definitions under FSA rules in the UK) in the financial instruments of the issuer. Where the activity of liquidity provider is carried out in accordance with the definition given to it by specific laws and regulations of other EU jurisdictions, this will be separately disclosed within this report. Furthermore, the Nomura Group may buy and sell certain of the securities of companies mentioned herein, as agent for its clients. Investors should consider this report as only a single factor in making their investment decision and, as such, the report should not be viewed as identifying or suggesting all risks, direct or indirect, that may be associated with any investment decision. Please see the further disclaimers in the disclosure information on companies covered by Nomura analysts available at www.nomura.com/research under the 'Disclosure' tab. Nomura Group produces a number of different types of research product including, among others, fundamental analysis, quantitative analysis and short term trading ideas; recommendations contained in one type of research product may differ from recommendations contained in other types of research product, whether as a result of differing time horizons, methodologies or otherwise; it is possible that individual employees of Nomura may have different perspectives to this publication. NSC and other non-US members of the Nomura Group (i.e. excluding NSI), their officers, directors and employees may, to the extent it relates to non-US issuers and is permitted by applicable law, have acted upon or used this material prior to, or immediately following, its publication. Foreign-currency-denominated securities are subject to fluctuations in exchange rates that could have an adverse effect on the value or price of, or income derived from, the investment. In addition, investors in securities such as ADRs, the values of which are influenced by foreign currencies, effectively assume currency risk. The securities described herein may not have been registered under the US Securities Act of 1933, and, in such case, may not be offered or sold in the United States or to US persons unless they have been registered under such Act, or except in compliance with an exemption from the registration requirements of such Act. Unless governing law permits otherwise, you must contact a Nomura entity

Agri-Bites | ASEAN Tanuj Shori / Ken Arieff Wong
23 March 2011 Nomura 65
in your home jurisdiction if you want to use our services in effecting a transaction in the securities mentioned in this material. This publication has been approved for distribution in the United Kingdom and European Union as investment research by Nomura International plc ('NIPlc'), which is authorized and regulated by the UK Financial Services Authority ('FSA') and is a member of the London Stock Exchange. It does not constitute a personal recommendation, as defined by the FSA, or take into account the particular investment objectives, financial situations, or needs of individual investors. It is intended only for investors who are 'eligible counterparties' or 'professional clients' as defined by the FSA, and may not, therefore, be redistributed to retail clients as defined by the FSA. This publication may be distributed in Germany via Nomura Bank (Deutschland) GmbH, which is authorized and regulated in Germany by the Federal Financial Supervisory Authority ('BaFin'). This publication has been approved by Nomura International (Hong Kong) Ltd. ('NIHK'), which is regulated by the Hong Kong Securities and Futures Commission, for distribution in Hong Kong by NIHK. This publication has been approved for distribution in Australia by Nomura Australia Ltd, which is authorized and regulated in Australia by the Australian Securities and Investment Commission ('ASIC'). This publication has also been approved for distribution in Malaysia by Nomura Securities Malaysia Sdn Bhd. In Singapore, this publication has been distributed by Nomura Singapore Limited ('NSL'). NSL accepts legal responsibility for the content of this publication, where it concerns securities, futures and foreign exchange, issued by their foreign affiliates in respect of recipients who are not accredited, expert or institutional investors as defined by the Securities and Futures Act (Chapter 289). Recipients of this publication should contact NSL in respect of matters arising from, or in connection with, this publication. Unless prohibited by the provisions of Regulation S of the U.S. Securities Act of 1933, this material is distributed in the United States, by Nomura Securities International, Inc., a US-registered broker-dealer, which accepts responsibility for its contents in accordance with the provisions of Rule 15a-6, under the US Securities Exchange Act of 1934. This publication has not been approved for distribution in the Kingdom of Saudi Arabia or to clients other than 'professional clients' in the United Arab Emirates by Nomura Saudi Arabia, Nomura International plc or any other member of the Nomura Group, as the case may be. Neither this publication nor any copy thereof may be taken or transmitted or distributed, directly or indirectly, by any person other than those authorised to do so into the Kingdom of Saudi Arabia or in the United Arab Emirates or to any person located in the Kingdom of Saudi Arabia or to clients other than 'professional clients' in the United Arab Emirates. By accepting to receive this publication, you represent that you are not located in the Kingdom of Saudi Arabia or that you are a 'professional client' in the United Arab Emirates and agree to comply with these restrictions. Any failure to comply with these restrictions may constitute a violation of the laws of the Kingdom of Saudi Arabia or the United Arab Emirates. No part of this material may be (i) copied, photocopied, or duplicated in any form, by any means; or (ii) redistributed without the prior written consent of the Nomura Group member identified in the banner on page 1 of this report. Further information on any of the securities mentioned herein may be obtained upon request. If this publication has been distributed by electronic transmission, such as e-mail, then such transmission cannot be guaranteed to be secure or error-free as information could be intercepted, corrupted, lost, destroyed, arrive late or incomplete, or contain viruses. The sender therefore does not accept liability for any errors or omissions in the contents of this publication, which may arise as a result of electronic transmission. If verification is required, please request a hard-copy version. Additional information available upon request NIPlc and other Nomura Group entities manage conflicts identified through the following: their Chinese Wall, confidentiality and independence policies, maintenance of a Restricted List and a Watch List, personal account dealing rules, policies and procedures for managing conflicts of interest arising from the allocation and pricing of securities and impartial investment research and disclosure to clients via client documentation. Disclosure information is available at the Nomura Disclosure web page: http://www.nomura.com/research/pages/disclosures/disclosures.aspx
Nomura Singapore Limited Tel: +65 6433 6288 5 Temasek Boulevard #11-01, Suntec Tower Five,
Singapore 038985, Singapore Fax: + 65 6433 6169
MICA (P) 108/07/2010 valid until 1 July 2011 / RCB no: 197201440E
Caring for the environment: to receive only the electronic versions of our research, please contact your
sales representative.