asean equity fund - saturna sdn bhd · 2017-04-22 · asean equity fund annual report 31 december...
TRANSCRIPT

ASEAN Equity Fund
Annual Report 31 December 2016
Fund ManagerSATURNA SDN BHD (342171-V)Suite 5-03, 5th Floor, Menara Atlan161B Jalan Ampang, 50450 Kuala LumpurTel: (603)2164 5303 Fax: (603)2164 5308Email: [email protected] Website: www.saturna.com.my
TrusteeSCBMB TRUSTEE BERHAD (1005793-T)

2 ASEAN Equity Fund Annual Report 31 December 2016
CONTENTS
1. FUND MANAGER'S REPORT 3
Fund Name 3
Type of Fund 3
Category of Fund 3
Investment Objective 3
Distribution Policy 3
Breakdown of Unit Holdings By Size 3
Performance Benchmark 3
Fund Performance 3
Financial Performance 4
Average Total Return 4
Stock Market Review 5
Market Outlook and Investment Strategy 5
Asset Allocation of The Fund 5
Details of Distribution and Unit Split 6
Disclosure of Circumstances That Materially Affect the Interest of the Unitholder
6
Policy on Stockbroking, Rebates, and Soft Commission 6
Purification 6
2. TRUSTEE’S REPORT 6
3. STATEMENT BY FUND MANAGER 6
4. INDEPENDENT AUDITOR’S REPORT 7
5. SHARIAH ADVISOR’S REPORT 8
6. STATEMENT OF FINANCIAL POSITION 9
7. STATEMENT OF COMPREHENSIVE INCOME 10
8. STATEMENT OF CHANGES IN NET ASSET VALUE 11
9. STATEMENT OF CASH FLOWS 12
10. NOTES TO THE FINANCIAL STATEMENTS 13-31
11. CORPORATE INFORMATION 32

31 December 2016 Annual Report ASEAN Equity Fund 3
1. FUND MANAGER’S REPORT
FUND NAME
ASEAN Equity Fund (“the Fund”)
TYPE OF FUND
Growth Fund
CATEGORY OF FUND
Shariah-compliant Equity (wholesale)
INVESTMENT OBJECTIVE
To achieve long-term capital growth by investing in Southeast Asian markets.
DISTRIBUTION POLICY
Subject to availability of income, distributions will be made on a yearly basis.
Any distributions shall be automatically reinvested in additional Units at the date of distribution, unless the Unitholder specifically requests, in the application or in writing, for distributions to be made via cash payment. Any unclaimed distribution cheques will be automatically reinvested in additional Units at the expiry of the six-month validity period for cheques, based on the prevailing Net Asset Value (NAV) seven (7) Business Days after the validity period of the cheques.
BREAKDOWN OF UNIT HOLDINGS BY SIZE
Units No. of Unitholders % Unit holdings %
50,001 to 100,000 1 20.00 93,730 0.88
100,001 to 500,000 2 40.00 528,867 4.99
500,001 to 1,000,000 1 20.00 500,770 4.72
1,000,001 & above 1 20.00 9,481,620 89.41
Total 5 100.00 10,604,987 100.00
PERFORMANCE BENCHMARK
Dow Jones Islamic Market ASEAN Total Return Index (“the Benchmark”)
FUND PERFORMANCE
In 2016, the Fund registered a return of 0.41% compared to the Benchmark’s 6.94%. The underperformance was primarily due to our lower weighting in Thailand equity market which performed well during the year. It was also affected as cash was held for strategic purposes.
-5
0
5%
10%
15%
20%
25%
12/30/1
6
9/30/1
6
6/30/1
6
3/31/1
6
12/31/1
5
9/30/1
5
6/30/1
5
3/31/1
5
12/31/1
4
9/30/1
4
6/30/1
4
3/31/1
4
2/7/1
4
Performance of the FundFrom 7 February 2014 to 31 December 2016(Since inception)
ASEAN Equity Fund
Dow Jones Islamic Market ASEAN Total Return Index

4 ASEAN Equity Fund Annual Report 31 December 2016
FINANCIAL PERFORMANCE
As at 31 Dec 2016 31 Dec 2015
Net Asset Value (RM) 11,714,486 11,666,526
Units in Circulation (units) 10,604,987 10,604,987
Net Asset Value / unit (RM) 1.1046 1.1001
Highest NAV (RM) 1.1626 1.1278
Lowest NAV (RM) 1.0396 1.0125
Total Return
Capital growth 0.41% 3.51%
Income distribution - -
Final Distribution
Gross Distribution/unit - -
Net Distribution/unit - -
Date of Distribution - -
Portfolio Composition
Quoted Equity Securities 80.72% 89.89%
Other Liquid Assets 19.28% 10.11%
Management Expense Ratio 0.92% 1.16%
Portfolio Turnover Ratio 0.16 times 0.11 times
Official Launching Date 7 February 2014 7 February 2014
Management Expense Ratio
The management expense ratio for the financial year is 0.92%.
Management Expense Ratio is derived from the following calculation:
MER = (A+B+C+D+E+F+G)
x100H
A = Administration Fee
B = Distribution Fee
C = Trustee Fee
D = Performance Fee
E = Audit Fee
F = Tax Agent’s Fee
G = Other Expenses
H = Average NAV of the Fund calculated on a daily basis
The average NAV of the Fund for the financial year calculated on a daily basis is RM11,703,693.30.
Portfolio Turnover Ratio
The portfolio turnover ratio for the current financial year is 0.16 times.
The portfolio turnover ratio is derived from the following calculation:
( Total acquisition for the financial year +
Total disposal for the financial year) ÷ 2
Average NAV of the Fund for the financial year calculated on a daily basis
Where:total acquisition for the financial year = RM 1,479,479.14total disposal for the financial year = RM 2,266,109.09
TOTAL RETURN (in %)
Total Return is based on NAV to NAV with distribution reinvested. Below is total return of the Fund as at 31 December 2016 since inception.
(1 Jan 16 – 31 Dec 16)
(01 Jan 15 – 31 Dec 15)
Since Inception (07 Feb 14 – 31 Dec 16)
0.41% 3.51% 10.46%
Note:Total Return of the Fund is derived by this formula:
([End of Period FY
Current Year NAV per unit
] - 1 ) x100
End of Period FY Previous Year
NAV per unit
AVERAGE TOTAL RETURN (in %)
Average Total Return is derived by the formula:
Total Return
Number of Years Under Review
Since Inception (07 Feb 14 – 31 Dec 16)
3.50%
Unit prices and return may fluctuate. Past performance is not necessarily indicative of future performance.

31 December 2016 Annual Report ASEAN Equity Fund 5
2016 was an eventful year for financial markets across the globe. The unanticipated victory for Donald Trump in the United States, as well as BREXIT, were few key events to name. Among ASEAN equity markets, Indonesia and Thailand recorded strong gains, Singapore was up mildly while Malaysia and Philippines both ended flat in 2016.
ASEAN equity markets in general were performing well in prior quarters before getting hit in the fourth quarter by concerns on international trade and the global political landscape after a surprise victory of Donald Trump. To recall, Trump has proposed a tariff of as much as 45% on all imports from China, a top-5 ASEAN trading partner, if it keeps its currency artificially low and continues to subsidize its industries to stay competitive. Such US policies could make China less competitive and hurt its exports over the long run. As investors bet on economic growth in the US and contemplate continued slowdown in China – and by extension across ASEAN – they are reallocating investment capital away from these emerging Asian markets and into the US. This is reflected in continued weakness in the Chinese Yuan, as well as most ASEAN currencies, relative to the US dollar, and the ASEAN market weakness post Trump-victory.
Thailand’s equity market gained 23.9% in 2016, making it the best performing market in the region. The news of the passing of the Thai King had no major impact on the equity markets and the market continued to perform well. Government stimulus measures to boost consumption as well as an anticipation of improved infrastructure spending in the upcoming year have been able to keep the market at elevated levels.
Indonesia also recorded strong gains as the equity index gained 17.5% in 2016. The strong performance was driven by improving commodity prices and as government infrastructure projects gained traction.
Philippines market was only up 0.2% in 2016 after weak performance in the final quarter. It was performing well during the second and third quarter of 2016 as market cheered the unanticipated victory of Rodrigo Duterte. It was, however, short-lived as heavy outflows of funds during the fourth quarter caused the market to decline by more than 10%, wiping out all the gains in the previous quarters. Elsewhere, Singapore equity market closed up 3.8% while Malaysia ended the year flat as it continued to be impacted by the currency and other domestic economic concerns.
MARKET OUTLOOK AND INVESTMENT STRATEGY
We continue to be cautious on the ASEAN region in the near to mid-term, as tepid exports and volatile currencies post-Trump, China slowdown, and future Fed rate hikes may continue to impact the economies of the region. In our view, infrastructure spending would continue to be a key theme for the region as we move towards 2017. We will also continue to look for other exciting catalysts throughout the year and take appropriate long-term positions. Within the region, we are bullish on Indonesia and Philippines while being neutral on Malaysia, Thailand and Singapore.
ASSET ALLOCATION OF THE FUND
For year ended December 31 2016 2015
Sector Allocation as at 31 December 2016Sector % of NAV % of NAV
Cash & Other Liquid Assets 19.2 10.1 Cash & Other Liquid Assets
Communications 15.4 16.2 Communications
Consumer Discretionary 10.6 14.9 Consumer Discretionary
Materials 12.3 13.7 Consumer Staples
Consumer Staples 9.0 11.5 Materials
Health Care 9.4 11.1 Health Care
Financials 11.9 11.2 Industrials
Industrials 6.0 6.8 Financials
Utilities 3.4 2.9 Others
Energy 2.8 1.6
Total 100.0 100.0
Fund performance from 1 January 2016 to 31 December 2016
31 December 2016 31 December 2015
Total NAV (Inclusive of Injection) NAV/unit
11,714,486 11,666,526
1.1046 1.1001
Top Five Investments
as at 31 December 2016
Stock % of NAV
Telekomunikasi Indonesia 4.2
Kalbe Farma 3.7
Syarikat Takaful Malaysia Bhd 3.4
Unilever Indonesia 3.3
Matahari Department Store 3.1
STOCK MARKET REVIEW

6 ASEAN Equity Fund Annual Report 31 December 2016
2. TRUSTEE’S REPORTTO THE UNITHOLDERS OF ASEAN EQUITY FUND
We have acted as Trustee for ASEAN Equity Fund (“the Fund”) for the financial year ended 31 December 2016. To the best of our knowledge, for the year under review, Saturna Sdn. Bhd. (“the Manager”) has operated and managed the Fund in accordance with the following:
a) limitations imposed on the investment powers of the Manager and the Trustee under the Deeds, the SC’s Guidelines on Unlisted Capital Market Products under The Lodge and Launch Framework, the Capital Markets and Services Act 2007 and other applicable laws;
b) the valuation/pricing for the Fund has been carried out in accordance with the Deed of the Fund and applicable regulatory requirements; and
c) creation and cancellation of units for the Fund have been carried out in accordance with the Deed of the Fund and applicable regulatory requirements.
For SCBMB Trustee Berhad
Khoo Leng KeeChief Executive Officer
Dated: 16 February 2017Kuala Lumpur
3. STATEMENT BY THE FUND MANAGERFor the Financial Year Ended 31 December 2016
We, MONEM A. SALAM and DATO’ DR. LEE CHEE KUON, being two of the directors of Saturna Sdn. Bhd., do hereby state that, in the opinion of the Manager, the accompanying financial statements are drawn up in accordance with Malaysian Financial Reporting Standards and International Financial Reporting Standards and the requirements of the Securities Commission’s Guidelines on Unlisted Capital Market Products under The Lodge and Launch Framework in Malaysia so as to give a true and fair view of the financial position of ASEAN EQUITY FUND at 31 December 2016 and of its financial performance and cash flows for the financial period then ended on that date and comply with the requirements of the Deed.
On behalf of the Board in accordance with a resolution of the Board of Directors of the Manager
Monem Salam Dato’ Dr. Lee Chee KuonPresident, Saturna Sdn Bhd Director, Saturna Sdn BhdPortfolio Manager
Kuala Lumpur, Malaysia16 February 2017
DETAILS OF DISTRIBUTION AND UNIT SPLIT
For the period under review, no distribution or unit split was made by the Fund.
DISCLOSURE OF CIRCUMSTANCES THAT MATERIALLY AFFECT ANY INTEREST OF THE UNITHOLDER
For the period under review, there were no circumstances that materially affect any interest of the Unitholder.
POLICY ON STOCKBROKING, REBATES, AND SOFT COMMISSION
The Fund Manager does not retain any rebate from, or otherwise share in any commission with, any broker/dealer in consideration for directing dealings in the investments of the Fund. Accordingly, any rebate or shared commission will be directed to the account of the Fund. The Fund Manager may direct portfolio trades to Saturna Brokerage Services, Inc., an affiliated brokerage firm, provided, however, that the Fund pays no brokerage commission or other charges on such trades.
PURIFICATION
This is a voluntary provision due to non Shariah-compliant exposures of the Fund’s holdings, e.g., riba-based loans and interest income. According to purification guidelines, as stipulated in the Information Memorandum, the per unit amount comes to RM 0.0016, if you owned shares from inception to 31 December. Please use the example below to calculate your individual amount. You should channel your purification to charitable organizations of your choice.
Example:
The calculation:
Units Owned x Purification Amount Per Share = Total Due (RM)
If an investor held 100,000 units of AEF since 1 January 2015, the calculation of the amount to be purified as of 31 December 2016 would be 100,000 units x RM 0.0016 per unit = RM 160.

31 December 2016 Annual Report ASEAN Equity Fund 7
4. INDEPENDENT AUDITORS’ REPORT TO THE UNITHOLDERS OF ASEAN EQUITY FUND
Report on the Financial Statements
Opinion
We have audited the financial statements of ASEAN Equity Fund, which comprise the statement of financial position as at 31 December 2016, and the statement of profit or loss and other comprehensive income, statement of changes in net asset value and statement of cash flows for the financial year then ended, and notes to the financial statements, including a summary of significant accounting policies and other explanatory information, as set out on pages 5 to 31.
In our opinion, the accompanying financial statements give a true and fair view of the financial position of the Fund as at 31 December 2016, and of its financial performance and its cash flows for the financial year then ended in accordance with Malaysian Financial Reporting Standards and International Financial Reporting Standards.
Basis for Opinion
We conducted our audit in accordance with approved standards on auditing in Malaysia and International Standards on Auditing. Our responsibilities under those standards are further described in the Auditors’ Responsibilities for the Audit of the Financial Statements section of our report. We believe that the audit evidence we have obtained is sufficient and appropriate to provide a basis for our opinion.
Independence and Other Ethical Responsibilities
We are independent of the Fund in accordance with the By-Laws (on Professional Ethics, Conduct and Practice) of the Malaysian Institute of Accountants (“By- Laws”) and the International Ethics Standards Board for Accountants’ Code of Ethics for Professional Accountants (“IESBA Code”), and we have fulfilled our other ethical responsibilities in accordance with the By-Laws and the IESBA Code.
Information Other than the Financial Statements and Auditors’ Report Thereon
The manager of the Fund is responsible for the other information. The other information comprises the information included in the annual report, but does not include the financial statements of the Fund and our auditors’ report thereon.
Our opinion on the financial statements of the Fund does not cover the other information and we do not express any form of assurance conclusion thereon.
In connection with our audit of the financial statements of the Fund, our responsibility is to read the other information and, in doing so, consider whether the other information is materially inconsistent with the financial statements of the Fund or our knowledge obtained in the audit or otherwise appears to be materially misstated.
If, based on the work we have performed, we conclude that there is a material misstatement of this other information, we are required to report that fact. We have nothing to report in this regard.
Responsibility of the Manager’s and Trustee’s for the Financial Statements
The Manager of the Fund is responsible for the preparation of financial statements of the Fund that give a true and fair view in accordance with Malaysian Financial Reporting Standards and International Financial Reporting Standards. The Manager of the Fund is also responsible for such internal control as the Manager of the Fund determines is necessary to enable the preparation of financial statements of the Fund that are free from material misstatement, whether due to fraud or error. The Trustee is responsible for ensuring that the Manager of the Fund maintains proper accounting and other records as are necessary to enable fair presentation of these financial statements.
In preparing the financial statements of the Fund, the Manager are responsible for assessing the Fund’s ability to continue as a going concern, disclosing, as applicable, matters related to going concern and using the going concern basis of accounting unless the Manager either intend to liquidate the Fund or to cease operations, or have no realistic alternative but to do so.
Auditors’ Responsibilities for the Audit of the Financial Statements
Our objectives are to obtain reasonable assurance about whether the financial statements of the Fund as a whole are free from material misstatement, whether due to fraud or error, and to issue an auditors’ report that includes our opinion. Reasonable assurance is a high level of assurance, but is not a guarantee that an audit conducted in accordance with approved standards on auditing in Malaysia and International Standards on Auditing will always detect a material misstatement when it exists. Misstatements can arise from fraud or error and are considered material if, individually or in the aggregate, they could reasonably be expected to influence the economic decisions of users taken on the basis of these financial statements.
As part of an audit in accordance with approved standards on auditing in Malaysia and International Standards on Auditing, we exercise professional judgement and maintain professional scepticism throughout the audit. We also:
• Identify and assess the risks of material misstatement of the financial statements of the Fund, whether due to fraud or error, design and perform audit procedures responsive to those risks, and obtain audit evidence that is sufficient and appropriate to provide a basis for our opinion. The risk of not detecting a material misstatement resulting from fraud is higher than for one resulting from error, as fraud may involve collusion, forgery, intentional omissions, misrepresentations, or the override of internal control.

8 ASEAN Equity Fund Annual Report 31 December 2016
4. INDEPENDENT AUDITORS’ REPORT TO THE UNITHOLDERS OF ASEAN EQUITY FUND
We have acted as the Shariah Advisor of ASEAN Equity Fund. Our responsibility is to ensure that the procedures and processes employed by Saturna Sdn Bhd and the provisions of the Deed dated 23 November 2015 is in accordance with Shariah principles.
In our opinion, the Fund has been managed and administered in accordance with the Guidelines set by the Securities Commission’s Shariah Advisory Council and/or the rulings established by Group Shariah Committee of Amanie Advisors Sdn Bhd
In addition, we also confirm that the investment portfolio of the Fund comprises securities that have been classified as Shariah-compliant by the Shariah Advisory Council of the
Securities Commission (“SACSC”). As for the securities that are not certified by the SACSC, we have reviewed the said securities and opine that these securities are designated as Shariah-compliant.
For Amanie Advisors Sdn Bhd
Datuk Dr. Mohd Daud BakarExecutive Chairman
Kuala Lumpur, Malaysia16 February 2017
5. SHARIAH ADVISOR’S REPORT
Auditors’ Responsibilities for the Audit of the Financial Statements (cont’d)
As part of an audit in accordance with approved standards on auditing in Malaysia and International Standards on Auditing, we exercise professional judgement and maintain professional scepticism throughout the audit. We also: (cont’d)
• Obtain an understanding of internal control relevant to the audit in order to design audit procedures that are appropriate in the circumstances, but not for the purpose of expressing an opinion on the effectiveness of the Fund’s internal control.
• Evaluate the appropriateness of accounting policies used and the reasonableness of accounting estimates and related disclosures made by the directors.
• Conclude on the appropriateness of the Manager’s use of the going concern basis of accounting and, based on the audit evidence obtained, whether a material uncertainty exists related to events or conditions that may cast significant doubt on the Fund’s ability to continue as a going concern. If we conclude that a material uncertainty exists, we are required to draw attention in our auditors’ report to the related disclosures in the financial statements of the Fund or, if such disclosures are inadequate, to modify our opinion. Our conclusions are based on the audit evidence obtained up to the date of our auditors’ report. However, future events or conditions may cause the Fund to cease to continue as a going concern.
• Evaluate the overall presentation, structure and content of the financial statements of the Fund, including the disclosures, and whether the financial statements of the Fund represent the underlying transactions and events in a manner that achieves fair presentation.
We communicate with the Manager regarding, among other matters, the planned scope and timing of the audit and significant audit findings, including any significant deficiencies in internal control that we identify during our audit.
Other Matters
This report is made solely to the Unitholders of the Fund and for no other purpose. We do not assume responsibility to any other person for the content of this report.
Crowe Horwath Lee Kok WaiFirm No: AF 1018 Approval No: 02760/06/18 (J) Chartered Accountants Chartered Accountant
16 February 2017Kuala Lumpur
Report on the Financial Statements (continued)

31 December 2016 Annual Report ASEAN Equity Fund 9
6. STATEMENT OF FINANCIAL POSITION
Opinion
In the opinion of the Fund Manager, the financial statements have been properly drawn up in accordance with Malaysian Financial Reporting Standards and the requirements of the Securities Commission’s Guidelines on Unlisted Capital Market Products under The Lodge and Launch Framework so as to give a true and fair view of the financial position of the Fund as at 31 December 2016 and of its financial performance, the changes in net asset value and the cash flows of the Fund for the period then ended.
As at 31 December 2016 As at 31 December 2015
RM RM
Investments
Financial assets at fair value through profit or loss 9,455,920 10,486,505
Shariah-based deposits 2,196,390 -
11,652,310 10,486,505
Other Assets
Amount due from stockbrokers - -
Amount due from management company - -
Cash at bank 97,642 1,229,009
Other receivable 11,196 12,541
108,838 1,241,550
Total Assets 11,761,148 11,728,055
Liabilities
Amount due to manager 31,311 46,182
Amount due to trustee 511 1,567
Other payables 14,840 13,780
46,662 61,529
Net asset value attributable to Unitholders 11,714,486 11,666,526
Total equity and liabilities 11,761,148 11,728,055
Number of units in circulation 10,604,987 10,604,987
Net asset value per unit 1.1046 1.1001

10 ASEAN Equity Fund Annual Report 31 December 2016
7. STATEMENT OF COMPREHENSIVE INCOME
For the financial year ended 31 December 2016
1 January 2016 to 31 December 2016
1 January 2015 to 31 December 2015
RM RM
Income
Profit from short-term Shariah-based deposits 53,288 57,909
Gross Dividends Income 389,037 288,674
Net (loss)/gain on financial assets at fair value through profit or loss (243,960) 219,155
Net loss on foreign exchange (3,021) (1,517)
195,344 564,221
Less: Expenses
Administration fee 29,247 28,244
Distribution fee 29,247 28,244
Performance fee 4,733 39,500
Trustee's fee 5,849 5,649
Safe Custody fee 2,986 3,345
Transaction fee 11,396 5,624
Auditors' fee 11,000 10,000
Tax agent’s fee 4,630 3,000
Other expenses 8,340 7,668
107,428 131,274
Net profit before taxation 87,916 432,947
Taxation (39,956) (37,088)
Net profit after taxation 47,960 395,859
Net profit after taxation is made up as follows:
Realized 228,295 123,437
Unrealized (180,335) 272,422

31 December 2016 Annual Report ASEAN Equity Fund 11
8. STATEMENT OF CHANGES IN NET ASSET VALUE
For the financial year ended 31 December 2016
Unitholders’ Capital
Retained Earnings
Total Net Asset Value
RM RM RM
Net asset value as at 1 January 2015 10,271,620 644,948 10,916,568
Movement due to creation/(cancellation) of units during the period:
Creation of units 354,099 - 354,099
Cancellation of units - - -
Total comprehensive Income for the financial year - 395,859 395,859
Net asset value as at 31 December 2015 10,625,719 1,040,807 11,666,526
Net asset value as at 1 January 2016 10,625,719 1,040,807 11,666,526
Movement due to creation/(cancellation) of units during the period:
Creation of units - - -
Cancellation of units - - -
Total comprehensive Income for the financial year - 47,960 47,960
Net asset value as at 31 December 2016 10,625,719 1,088,767 11,714,486

12 ASEAN Equity Fund Annual Report 31 December 2016
9. STATEMENT OF CASH FLOWSFor the financial year ended 31 December 2016
1 January 2016 to 31 December 2016
1 January 2015 to 31 December 2015
RM RM
Cash flows from operating activities and investing activities
Proceeds from sale of investments 2,266,109 484,761
Purchase of investments (1,479,479) (1,943,859)
Dividend received 348,296 242,528
Profit Murabahah received 52,390 59,133
Administration fee paid (30,963) (29,396)
Audit fee paid (11,836) (11,538)
Performance fee paid (41,869) (64,665)
Distribution fee paid (9,058) (42,114)
Trustee's fee paid (6,906) (5,703)
Tax Agent fee paid (5,099) (3,373)
Payment for other fees and expenses (16,562) (10,099)
Tax Recoverable - -
Net cash generated from/(used in) operating activities 1,065,023 (1,324,325)
Cash flows from financing activities
Proceeds from issuance of units - 354,099
Payments for cancellation of units - -
Net cash generated / (used in) from financing activities - 354,099
Net increase / (decrease) in cash and cash equivalents 1,065,023 (970,226)
Cash and cash equivalents at beginning of the period 1,229,009 2,199,235
Cash and cash equivalents at end of the period 2,294,032 1,229,009
Cash and cash equivalents comprise:
Cash at bank 97,642 1,229,009
Shariah-based deposits 2,196,390 -
2,294,032 1,229,009

31 December 2016 Annual Report ASEAN Equity Fund 13
10. NOTES TO THE FINANCIAL STATEMENTS
FOR THE FINANCIAL PERIOD FROM 1 JANUARY 2016 TO 31 DECEMBER 2016
1. THE FUND, THE MANAGER AND THEIR PRINCIPAL ACTIVITIES
ASEAN Equity Fund (hereinafter referred to as “the Fund”) was constituted pursuant to the execution of a Trust Deed dated 16 December 2013 (hereinafter referred to as “the Deed”) between the Manager, Saturna Sdn. Bhd. and the Trustee, Deutsche Trustees Malaysia Berhad. Subsequently, change of a Trust Deed dated 23 November 2015 between the Manager, Saturna Sdn Bhd. and the Trustee, SCBMB Trustee Berhad.
The principal activity of the Fund is to invest in a diversified portfolio of Shariah-compliant equities across the ASEAN region. The objective of the Fund is to provide long-term capital growth. The Fund’s investments comply with Shariah requirements as prescribed by its Shariah Adviser. The Fund was launched on 7 February 2014 and will continue its operations until terminated by the Trustee as provided under Part 11 of the Trust Deed.
The Manager, Saturna Sdn. Bhd. is principally engaged in funds management activity. The Manager is incorporated in Malaysia.
The financial statements were authorised for issue by the Board of Directors of the Manager in accordance with a resolution of the directors on 16 February 2017.
2. BASIS OF PREPARATION
The financial statements of the Fund are prepared under the historical cost convention and modified to include other bases of valuation as disclosed in other sections under significant accounting policies, and in compliance with Malaysian Financial Reporting Standards (“MFRSs”) and International Financial Reporting Standards.
2.1 During the current financial year, the Fund has adopted the following new accounting standards and/or interpretations (including the consequential amendments, if any):
MFRSs and IC Interpretation (Including The Consequential Amendments)
MFRS 14 Regulatory Deferral Accounts
Amendments to MFRS 10, MFRS 12 and MFRS 128: Investment Entities – Applying the Consolidation Exception
Amendments to MFRS 11: Accounting for Acquisitions of Interests in Joint Operations
Amendments to MFRS 101: Disclosure Initiative
Amendments to MFRS 116 and MFRS 138: Clarification of Acceptable Methods of Depreciation and Amortisation
Amendments to MFRS 116 and MFRS 141: Agriculture – Bearer Plants
Amendments to MFRS 127: Equity Method in Separate Financial Statements
Annual Improvements to MFRSs 2012 – 2014 Cycle
The adoption of the above accounting standards and/or interpretations (including the consequential amendments, if any) did not have any material impact on the Fund’s financial statements.
Continued on next page.

14 ASEAN Equity Fund Annual Report 31 December 2016
10. NOTES TO THE FINANCIAL STATEMENTS (continued)
2. BASIS OF PREPARATION (continued)
2.2 The Fund has not applied in advance the following accounting standards and interpretation (including the conse-quential amendments, if any) that have been issued by the Malaysian Accounting Standards Board (“MASB”) but are not yet effective for the current financial year:
MFRSs and IC Interpretation (Including The Consequential Amendments) Effective Date
MFRS 9 Financial Instruments (IFRS 9 issued by IASB in July 2014) 1 January 2018
MFRS 15 Revenue from Contracts with Customers 1 January 2018
MFRS 16 Leases 1 January 2019
IC Interpretation 22 Foreign Currency Transactions and Advance Consideration 1 January 2018
Amendments to MFRS 2: Classification and Measurement of Share-based Payment Transactions
1 January 2018
Amendments to MFRS 4: Applying MFRS 9 Financial Instruments with MFRS 4 Insurance Contracts
1 January 2018
Amendments to MFRS 10 and MFRS 128: Sale or Contribution of Assets between an Investor and its Associate or Joint Venture
Deferred until further notice
Amendments to MFRS 15: Effective Date of MFRS 15 1 January 2018
Amendments to MFRS 15: Clarifications to MFRS 15 ‘Revenue from Contracts with Customers’
1 January 2018
Amendments to MFRS 107: Disclosure Initiative 1 January 2017
Amendments to MFRS 112: Recognition of Deferred Tax Assets for Unrealised Losses 1 January 2017
Amendments to MFRS 140 – Transfers of Investment Property 1 January 2018
Annual Improvements to MFRS Standards 2014 – 2016 Cycles:
• Amendments to MFRS 12: Clarification of the Scope of Standard
1 January 2017
Annual Improvements to MFRS Standards 2014 – 2016 Cycles:
• Amendments to MFRS 1: Deletion of Short-term Exemptions for First-time Adopters
• Amendments to MFRS 128: Measuring an Associate or Joint Venture at Fair Value 1 January 2018
The adoption of the above accounting standards and/or interpretation (including the consequential amendments, if any) is expected to have no material impact on the financial statements of the Fund.
3. SIGNIFICANT ACCOUNTING POLICIES
3.1 FINANCIAL ASSETS
Financial assets are recognised in the statement of financial position when, and only when the Fund becomes a party to the contractual provisions of the financial instrument.
When the financial assets are recognised initially, they are measured at fair value. Transaction costs that are directly attributable to the acquisition or issue of the financial assets (other than a financial asset at fair value through profit or loss) are added to/deducted from the fair value on initial recognition, as appropriate.
The Fund determines the classification of its financial assets initial recognition, and the categories include financial assets at fair value through profit or loss, available-for-sale financial assets and loans and receivables.
(a) Financial Assets at Fair Value through Profit or Loss (“FVTPL”)
Financial assets are classified as financial assets at FVTPL when the financial assets is either held for trading or are designated to eliminate or significantly reduce a measurement or recognition inconsistency that would otherwise arise. Financial assets held for trading include equity securities and derivatives instruments acquired principally for the purpose of selling in the near term.
Subsequent to initial recognition, financial assets at FVTPL are measured at fair value. Changes in the fair value of those financial instruments are recorded in “Net gain or loss on financial assets at fair value through profit or loss”. Profit earned and dividend income elements of such instruments are recorded separately in ‘Profit income from Islamic deposits, and ‘Gross dividend income’, respectively. Exchange differences on financial assets at FVTPL are not recognised separately in profit or loss but are included in net gains or net losses on changes in fair value of financial assets at FVTPL.

31 December 2016 Annual Report ASEAN Equity Fund 15
10. NOTES TO THE FINANCIAL STATEMENTS (continued)
3. SIGNIFICANT ACCOUNTING POLICIES (continued)
3.1 FINANCIAL ASSETS (continued)
(b) Available-for-sale Financial Assets
Available-for-sale financial assets are non-derivative assets that are designated in this category or are not classified in any of the other categories.
After initial recognition, available-for-sale financial assets are remeasured to their fair values at the end of each reporting period. Gains and losses arising from changes in fair value are recognised in other comprehensive income except that impairment losses, foreign exchange gains and losses on monetary instruments, dividend income and profit calculated using the effective profit method are recognised in profit or loss.
The cumulative gain or loss previously recognised in other comprehensive income is reclassified from equity to profit or loss as reclassification adjustment when the financial asset is derecognised. Profit income from Islamic deposits calculated using the effective profit method is recognised in profit or loss. Dividends on an available-for-sale equity instrument are recognised in profit or loss when the Fund’s right to receive payment is established.
Fair value is the amount for which an asset could be exchanged, or a liability settled, between knowledgeable, willing parties in an arm’s length transaction. The fair value for financial instruments traded in active markets at the reporting date is based in their quoted price or binding dealer price quotations, without any deduction for transaction costs.
A financial asset is derecognised when the asset is disposed of and the contractual right to receive cash flows from the asset has expired. On derecognition of a financial asset in its entirety, the difference between the carrying amount and the sum of the consideration received and any cumulative gain or loss that had been recognised in other comprehensive income is recognised in profit or loss.
Regular way purchases or sales are purchases or sales of financial assets that require delivery of assets within the period generally established by regulation or convention in the marketplace concerned. All regular way purchases and sales of financial assets are recognised or derecognised on the trade date i.e., the date that the Fund commit to purchase or sell the asset.
(c) Loans and Receivables
Financial assets with fixed or determinable payments that are not quoted in an active market are classified as loans and receivables. The Fund includes short term receivables in this classification.
Subsequent to initial recognition, loans and receivables are measured at amortised cost using the effective profit method. Gains or losses are recognised in profit or loss when the loans and receivables are derecognised or impaired, or through the amortisation process.
3.2 IMPAIRMENT OF FINANCIAL ASSETS
The Fund assesses at each reporting date whether there is any objective evidence that a financial asset is impaired.
(a) Available-for-sale Financial Assets
Significant or prolonged decline in fair value below cost, significantly financial difficulties of the issuer or obligor, and the disappearance of an active trading market are considerations to determine whether there is objective evidence that investment securities classified as available-for-sale financial assets are impaired.
If an available-for-sale financial asset is impaired, an amount comprising the difference between its cost (net of any principal payment and amortisation) and its current fair value, less any impairment loss previously recognised in profit or loss, is transferred from equity to profit or loss.
Impairment losses on available-for-sale equity investments are not reversed in profit or loss in the subsequent periods. Increase in fair value, if any, subsequent to impairment loss is recognised in other comprehensive income. For available-for-sale debt investments, impairment losses are subsequently reversed in profit or loss, up to the amount previously recognised as impairment loss, if an increase in the fair value of the investment can be objectively related to an event occurring after the recognition of the impairment loss in profit or loss.
Continued on next page.

16 ASEAN Equity Fund Annual Report 31 December 2016
10. NOTES TO THE FINANCIAL STATEMENTS (continued)
3. SIGNIFICANT ACCOUNTING POLICIES (continued)
3.2 IMPAIRMENT OF FINANCIAL ASSETS (continued)
(b) Trade and Other Receivables and Other Financial Assets Carried at Amortised Cost
To determine whether there is objective evidence that an impairment loss on financial assets has been incurred, the Fund considers factors such as the probability of insolvency or significantly financial difficulties of the debtor and default or significantly delay in payments.
If any such evidence exists, the amount of impairment loss is measured as the difference between the asset’s carrying amount and the present value of estimated future cash flows discounted at the financial assets’s original effective profit rate. The impairment loss is recognised in profit or loss.
The carrying amount of the financial asset is reduced by the impairment loss directly for all financial assets with the exception of trade receivables, where the carrying amount is reduced through the use of an allowance account. When a trade receivable becomes uncollectible, it is written off against the allowance account.
If in a subsequent period, the amount of the impairment loss decreases and the decrease can be related objectively to an event occurring after the impairment was recognised, the previously recognised impairment loss is reversed to the extent that the carrying amount of the asset does not exceed its amortised cost at the reversal date. The amount of reversal is recognised in profit or loss.
3.3 CLASSIFICATION OF REALISED AND UNREALISED GAINS AND LOSSES
Unrealised gains and losses comprise changes in the fair value of financial instruments for the period from the reversal of the prior period’s unrealised gains and losses for financial instruments which were realised (i.e. sold, redeemed or matured) during the reporting period.
Realised gains and losses on disposals of financial instruments classified as part of ‘at fair value through profit or loss’ are calculated using weighted average method. They represent the difference between an instrument’s initial carrying amount and disposal amount, or cash payments or receipts made on derivative contracts (excluding payments or receipts on collateral margin account for such instruments).
3.4 FINANCIAL LIABILITIES
Financial liabilities, within the scope of MFRS 139, are recognised in the statement of financial position when, and only when, the Fund becomes a party to the contractual provisions of the financial instrument. Financial liabilities are classified as other financial liabilities.
The Fund’s financial liabilities which include trade and other payables are recognised initially at fair value plus directly attributable transaction costs and subsequently measured at amortised cost using effective profit method.
A financial liability is derecognised when the obligation under the liability is extinguished. Gains and losses are recognised in profit or loss when the liabilities are derecognised, or through the amortisation process.
3.5 FUNCTIONAL AND FOREIGN CURRENCIES
(a) Functional and Presentation Currency
The financial statements of the Fund are measured using the currency of the primary economic environment in which the Fund operates (“the functional currency”). The financial statements are presented in Ringgit Malaysia (“RM”), which is also the Fund’s functional currency.
(b) Foreign Currency Transactions and Balances
Transactions in foreign currencies are measured in the functional currency of the Fund and are recorded on initial recognition in the functional currency at exchange rates approximating those ruling at the transaction dates. Monetary assets and liabilities denominated in foreign currencies are translated in foreign currencies that are measured at historical cost are translated using the exchange rates at the dates of the initial transactions. Non-monetary items denominated in foreign currencies measured at fair value are translated using the exchange rates at the date when the fair value was determined.
Exchange differences arising on the statement of monetary items or on translating monetary items at the reporting date are recognised in profit or loss. Exchange differences arising on the translation of non-monetary items carried at fair value are included in profit or loss for the period except for the differences arising on the transaction on non-monetary items in respect of which gains and losses are recognised directly in equity. Exchange differences from such non-monetary items are also directly in equity.

31 December 2016 Annual Report ASEAN Equity Fund 17
10. NOTES TO THE FINANCIAL STATEMENTS (continued)
3. SIGNIFICANT ACCOUNTING POLICIES (continued)
3.6 UNITHOLDERS’ CONTRIBUTION
The Unitholders’ contributions to the Fund meet the definition of puttable instruments classified as equity instruments.
3.7 DIVIDEND DISTRIBUTION
Dividend distributions are at the discretion of the Fund. A dividend to the Fund’s Unitholders is accounted for as a deduction from realised reserves except where dividend is sourced out of distribution equalisation which is recognised as a liability in the period in which it is approved.
3.8 CASH AND CASH EQUIVALENTS
Cash and cash equivalents comprise cash in hand, bank balances, demand deposits and short-term, highly liquid investments that are readily convertible to known amounts of cash and which are subject to an insignificant risk of changes in value with original maturity periods of three months or less.
3.9 INCOME
Income is recognised to the extent that it is probable that the economic benefits will flow to the Fund and the income can be reliably measured. Income is measured at the fair value of consideration received or receivable.
Dividend income is recognised when the Fund’s right to receive payment is established.
Profit income from deposits is recognised on an accrual basis using the effective profit method.
3.10 INCOME TAX
Current tax assets and liabilities are measured at the amount expected to be recovered from or paid to the tax authorities. The tax rates and tax laws used to compute the amount are those that are enacted or substantively enacted by the reporting date.
Current taxes are recognised in profit or loss except to the extent that the tax related to items recognised outside profit or loss, either in other comprehensive income or directly in equity.
No deferred tax is recognised as there are no material temporary differences.
3.11 SIGNIFICANT ACCOUNTING ESTIMATES AND JUDGEMENTS
The preparation of the Fund’s financial statements requires the Manager of the Fund to make judgement, estimates and assumptions that the affect the reported amounts of revenue, expenses, assets and liabilities, and the disclosure of contingent liabilities at the reporting date. However, uncertainty about these assumptions could result in an outcome that could require a material adjustment to the carrying amount of the asset or liability in the future.
No major judgements have been made by the Manager of the Fund in applying the Fund’s accounting policies. There are no key assumptions concerning the future and other key sources of estimation uncertainty at the reporting date that have significant risk of causing a material adjustment to the carrying amount of assets and liabilities within the next year.
3.12 FAIR VALUE MEASUREMENTS
Fair value is the price that would be received to sell an asset or paid to transfer a liability in an orderly transaction between market participants at the measurement date, regardless of whether that price is directly observable or estimated using a valuation technique. The measurement assumes that the transaction takes place either in the principal market or in the absence of a principal market, in the most advantageous market. For non-financial asset, the fair value measurement takes into account a market’s participant’s ability to generate economic benefits by using the asset in its highest and best use or by selling it to another market participant that would use the asset in its highest and best use.
For financial reporting purposes, the fair value measurements are analysed into level 1to level 3 as follows:
Level 1: Inputs are quoted prices (unadjusted) in active markets for identical assets or liability that the entity can access at the measurement date;
Level 2: Inputs are inputs, other than quoted prices included within level 1, that are observable for the asset or liability, either directly or indirectly; and
Level 3: Inputs are unobservable inputs for the asset or liability.
The transfer of fair value between levels is determined as of the date of the event or change in circumstances that caused the transfer. Continued on next page.
18 ASEAN Equity Fund Annual Report 31 December 2016
10. NOTES TO THE FINANCIAL STATEMENTS (continued)
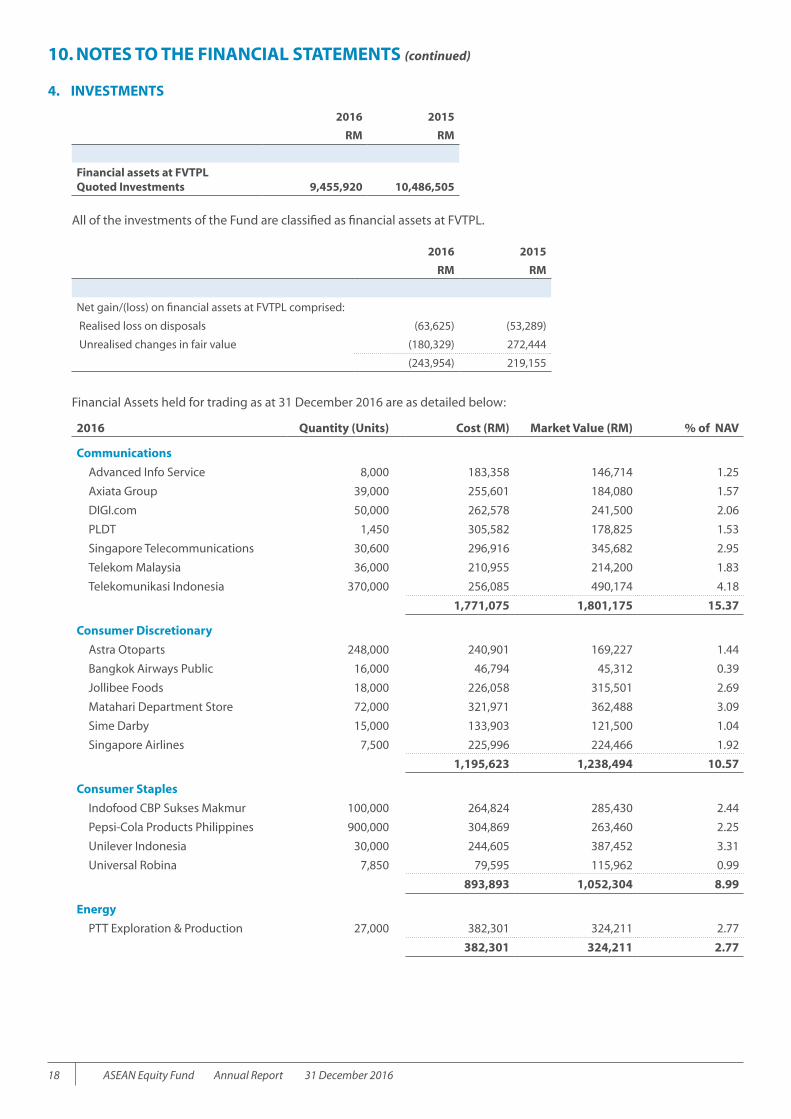
4. INVESTMENTS
2016 2015
RM RM
Financial assets at FVTPLQuoted Investments 9,455,920 10,486,505
All of the investments of the Fund are classified as financial assets at FVTPL.
2016 2015
RM RM
Net gain/(loss) on financial assets at FVTPL comprised:
Realised loss on disposals (63,625) (53,289)
Unrealised changes in fair value (180,329) 272,444
(243,954) 219,155
Financial Assets held for trading as at 31 December 2016 are as detailed below:
2016 Quantity (Units) Cost (RM) Market Value (RM) % of NAV
Communications
Advanced Info Service 8,000 183,358 146,714 1.25
Axiata Group 39,000 255,601 184,080 1.57
DIGI.com 50,000 262,578 241,500 2.06
PLDT 1,450 305,582 178,825 1.53
Singapore Telecommunications 30,600 296,916 345,682 2.95
Telekom Malaysia 36,000 210,955 214,200 1.83
Telekomunikasi Indonesia 370,000 256,085 490,174 4.18
1,771,075 1,801,175 15.37
Consumer Discretionary
Astra Otoparts 248,000 240,901 169,227 1.44
Bangkok Airways Public 16,000 46,794 45,312 0.39
Jollibee Foods 18,000 226,058 315,501 2.69
Matahari Department Store 72,000 321,971 362,488 3.09
Sime Darby 15,000 133,903 121,500 1.04
Singapore Airlines 7,500 225,996 224,466 1.92
1,195,623 1,238,494 10.57
Consumer Staples
Indofood CBP Sukses Makmur 100,000 264,824 285,430 2.44
Pepsi-Cola Products Philippines 900,000 304,869 263,460 2.25
Unilever Indonesia 30,000 244,605 387,452 3.31
Universal Robina 7,850 79,595 115,962 0.99
893,893 1,052,304 8.99
Energy
PTT Exploration & Production 27,000 382,301 324,211 2.77
382,301 324,211 2.77

31 December 2016 Annual Report ASEAN Equity Fund 19
10. NOTES TO THE FINANCIAL STATEMENTS (continued)
4. INVESTMENTS (continued)
2016 Quantity (Units) Cost (RM) Market Value (RM) % of NAV
Financials
Al-‘Aqar Healthcare REIT 147,000 203,853 230,790 1.97
Axis Real Estate Investment Trust 100,000 172,638 161,000 1.37
BIMB Holdings 21,600 80,642 91,152 0.78
Global Logistic Properties 13,500 93,405 91,922 0.78
RHT Health Trust 100,000 293,368 283,194 2.42
Sabana Shariah Compliant REITs 108,000 291,454 127,019 1.08
Sabana Shariah Compliant REITs-RTS 45,360 0 12,060 0.10
Syarikat Takaful Malaysia 95,000 217,157 393,300 3.36
1,352,517 1,390,437 11.86
Health Care
Chularat Hospital PCL-Foreign 150,000 46,337 53,521 0.46
IHH Healthcare 52,000 215,135 330,200 2.82
Kalbe Farma 850,000 359,896 428,644 3.66
KPJ Healthcare 70,000 249,886 292,600 2.50
871,254 1,104,965 9.44
Industrials
Conception Industrial 21,000 111,673 110,046 0.94
Gamuda 26,000 119,369 124,280 1.06
Hartalega Holdings 48,000 168,062 231,840 1.98
SIA Engineering 23,000 281,932 239,895 2.05
681,036 706,061 6.03
Materials
D & L Industries 246,300 237,438 253,686 2.16
Holcim Philippines 240,000 260,253 357,785 3.05
Indocement Tunggal Prakasa 24,000 152,098 123,026 1.05
Lafarge Malaysia Berhad 30,000 267,973 215,700 1.84
Semen Indonesia (Persero) 113,000 434,160 345,104 2.95
Siam City Cement 4,200 167,187 142,522 1.22
1,519,109 1,437,823 12.27
Utilities
Manila Electric 11,900 228,879 284,918 2.43
Metro Pacific Investments 192,000 114,783 115,532 0.99
343,662 400,450 3.42
Total Quoted Equity Securities 9,010,470 9,455,920 80.72
Continued on next page.

20 ASEAN Equity Fund Annual Report 31 December 2016
10. NOTES TO THE FINANCIAL STATEMENTS (continued)
4. INVESTMENTS (continued)
Financial Assets held for trading as at 31 December 2015 are as detailed below:
2015 Quantity (Units) Cost (RM) Market Value (RM) % of NAV
Communications
Advanced Info Service 12,000 275,038 217,547 1.87
Axiata Group 39,000 255,601 249,990 2.14
DIGI.com 50,000 262,578 270,000 2.31
Philippine Long Distance Tel 1,450 305,582 272,838 2.34
Singapore Telecommunications 30,600 296,916 340,619 2.92
Telekom Malaysia 27,518 154,180 186,572 1.60
Telekomunikasi Indonesia 370,000 256,085 357,263 3.06
1,805,980 1,894,829 16.24
Consumer Discretionary
Astra Otoparts 227,500 229,667 113,195 0.97
Jollibee Foods 18,000 226,058 360,069 3.09
Matahari Department Store 72,000 321,971 394,066 3.38
Ramayana Lestari Sentosa 1,000,000 283,363 200,578 1.72
Robinson Department Store 57,000 298,873 295,728 2.53
Sime Darby 15,000 133,903 116,250 1.00
Singapore Airlines 7,500 225,996 254,777 2.18
1,719,831 1,734,663 14.87
Consumer Staples
Nippon Indosari Corpindo 800,000 270,218 314,706 2.70
Pepsi-Cola Products Philippines 900,000 304,869 302,524 2.59
Unilever Indonesia 30,000 244,605 345,182 2.96
Universal Robina 22,000 223,068 373,770 3.20
1,042,760 1,336,182 11.45
Energy
PTT Exploration & Production 27,000 382,301 184,360 1.58
382,301 184,360 1.58
Financials
Al-‘Aqar Healthcare REIT 147,000 203,853 205,800 1.76
Axis Real Estate Investment Trust 100,000 172,638 164,000 1.41
Global Logistic Properties 25,000 176,347 163,027 1.40
Religare Health Trust 54,000 166,454 163,785 1.40
Sabana Shariah Compliant REITs 108,000 291,454 234,213 2.01
Syarikat Takaful Malaysia 95,000 217,157 370,500 3.18
1,227,903 1,301,325 11.16
Health Care
Bangkok Dusit Medical Services 145,000 200,156 385,657 3.31
IHH Healthcare 52,000 215,135 342,160 2.93
Kalbe Farma 800,000 339,095 328,389 2.81
KPJ Healthcare 56,000 189,959 236,320 2.03
944,345 1,292,526 11.08

31 December 2016 Annual Report ASEAN Equity Fund 21
2015 Quantity (Units) Cost (RM) Market Value (RM) % of NAV
Industrials
Gamuda 26,000 119,369 121,160 1.04
Hartalega Holdings 72,000 252,093 427,680 3.67
SIA Engineering 22,000 271,387 246,891 2.12
642,849 795,731 6.83
Materials
Holcim Philippines 240,000 260,253 312,169 2.68
Indocement Tunggal Prakasa 55,000 348,524 381,837 3.27
Lafarge Malaysia 30,000 267,973 266,400 2.28
Semen Indonesia (Persero) 90,000 367,489 319,060 2.73
Siam City Cement 8,400 335,554 319,594 2.74
1,579,793 1,599,060 13.70
Utilities
Manila Electric 11,900 228,879 347,829 2.98
228,879 347,829 2.98
Total Quoted Equity Securities 9,574,641 10,486,505 89.89
10. NOTES TO THE FINANCIAL STATEMENTS (continued)
4. INVESTMENTS (continued)
Continued on next page.

22 ASEAN Equity Fund Annual Report 31 December 2016
10. NOTES TO THE FINANCIAL STATEMENTS (continued)
5. SHORT TERM DEPOSITS
Short-term deposits bore a weighted average effective profit rate of 3.09% per annum at the end of the previous reporting period. The short-term deposits had maturity periods ranging from 11 to 32 days. (2015-Nil)
6. NET ASSET VALUE ATTRIBUTABLE TO UNITHOLDERS
2016 2015
Note RM RM
Unitholders’ contribution (a) 10,625,719 10,625,719
Retained earnings
Realised reserve (b) 643,317 128,943
Unrealised reserve (c) 445,450 911,864
11,714,486 11,666,526
(a) Unitholders Contribution
2016 2015
Number of Units
RM Number of Units
RM
At beginning of the financial year 10,604,987 10,625,719 10,271,741 10,271,620
Creation of units - - 333,246 354,099
At end of the financial year 10,604,987 10,625,719 10,604,987 10,625,719
ASEAN Equity Fund has an approved combined fund size of 50 million units. As at 31 December 2016, the unissued units amounted to 39,395,013 units (2015: 39,395,013 units).
(b) Realised – Distributable
2016 2015
RM RM
At beginning of the financial year 128,943 90,577
Net income after tax 47,960 395,859
Net unrealised (loss)/gain transferred to unrealised reserve 180,335 (272,422)
Net decrease/increase in realized reserve for the year
228,295 123,437
Net unrealized (loss)/gain attributable to investments sold transferred to realised reserve
286,079 (85,071)
At end of the financial year 643,317 128,943
(c) Unrealised – Non-Distributable
2016 2015
RM RM
At beginning of financial year 911,864 554,371
Net unrealised (loss)/gain transferred from realised reserve (180,335) 272,422
Net unrealized (loss)/gain attributable to investments sold transferred to realised reserve (286,079) 85,071
At end of financial year 445,450 911,864

31 December 2016 Annual Report ASEAN Equity Fund 23
10. NOTES TO THE FINANCIAL STATEMENTS (continued)
7. MANAGER’S FEE
The Manager is entitled to receive an administrative fee of 0.25% per annum of the NAV of the Fund. The fee is accrued daily and paid monthly out of the Fund.
The Manager is also entitled to a performance fee from the daily increase in the NAV of the Fund. The performance fee is 10% of the amount by which the NAV cumulatively increases or decreases each day in the calendar year.
The Fund reimburses The Manager up to 0.25% of the average Net Assets Value per year for its marketing and distribution expenses.
8. TRUSTEE’S FEE
Trustee’s fee is computed on a daily basis at 0.05% per annum of the NAV of the Fund.
9. INCOME TAX EXPENSE
A reconciliation of income tax expense applicable to the net income before taxation at the statutory tax rate to income tax expense at the effective tax rate of the Fund is as follows:
1 January 2016 to 31 December 2016
1 January 2015 to 31 December 2015
RM RM
Current tax expenses:
Malaysian taxation 306 1,004
Foreign taxation 39,650 36,084
39,956 37,088
1 February 2016 to 31 December 2016
1 February 2015 to 31 December 2015
RM RM
Net income before taxation 87,916 432,947
Tax at the Malaysian statutory tax rate of 24%(2015 & 2014: 25%)
21,100 108,237
Tax effects of:
Non-taxable income (59,967) (107,683)
Non deductible expenses 39,173 450
Foreign income subject to different tax rates 39,650 36,084
Tax expense for the financial year 39,956 37,088
10. UNITS HELD BY RELATED PARTIES
2016 2015
Number of Units
NAV RM
Number of Units
NAV RM
Director of the Manager 403,004 445,167 403,004 443,344
Related party to the Director of the Manager 9,982,390 11,026,754 9,982,390 10,981,610
10,385,394 11,471,921 10,385,394 11,424,954
Continued on next page.

24 ASEAN Equity Fund Annual Report 31 December 2016
10. NOTES TO THE FINANCIAL STATEMENTS (continued)
11. TRANSACTIONS WITH INVESTMENT BANKS
Details of transactions with investment banks for the financial period from 1 January 2016 to 31 December 2016 are as follows:
2016 Value of TradePercentage of
Total Trade Brokerage FeesPercentage of Total
Brokerage Fees
RM % RM %
CIMB Investment Bank Berhad 33,854 0.90 85 1.04
Maybank Investment Bank Berhad 853,528 22.76 2,043 24.92
RHB Investment Bank Berhad 2,862,340 76.34 6,069 74.04
3,749,722 100.00 8,197 100.0
2015 Value of TradePercentage of
Total TradeBrokerage Fees and
CommissionsPercentage of Total
Fees and Commissions
RM % RM %
CIMB Investment Bank Berhad 308,603 12.7 1,056 19.0
Maybank Investment Bank Berhad 134,131 5.5 305 5.5
RHB Investment Bank Berhad 1,980,749 81.8 4,205 75.5
2,423,483 100.0 5,566 100.0
12. SEGMENT INFORMATION
For management purposes, the Fund is organised into one main operating segment, which invests in quoted equities and the analysis of the Fund’s investment income is as follows:
Regional Location 1 January 2016 to 31 December 2016
1 January 2015 to 31 December 2015
RM RM
Indonesia 241,460 (27,059)
Malaysia 127,842 434,327
Philippines (173,279) 273,680
Singapore (7,963) (14,777)
Thailand 7,284 (101,950)
195,344 564,221

31 December 2016 Annual Report ASEAN Equity Fund 25
10. NOTES TO THE FINANCIAL STATEMENTS (continued)
13. FINANCIAL INSTRUMENTS
(a) Classification of Financial Instruments
The Fund’s financial assets and financial liabilities are measured on an ongoing basis at either fair value or at amortised cost based on their respective classifications. The significant policies in Note 3 describe how the classes of financial instruments are measured, and how income and expenses, including fair value gains and losses, are recognised. The following table analyses the financial assets and liabilities of the Fund in the statement of financial position at the end of the reporting period by the class of financial instruments to which they are assigned, and therefore by the measurement basis.
Financial Asset at FVTPL
Loans and Receivables
Financial Liabilities at Amortised Cost
Total
2016 RM RM RM RM
Assets
Investments 9,455,920 - - 9,455,920
Sundry receivables - 11,196 - 11,196
Short-term deposits - 2,196,390 - 2,196,390
Cash at bank - 97,642 - 97,642
Total financial assets 9,455,920 2,305,228 - 11,761,148
Liabilities
Other payables and accruals - - 14,840 14,840
Amount owed to Manager - - 31,311 31,311
Amount owed to Trustee - - 511 511
Total financial liabilities - - 46,662 46,662
Financial Asset at FVTPL
Loans and Receivables
Financial Liabilities at Amortised Cost
Total
2015 RM RM RM RM
Assets
Investments 10,486,505 - - 10,486,505
Sundry receivables - 12,541 - 12,541
Short-term deposits - - - -
Cash at bank - 1,229,009 - 1,229,009
Total financial assets 10,486,505 1,241,550 - 11,728,055
Liabilities
Other payables and accruals - - 13,780 13,780
Amount owed to Manager - - 46,182 46,182
Amount owed to Trustee - - 1,567 1,567
Total financial liabilities - - 61,529 61,529
Continued on next page.

26 ASEAN Equity Fund Annual Report 31 December 2016
10. NOTES TO THE FINANCIAL STATEMENTS (continued)
13. FINANCIAL INSTRUMENTS (continued)
2016 2015
Income, expense, gains, and losses
Income, expense, gains, and losses
RM RM
Net (loss)/gain from financial assets at FVTPL (180,335) 272,422
Profit income derived from loans and receivables 53,288 57,909
(b) Fair Value Measurements
As of end of the financial year/period, the Fund held the following financial assets carried at fair value:
Financial Instruments Carried At Fair Value Total Fair Value Carrying Amount
Level 1 Level 2 Level 3
2016 RM RM RM RM RM
Financial Asset
Investments 9,455,920 - - 9,455,920 9,455,920
Financial Instruments Carried At Fair Value Total Fair Value Carrying Amount
Level 1 Level 2 Level 3
2015 RM RM RM RM RM
Financial Asset
Investments 10,486,505 - - 10,486,505 10,486,505
The Fund’s financial asset at FVTPL is carried at fair value. The fair value of this financial asset was determined using prices in an active market for identical assets.
Quoted equity instruments
Fair value is determined by references to the last done price for all the investments and assets of the Fund quoted on the stock ex change on which they are listed.
14. FINANCIAL RISK MANAGEMENT POLICIES
(a) Introduction
The Fund maintains investment portfolios in a variety of listed financial instruments as dictated by its Trust Deed and investment management strategy.
The Fund is exposed to a variety of financial risks, including market risks (which include interest rate risk, equity price risk and currency risk), credit risk and liquidity risk. Whilst these are the most important types of financial risk inherent in each type of financial instruments, the Manager and the Trustee would like to highlight that this list does not purport to constitute an exhaustive list of all the risks inherent in an investment in the Fund.
The Fund’s objective in managing risk is the creation and protection of Unitholders’ value. Risk is inherent in the Fund’s activities, but it is managed through a process of ongoing identification, measurement and monitoring of risks. Financial risk management is also carried out through sound internal control systems and adherence to the investment restrictions as stipulated in the Trust Deed, the Securities Commission’s Guidelines on Wholesale Funds and the Capital Market and Services Act, 2007.
(b) Risk Management Structure
The Manager is responsible for identifying and controlling risks. The Board of Directors of the Manager is ultimately responsible for the overall risk management approach within the Fund.
The key feature in the Manager’s approach is that tailoring of the level of portfolio risk taken is through Tactical Asset Allocation between liquid assets and equity. At least 70% of the Fund’s NAV are to be allocated to Shariah-compliant equities in ASEAN countries and up to 30% of the Fund’s NAV are allocated to liquid assets including money market instruments and Islamic deposits with Islamic financial institutions.
To achieve its objective, the Fund invests in a diversified portfolio of Shariah-compliant equities across the ASEAN region. Asset allocation decisions are made after a review of macroeconomic and currency trends in the Southeast Asian economies.

31 December 2016 Annual Report ASEAN Equity Fund 27
10. NOTES TO THE FINANCIAL STATEMENTS (continued)
14. FINANCIAL RISK MANAGEMENT POLICIES (continued)
(b) Risk Management Structure (continued)
The Fund generally follows a relative value investment style, favoring companies with potential for earnings growth. The Fund Manager analyses the direction of GDP growth, interest rates, inflation, currencies and government policies. The Fund Manager will then assess the outlook for corporate earnings and determine if there are any predictable trends. The criteria for stock selection would include improving fundamentals and growth at reasonable valuations. Stock valuation fundamentals considered are sales growth, profit margin, cash generation, earnings per share, return on equity, price earnings ratio and net tangible asset multiplies.
The Fund’s investments comply with Shariah requirements as prescribed by its Shariah Adviser.
The Fund generally invests for the long-term, with annual portfolio turnover not expected to exceed 30%. The Fund will not engage in short-term trading or speculative investments.
The Fund does not invest in debt instruments and investments that might be considered higher risk compared to equities, such as derivatives.
The Fund is allowed to hold cash at the discretion of the Fund Manager and/or for defensive purposes.
(c) Market Risk
Market risk is the risk that the fair value or future cash flows of financial instruments will fluctuate due to changes in market variables such as interest rates, foreign exchange rates and equity prices. The maximum risk resulting from financial instruments equals their fair value.
(i) Interest Rate Risk
Interest rates are inclined to fluctuate over time. A rise in the general level of interest rates may affect the short-term deposits.
Cash and short-term deposits are particularly sensitive to movements in interest rates. When interest rates rise, the return on cash will rise thus affecting the NAV of the Fund.
Interest rate risk sensitivity
The following table demonstrates the sensitivity of the Fund’s profit for the period to a reasonably possible change in interest rates, with all other variables held constant.
The sensitivity is the effect of the assumed changes in interest rates on:
Changes in Basis Points
Sensitivity of Profit Income and Profit Increase
Sensitivity of Changes in Fair Value of Investments Increase
RM RM
2016 +10 +1,725 N/A
The assumed movement in basis points for interest rate sensitivity analysis is based on the currently observable market environment.
An equivalent decrease in each of the indicators shown above would have resulted in a similar, but opposite, impact.
Interest rate risk exposure
The following table analyses the Fund’s interest rate risk exposure. The Fund’s assets and liabilities are included at fair value and categorised by the earlier of contractual re-pricing or maturity dates. There is no short-term deposit as at 31 December 2015.
2016 0 – 3 Months 3 Months – 5 Years Total Effective Profit Rate
Assets RM RM RM %
Short term deposits 2,196,390 - 2,196,390 3.09
Computed based on profit-bearing assets only
Continued on next page.

28 ASEAN Equity Fund Annual Report 31 December 2016
10. NOTES TO THE FINANCIAL STATEMENTS (continued)
14. FINANCIAL RISK MANAGEMENT POLICIES (continued)
(c) Market Risk (continued)
(ii) Equity Price Risk
Equity price risk is the risk of unfavourable changes in the fair values of equities as the result of changes in the levels of equity indices and the value of individual shares. The equity price risk exposure arises from the Fund’s investments in quoted equity securities.
Equity price risk sensitivity
Management’s best estimates of the effect on the profit for the period due to a reasonable possible change in equity indices, with all other variables held constant is detailed in the table below:
2016 Changes in Equity Price
Effects on Profit For the Year Increase
Effects on Equity Increase
Market Index % RM RM
Jakarta Stock Exchange Composite Index (JCI) +5 +129,577 +129,577
Kuala Lumpur Composite Index (KLCI) +5 +141,607 +141,607
Philippines Stock Exchange Index (PSEi) +5 +99,786 +99,786
Stock Exchange of Thailand (SET) +5 +35,614 +35,614
Straits Times Index (STI) +5 +66,212 +66,212
2015 Changes in Equity Price
Effects on Profit For the Year Increase
Effects on Equity Increase
Market Index % RM RM
Jakarta Stock Exchange Composite Index (JCI) +5 +137,714 +137,714
Kuala Lumpur Composite Index (KLCI) +5 +147,842 +147,842
Philippines Stock Exchange Index (PSEi) +5 +98,460 +98,460
Stock Exchange of Thailand (SET) +5 +70,144 +70,144
Straits Times Index (STI) +5 +70,166 +70,166
An equivalent decrease in each of the indices shown above would have resulted in a similar, but opposite, impact.
In practice, the actual trading results may differ from the sensitivity analysis above and the difference could be material.
Equity price risk concentration
The Fund’s concentration of equity price risk analysed by the Fund’s equity instruments by geographic and sector is as per Note 4 in the financial statements.

31 December 2016 Annual Report ASEAN Equity Fund 29
10. NOTES TO THE FINANCIAL STATEMENTS (continued)
14. FINANCIAL RISK MANAGEMENT POLICIES (continued)
(c) Market Risk (continued)
(iii) Currency Risk
The Fund is exposed to foreign currency risk on transactions and balances that are denominated in currencies other than Ringgit Malaysia. The currencies giving rise to this risk are primarily Indonesian Rupiah (“IDR”), Philippine Peso (“PHP”), Singapore Dollar (“SGD”) and Thai Baht (“THB”). Foreign currency risk is monitored closely on an ongoing basis to ensure that the net exposure is at an acceptable level.
Foreign currency exposure
2016 Indonesian Rupiah
Ringgit Malaysia
Philippine Peso
Singapore Dollar
Thai Baht
Total
Financial Assets RM RM RM RM RM RM
Investments 2,591,545 2,832,143 1,995,714 1,324,238 712,280 9,455,920
Sundry receivables - 11,196 - - - 11,196
Short-term deposits - 2,196,390 - - - 2,196,390
Cash at bank - 97,642 - - - 97,642
2,591,545 5,137,371 1,995,714 1,324,238 712,280 11,761,148
2015 Indonesian Rupiah
Ringgit Malaysia
Philippine Peso
Singapore Dollar
Thai Baht
Total
Financial Assets RM RM RM RM RM RM
Investments 2,754,276 2,956,832 1,969,200 1,403,312 1,402,885 10,486,505
Sundry receivables - 12,541 - - - 12,541
Short-term deposits - - - - - -
Cash at bank - 1,229,009 - - - 1,229,009
2,754,276 4,198,382 1,969,200 1,403,312 1,402,885 11,728,055
Foreign currency risk sensitivity analysis
2016 Changes in ForeignCurrencies
Effects on Profit For the Year Increase
Effects on Equity Increase
Foreign currencies % RM RM
IDR/RM +10 +259,155 +259,155
PHP/RM +10 +199,571 +199,571
SGD/RM +10 +132,424 +132,424
THB/RM +10 +71,228 +71,228
2015 Changes in ForeignCurrencies
Effects on Profit For the Year Increase
Effects on Equity Increase
Foreign currencies % RM RM
IDR/RM +10 +275,428 +275,428
PHP/RM +10 +196,920 +196,920
SGD/RM +10 +140,331 +140,331
THB/RM +10 +140,289 +140,289
Continued on next page.

30 ASEAN Equity Fund Annual Report 31 December 2016
10. NOTES TO THE FINANCIAL STATEMENTS (continued)
14. FINANCIAL RISK MANAGEMENT POLICIES (continued)
(c) Market Risk (continued)
(iv) Credit Risk
The Fund will transact most of its investments through financial institutions including but not limited to banks, brokers, and dealers. The risk is that a financial institution may default on its obligations.
The Manager manages the Fund’s credit risk by undertaking credit evaluation and close monitoring of any changes to the issuer/counterparty’s credit profile to minimise such risk. It is the Fund’s policy to enter into financial instruments with reputable counterparties. The Manager also closely monitors the creditworthiness of the Fund’s counterparties (e.g., brokers, custodian, banks, etc.).
Credit risk exposure
At the reporting date, the Fund’s maximum exposure to credit risk is represented by the carrying amount of each class of financial assets recognised in the statement of financial position.
(v) Liquidity Risk
Investments that are relatively less liquid in nature can cause their value and hence the value of the Fund to drop. The Fund may not be able to realise illiquid investments at the desired prices. The risk managed by careful stock or asset selection and portfolio diversification.
It is the Fund’s policy that the Manager monitors the Fund’s liquidity position on a regular basis. The Fund also manages its obligation to redeem units required to do so and its overall liquidity risk by requiring a maximum of 5 business days notice period before redemptions.
The Manager’s policy is to always maintain a prudent and sufficient level of liquid assets so as to meet normal operating requirements and expected redemption requests by Unitholders. Liquid assets comprise cash, deposits with financial institutions, and other instruments which are capable of being converted into cash within 3 months.
The following table sets out the maturity profile of the Fund’s issue (classified as equity instruments) and financial liabilities. Balances due within six months equal their carrying amounts, as the impact of discounting is insignificant. The table also analyses the maturity profile of the Fund’s financial assets (undiscounted where appropriate) and equity in order to provide a complete view of the Fund’s contractual commitments and liquidity.
2016 Less than 3 months 3 months – 1 year Total
RM RM RM
Financial assets
Financial assets held at FVTPL 9,455,920 - 9,455,920
Short-term deposits 2,196,390 - 2,196,390
Cash at bank 97,642 - 97,642
Other assets 11,196 - 11,196
Total financial assets 11,761,148 - 11,761,148
Financial liability
Other liabilities 46,662 - 46,662
Total net financial assets 11,714,486 - 11,714,486

31 December 2016 Annual Report ASEAN Equity Fund 31
10. NOTES TO THE FINANCIAL STATEMENTS (continued)
14. FINANCIAL RISK MANAGEMENT POLICIES (continued)
(c) Market Risk (continued)
(v) Liquidity Risk (continued)
2015 Less than 3 months 3 months – 1 year Total
RM RM RM
Financial assets
Financial assets held at FVTPL 10,486,505 - 10,486,505
Short-term deposits - - -
Cash at bank 1,229,009 - 1,229,009
Other assets 12,541 - 12,541
Total financial assets 11,728,055 - 11,728,055
Financial liability
Other liabilities 61,529 - 61,529
Total net financial assets 11,666,526 - 11,666,526
15. SIGNIFICANT EVENT OCCURING AFTER THE REPORTING PERIOD
On 9 January 2017, ASEAN Equity Fund has obtained the approval from the Securities Commission Malaysia for the con-version of wholesale fund to unit trust fund and will officially operate in the form of unit trust fund from 25th January 2017 onwards.

32 ASEAN Equity Fund Annual Report 31 December 2016
11. CORPORATE INFORMATION
The Fund ManagerSaturna Sdn Bhd (342171-V)
Registered Office15-B, Jalan Tun Mohd Fuad 3Taman Tun Dr. Ismail60000 Kuala LumpurTel: 03-77268128 Fax: 03-77279702
Business OfficeSuite 5.03, 5th Floor, Menara Atlan161B Jalan Ampang50450 Kuala LumpurTel: 03-21645303 Fax: 03-21645308
The TrusteeSCBMB Trustee Berhad (1005793-T)
Board of DirectorsNicholas F. Kaiser (Chairman)Monem A. SalamDato’ Dr. Lee Chee KuonDato’ Dr. Vaseehar HassanMd. Noor Bin Haji A.Rahman
Investment CommitteeNicholas F. Kaiser (Chairman)Monem A. SalamDato’ Dr. Lee Chee KuonScott F. KlimoPadharmendren Annadorai Dharmen
Shariah AdvisorAmanie Advisors Sdn Bhd
Company SecretaryFulcrum Management Sdn Bhd (MAICSA 0868925)
Auditors & Reporting AccountantsCrowe Horwath AF 1018
Tax AdvisorCrowe Horwath KL Tax Sdn Bhd
SolicitorsWei Chien & Partners
Banker Standard Chartered Saadiq Berhad (823437K)