asean real estate invessstments - thaiappraisal.org • crs trainer, council of residential...
TRANSCRIPT

ASEAN REAL ESTATE ASEAN REAL ESTATE S SS SINVESTMENTSINVESTMENTS
Sopon Pornchokchai, Sopon Pornchokchai, PhD D.FIABCI CRS MRICSPhD D.FIABCI CRS MRICSPresident, Agency for Real Estate AffairsPresident, Agency for Real Estate Affairs
Director Thai Real Estate Business SchoolDirector Thai Real Estate Business School
1Thailand’s First Real Estate Info Centre Since Thailand’s First Real Estate Info Centre Since 19941994AAGENCY FOR REAL ESTATE AFFAIRS (AREA)GENCY FOR REAL ESTATE AFFAIRS (AREA)
ISO 9001-2008CERTIFIED
Director, Thai Real Estate Business SchoolDirector, Thai Real Estate Business School

• Board Member, International Advisory Board, the Appraisal Foundation, USA. • FIABCI Representative to the UN ESCAP and Co-Founder of FIABCI ThailandFIABCI Representative to the UN ESCAP and Co Founder of FIABCI Thailand• CRS Trainer, Council of Residential Specialists, National Association of Realtors• Representative of the International Association of Assessing Officers• Consultant to Finance Min. Vietnam/Indonesia, ESCAP, UN-Habitat, ILO, FAO
L i i l i d l i B i C b di I di I d i• Lecturing in valuation and real estate in Brunei, Cambodia, India, Indonesia, Myanmar, Nepal, the Philippines and Vietnam.
Research master pieces: the discovery of 1,020 slums (1985), CAMA (computer-esea c aste p eces t e d sco e y o ,0 0 s u s ( 985), C (co puteassisterd mass appraisal) modeling (1990), forecast of 300,000 unoccupied housing units (1995 and 1998), study for property information centre (2000) and land value modeling (2002), Valuation Roadmap, Vietnam Finance Ministry (2006), Val ation Lect re Series Indonesia Finance Ministr (2008) World Bank (2010)
2Thailand’s First Real Estate Info Centre Since Thailand’s First Real Estate Info Centre Since 19941994AAGENCY FOR REAL ESTATE AFFAIRS (AREA)GENCY FOR REAL ESTATE AFFAIRS (AREA)
ISO 9001-2008CERTIFIED
Valuation Lecture Series, Indonesia Finance Ministry (2008), World Bank (2010).

*kathmandu*kathmandu*Bhutan*Bhutan
*Hai Phong*Hai Phong*Hanoi*Hanoi
*Manila*Manila*Hanoi*Hanoi
*Vientiane*Vientiane*Sawan Khet*Sawan Khet*Yangon*Yangon
*Davao*Davao*Phnom Penh*Phnom Penh
*HCMC*HCMC
Area of AREA InvolvementArea of AREA Involvement*Makassar*Makassar
*Jakarta*Jakarta *Lom Bok*Lom Bok
Area of AREA InvolvementArea of AREA InvolvementAgency for Real Estate AffairsAgency for Real Estate Affairs
**SurabayaSurabaya
3Thailand’s First Real Estate Info Centre Since Thailand’s First Real Estate Info Centre Since 19941994AAGENCY FOR REAL ESTATE AFFAIRS (AREA)GENCY FOR REAL ESTATE AFFAIRS (AREA)
ISO 9001-2008CERTIFIED
JakartaJakarta Lom BokLom Bokhttp://www.nationsonline.org/oneworld/map_of_southeast_asia.htm

Pornchokchai, Sopon. Thailand’s Real Estate Valuation in Gelbtuch, Howard
Pornchokchai, Sopon. Housing Finance Mechanisms ,
C., Real Estate Valuation in Global Markets, second edition. Chicago. Appraisal Institute (2011) 617 pp
gin Thailand. Nairobi. UN-
HABITAT (2008). ISBN: 978-92-1-132038-1, 617 pp.
4Thailand’s First Real Estate Info Centre Since Thailand’s First Real Estate Info Centre Since 19941994AAGENCY FOR REAL ESTATE AFFAIRS (AREA)GENCY FOR REAL ESTATE AFFAIRS (AREA)
ISO 9001-2008CERTIFIED
Appraisal Institute (2011), 617 pp. 92 1 132038 1, 617 pp.

COMPARISON OF ASEAN COUNTRIES AND USA TO THAILANDCountries Land Area Population GDP Popu-
(Excluding Com- Million Com- Den- Growth %Urban Bil- Total per cap % of Growth lationWater) pared* pared* sity/ per Popu- lion Com- Com- Agri per belowSq.Km. sq.km Year lation US$ pared* pared* Sector Year Poverty
Thailand 513,120 1.00 67.091 1.00 131 5.4% 34% 602 1.00 1.00 13.3% 5.7% 8.1%
Denmark 43,094 0.08 5.543 0.08 129 0.2% 87% 206 0.34 4.14 1.3% 0.8% 13.4%
Malaysia 328,657 0.64 29.180 0.43 89 1.5% 72% 464 0.77 1.77 11.9% 5.1% 3.8%
Indonesia 1,811,569 3.53 248.645 3.71 137 1.0% 44% 1,125 1.87 0.50 14.7% 6.5% 12.5%
Phili i 298 170 0 58 103 775 1 55 348 1 9% 49% 391 0 65 0 42 12 8% 3 9% 26 5%Philippines 298,170 0.58 103.775 1.55 348 1.9% 49% 391 0.65 0.42 12.8% 3.9% 26.5%
Vietnam 310,070 0.60 91.519 1.36 295 1.1% 30% 300 0.50 0.37 22.0% 5.9% 14.5%
Brunei 5,265 0.01 0.409 0.01 78 1.7% 76% 21 0.03 5.73 0.8% 2.2% 0.0%
Singapore 687 0 00 5 353 0 08 7 793 2 0% 100% 315 0 52 6 55 0 1% 4 9% 0 0%Singapore 687 0.00 5.353 0.08 7,793 2.0% 100% 315 0.52 6.55 0.1% 4.9% 0.0%
Myanmar 653,508 1.27 54.585 0.81 84 1.1% 34% 83 0.14 0.17 39.3% 5.5% 32.7%
Laos 230,800 0.45 6.586 0.10 29 1.7% 33% 17 0.03 0.29 27.8% 8.0% 26.0%
Cambodia 176,515 0.34 14.953 0.22 85 1.7% 20% 34 0.06 0.25 34.6% 7.1% 31.0%,
Nepal 143,351 0.28 29.891 0.45 209 1.8% 19% 38 0.06 0.14 34.9% 3.9% 25.2%
India 2,973,193 5.79 1,205.074 17.96 405 1.3% 30% 4,421 7.34 0.41 17.2% 6.8% 29.8%
Japan 364,485 0.71 127.368 1.90 349 -0.1% 67% 4,444 7.38 3.89 1.2% -0.8% 16.0%
China 9,569,901 18.65 1,343.240 20.02 140 0.5% 47% 11,300 18.76 0.94 10.0% 9.2% 13.4%
USA 9,161,966 17.86 313.847 4.68 34 0.9% 82% 15,080 25.04 5.35 1.2% 1.8% 15.1%
Campared* = compared to Thailand; www.cia.gov/cia/publications/factbook as of December 2012
5Thailand’s First Real Estate Info Centre Since Thailand’s First Real Estate Info Centre Since 19941994AAGENCY FOR REAL ESTATE AFFAIRS (AREA)GENCY FOR REAL ESTATE AFFAIRS (AREA)
ISO 9001-2008CERTIFIED

6Thailand’s First Real Estate Info Centre Since Thailand’s First Real Estate Info Centre Since 19941994AAGENCY FOR REAL ESTATE AFFAIRS (AREA)GENCY FOR REAL ESTATE AFFAIRS (AREA)
ISO 9001-2008CERTIFIED

1,460Existing Housing g g
Projects Which Still Have Units
Available for Sale as of End
2012
926926 projectsprojects926926 projects projects with > with > 20 20 unitsunits
availableavailableavailableavailable
7Thailand’s First Real Estate Info Centre Since Thailand’s First Real Estate Info Centre Since 19941994AAGENCY FOR REAL ESTATE AFFAIRS (AREA)GENCY FOR REAL ESTATE AFFAIRS (AREA)
ISO 9001-2008CERTIFIED

Newly Launched
((
Launched Real Estate
Projects(
(
(
((
(
(
S
Bangbua Thong-Supha Rangsit-Nakhonnayok
Phah
on Y
othi
n Rd
. Projects, Jan-Dec
´
(
((
(
(
(
((
( (
((
(
(
(
(
(
((
(
( (
(
((
((( (
( ((
((
((
(
((
( (Ram
Chang Watthana Rd
Sainoi-Bang Kruay Rd.
han Buri Rd.
k Rd
.
Lamlukka Rd.
RaP
2012,419 projects
(
(
(
(
((
(
( (((
(
(
((
((
((
((
((
(
(( (
(
(
(
(
(( (
((((
(
((
( (
((
(
((
( (
(
((((((
(
(((
(
(
((
(
(
(
(
(
(
(
((
((
( (
(
(((
(
( ((
((
(
(
(
(
((
( ((
(
(
((
(
((
(
(((
(
((
(
((
Lad Prao Rd.
Ram Intra Rd.
Phah
on Y
othin
Rd.Rd.
Baromratchachonnani Rd.
Kanc
hana
phise
Suwin Thawong Rd.
p j
ถนนวง
แหว น
ร อบนอ ก ´
((
((
(
(
(
((
(
(
(
(
(
((
((
(
(
(
((
(((
((
(
(((
(
(
(
((
((((
(
(
(
(((
(
(
(
(
(
(
(( ((
((
(
(((
((
(
(( (
((
( (
(
(
((
((
(
(
(((
(
(
( ((
((
(
((
((
(
(
(
(
(
(
(
(
(
((
((
(
( (
(
(
((
((
( ((
(
((
((
(
((
(
(((((
((((
((
(
Bangna Tchai R
d.
Phetkasem Rd.
Rd
(((
((
(
(
((
(
(
(
(
(
(
((
(
((
(
(
(
(
(
(
(
((
((
(
((
(
(
(((
na-Trad Rd.Thepharak Rd.
Ekach
Rama I
I Rd
8Thailand’s First Real Estate Info Centre Since Thailand’s First Real Estate Info Centre Since 19941994AAGENCY FOR REAL ESTATE AFFAIRS (AREA)GENCY FOR REAL ESTATE AFFAIRS (AREA)
ISO 9001-2008CERTIFIED

9Thailand’s First Real Estate Info Centre Since Thailand’s First Real Estate Info Centre Since 19941994AAGENCY FOR REAL ESTATE AFFAIRS (AREA)GENCY FOR REAL ESTATE AFFAIRS (AREA)
ISO 9001-2008CERTIFIED

Map Map 55: Top : Top Ten Ten ii
Highest, Baht Highest, Baht 11,,500500,,000000/sw.wah = USD /sw.wah = USD 1212,,500500/sq.m./sq.m.
Locations Locations with with
HighestHighestHighest Highest PricePrice aas of s of
20122012((4 4 Rai)Rai)
No. Zones Zone Name Price (Baht/Sq.wah.)1 I2-4 Siam Square 1,500,0002 BTS-9 Siam Station 1,500,0003 BTS-15 Chit Lom Station 1,500,0004 BTS-16 Ploenchit station 1,500,0005 I2 5 Wi l Rd 1 300 0005 I2-5 Wireless Rd. 1,300,0006 I3-1 Sukhumvit, Time Square 1,300,0007 BTS-10 Ratchadamri Station 1,250,0008 BTS-11 Sala Daeng Station 1,250,0009 I4 2 Sil 1 200 000
10Thailand’s First Real Estate Info Centre Since Thailand’s First Real Estate Info Centre Since 19941994AAGENCY FOR REAL ESTATE AFFAIRS (AREA)GENCY FOR REAL ESTATE AFFAIRS (AREA)
ISO 9001-2008CERTIFIED
9 I4-2 Silom 1,200,00010 BTS-17 Na Na Station 1,200,000

Map Map 66: T: TOP OP 1010Locations with Locations with
ii
!!
!!
!!A7-1
A7-2
A2-3
Lowest PriceLowest Price aas of s of 20122012 ((44 Rai)Rai)
!
!!
!!!!
!!!!
!!
!!
!!!!
N6-2
N6-3
A1-1
3
A2-2
A2-1
A5-3 A5-2
A1-2
A3 4((4 4 Rai) Rai) !!
!! !!
!!
!!
!!!!
!!
!!
!!
!!
!!
!!
!!!!
!!
!!
!! A6-2
A6-5
A4-3
A4-1A4-2
A5-1A3-4
N7-3N7-4
N7-2N5-2
N7 1N6-1
A3-2A3-1
A3-3A6-3
A6-4
!!
!!
!!
!!!!!
!!!!
!! !!
!!
!! !!
!!
!!!!!!
!!
!!
!!
!!
!!
!!!!
!!!!
!! !!
!!!!
!!
C1-2
N3-1
N3-2
B3-1E1-4
E1-2 E2-2.1E2-2 2
A6 2N5-1
N4-2N4-1
N7-1
B2-1
B3-2C1-1
N1 4 C1 3B5-1 D3-1
D4 1D2-2
D2-1
D1-1D1-2
A6-1
D5-1 E1-1
E2-1 E3-1
A6-3
E4 4
Lowest, Baht Lowest, Baht 22,,500500/sw.wah = USD /sw.wah = USD 2121/sq.m./sq.m.
!!
!!
!!
!!
!!
!!!!
!!!!
!!!!!!
!!
!!
!!
!!!!
!!!!
!!!!!!
!!
!!
!!
!!
!!!!
!!!!
!!
!!!!!!
!!!!
!!
!!
!!
!!
!! !!!!!!!! !!!!
!! !!
!!!!!
!!
!!
!!
!!
!
!!
!!
!!
!!
!!!! !!
!!
!!
!! !!
!!
!! !!!!
!!
C2-1 C4-1 D6-2D6-3C2-2
I1-3I2-3
I1-2I1-1
I2 5I2-2I2-1L2-1
E2-2.2
M1-4M3-1
F3-1N4-2 N2-2 N1-3
N1-4N1-1
N1-2
M1-2M1-1M4-1
M1-3M2-4M2-5
L3-1L3-2
C1-3F2-2
F2-1C4-2C4-3
C4-4
F1-1
F5-1
F5-2
F3-3F3-2
F3-4D4-1
D6-1
E1-3E1-5E7-1
E7-4E7-2 E7-3
E2-3
E4-1
E5-3 E5-1
E5-2
E4-3
E6-1
G2 3I2-4 I3-2
M5-1
G1-2G1-1
I3 6
E4-2
G2-2
E4-4
M2 2
!!
!!
!!
!! !!!!
!!!!
!!!!
!!
!!
!!
!!
!!
!!!!!!
!!!
!!
!!
!! !!
!!
!!
!!!!!!!!!!!!!!!!
!! !!
!!!!
!!
!!!!
!! !!!!!!!!!!
!!
!!
!!
!!!!!!
!!!!
!!
!!!!
!!
!!
!! !!
!!
I4-8J2-1I4-7
I4-3I3-3
I4-6
J2-2
L1-2I4-4 I3-5I4-2 I3-4I4-1
I2-5I2 2I3-1
L1-1L2-2K6-1 G3-2
M2-3
K6-4 K6-2K6-3.1K6-3.2
M3-2K4-1 M2-1 E5 2
G5-1G2-4
H8-2
G4-1G2-3
K4-2
K3-1 K2-1
K5-1
J2-3
I4-10I4-9
I4-5
I3 2G2-1I3-6
J2-4 H4-1H2-1
G3-1H1-1
H4-2 H3-1H8-1
G4-3
G4-2
G5-3G5-4
G5-2
G5 5
G3-3
M2-2No. Zones Zone Name Price (Baht/Sq.wah.)1 A6-4 Liab Klong 13 Rd., km. 5 2,5002 A1-2 Opposite Bang Sai Craft Centre 4,6003 E5-2 Lam Toy Ting 5,0004 G5-5 Motorway km.34 5,200
!!
!!
!! !!
!!!!
!! !!
!!
!!
!!
!!
!!!!!!
!!
!!
!!
!!
!!
J2-5.1J2-5.2J1-1
K2-2
K2-3K1-1
K3-3K3-2
H4 2
H5-1 H5-2
H6-2H6-1
H7-3
H8-3 H8-4
H8-6
H8-5
G5-5
H9-1
y ,5 A5-3 Rangsit-Wang Noi Rd. 5,5006 E3-1 Pracha Samran 5,5007 H7-2 Sukhumvit km. 46 Bang Bor 5,8008 N6-3 Outer Ring Rd., Samkok 6,0009 A2 2 Eastern Outer Ring km 8 (Bang Khan Wang Noi) 6 500
11Thailand’s First Real Estate Info Centre Since Thailand’s First Real Estate Info Centre Since 19941994AAGENCY FOR REAL ESTATE AFFAIRS (AREA)GENCY FOR REAL ESTATE AFFAIRS (AREA)
ISO 9001-2008CERTIFIED
!!
!!H7-1
H7-29 A2-2 Eastern Outer Ring km.8 (Bang Khan-Wang Noi) 6,500
10 A2-3 Liab Klong Rapipat 7,000

Map Map 1111: Top Ten : Top Ten Locations with Locations with II P iP iInIncrease Price crease Price
aas of s of 19961996--2012201219961996--2012 2012
((16 16 yrs.)yrs.)
No. Zone Zone Name 1996 2012 % Change1 I2-4 Siam Square 430,000 1,500,000 248.8%2 I3-1 Sukhumvit, Time Square 380,000 1,300,000 242.1%3 I3-4 Sukhumvit, Ekamai 250,000 750,000 200.0%4 G3-1 Bang Chak - Sukhumvit 62 120,000 350,000 191.7%5 I2-5 Wireless Rd. 450,000 1,300,000 188.9%6 F1-1 Panaphan 120,000 300,000 150.0%7 J2-1 Petchaheung 14,000 34,000 142.9%8 I3-2 Sukhumvit 21, Asoke 330,000 800,000 142.4%
12Thailand’s First Real Estate Info Centre Since Thailand’s First Real Estate Info Centre Since 19941994AAGENCY FOR REAL ESTATE AFFAIRS (AREA)GENCY FOR REAL ESTATE AFFAIRS (AREA)
ISO 9001-2008CERTIFIED
8 3 S , 330,000 800,000 %9 I1-1 Pahonyothin (beginning) 250,000 600,000 140.0%10 I2-3 Phayathai 300,000 700,000 133.3%

Map Map 1515 : Top : Top Ten Locations Ten Locations
i hi h
!!
!!
!!A7-1
A7-2
A2-3
with with DeDecrease crease Price Price aas of s of 19961996--20120122
!!
!!
!!!!
!!!!
!!
!!
!!N6-2
N6-3
A1-1
A2-3
A2-2
A2-1
A5-3 A5-2
A1-2
19961996--20120122 ((16 16 yrs.)yrs.)
!!
!!
!! !!
!!
!!!!
!!
!!
!!!!
!!
!!
!!
!!!!
!!
!! A6-5
N6-2 A2 1
A4-3
A4-1A4-2
A5-1A3-4
N7-3N7-4
N7-2N5-2 N6-1
A3-2A3-1
A3-3
A6-4
!!
!!!!
!!!!
!! !!
!!
!! !!
!!
!!!!!!
!!
!!
!!
!!
!!
!!!!
!!!!
!! !!
!!!!
C1-2
N3-1
N3-2
B3-1E1-4
E1-2 E2 2 1
A6-2N5-1
N4-2N4-1
N7-1
B2-1
B3-2C1-1
B5 1 D3-1 D2-2
D2-1
A3 3
D1-1D1-2
A6-1
D5-1 E1-1
E2-1 E3-1
A6-3
!!
!!
!!
!!
!!!!
!!!!
!!!!!!
!!
!!
!!!!
!!!!
!!!!!!
!!
!!
!!
!!!!
!! !!
!!
!!!!!!
!!!!
!!
!!
!!
!!
!! !!!!
!! !!
!!
!!
!!
!!
!!!
!!
!!
!!
!!
!!! !!
!!
!! !!
!!!!
C2-1 C4-1 D6-2D6-3C2-2
I1-3I2-3
I1-2I1-1
E1-2 E2-2.1E2-2.2
M1-4
F3-1N4-2 N2-2 N1-3
N1-4N1-1
N1-2
M1-2M1-1M4-1M2-4M2-5
L3-1L3-2
C1-3B5-1
F2-2F2-1C4-2
C4-3
C4-4
F1-1
F5-1
F5 2
F3-3F3-2
F3-4D4-1
D6-1
D2 2
E1-3E1-5E7-1
E7-4E7-2 E7-3
E2-3
E4-1
E5-3 E5-1
E4-3
E6-1M5-1G1-1
E4-2E4-4
!!
!!
!!!!
!
!!!!
!!
!!
!!
!!
!!
!!!!!!
!!!!
!!
!!
!!
!! !!
!!
!!
!!
!! !!!!
!!!!!!!!!!
!!!!!!!!
!! !!
!!!!
!!!!!!
!! !!!!!!!!!!
!!
!
!!!!
!
!!!!!!
!!!!
!!
!!
!!
!!!!!!
!!
!!
!!
I4-8J2-1I4-7
I4-3I3-3
I4-6
J2-2
L1-2I4-4 I3-5I4-2 I3-4I4-1
I2 3I2-5I2-2I2-1
I3-1L1-1L2-2
K6-1 G3-2M2-3
K6-4 K6-2
L2-1
K6-3.1K6-3.2
M3-2M3-1
K4-1M1-3
M2-1F5-2
E5-2
G5-1G2-4
H8-2
G4-1G2-3
K4-2
K2 1
K5-1
J2-3
I4-10I4-9
I4-5
I2-4 I3-2G2-1
G1-2G1 1
I3-6
H2-1
G3-1H1-1
H8 1G4-3
G4-2
G5-4G5-2
G2-2
G3-3
M2-2No. Zone Zone Name 1996 2012 % Change1 A6-4 Liab Klong 13 Rd., km. 5 4,400 2,500 -43.2%2 A1-2 Opposite Bang Sai Craft Centre 6,500 4,600 -29.2%3 A5-2 Rangsit - Nakhon Nayok km. 37 (Klong 14) 12,500 9,500 -24.0%4 E3-1 Pracha Samran 6,500 5,500 -15.4%
!!
!!
!!
!!!!
!!
!!!!
!! !!
!!
!!
!!
!!
!!
!!
!!!!
!!!!!!
!! !!
!!
!!
!!
J2-5.1J2-5.2J1-1
K3-1 K2-1
K2-2
K2-3K1-1
K3-2
J2-4 H4-1H2 1H4-2
H5-1
H3-1H8-1
H5-2
H6-2H6-1
H7-3
H8-3 H8-4
G5-3
H8-5
G5-5
H9-1
4 E3 1 Pracha Samran 6,500 5,500 15.4%5 N7-3 Pathum Thani - Lat Lum Kaew km. 16 10,500 9,000 -14.3%6 A7-2 Pahonyothin km. 59 14,500 12,500 -13.8%7 E2-3 Pracha Ruamjai, Minburi 10,000 9,000 -10.0%8 E4-2 Nong Chok 11,000 10,000 -9.1%9 E5-3 Thong Samrit Rd 10 000 9 500 -5 0%
13Thailand’s First Real Estate Info Centre Since Thailand’s First Real Estate Info Centre Since 19941994AAGENCY FOR REAL ESTATE AFFAIRS (AREA)GENCY FOR REAL ESTATE AFFAIRS (AREA)
ISO 9001-2008CERTIFIED
!!
!!
!!
!!!!
!
K3-3H7 3
H7-1H7-2
H8-69 E5 3 Thong Samrit Rd. 10,000 9,500 5.0%
10 E4-1 Suwinthawong km. 42 17,000 16,500 -2.9%

Map of Real Estate Projects in Pattaya offered for sales as of July 2012
232 Projects
14Thailand’s First Real Estate Info Centre Since Thailand’s First Real Estate Info Centre Since 19941994AAGENCY FOR REAL ESTATE AFFAIRS (AREA)GENCY FOR REAL ESTATE AFFAIRS (AREA)
ISO 9001-2008CERTIFIED

Table 1: Situation of Real Estate Projects in Pattaya offered for sales as of July 2012y y
Overall-as of July 2012
Location No 0f Total Average Units PeriodNo 0f Units Percentage of
Overall as of July 2012
Location No. 0f Total Average Units Period
Projects Total Sold Left Value unit price Unit Sold Left Value Sold to go
(Mil.Baht) (Mil.Baht) Average (Months)
M th
No. 0f Units Percentage of
per Month
Overall
Pattaya Seaside 150 39,078 26,174 12,904 142,409 3.644 80% 67% 33% 82% 22.6 3.8
Pattaya Hillside 82 9,942 6,391 3,551 31,332 3.151 20% 64% 36% 18% 4.1 10.6
Overall 232 49,020 32,565 16,455 173,741 3.544 100% 66% 34% 100% 16.1 4.4
15Thailand’s First Real Estate Info Centre Since Thailand’s First Real Estate Info Centre Since 19941994AAGENCY FOR REAL ESTATE AFFAIRS (AREA)GENCY FOR REAL ESTATE AFFAIRS (AREA)
ISO 9001-2008CERTIFIED

Overall-as of July 2012Type No. 0f Total Average Units Period
Projects Total Sold Left Value unit price Unit Sold Left Value Sold to go (Mil.Baht) (Mil.Baht) Average (Months)
per Month
No. 0f Units Percentage of
per Month
Overall Detached House 76 6,241 3,961 2,280 28,789 4.613 13% 63% 37% 17% 1.6 19.0
Semi-detached House 17 1,379 852 527 3,246 2.354 3% 62% 38% 2% 2.1 14.8
Townhouse 15 1,509 775 734 2,146 1.422 3% 51% 49% 1% 2.8 17.3
Shophouse 17 647 508 139 2,220 3.432 1% 79% 21% 1% 3.2 2.5
Condominium 136 39,244 26,469 12,775 137,340 3.500 80% 67% 33% 79% 25.6 3.7
Total 232 49,020 32,565 16,455 173,741 3.544 100% 66% 34% 100% 16.1 4.4
Real Estate in Pattya By Unit13%
Real Estate in Pattya By Value17% D t h d H
3%
1%3%
Detached House
Semi-detached House
Townhouse
1%1%
2%
Detached House
Semi-detached House
Townhouse
80%
Shophouse
Condominium
79%
Shophouse
Condominium
16Thailand’s First Real Estate Info Centre Since Thailand’s First Real Estate Info Centre Since 19941994AAGENCY FOR REAL ESTATE AFFAIRS (AREA)GENCY FOR REAL ESTATE AFFAIRS (AREA)
ISO 9001-2008CERTIFIED
79%

O ll f J l 2012Overall-as of July 2012
Price Range No. 0f Total Total Average Units Period(Mil.Baht) Projects Total Sold Left Value Average unit price Unit Sold Left Value Sold to go
(Mil.Baht) /Month (Mil.Baht) Average (Months)per Month
No. 0f Units Percentage of
per Month
Overall 0.500-1.000 15 2,244 1,227 1,017 2,187 251 0.974 5% 55% 45% 1% 16.7 4.0
1.001-2.000 87 18,094 12,766 5,328 27,604 1,880 1.526 37% 71% 29% 16% 21.6 2.8
2.001-3.000 106 13,544 8,813 4,731 33,751 1,077 2.492 28% 65% 35% 19% 10.2 4.4
3.001-5.000 110 7,956 5,117 2,839 31,187 277 3.920 16% 64% 36% 18% 2.5 10.3
5.001-10.000 86 4,818 3,279 1,539 34,000 195 7.057 10% 68% 32% 20% 2.3 7.9
10.001-20.000 50 1,623 992 631 22,568 42 13.905 3% 61% 39% 13% 0.8 15.2
>20.000 20 741 371 370 22,445 9 30.291 2% 50% 50% 13% 0.4 43.4
Total 232 49,020 32,565 16,455 173,741 3,730 3.544 100% 66% 34% 100% 16.1 4.4
17Thailand’s First Real Estate Info Centre Since Thailand’s First Real Estate Info Centre Since 19941994AAGENCY FOR REAL ESTATE AFFAIRS (AREA)GENCY FOR REAL ESTATE AFFAIRS (AREA)
ISO 9001-2008CERTIFIED

Overall-as of July 2012
Price Range No. 0f Total Total Average Units Period(Mil.Baht) Projects Total Sold Left Value Average unit price Unit Sold Left Value Sold to go
No. 0f Units Percentage of
(Mil.Baht) /Month (Mil.Baht) Average (Months)per Month
Detached House1.001-2.000 7 635 318 317 1,205 10 1.898 10% 50% 50% 4% 1.4 31.4,
2.001-3.000 26 2,382 1,391 991 6,252 45 2.625 38% 58% 42% 22% 1.7 21.9
3.001-5.000 33 1,840 1,231 609 7,330 46 3.984 29% 67% 33% 25% 1.4 13.2
5.001-10.000 20 911 661 250 6,116 13 6.714 15% 73% 27% 21% 0.7 19.1
10.001-20.000 8 398 302 96 5,926 4 14.890 6% 76% 24% 21% 0.5 23.0
>20.000 3 75 58 17 1,959 1 26.121 1% 77% 23% 7% 0.3 21.7
Total 76 6,241 3,961 2,280 28,789 120 4.613 100% 63% 37% 100% 1.6 19.0
SSemi-detached House3.001-5.000 7 676 539 137 1,179 17 1.745 49% 80% 20% 36% 2.4 8.3
5.001-10.000 6 372 153 219 928 12 2.494 27% 41% 59% 29% 2.0 18.1
10 001-15 000 4 331 160 171 1 139 7 3 441 24% 48% 52% 35% 1 8 24 310.001-15.000 4 331 160 171 1,139 7 3.441 24% 48% 52% 35% 1.8 24.3
Total 17 1379 852 527 3,246 36 2.354 100% 62% 38% 100% 2.1 14.8
18Thailand’s First Real Estate Info Centre Since Thailand’s First Real Estate Info Centre Since 19941994AAGENCY FOR REAL ESTATE AFFAIRS (AREA)GENCY FOR REAL ESTATE AFFAIRS (AREA)
ISO 9001-2008CERTIFIED

O ll f J l 2012Price Range No. 0f Total Total Average Units Period
(Mil.Baht) Projects Total Sold Left Value Average unit price Unit Sold Left Value Sold to go
No. 0f Units Percentage of
Overall-as of July 2012
( ) j g p g(Mil.Baht) /Month (Mil.Baht) Average (Months)
per Month
Townhouse% % % %0.500-1.000 6 801 389 412 787 20 0.982 53% 49% 51% 37% 3.3 20.6
1.001-2.000 9 555 296 259 826 19 1.489 37% 53% 47% 39% 2.1 13.6
2.001-3.000 1 43 31 12 103 1 2.400 3% 72% 28% 5% 1.4 8.8
3 001-5 000 2 110 59 51 430 2 3 905 7% 54% 46% 20% 1 0 25 43.001 5.000 2 110 59 51 430 2 3.905 7% 54% 46% 20% 1.0 25.4
Total 15 1509 775 734 2,146 43 1.422 100% 51% 49% 100% 2.8 17.3
Shophouse1.001-2.000 4 100 62 38 173 5 1.735 15% 62% 38% 8% 1.1 8.3
2.001-3.000 5 216 206 10 597 39 2.765 33% 95% 5% 27% 7.9 0.3
3.001-5.000 8 266 188 78 1,031 9 3.876 41% 71% 29% 46% 1.1 8.5
5.001-10.000 2 65 52 13 419 2 6.442 10% 80% 20% 19% 1.0 6.7
Total 17 647 508 139 2,220 55 3.432 100% 79% 21% 100% 3.2 2.5
19Thailand’s First Real Estate Info Centre Since Thailand’s First Real Estate Info Centre Since 19941994AAGENCY FOR REAL ESTATE AFFAIRS (AREA)GENCY FOR REAL ESTATE AFFAIRS (AREA)
ISO 9001-2008CERTIFIED

O ll f J l 2012Overall-as of July 2012
Price Range No. 0f Total Total Average Units Period(Mil.Baht) Projects Total Sold Left Value Average unit price Unit Sold Left Value Sold to go
(Mil.Baht) /Month (Mil.Baht) Average (Months)per Month
No. 0f Units Percentage of
Condominium0.500-1.000 9 1,443 838 605 1,400 231 0.970 4% 58% 42% 1% 25.7 2.6
1.001-2.000 64 16,128 11,551 4,577 24,220 1,830 1.502 41% 72% 28% 18% 28.6 2.5
2.001-3.000 71 10,531 7,032 3,499 25,870 979 2.457 27% 67% 33% 19% 13.8 3.6
3.001-5.000 69 5,409 3,479 1,930 21,258 212 3.930 14% 64% 36% 15% 3.1 9.1
5.001-10.000 64 3,842 2,566 1,276 27,465 180 7.149 10% 67% 33% 20% 2.8 7.1
10 001 20 000 42 1 225 690 535 16 642 37 13 585 3% 56% 44% 12% 0 9 14 310.001-20.000 42 1,225 690 535 16,642 37 13.585 3% 56% 44% 12% 0.9 14.3
>20.000 17 666 313 353 20,486 8 30.760 2% 47% 53% 15% 0.5 45.6
Total 136 39,244 26,469 12,775 137,340 3,477 3.500 100% 67% 33% 100% 25.6 3.7
20Thailand’s First Real Estate Info Centre Since Thailand’s First Real Estate Info Centre Since 19941994AAGENCY FOR REAL ESTATE AFFAIRS (AREA)GENCY FOR REAL ESTATE AFFAIRS (AREA)
ISO 9001-2008CERTIFIED

Table 2 : Situation of Newly Launched of Real Estate in Pattaya, 2012 (Jan-Jul)y , ( )
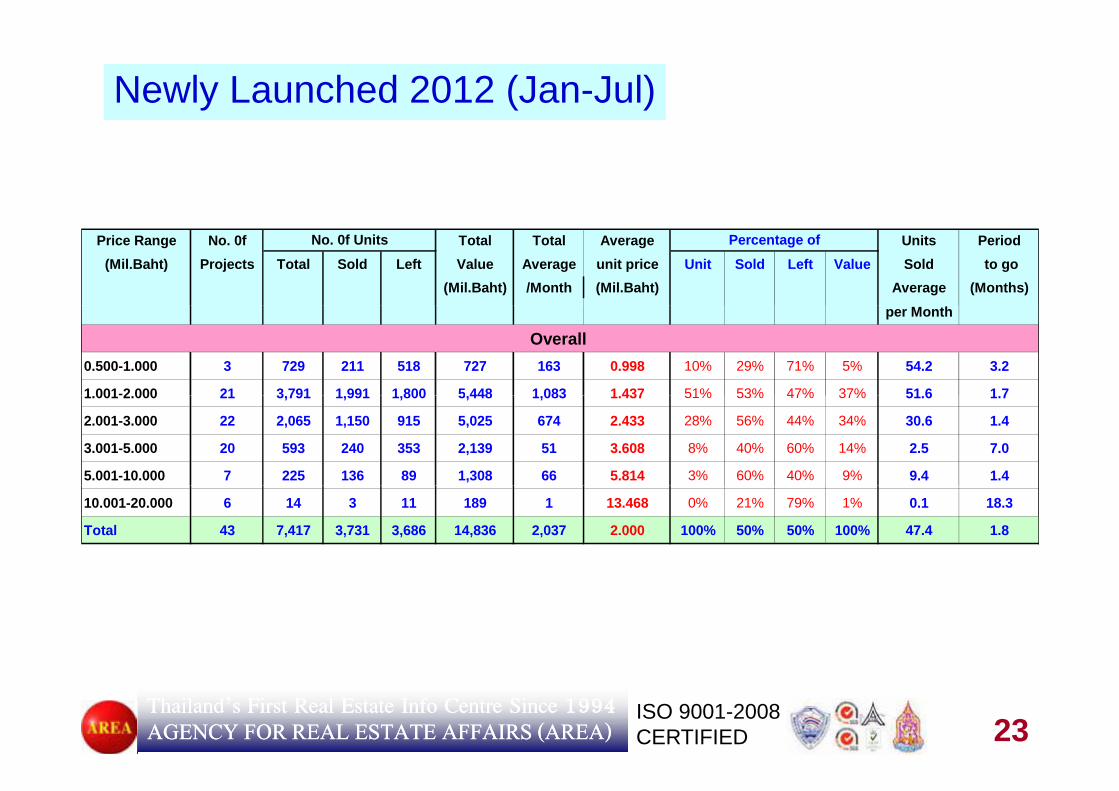
Newly Launched 2012 (Jan-Jul)Newly Launched 2012 (Jan-Jul)
Location No 0f Total Average Units PeriodNo 0f Units Percentage ofLocation No. 0f Total Average Units Period
Projects Total Sold Left Value unit price Unit Sold Left Value Sold to go
(Mil.Baht) (Mil.Baht) Average (Months)
M th
No. 0f Units Percentage of
per Month
Overall
Pattaya Seaside 28 6,543 3,268 3,275 12,270 1.875 88% 50% 50% 83% 69.8 1.7
Pattaya Hillside 15 874 463 411 2,566 2.936 12% 53% 47% 17% 5.4 5.1
Overall 43 7,417 3,731 3,686 14,836 2.000 100% 50% 50% 100% 47.4 1.8
21Thailand’s First Real Estate Info Centre Since Thailand’s First Real Estate Info Centre Since 19941994AAGENCY FOR REAL ESTATE AFFAIRS (AREA)GENCY FOR REAL ESTATE AFFAIRS (AREA)
ISO 9001-2008CERTIFIED

Newly Launched 2012 (Jan-Jul)Type No. 0f Total Average Units Period
Projects Total Sold Left Value unit price Unit Sold Left Value Sold to go (Mil.Baht) (Mil.Baht) Average (Months)
No. 0f Units Percentage of
per Month
Overall Detached House 3 213 84 129 702 3.295 3% 39% 61% 5% 8.6 5.0
Semi-detached House 2 218 18 200 656 3 009 3% 8% 92% 4% 3 0 33 3Semi-detached House 2 218 18 200 656 3.009 3% 8% 92% 4% 3.0 33.3
Shophouse 16 538 443 95 1,763 3.276 7% 82% 18% 12% 3.4 1.8
Condominium 24 6,448 3,186 3,262 11,716 1.817 87% 49% 51% 79% 81.3 1.7
Total 43 7,417 3,731 3,686 14,836 2.000 100% 50% 50% 100% 47.4 1.8
Newly Launched Real Estate in Pattya By Unit3% 3%
7%
Newly Launched Real Estate in Pattya By Value5% 4%
D t h d H
Detached House
Semi-detached House
12%Detached House
Semi-detached House
Shophouse
87%
Shophouse
Condominium
79%
Condominium
22Thailand’s First Real Estate Info Centre Since Thailand’s First Real Estate Info Centre Since 19941994AAGENCY FOR REAL ESTATE AFFAIRS (AREA)GENCY FOR REAL ESTATE AFFAIRS (AREA)
ISO 9001-2008CERTIFIED
87%
Newly Launched 2012 (Jan-Jul)
Price Range No. 0f Total Total Average Units Period(Mil.Baht) Projects Total Sold Left Value Average unit price Unit Sold Left Value Sold to go
(Mil.Baht) /Month (Mil.Baht) Average (Months)
No. 0f Units Percentage of
per Month
Overall 0.500-1.000 3 729 211 518 727 163 0.998 10% 29% 71% 5% 54.2 3.2
1 001-2 000 21 3 791 1 991 1 800 5 448 1 083 1 437 51% 53% 47% 37% 51 6 1 71.001 2.000 21 3,791 1,991 1,800 5,448 1,083 1.437 51% 53% 47% 37% 51.6 1.7
2.001-3.000 22 2,065 1,150 915 5,025 674 2.433 28% 56% 44% 34% 30.6 1.4
3.001-5.000 20 593 240 353 2,139 51 3.608 8% 40% 60% 14% 2.5 7.0
5.001-10.000 7 225 136 89 1,308 66 5.814 3% 60% 40% 9% 9.4 1.4
10.001-20.000 6 14 3 11 189 1 13.468 0% 21% 79% 1% 0.1 18.3
Total 43 7,417 3,731 3,686 14,836 2,037 2.000 100% 50% 50% 100% 47.4 1.8
23Thailand’s First Real Estate Info Centre Since Thailand’s First Real Estate Info Centre Since 19941994AAGENCY FOR REAL ESTATE AFFAIRS (AREA)GENCY FOR REAL ESTATE AFFAIRS (AREA)
ISO 9001-2008CERTIFIED

Newly Launched 2012 (Jan-Jul)
Price Range No. 0f Total Total Average Units PeriodNo. 0f Units Percentage of
(Mil.Baht) Projects Total Sold Left Value Average unit price Unit Sold Left Value Sold to go (Mil.Baht) /Month (Mil.Baht) Average (Months)
per Month
Detached House2.001-3.000 2 125 41 84 342 12 2.739 59% 33% 67% 49% 6.0 7.03.001-5.000 2 88 43 45 359 14 4.085 41% 49% 51% 51% 6.8 3.3Total 3 213 84 129 702 26 3.295 100% 39% 61% 100% 8.6 5.0
Semi-detached House2.001-3.000 1 60 18 42 144 6 2.400 28% 30% 70% 22% 6.0 7.03.001-5.000 1 158 0 158 512 0 3.240 72% 0% 100% 78% 0.0 -Total 2 218 18 200 656 6 3.009 100% 8% 92% 100% 3.0 33.3
Shophouse1 001 2 000 4 100 62 38 173 5 1 735 19% 62% 38% 10% 1 1 8 31.001-2.000 4 100 62 38 173 5 1.735 19% 62% 38% 10% 1.1 8.32.001-3.000 5 216 206 10 597 39 2.765 40% 95% 5% 34% 7.9 0.33.001-5.000 7 157 123 34 573 8 3.651 29% 78% 22% 33% 1.1 4.25.001-10.000 2 65 52 13 419 2 6.442 12% 80% 20% 24% 1.0 6.7Total 16 538 443 95 1 763 54 3 276 100% 82% 18% 100% 3 4 1 8Total 16 538 443 95 1,763 54 3.276 100% 82% 18% 100% 3.4 1.8
24Thailand’s First Real Estate Info Centre Since Thailand’s First Real Estate Info Centre Since 19941994AAGENCY FOR REAL ESTATE AFFAIRS (AREA)GENCY FOR REAL ESTATE AFFAIRS (AREA)
ISO 9001-2008CERTIFIED

0%0%0%0%0%0%
8%Thailand: Value of Housing Units Left for Sale Nationwide, 2012
1%1%
1%1%
1%1%0%0%0%0%0%0%0%
2%1%1%1%
SamuiSamui5%
Chiang MaiChiang Mai
52%5%
BangkokCha Am – Hua Hin
9%
Phuket
9%
Pattaya
25Thailand’s First Real Estate Info Centre Since Thailand’s First Real Estate Info Centre Since 19941994AAGENCY FOR REAL ESTATE AFFAIRS (AREA)GENCY FOR REAL ESTATE AFFAIRS (AREA)
ISO 9001-2008CERTIFIED
9%

26Thailand’s First Real Estate Info Centre Since Thailand’s First Real Estate Info Centre Since 19941994AAGENCY FOR REAL ESTATE AFFAIRS (AREA)GENCY FOR REAL ESTATE AFFAIRS (AREA)
ISO 9001-2008CERTIFIED
http://en.wikivisual.com/images/5/5d/System_Map_of_Bangkok_Rail_Transit_Network.jpg

No. ZoneHousing Projects in HCMC as of April 2009
No. Zone
1 A :CBD
2 B N th2 B : North
3 C : East
4 D S th4 D : South
5 E : West
6 F Ai t6 F : Airport
7 G : Others
27Thailand’s First Real Estate Info Centre Since Thailand’s First Real Estate Info Centre Since 19941994AAGENCY FOR REAL ESTATE AFFAIRS (AREA)GENCY FOR REAL ESTATE AFFAIRS (AREA)
ISO 9001-2008CERTIFIED

Table 1: Situation of Housing Projects in HCMC offered for sales as of April 2009
No. Zone Projects Units %Units Sold %Sold Left %left Value (US.$) %ValueAverage
Unit Price Average
Unit Price (US.$) (Baht)
1 A :CBD 37 11,057 20% 10,727 97% 330 3% 1,711,980,770 19% 154,832 5,419,131
2 B : North 35 8,488 15% 8,342 98% 146 2% 1,420,947,644 16% 167,407 5,859,233
3 C East 21 11 397 21% 10 223 90% 1 174 10% 2 393 127 982 26% 209 979 7 349 2573 C : East 21 11,397 21% 10,223 90% 1,174 10% 2,393,127,982 26% 209,979 7,349,257
4 D : South 36 11,860 22% 11,282 95% 578 5% 2,355,571,830 26% 198,615 6,951,519
5 E : West 28 8,347 15% 7,767 93% 580 7% 817,459,754 9% 97,935 3,427,710
6 F : Airport 6 1 769 3% 1 769 100% 0 0% 160 020 200 2% 90 458 3 166 0306 F : Airport 6 1,769 3% 1,769 100% 0 0% 160,020,200 2% 90,458 3,166,030
7 G : Others 3 2,108 4% 2,108 100% 0 0% 189,244,298 2% 89,774 3,142,102
รวม 166 55,026 100% 52,218 95% 2,808 5% 9,048,352,478 100% 164,438 5,755,322
28Thailand’s First Real Estate Info Centre Since Thailand’s First Real Estate Info Centre Since 19941994AAGENCY FOR REAL ESTATE AFFAIRS (AREA)GENCY FOR REAL ESTATE AFFAIRS (AREA)
ISO 9001-2008CERTIFIED

Table 5 : Situation of Newly Launched Housing Projects in HCMC
year Project Total (Unit) Value (US.$) Price Per Unit (US.$) Price Per Unit (Baht)
2001 3 714 85,013,750 119,067 4,167,341
2002 4 1,642 178,530,500 108,727 3,805,461
2003 9 2,918 270,359,250 92,652 3,242,829
2004 18 6,985 595,470,260 85,250 2,983,745
2005 23 5,116 615,396,562 120,289 4,210,102
2006 39 8,610 1,279,793,480 148,640 5,202,413
2007 41 14,070 2,695,962,159 191,611 6,706,374
2008 12 2,449 249,202,009 101,757 3,561,482
2009-April 4 1,741 148,219,025 85,134 2,979,705p
Total 153 44,245 6,117,946,995 138,274 4,839,601
29Thailand’s First Real Estate Info Centre Since Thailand’s First Real Estate Info Centre Since 19941994AAGENCY FOR REAL ESTATE AFFAIRS (AREA)GENCY FOR REAL ESTATE AFFAIRS (AREA)
ISO 9001-2008CERTIFIED

A Inner city areaA Inner city areaB NorthC North-westD Mid westD Mid -westE West
Housing Projects in
Phnom Penh as of A il 2009April 2009
30Thailand’s First Real Estate Info Centre Since Thailand’s First Real Estate Info Centre Since 19941994AAGENCY FOR REAL ESTATE AFFAIRS (AREA)GENCY FOR REAL ESTATE AFFAIRS (AREA)
ISO 9001-2008CERTIFIED

Table 1: Situation of Housing Projects in Phnom Penh offered for sales as of April 2009
Average UnitNo. Zone Projects Units %Units Sold %Sold Left %left Value (US.$) %Value Average Unit Price (U.S. $)
1 CBD 13 2,102 7% 1,759 84% 343 16% 375,359,100 14% 178,572
2 WEST 20 11,663 38% 5,284 45% 6,379 55% 826,136,220 30% 70,834
3 MID-WEST 20 6,218 20% 5,269 85% 949 15% 438,784,000 16% 70,567
4 NORTH 14 3,245 11% 2,101 65% 1,144 35% 409,107,301 15% 126,073
5 NORTH-WEST 32 7,365 24% 6,206 84% 1,159 16% 721,219,684 26% 97,925
รวม 99 30,593 100% 20,619 67% 9,974 33% 2,770,606,305 100% 90,563
31Thailand’s First Real Estate Info Centre Since Thailand’s First Real Estate Info Centre Since 19941994AAGENCY FOR REAL ESTATE AFFAIRS (AREA)GENCY FOR REAL ESTATE AFFAIRS (AREA)
ISO 9001-2008CERTIFIED

Table 4: Situation of Housing Projects in Phnom Penh offered for sales as of April 2009#1/2
Total Number of UnitsPrice (U.S. $) Detached Duplex Townhouse Shophouse Condominium Land Subdivi Total<15,000
15,001-30,000 332 1,207 1,53930,001-60,000 311 49 2,318 9,153 80 11,91160,001-90,000 1,220 8,759 120 10,09990,001-150,000 7 460 489 2,113 128 3,197150,001-300,000 493 209 451 428 1,359 2,940300,001-600,000 685 22 108 815>600,000 92 92
Overall 1,496 740 4,918 21,660 1,699 80 30,593
Development Value (Mil.U.S. $)<15,000
15,001-30,000 5 35 4030,001-60,000 13 3 125 418 4 56460,001-90,000 95 662 10 76890,001-150,000 1 63 61 266 13 403150,001-300,000 117 40 94 96 263 610300,001-600,000 265 11 38 315>600,000 72 72
32Thailand’s First Real Estate Info Centre Since Thailand’s First Real Estate Info Centre Since 19941994AAGENCY FOR REAL ESTATE AFFAIRS (AREA)GENCY FOR REAL ESTATE AFFAIRS (AREA)
ISO 9001-2008CERTIFIED
Overall 396 117 418 1,477 358 4 2,771

Table 4: Situation of Housing Projects in Phnom Penh offered for sales as of April 2009 #2/2
Average Unit Price (U.S. $)Price (U.S. $) Detached Duplex Townhouse Shophouse Condominium Land Subdivi Total<15,000
15,001-30,000 16,005 28,757 26,00630,001-60,000 42,000 60,000 53,921 45,699 53,000 47,31060,001-90,000 77,910 75,613 85,000 76,00290,001-150,000 95,000 136,652 124,277 125,867 100,000 126,072150,001-300,000 236,923 190,191 208,849 224,813 193,358 207,394300 001 600 000300,001-600,000 387,231 513,100 352,435 386,018>600,000 784,000 784,000Overall 264,561 157,889 85,070 68,212 210,654 53,000 90,563
% Sold% SoldPrice (U.S. $) Detached Duplex Townhouse Shophouse Condominium Land Subdivi Total<15,000
15 001-30 000 17% 83%15,001 30,000 17% 83%
30,001-60,000 29% 6% 46% 73% 100% 67%
60,001-90,000 34% 60% 0% 56%
90,001-150,000 100% 99% 82% 91% 70% 90%, ,
150,001-300,000 91% 80% 69% 87% 77% 80%
300,001-600,000 88% 0% 36% 79%
>600,000 100% 100%
33Thailand’s First Real Estate Info Centre Since Thailand’s First Real Estate Info Centre Since 19941994AAGENCY FOR REAL ESTATE AFFAIRS (AREA)GENCY FOR REAL ESTATE AFFAIRS (AREA)
ISO 9001-2008CERTIFIED
Overall 77% 85% 46% 70% 67% 100% 67%

6Location of 134 HousingProjects in Manila, Phili i f Q1/2209
57
Philippines as of Q1/2209
37
TEN LOCATIONSIN THIS STUDY1 M k i
12
4
81 Makati2 Manila3 San Juan 1 4
9
3 San Juan4 Pateros5 Valenzuela6 Quezon City North7 Quezon City 8 Pasig-Cainta 108 Pasig-Cainta9 Pasay10 Southern Suburbs
34Thailand’s First Real Estate Info Centre Since Thailand’s First Real Estate Info Centre Since 19941994AAGENCY FOR REAL ESTATE AFFAIRS (AREA)GENCY FOR REAL ESTATE AFFAIRS (AREA)
ISO 9001-2008CERTIFIED

No. Zone Project Units %Units Sold %Sold Left %LeftValue
(Mil.US.$)
%ValueAv.Price(US.$)
Table 1: Situation of Housing Projects in Manila offered for sales as of April 2009
$)( )
1 A : Makati 22 13,672 14% 8,699 64% 4,973 36% 1,109 18% 81,097
2 B : Manila 14 12,677 13% 6,862 54% 5,816 46% 628 10% 49,538
3 C : San Juan 14 26,155 26% 4,763 18% 21,392 82% 1,071 17% 40,941
4 D : Pateros 14 5,231 5% 2,559 49% 2,673 51% 547 9% 104,575
5 E : Valenzuela 8 2,543 3% 1,008 40% 1,535 60% 113 2% 44,584
6 F : Quezon City North 6 6,486 6% 2,572 40% 3,914 60% 313 5% 48,327
7 G : Quezon City 11 4 183 4% 1 697 41% 2 486 59% 167 3% 39 8167 G : Quezon City 11 4,183 4% 1,697 41% 2,486 59% 167 3% 39,816
8 H : Pasig-Cainta 5 2,815 3% 1,707 61% 1,108 39% 115 2% 40,967
9 I : Pasay 10 9,984 10% 7,044 71% 2,940 29% 723 12% 72,399y , , ,
10 J : Southern Suburbs 30 16,356 16% 10,055 61% 6,301 39% 1,418 23% 86,703
134 100,102 100% 46,965 47% 36,388 36% 6,204 100% 61,979Total
35Thailand’s First Real Estate Info Centre Since Thailand’s First Real Estate Info Centre Since 19941994AAGENCY FOR REAL ESTATE AFFAIRS (AREA)GENCY FOR REAL ESTATE AFFAIRS (AREA)
ISO 9001-2008CERTIFIED

Price (U.S. $) Detached Duplex Townhouse Shophouse Condominium Total Price (U.S. $) Detached Duplex Townhouse Shophouse Condominium Total<15,000 0 <15,00015,000-30,000 100 400 27,917 28,417 15,000-30,000 2,184 2,248 2,846 2,835
Table 4: Situation of Housing Projects in Manila offered for sales as of April 2009Total Number of Units Average Unit Price (U.S.$)
30,001-60,000 6,843 5,520 1,252 28,585 42,200 30,001-60,000 5,301 4,280 3,754 4,556 4,61760,001-90,000 2,731 150 107 18 13,229 16,235 60,001-90,000 6,883 6,144 6,592 6,711 6,990 6,96190,001-150,000 2,083 4,791 6,874 90,001-150,000 11,124 11,025 11,055150,001-300,000 80 519 4,060 4,659 150,001-300,000 26,400 23,844 19,961 20,504300,001-600,000 1,717 1,717 300,001-600,000 35,241 35,241>600,000 0 >600,000600,000 0 600,000Overall 13,454 5,770 2,278 18 78,582 100,102 Overall 10,470 4,292 8,200 6,711 5,548 6,198
Number of Units Sold % SoldPrice (U.S. $) Detached Duplex Townhouse Shophouse Condominium Total Price (U.S. $) Detached Duplex Townhouse Shophouse Condominium Total<15,000 0 <15,00015,000-30,000 15 305 6,327 6,647 15,000-30,000 15% 76% 23% 23%30 001 60 000 2 920 3 800 640 16 313 23 673 30 001 60 000 43% 69% 51% 57% 56%30,001-60,000 2,920 3,800 640 16,313 23,673 30,001-60,000 43% 69% 51% 57% 56%60,001-90,000 1,621 50 78 10 6,657 8,416 60,001-90,000 59% 33% 73% 56% 50% 52%90,001-150,000 1,044 2,882 3,926 90,001-150,000 50% 60% 57%150,001-300,000 56 269 2,917 3,242 150,001-300,000 70% 52% 72% 70%300,001-600,000 1,061 1,061 300,001-600,000 62% 62%>600,000 0 >600,000Overall 6,702 3,865 1,292 10 35,097 46,965 Overall 50% 67% 57% 56% 45% 47%
Development Value (Mil.U.S. $) % Sold Average per month<15,000 <15,00015,000-30,000 2 9 794 806 15,000-30,000 2% 2% 3% 3%30,001-60,000 363 236 47 1,302 1,948 30,001-60,000 5% 4% 4% 5% 5%60 001-90 000 188 9 7 1 925 1 130 60 001-90 000 7% 6% 7% 7% 7% 7%60,001 90,000 188 9 7 1 925 1,130 60,001 90,000 7% 6% 7% 7% 7% 7%90,001-150,000 232 528 760 90,001-150,000 11% 11% 11%150,001-300,000 21 124 810 955 150,001-300,000 26% 24% 20% 21%300,001-600,000 605 605 300,001-600,000 35% 35%>600,000 >600,000Overall 1,409 248 187 1 4,360 6,204 Overall 10% 4% 8% 7% 6% 6%
36Thailand’s First Real Estate Info Centre Since Thailand’s First Real Estate Info Centre Since 19941994AAGENCY FOR REAL ESTATE AFFAIRS (AREA)GENCY FOR REAL ESTATE AFFAIRS (AREA)
ISO 9001-2008CERTIFIED

Location House Type Price Range Total Sold Left Value %Sold Av.Makati Condominium 30,001-60,000 3,640 1,854 1,786 160,198,021 13%
60,001-90,000 1,000 300 700 72,340,426 8%90,001-150,000 748 323 425 75,071,020 11%, , , ,150,001-300,000 1,296 778 518 254,468,304 15%Total 6,684 3,256 3,428 562,077,770 12%
Manila Condominium 15,000-30,000 1,700 102 1,598 45,737,234 2%30,001-60,000 700 140 560 32,299,787 5%30,001 60,000 700 140 560 32,299,787 5%Total 2,400 242 2,158 78,037,021 3%
Valenzuela Detached house 90,001-150,000 520 390 130 49,376,368 19%Townhouse 15,000-30,000 300 285 15 6,782,700 24%Condominium 15 000-30 000 600 6 594 15 631 915 1%Condominium 15,000 30,000 600 6 594 15,631,915 1%Total 15,000-30,000 900 291 609 22,414,615 8%
90,001-150,000 520 390 130 49,376,368 19%Total 1,420 681 739 71,790,983 12%
Quezon City Detached house 60 001-90 000 427 170 257 29 526 596 10%Quezon City Detached house 60,001 90,000 427 170 257 29,526,596 10%90,001-150,000 130 0 130 11,862,044 0%Total 557 170 387 41,388,639 8%
Shophouse 60,001-90,000 18 10 8 1,207,915 14%Condominium 15 000-30 000 748 448 300 14 164 128 15%Condominium 15,000-30,000 748 448 300 14,164,128 15%
30,001-60,000 1,386 263 1,123 57,601,378 7%Total 2,134 711 1,423 71,765,506 10%
Total 15,000-30,000 748 448 300 14,164,128 15%30 001 60 000 1 386 263 1 123 57 601 378 7%
SALES SITUATION OF SELECTED LOCATIONS LAUNCHED INSALES SITUATION OF SELECTED LOCATIONS LAUNCHED IN 20092009
30,001-60,000 1,386 263 1,123 57,601,378 7%60,001-90,000 445 180 265 30,734,511 10%90,001-150,000 130 0 130 11,862,044 0%Total 2,709 891 1,818 114,362,060 9%
37Thailand’s First Real Estate Info Centre Since Thailand’s First Real Estate Info Centre Since 19941994AAGENCY FOR REAL ESTATE AFFAIRS (AREA)GENCY FOR REAL ESTATE AFFAIRS (AREA)
ISO 9001-2008CERTIFIED
SALES SITUATION OF SELECTED LOCATIONS LAUNCHED IN SALES SITUATION OF SELECTED LOCATIONS LAUNCHED IN 20092009

JakartaJakartaJakartaJakartaLocationsLocationsLocations Locations
of of 219 219 Housing Housing P j tP j tProjects Projects
SurveyedSurveyed38
Thailand’s First Real Estate Info Centre Since Thailand’s First Real Estate Info Centre Since 19941994AAGENCY FOR REAL ESTATE AFFAIRS (AREA)GENCY FOR REAL ESTATE AFFAIRS (AREA)
ISO 9001-2008CERTIFIED
SurveyedSurveyed
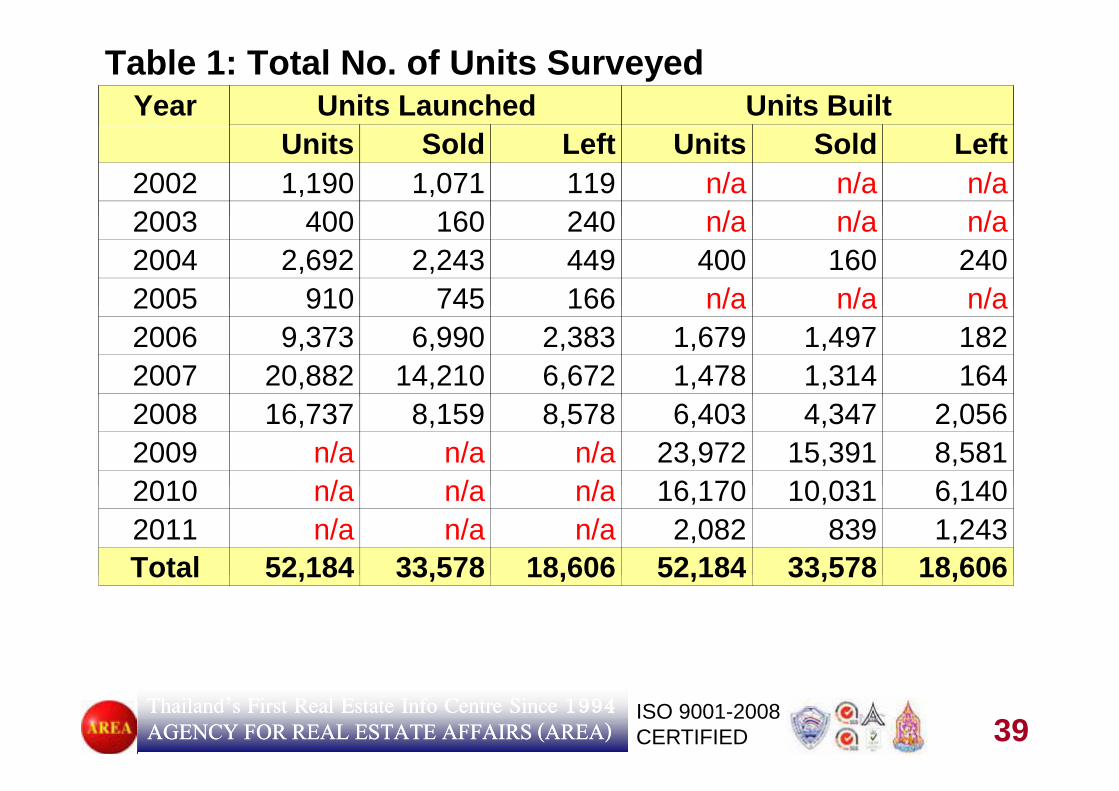
Table 1: Total No. of Units SurveyedYear Units Launched Units Built
Units Sold Left Units Sold Left2002 1,190 1,071 119 n/a n/a n/a2003 400 160 240 n/a n/a n/a2003 400 160 240 n/a n/a n/a2004 2,692 2,243 449 400 160 2402005 910 745 166 n/a n/a n/a2005 910 745 166 n/a n/a n/a2006 9,373 6,990 2,383 1,679 1,497 1822007 20,882 14,210 6,672 1,478 1,314 1642008 16,737 8,159 8,578 6,403 4,347 2,0562009 n/a n/a n/a 23,972 15,391 8,5812010 n/a n/a n/a 16 170 10 031 6 1402010 n/a n/a n/a 16,170 10,031 6,1402011 n/a n/a n/a 2,082 839 1,243Total 52,184 33,578 18,606 52,184 33,578 18,606Total 52,184 33,578 18,606 52,184 33,578 18,606
39Thailand’s First Real Estate Info Centre Since Thailand’s First Real Estate Info Centre Since 19941994AAGENCY FOR REAL ESTATE AFFAIRS (AREA)GENCY FOR REAL ESTATE AFFAIRS (AREA)
ISO 9001-2008CERTIFIED

Table 2: Situation of Housing Projects in Jakarta as of December 2008No. Zone Proj Total Sold Value % of
-ect Units % Units % Mil.Rupiah Bil.US$ Mil.Rp/Unit Value
1 Central Jakarta 38 14,837 28% 9,566 64% 21,631,507 1,967 1,458 53%2 Western Jakarta 21 5,180 10% 3,447 67% 5,758,006 523 1,112 14%2 Western Jakarta 21 5,180 10% 3,447 67% 5,758,006 523 1,112 14%3 Berkasi 29 7,597 15% 4,657 61% 2,071,372 188 273 5%4 Cileungsi 31 7,632 15% 4,840 63% 3,386,585 308 444 8%5 Bogor 18 6,188 12% 4,828 78% 2,976,407 271 481 7%6 Depok - Ciputat 48 5,280 10% 2,806 53% 1,903,171 173 360 5%7 Tangerang 34 5,470 10% 3,434 63% 3,394,604 309 621 8%g g , , , ,
Total 219 52,184 100% 33,578 64% 41,121,652 3,738 788 100%Agency for Real Estate Affairs, www.area.co.thNote: US$ 1 = Rp.11,000Note: US$ 1 Rp.11,000
40Thailand’s First Real Estate Info Centre Since Thailand’s First Real Estate Info Centre Since 19941994AAGENCY FOR REAL ESTATE AFFAIRS (AREA)GENCY FOR REAL ESTATE AFFAIRS (AREA)
ISO 9001-2008CERTIFIED

Table 5: Situation of Housing Projects in Jakarta offered for sales as of December 2008Total Number of Units Average Unit Price (Mil.Rupiah)
Price (Mil.Rupiah) Low-rise Hsg Condominium Total Price (Mil.Rupiah) Lowrise Hsg Condominium Total<120 12 930 1 418 14 348 <120 105 129 107<120 12,930 1,418 14,348 <120 105 129 107120-200 555 555 120-200 200 200201-300 4,883 435 5,318 201-300 246 251 246301-500 5,835 2,697 8,532 301-500 383 408 391501-800 3,944 2,379 6,323 501-800 637 689 657501 800 3,944 2,379 6,323 501 800 637 689 657>800 7,600 9,508 17,108 >800 1,522 2,010 1,793Overall 35,747 16,437 52,184 Overall 531 1,347 788
Number of Units Sold % Sold<120 8,332 510 8,842 <120 64% 36% 62%120-200 454 454 120-200 82% 82%201-300 2,989 335 3,324 201-300 61% 77% 63%301-500 3,799 1,853 5,652 301-500 65% 69% 66%501-800 2,664 1,683 4,347 501-800 68% 71% 69%
800 5 004 5 956 10 960 800 66% 63% 64%>800 5,004 5,956 10,960 >800 66% 63% 64%Overall 23,242 10,337 33,579 Overall 65% 63% 64%
Development Value (Rupiah) % Sold everrage per month<120 1,356,893 182,972 1,539,865 <120 7.0% 4.0% 8.0%120 200 111 041 111 041 120 200 5 0% 5 0%120-200 111,041 111,041 120-200 5.0% 5.0%201-300 1,201,785 109,025 1,310,810 201-300 9.0% 6.0% 9.0%301-500 2,232,275 1,100,923 3,333,198 301-500 5.0% 6.0% 6.0%501-800 2,512,633 1,638,898 4,151,531 501-800 4.0% 3.0% 4.0%>800 11,568,853 19,106,354 30,675,207 >800 4.0% 5.0% 4.0%800 ,568,853 9, 06,35 30,675,207 800 0% 5 0% 0%Overall 18,983,480 22,138,172 41,121,652 Overall 6.0% 5.0% 6.0%Agency for Real Estate Affairs, www.area.co.th
41Thailand’s First Real Estate Info Centre Since Thailand’s First Real Estate Info Centre Since 19941994AAGENCY FOR REAL ESTATE AFFAIRS (AREA)GENCY FOR REAL ESTATE AFFAIRS (AREA)
ISO 9001-2008CERTIFIED

Considering the economic situation of countries compared to 2010 or two years ago, 56% assessed that it was better. Only 7% said that it was worsening The rest (36%) saw no change In detail most valuerswas worsening. The rest (36%) saw no change. In detail, most valuers from Brunei, Singapore, and Thailand saw no change; whereas, the rest saw some significant, positive changes. However, regarding the g g g geconomy in the next two years (2014), most (67%) said that it would be better. Only 4% said that it was worsening. Most of the Thai valuers assessed that the situation could be the same as todayassessed that the situation could be the same as today.
In the case of property markets, 63% assessed that the situation was better than that in 2010 However only half of the valuers in Thailandbetter than that in 2010. However, only half of the valuers in Thailand and Brunei assessed the situation in this way. This might be due to the past political turmoil in Thailand or the economic stagnation in Brunei. Concerning future prospects for 2014, most (66%) believed that they would be better. Only 8% said the contrary. In the case of Thailand, it was considered that the 2014 property markets would still be the samewas considered that the 2014 property markets would still be the same as today. Perhaps Thai valuers were not so confident about the future prospects of the economy or the property markets.
42Thailand’s First Real Estate Info Centre Since Thailand’s First Real Estate Info Centre Since 19941994AAGENCY FOR REAL ESTATE AFFAIRS (AREA)GENCY FOR REAL ESTATE AFFAIRS (AREA)
ISO 9001-2008CERTIFIED

Considering the AEC, 62% perceived that the AEC would have a positive effect on their own countries. However, for the countries outside the ASEAN region this would not have much effect Among theoutside the ASEAN region, this would not have much effect. Among the ASEAN countries, Thailand and Vietnam seemed to be worried about the AEC. Perhaps competition might be worrying them.g y g
Vietnam seemed to be most ready for the AEC in 2015, where the level of readiness assessed by valuers was 86%. The second was Malaysia at 72%, and the third was Thailand at 67%, followed by Indonesia (63%). Brunei and the Philippines earned 58% and 57%. The lowest score was Cambodia (48%) There was no assessment for Singaporescore was Cambodia (48%). There was no assessment for Singapore because of the few numbers of respondents in this case.
43Thailand’s First Real Estate Info Centre Since Thailand’s First Real Estate Info Centre Since 19941994AAGENCY FOR REAL ESTATE AFFAIRS (AREA)GENCY FOR REAL ESTATE AFFAIRS (AREA)
ISO 9001-2008CERTIFIED

It is expected that in terms of real estate development, Thailand will be among the largest markets. According to the Agency for Real Estate Affairs which is Thailand’s first and largest real estate information andAffairs, which is Thailand s first and largest real estate information and valuation centre, the annual development value of real estate is around US$ 10 billion. Therefore, investors from other countries may like to ycome to this attractive market. Although the Jakarta and Manila markets are smaller to that of Bangkok, they both will have strong attraction for investors The fast growing economy and strong political stability ofinvestors. The fast-growing economy and strong political stability of Indonesia and the Philippines are among the major drives behind the promising property markets.
44Thailand’s First Real Estate Info Centre Since Thailand’s First Real Estate Info Centre Since 19941994AAGENCY FOR REAL ESTATE AFFAIRS (AREA)GENCY FOR REAL ESTATE AFFAIRS (AREA)
ISO 9001-2008CERTIFIED

http://en.wikipedia.org/wiki/List_of_cities_in_Malaysia
http://www nationsonline org/oneworld/map/malaysia map htmhttp://www.nationsonline.org/oneworld/map/malaysia_map.htm
45Thailand’s First Real Estate Info Centre Since Thailand’s First Real Estate Info Centre Since 19941994AAGENCY FOR REAL ESTATE AFFAIRS (AREA)GENCY FOR REAL ESTATE AFFAIRS (AREA)
ISO 9001-2008CERTIFIED

46Thailand’s First Real Estate Info Centre Since Thailand’s First Real Estate Info Centre Since 19941994AAGENCY FOR REAL ESTATE AFFAIRS (AREA)GENCY FOR REAL ESTATE AFFAIRS (AREA)
ISO 9001-2008CERTIFIED

http://en.wikipedia.org/wiki/Cities_of_the_Philippines
47Thailand’s First Real Estate Info Centre Since Thailand’s First Real Estate Info Centre Since 19941994AAGENCY FOR REAL ESTATE AFFAIRS (AREA)GENCY FOR REAL ESTATE AFFAIRS (AREA)
ISO 9001-2008CERTIFIED

http://www.private-detective-thailand.com/index.php?lay=show&ac=article&Id=264450
http://en.wikipedia.org/wiki/List_of_cities_in_Thailand
48Thailand’s First Real Estate Info Centre Since Thailand’s First Real Estate Info Centre Since 19941994AAGENCY FOR REAL ESTATE AFFAIRS (AREA)GENCY FOR REAL ESTATE AFFAIRS (AREA)
ISO 9001-2008CERTIFIED

49Thailand’s First Real Estate Info Centre Since Thailand’s First Real Estate Info Centre Since 19941994AAGENCY FOR REAL ESTATE AFFAIRS (AREA)GENCY FOR REAL ESTATE AFFAIRS (AREA)
ISO 9001-2008CERTIFIED

http://www.seismo.unr.edu/ftp/pub/louie/class/100/effects-kobe.html
Kobe Comparison, Kobe Comparison, 19951995 andand 200520051995 1995 and and 20052005httphttp://://wwwwww..citycity..kobekobe..jpjp//cityofficecityoffice//1515//020020//quaquakeke//teitenteiten//tt--index_eindex_e..htmlhtml
50Thailand’s First Real Estate Info Centre Since Thailand’s First Real Estate Info Centre Since 19941994AAGENCY FOR REAL ESTATE AFFAIRS (AREA)GENCY FOR REAL ESTATE AFFAIRS (AREA)
ISO 9001-2008CERTIFIED

Pinatubo, the Philippines:Cleveland Volcano in the Aleutian
Islands of Alaska:, pphttp://upload.wikimedia.org/wikipedia/commons/1/1f/
Pinatubo_ash_plume_910612.jpghttp://upload.wikimedia.org/wikipedia/commons
/4/4a/MtCleveland_ISS013-E-24184.jpg
Krakatoa (1883), Sumbava (1915), Toba Lake (70,000 years ago)
51Thailand’s First Real Estate Info Centre Since Thailand’s First Real Estate Info Centre Since 19941994AAGENCY FOR REAL ESTATE AFFAIRS (AREA)GENCY FOR REAL ESTATE AFFAIRS (AREA)
ISO 9001-2008CERTIFIED
Toba Lake (70,000 years ago)

Tsunami, 1994The December-26-2004 Tsunami: 5,395 confirmed deaths, 8,457 , , ,
injuries and 2,817 missing in Thailand. For Phuket, 259 were dead, 1,111 were injured and 700 still were missing.
52Thailand’s First Real Estate Info Centre Since Thailand’s First Real Estate Info Centre Since 19941994AAGENCY FOR REAL ESTATE AFFAIRS (AREA)GENCY FOR REAL ESTATE AFFAIRS (AREA)
ISO 9001-2008CERTIFIED

Property prices even increased in Acehdue to better infrastructure improvement.
53Thailand’s First Real Estate Info Centre Since Thailand’s First Real Estate Info Centre Since 19941994AAGENCY FOR REAL ESTATE AFFAIRS (AREA)GENCY FOR REAL ESTATE AFFAIRS (AREA)
ISO 9001-2008CERTIFIED
p

Phuket’s Phuket’s BeachBeach0 | 0 | 0 | 8 0 | 8 | 0 0
2.0 | 2.2 | 2.5 | 3.0| 3.0 | 5.0BeachBeach
LandLandMai Khao Ao Maphrao5.0 | 5.0 | 7.0 | 8.0 | 8.5| 10.0
2.5 | 3.0 | 4.5 | 5.0| 5.0 |7.0Ao KungNai Yang6.0 | 6.0 | 8.0 | 9.0 | 9.5 | 12.0
Prices,Prices,JulyJuly 0404,,
Nai Thon Ao Po7.0 | 7.0 | 8.0 | 10.0 | 11.0 | 15.0
|
Nai Yang
July July 0404,,Apr. Apr. 0505,,MarMar 0707
Bang Tao
S i
7.5 | 7.5 | 10.0 | 11.0| 12.0| 15.0
9.0 | 10.0 | 12.0 | 14.0| 15.0 | 18.0
3.0 | 3.5 | 4.5 | 5.0| 5.0 |7.5
Mar. Mar. 0707, , Mar. Mar. 0808,,
Surin Sapam3.0 | 3.3 | 4.0 | 4.5| 4.5 |7.0
Kamala10.0 | 12.0 | 15.0 | 16.0| 17.0 |20.0
Aug. Aug. 0909DecDec 1212
Patong40.0 | 40.0 | 60.0 | 70.0| 80.0 | 120.0
|
Serae5.0 | 5.0 | 7.0 | 8.0| 8.0 | 10.0
Dec.Dec.1212Karon
K t
Phuket20.0 | 20.0 | 25.0 | 30.0| 35.0| 42.0
10.0 | 12.0 | 15.0 | 18.0| 20.0 | 25.0
6.0 | 6.5 | 7.0 | 8.0| 8.5| 10.0
Chalong 5 0 | 5 5 | 6 0 | 7 0| 7 5| 9 5
54Thailand’s First Real Estate Info Centre Since Thailand’s First Real Estate Info Centre Since 19941994AAGENCY FOR REAL ESTATE AFFAIRS (AREA)GENCY FOR REAL ESTATE AFFAIRS (AREA)
ISO 9001-2008CERTIFIED
Kata
Rawai5.0 | 5.5 | 6.0 | 7.0| 7.5| 9.0
Chalong 5.0 | 5.5 | 6.0 | 7.0| 7.5| 9.5

HILO, HAWAIIHILO, HAWAII19601960 VICTIM OF TSUNMIVICTIM OF TSUNMI1960 1960 VICTIM OF TSUNMIVICTIM OF TSUNMIThe buildings of downtown Hilo Town carry the legacy asThe buildings of downtown Hilo Town carry the legacy asThe buildings of downtown Hilo Town carry the legacy as The buildings of downtown Hilo Town carry the legacy as the commerce center that sugar built. Despite tsunami, the commerce center that sugar built. Despite tsunami, threats of lava flow the end of the sugar industry and thethreats of lava flow the end of the sugar industry and thethreats of lava flow, the end of the sugar industry and the threats of lava flow, the end of the sugar industry and the resulting economic consequences these buildings resulting economic consequences these buildings remain They are a lot like the people of Hilo they areremain They are a lot like the people of Hilo they areremain. They are a lot like the people of Hilo, they are remain. They are a lot like the people of Hilo, they are survivors who refuse to give in to forces of both natural survivors who refuse to give in to forces of both natural and commercialand commercial (http://www(http://www 123123relocation com/Hawaii/Hilo/)relocation com/Hawaii/Hilo/)and commercial. and commercial. (http://www.(http://www.123123relocation.com/Hawaii/Hilo/)relocation.com/Hawaii/Hilo/)
House prices in Hawaii increased House prices in Hawaii increased 1111%% per year durinper year during g 1975 1975 to to 20072007 (http://www.ofheo.gov/media/hpi/4q07hpi_sts.csv)
55Thailand’s First Real Estate Info Centre Since Thailand’s First Real Estate Info Centre Since 19941994AAGENCY FOR REAL ESTATE AFFAIRS (AREA)GENCY FOR REAL ESTATE AFFAIRS (AREA)
ISO 9001-2008CERTIFIED

War & Contamination,War & Contamination, Hiroshima- Tourist destination:ou st dest at oOn Monday, August 6, 1945, the nuclear weapon Little Boy was dropped on Hiroshima, . . . directly killing an estimated 80,000 people. By y g , p p ythe end of the year, injury and radiation brought total casualties to 90,000-140,000. Approximately 69% of the city's buildings were pp y y gcompletely destroyed, and 6.6% severely damaged. . . Hiroshima was rebuilt after the war.http://en.wikipedia.org/wiki/Hiroshima
56Thailand’s First Real Estate Info Centre Since Thailand’s First Real Estate Info Centre Since 19941994AAGENCY FOR REAL ESTATE AFFAIRS (AREA)GENCY FOR REAL ESTATE AFFAIRS (AREA)
ISO 9001-2008CERTIFIED

http://www.cuttingedge.org/NEWS/n1715.cfm http://www.cuttingedge.org/NEWS/n1715.cfm
Case StudyCase Study 66: Bali Bomb &: Bali Bomb &The Monument of the Victimshttp://picasaweb.google.com/jeanhooi/BaliRetreat07/photo#5090317410640734994
Case Study Case Study 66: Bali Bomb & : Bali Bomb & Terrorism, October Terrorism, October 1212, , 20022002
57Thailand’s First Real Estate Info Centre Since Thailand’s First Real Estate Info Centre Since 19941994AAGENCY FOR REAL ESTATE AFFAIRS (AREA)GENCY FOR REAL ESTATE AFFAIRS (AREA)
ISO 9001-2008CERTIFIED
#5090317410640734994

Number of Foreign Guests In Classified Hotels, Indonesia (Thousand)Province 2002 2003 2004 2005 2006Nanggroe Aceh Darussalam 1.7 0.5 0.5 9.7 25.1North Sumatera 107.0 84.9 117.9 122.7 143.3West Sumatera 13 3 10 8 27 2 21 0 28 4
The first major Bomb on OctoberWest Sumatera 13.3 10.8 27.2 21.0 28.4
R i a u 627.0 637.2 527.4 654.7 41.7J a m b i 1.6 2.2 2.0 1.9 1.5South Sumatera 3.6 7.7 3.4 2.1 1.4Bengkulu 0.3 0.1 0.2 0.3 0.3Lampung 4.8 3.3 3.8 3.1 2.9
on October 12, 2002 and
once again Kep. Bangka Belitung 0.3 0.2 0.6 0.4 0.2Kepulauan Riau - - - - 753.7DKI Jakarta 722.3 625.8 705.2 713.5 652.6West Java 92.9 81.0 81.6 83.5 87.6Central Java 51.4 42.1 97.3 74.7 40.6DI Y k t 91 5 61 9 75 5 79 5 73 8
o ce agaon October 1, 2005, in Bali h b bDI Yogyakarta 91.5 61.9 75.5 79.5 73.8
East Java 132.6 135.1 76.1 110.9 101.1B a n t e n 165.4 120.8 25.6 116.2 97.2B a l i 1,218.1 1,033.8 1,651.9 1,461.2 1,261.3West Nusa Tenggara 57.0 29.3 45.6 49.5 42.3East Nusa Tenggara 1 9 1 5 2 1 2 3 3 1
where bombs exploded at two sites inEast Nusa Tenggara 1.9 1.5 2.1 2.3 3.1
West Kalimantan 8.9 6.9 4.5 8.8 12.0Central Kalimantan 0.5 0.2 0.4 0.4 0.5South Kalimantan 4.4 4.4 5.8 4.5 4.6East Kalimantan 22.8 26.8 27.8 26.4 24.1North Sulawesi 11.2 8.9 11.1 9.9 6.2
two sites in Jimbaran and Kuta, both in
th B liNorth Sulawesi 11.2 8.9 11.1 9.9 6.2Central Sulawesi 0.4 0.4 0.6 0.4 0.3South Sulawesi 23.1 20.8 20.2 19.0 18.4South East Sulawesi 0.4 0.1 0.2 0.0 0.0Gorontalo - - - - 0.2West Sulawesi - - - - 0.0
south Bali. Twenty
people wereM a l u k u 1.2 0.8 2.3 1.5 1.4Maluku Utara 0.0 0.0 0.0 0.0 0.1West Irian Jaya - - - - 1.1P a p u a 11.9 8.0 10.8 5.9 3.2Indonesia 3,377.5 2,955.5 3,527.6 3,584.0 3,430.2
Source: Statistics Indonesia: http://www bps go id/sector/tourism/table4 shtml
people were killed, and
129 people
58Thailand’s First Real Estate Info Centre Since Thailand’s First Real Estate Info Centre Since 19941994AAGENCY FOR REAL ESTATE AFFAIRS (AREA)GENCY FOR REAL ESTATE AFFAIRS (AREA)
ISO 9001-2008CERTIFIED
Source: Statistics Indonesia: http://www.bps.go.id/sector/tourism/table4.shtml

A BUST IS A BUST IS PREVENTABLEPREVENTABLE& FORESEABLE& FORESEABLE
However, due to the However, due to the lack of soft law andlack of soft law andlack of soft law and lack of soft law and standards of standards of professionalprofessionalhtt // ti l fid ti l / t t/ l d /2011/03/f k hi d ii hi jprofessional professional practices, disaster practices, disaster emergesemerges
http://www.nationalconfidential.com/wp-content/uploads/2011/03/fukushima-daiichi.jpg
emerges.emerges.
The TEPCO plant couldThe TEPCO plant couldThe TEPCO plant could The TEPCO plant could have been exploded have been exploded even prior to Tsunami.even prior to Tsunami.http://www.taipeitimes.com/News/world/archive
/2011/03/21/2003498744
59Thailand’s First Real Estate Info Centre Since Thailand’s First Real Estate Info Centre Since 19941994AAGENCY FOR REAL ESTATE AFFAIRS (AREA)GENCY FOR REAL ESTATE AFFAIRS (AREA)
ISO 9001-2008CERTIFIED
pps/2011/03/21/2003498744

Brisbane / Singapore, Brisbane / Singapore, 20102010, , 20112011, , 2012 2012 flooded even on Orchard Road!flooded even on Orchard Road!
60Thailand’s First Real Estate Info Centre Since Thailand’s First Real Estate Info Centre Since 19941994AAGENCY FOR REAL ESTATE AFFAIRS (AREA)GENCY FOR REAL ESTATE AFFAIRS (AREA)
ISO 9001-2008CERTIFIED
http://singaporeseen.stomp.com.sg/stomp/sgseen/this_urban_jungle/394710/heavy_rains_cause_severe_flooding_along_orchard_road.html

HOUSING IN THE FORMER FLOODED AREAOF BANGKOK, NO DROP IN PRICES
Table 6.2: BMR House Price Change, 1992 - June 2012Details Jun 11 Dec 11 Jun 12 Details Jun 11 Dec 11 Jun 12
Low-priced Condo (Baht 0.25-0.4 mil/unit) Medium-priced townhouses (Baht 1.1-2.0 mil)Unit Price (Baht) 198 714 204 394 200 278 Unit Price (Baht) 1 522 978 1 522 978 1 552 190Unit Price (Baht) 198,714 204,394 200,278 Unit Price (Baht) 1,522,978 1,522,978 1,552,190Baht/sq.m 7,211 7,417 7,268 Baht/sq.m 15,263 15,263 15,555 Changes 66% 68% 67% Changes 146% 146% 149%
Medium-priced Condo (Baht 1.1-2.5 mil/unit) Medium-priced detached (Baht 2.1-3.0 mil/unit)Unit Price (Baht) 1,219,890 1,249,500 1,281,002 Unit Price (Baht) 2,399,441 2,351,597 2,351,597Baht/sq.m 29,305 30,016 30,773 Baht/sq.m 16,551 16,221 16,221 Changes 123% 126% 129% Changes 134% 131% 131%Changes 123% 126% 129% Changes 134% 131% 131%
Luxury Condo (Baht 3.0 mil and over) Luxury detached houses (Baht 5.1-7.0 mil/unit)Unit Price (Baht) 5,591,096 5,622,799 5,622,799 Unit Price (Baht) 6,302,703 6,302,703 6,259,459Baht/sq.m 46,428 46,691 46,691 Baht/sq.m 32,721 32,721 32,497 Changes 137% 138% 138% Changes 128% 128% 127%
Low priced Townhouses (<Baht 0 8 mil/unit)Low-priced Townhouses (<Baht 0.8 mil/unit)Unit Price (Baht) 794,620 781,655 775,356Baht/sq.m 11,660 11,470 11,378 Changes 126% 124% 123%
61Thailand’s First Real Estate Info Centre Since Thailand’s First Real Estate Info Centre Since 19941994AAGENCY FOR REAL ESTATE AFFAIRS (AREA)GENCY FOR REAL ESTATE AFFAIRS (AREA)
ISO 9001-2008CERTIFIED
Source: Agency for Real Estate Affairs (www.area.co.th), Mid 2012

MEASURES MEASURES FOR THE FOR THE SAKE OF SAKE OF CONSUMERS:CONSUMERS:CONSUMERS:CONSUMERS:
One family, One family, one new home one new home
only!!!only!!!http://english.cntv.cn/program/china24/20110127/114541.shtml
Shanghai: May Shanghai: May 2323--2626, Jul , Jul 1717--2121, Sep , Sep 1111--1515, , 20102010
yyp g p g
62Thailand’s First Real Estate Info Centre Since Thailand’s First Real Estate Info Centre Since 19941994AAGENCY FOR REAL ESTATE AFFAIRS (AREA)GENCY FOR REAL ESTATE AFFAIRS (AREA)
ISO 9001-2008CERTIFIED

MEASURES FOR THE SAKE MEASURES FOR THE SAKE OF CONSUMERS:OF CONSUMERS:
Not for developers or Not for developers or financiers but the people!!!financiers but the people!!!financiers but the people!!!financiers but the people!!!
Hong Kong:Hong Kong:JuneJune 1010 –– 1414 20102010 www.info.gov.hk/gia/general/201011/19/P201011190294.htm
63Thailand’s First Real Estate Info Centre Since Thailand’s First Real Estate Info Centre Since 19941994AAGENCY FOR REAL ESTATE AFFAIRS (AREA)GENCY FOR REAL ESTATE AFFAIRS (AREA)
ISO 9001-2008CERTIFIED
June June 10 10 –– 1414, , 20102010

MEASURES MEASURES FOR THE FOR THE SAKE OF SAKE OF
THETHETHE THE COUNTRY:COUNTRY:
1010% % stamp dutystamp dutyp yp y
to curb to curb foreign foreign ggbuyers!buyers!
64Thailand’s First Real Estate Info Centre Since Thailand’s First Real Estate Info Centre Since 19941994AAGENCY FOR REAL ESTATE AFFAIRS (AREA)GENCY FOR REAL ESTATE AFFAIRS (AREA)
ISO 9001-2008CERTIFIED

International Buyers and Sellers of Real Estate.
htt // j l l ll /R hL l1/A t li Wh t t f t df
March 10-12, 2012Sydney Valuation Visit
65Thailand’s First Real Estate Info Centre Since Thailand’s First Real Estate Info Centre Since 19941994AAGENCY FOR REAL ESTATE AFFAIRS (AREA)GENCY FOR REAL ESTATE AFFAIRS (AREA)
ISO 9001-2008CERTIFIED
http://www.joneslanglasalle.com.au/ResearchLevel1/Australia_What_next_for_property.pdf

INTANGIBLE PROPERTY(INTANGIBLE ASSETS):(INTANGIBLE ASSETS):nonphysical assets, including but not limited to franchises, trademarks, patents,limited to franchises, trademarks, patents, copyrights, goodwill, equities, securities, and contracts as distinguished from physical assets such as facilities and equipment.http://commerce appraisalfoundation org/html/2006%20USPAP/DEFINITIONS htmhttp://commerce.appraisalfoundation.org/html/2006%20USPAP/DEFINITIONS.htm
http://www.thethousand.net/misc/intangible.jpg
66Thailand’s First Real Estate Info Centre Since Thailand’s First Real Estate Info Centre Since 19941994AAGENCY FOR REAL ESTATE AFFAIRS (AREA)GENCY FOR REAL ESTATE AFFAIRS (AREA)
ISO 9001-2008CERTIFIED 66
http://www.thethousand.net/misc/intangible.jpg

A BRAND has value because:It produces income (e.g. franchising).It produces income (e.g. franchising).It belongs to a certain market of willing buyers and sellers at a certain period of timesellers at a certain period of time.It possesses know-how (not know-who-is-who).
Brand Factors of Brand ValueLegal Know-how Market Finance Quality
B k XBank XBeer X XSoft Drink X X XCar XGUCCI Beneton X XMi ft X X XMicrosoft X X XR.E. DeveloperR.E. Agent X
67Thailand’s First Real Estate Info Centre Since Thailand’s First Real Estate Info Centre Since 19941994AAGENCY FOR REAL ESTATE AFFAIRS (AREA)GENCY FOR REAL ESTATE AFFAIRS (AREA)
ISO 9001-2008CERTIFIED 67
g

A B C DValue of A Real Estate Brand
1 Value of Development /Year (Millions of US$)
300.0 e.g. a public company
2Costs of Advertisement /year 2.7
The most popular Thainewspaper, US$ 15,000 per
d 180 dy
page per day, 180 days3 Cost of Insurance / year 3% Escrow Account / Fair contracts
C t f B d4 Cost of BrandConstruction / year
11.7 =C3 x C5 + C4
5 Capitalization Rate 17% Interest 7% Risk Factor 10%5 Capitalization Rate 17% Interest 7%, Risk Factor 10%6 Brand Value 68.8 =C6/C7
V = I / RValue = Net Operating Income / Capitalization Rate
68Thailand’s First Real Estate Info Centre Since Thailand’s First Real Estate Info Centre Since 19941994AAGENCY FOR REAL ESTATE AFFAIRS (AREA)GENCY FOR REAL ESTATE AFFAIRS (AREA)
ISO 9001-2008CERTIFIED 68
p g p

MAINTAININGBRAND VALUEBRAND VALUE:1 Worthiness (prices relevant1. Worthiness (prices relevant
to quality)2. Standardization & Promise3. Prestige3. Prestige4. Consistence and
ti ticontinuation5. Development over time6. Promotion over time
http://hirek.csillagaszat.hu/files/images/2006/08/20060811 mars-hold.jpg
69Thailand’s First Real Estate Info Centre Since Thailand’s First Real Estate Info Centre Since 19941994AAGENCY FOR REAL ESTATE AFFAIRS (AREA)GENCY FOR REAL ESTATE AFFAIRS (AREA)
ISO 9001-2008CERTIFIED 69
http://hirek.csillagaszat.hu/files/images/2006/08/20060811_mars hold.jpg

T Share- E l S li C t Commu-Corporate Governance of Business
Types Shareholders
Employees Suppliers Customers Community/Envi
BanksShare-
ExploitationRecruit- Loan
Banks holders Exploitation ment servicesInterest
P t l F hi P iPetroleum Franchisee PricesGas station boysboys
Factory Exploitation Quality Nuisance
Public Co Share- QualityPublic Coholders
Quality
Developers Quality NuisanceC lt t E l it ti Q litConsultants Exploitation Quality
70Thailand’s First Real Estate Info Centre Since Thailand’s First Real Estate Info Centre Since 19941994AAGENCY FOR REAL ESTATE AFFAIRS (AREA)GENCY FOR REAL ESTATE AFFAIRS (AREA)
ISO 9001-2008CERTIFIED 7070

Corporate GoodwillCorporate GoodwillCorporate GoodwillCorporate GoodwillPersonal Goodwill.Personal Goodwill.
71Thailand’s First Real Estate Info Centre Since Thailand’s First Real Estate Info Centre Since 19941994AAGENCY FOR REAL ESTATE AFFAIRS (AREA)GENCY FOR REAL ESTATE AFFAIRS (AREA)
ISO 9001-2008CERTIFIED 71

Thank YouThank YouThank YouThank YouThank YouThank Yousosopon@[email protected]
Thank YouThank Yousosopon@[email protected]
facebook.com/sopon.pornchokchaifacebook.com/sopon.pornchokchai facebook.com/sopon.pornchokchaifacebook.com/sopon.pornchokchai
72Thailand’s First Real Estate Info Centre Since Thailand’s First Real Estate Info Centre Since 19941994AAGENCY FOR REAL ESTATE AFFAIRS (AREA)GENCY FOR REAL ESTATE AFFAIRS (AREA)
ISO 9001-2008CERTIFIED