ash refresher course 2017: mpn & cmltsh.or.th/file_upload/files/mpn - cml refresher course -...
TRANSCRIPT

ASH Refresher Course 2017: MPN & CML
14 Jan 2018 Tontanai Numbenjapon, M.D.
Division of Hematology Department of Medicine
Phramongkutklao Hospital

Highlights of ASH 2017
• CML
– 3 education sessions
– Simultaneous session
• Treatment free remission – Update Euro-ski, ENESTfreedom, ENESTop, Dasfree, and other trials
• Generic IM trial

Treatment free remission trials (ASH 2017)
ENESTfreedom
(NCT01784068)
96 wk-update
ENESTop
(NCT01698905)
96 wk-update
DADI
3-year F/U
DASFREE
(CA180-406/NCT01850004)
DESTINY NCT01804985
2-y F/U
NILO-RED
Enrollment 190 126 63 84 174 82
Treatment prior to
suspension of TKI
therapy
Frontline nilotinib
(≥ 2 years)
Second-line
nilotinib (≥ 3 years
total: first imatinib
[> 4 weeks], then
nilotinib [≥ 2
years])
Second- or third-
line dasatinib
Dasatinib ≥2 year as
1st/subsequent line
≥ 3 years imatinib,
nilotinib, or
dasatinib (prior to
enrollment) and 1
year at half-
standard dose
(after enrollment)
then 1 y stop
1st/2nd line
standard dose
nilotinib with at
least 3 months of
MMR
Response required
for attempting TFR
≥ MR4.5
for 1 year
MR4.5 (with no
confirmed loss of
MR4.5 for 1 year,
as determined by a
central laboratory)
UMRDb by RQ-PCR (1 year)
DMR ≥1 y
MMR or MR4 by RQ-PCR (1 year
prior to enrollment)
MMR for at least 3 months prior to enrollment then
reduce to half-dose (OD dose)
Definition of
molecular relapse Loss of MMR
Loss of MMR or
confirmed loss of
MR4
BCR-ABL
positivity at any
point
Loss of MMR Loss of MMR Loss of MMR
during half dose
Rate of TFR or
estimated primary
completion
50.9%, estimated
at
96 weeks
53.2%, estimated
at 96 weeks
44%, estimated
at 36 months
49% at 12 months
54% (1st line)
43% (subseq.line)
½ dose
at 12 m
MR4
½ dose
at 12 m
MMR <.001 Baseline At 12 mo
97.6% 81.6% MMR 100% Stop at
12 m
MR4
Stop at
12 m
MMR <.001 MR4 100%
76% 39% MR4.5 100%

Duration of DMR has most impact on the success of cessation of TKI treatment in CML-Results from the EURO-SKI trial (n = 448)
(Saussele et al. oral abstract 313)
• Objectives: to evaluate the importance of treatment duration vs. MR4 duration in the EURO-SKI patient cohort
• Methods: prognostic modeling based on TFR results at 6 mo
• Results: duration of TKI and MR4 correlated significantly with 6 mo MRecFs, with thresholds of 5.8 y and 3.1 y, respectively.
• Each addition year of MR4 duration (remaining MMR 3%) vs. TKI treatment duration (remaining MMR 0.86%)

Take home message
• TFR rate after stopping TKIs for 2-3 years is 50%.
• Lower dose of TKI after achieving at least MR4 before completed stop may be used as surrogate marker to predict better TFR rate.
• Duration of TKI (5.8 y) and MR4 (3.1 y) predict successfulness of TFR

New CML management proposal for clinical practice
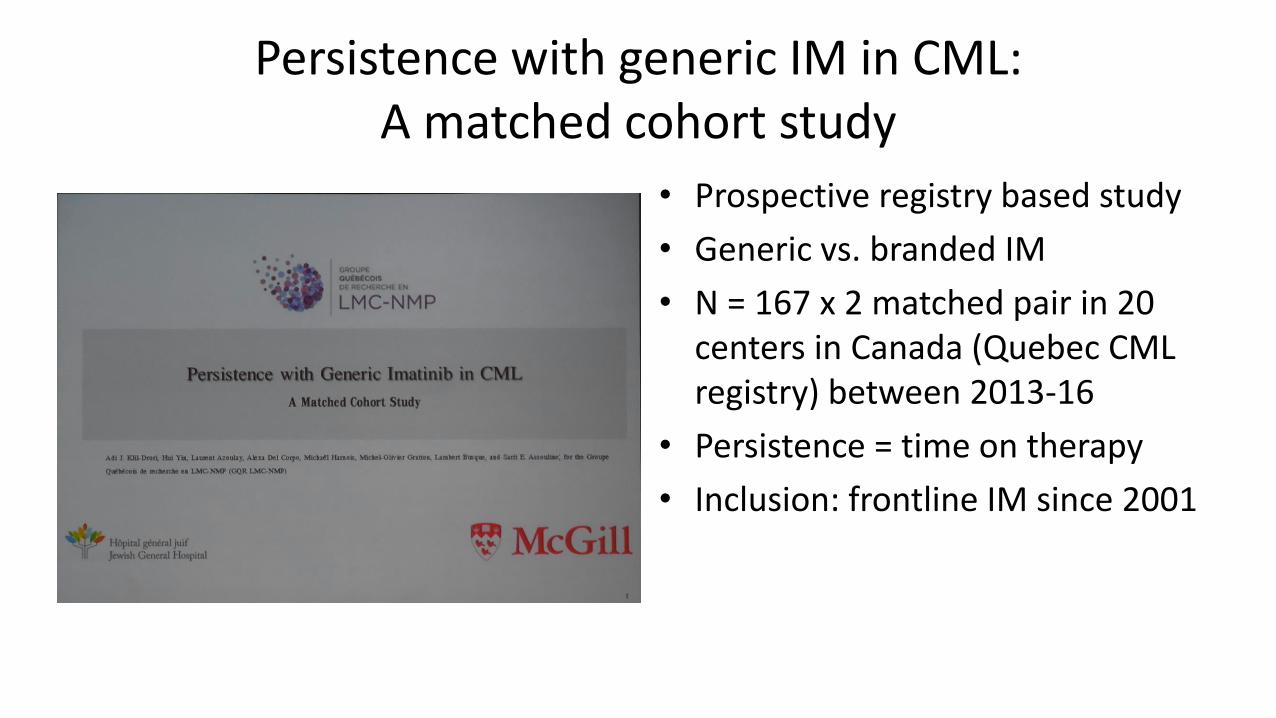
Persistence with generic IM in CML: A matched cohort study
• Prospective registry based study
• Generic vs. branded IM
• N = 167 x 2 matched pair in 20 centers in Canada (Quebec CML registry) between 2013-16
• Persistence = time on therapy
• Inclusion: frontline IM since 2001

Results: probability of persistence at 42 m
Adjusted HR 2.13 (1.18-3.86) Adjusted HR 2.85 (0.88-9.23)
88.9 vs. 72.8% P = 0.03
92.0 vs. 88.3% P = 0.12

Switch description
36 switches from GI • 12 (33%) suboptimal response
• 4 failure of EMR
• 2 failure of MR2
• 1 loss of MMR
• 3 others
• 25 (69%) toxicity • 10 G3 AEs
• 3 diarrhea
• 2 nausea
• 1 emesis
• 1 pain
• 1 fatigue
• 1 weakness
• 1 rash
17 switches from BI
• 9 (53%) suboptimal response – 6 failure of EMR
– 1 failure of MMR
– 2 loss of MMR
• 9 (53%) toxicity – 5 Gr 3 AEs
• 2 fatigue
• 2 rash
• 2 pain

Discontinuation descriptive
13 D/C from GI
• 9 (69%) in MR5
4 D/C from BI
• 2 (50%) in MR5

Conclusions
• Patients remained on BI for a longer time than GI
• When patients switched from GI, intolerance was more common than ineffectiveness
• GI may be associated with higher preference to stop TKI in DMR

Content in ASH 2017
• MPN
– 3 education sessions
– Simultaneous sessions
• PegIFN in high risk PV trials (MPD-RC 111 and POUND)
• 4-y F/U of RESPONSE trial
• JUMP trial

ABC approach for PV and ET

Diver mutation profile for PV and ET
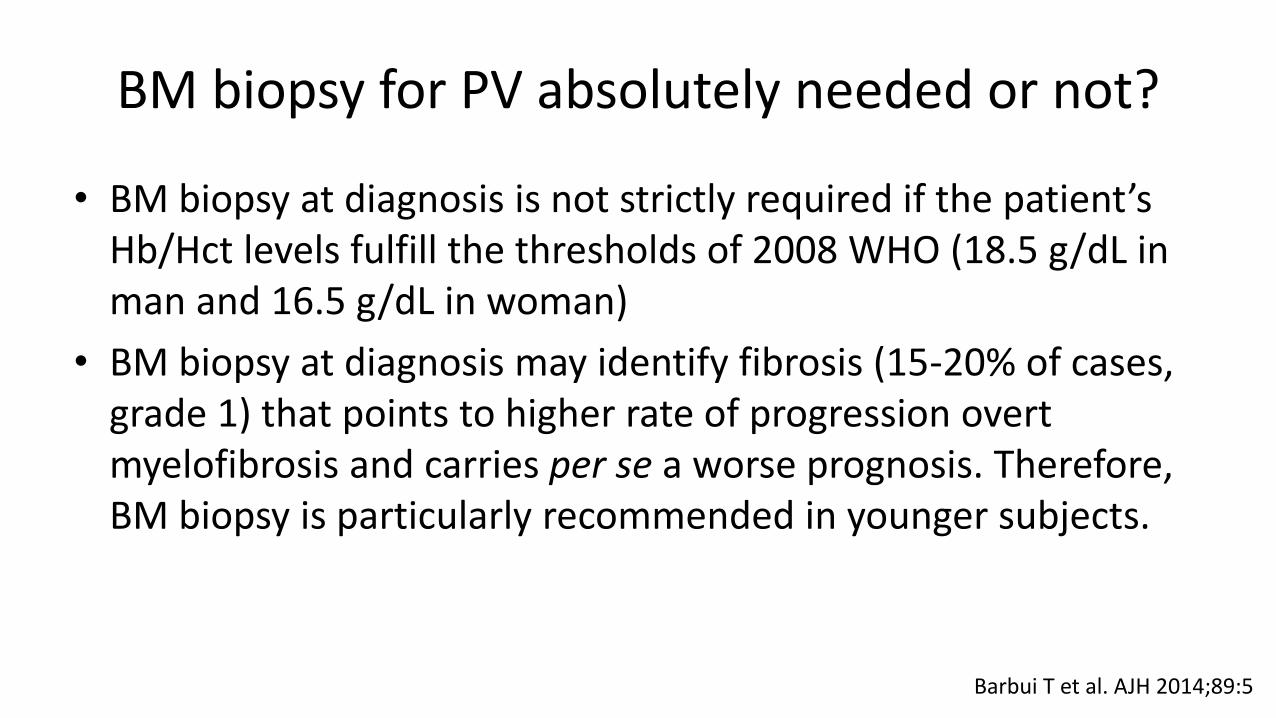
BM biopsy for PV absolutely needed or not?
• BM biopsy at diagnosis is not strictly required if the patient’s Hb/Hct levels fulfill the thresholds of 2008 WHO (18.5 g/dL in man and 16.5 g/dL in woman)
• BM biopsy at diagnosis may identify fibrosis (15-20% of cases, grade 1) that points to higher rate of progression overt myelofibrosis and carries per se a worse prognosis. Therefore, BM biopsy is particularly recommended in younger subjects.
Barbui T et al. AJH 2014;89:5
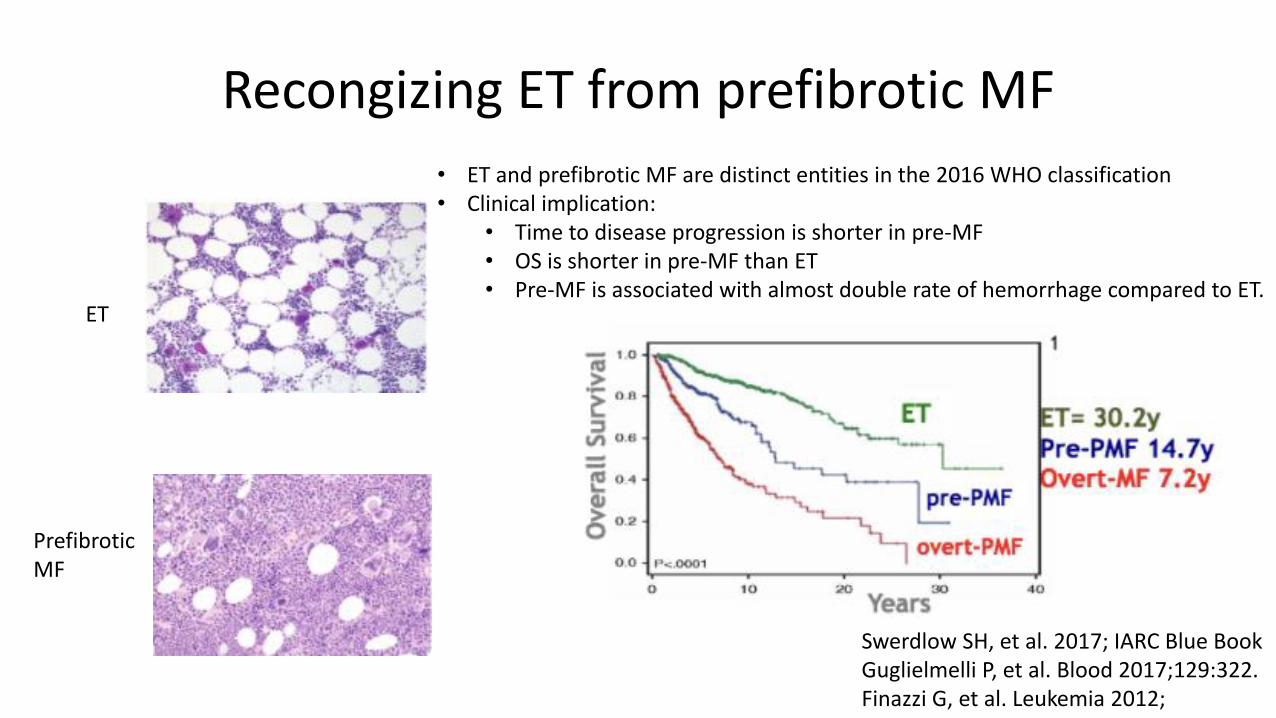
Recongizing ET from prefibrotic MF
ET
Prefibrotic MF
• ET and prefibrotic MF are distinct entities in the 2016 WHO classification • Clinical implication:
• Time to disease progression is shorter in pre-MF • OS is shorter in pre-MF than ET • Pre-MF is associated with almost double rate of hemorrhage compared to ET.
Swerdlow SH, et al. 2017; IARC Blue Book Guglielmelli P, et al. Blood 2017;129:322. Finazzi G, et al. Leukemia 2012;

Causes of death in PV and ET

Conventional risk stratification system for PV and ET
Marchioli R, et al. J Clin Oncol 2005;23:224. Barbui T, et al. J Clin Oncol 2011;29:76
PV
• Smoking, hypertension, metabolic syndrome, obesity
ET
• Extreme thrombocytosis (> 1.5M x 109 /L) increases risk of hemorrhage

IPSET-revised score for ET

Risk stratification for PV and ET
• In PV and ET, the therapeutically-relevant end-point for prognostication is the risk of thrombosis.
• PV: use the conventional thrombosis risk score
• ET: prefer the IPSET-thrombosis score

Pegylated interferon in MPNs (1)
• MPD-RC 1121 RCTs: First-line pegIFN vs. HU for high-risk PV – A preliminary analysis of 75 pts treated for 1 y did not differ between the 2 arms.
Waiting for final results
• PROUD-PV2 RCTs: RopegIFN alfa 2 b (Q 2-4 weeks) vs. HU in high risk PV • Non-inferiority was demonstrated. Safety profile acceptable.
• Update 2 y: 88 vs. 73 pts completed 2 yrs. CHR 70% vs. 49% (p = 0.01) and MR vs 70% vs. 29%. (p = 0.004) and confirmed overall good tolerability
• MPD-RC 1113: Single arm salvage therapy in high-risk PV/ET with RR-HU – ORR 64% for PV and 71% for ET. It may be a reasonable second-line treatment.
1Mascarenhas J, et al. ASH 2016 (479), 2Gisslinger H, et al. ASH 2017 (321) and 3Yacoub A, ASH 2017 (4206)

Pegylated interferon in MPNs (2)
• Higher rates of partial molecular response in PMF/ET patients with JAK2V617F mutation than CALR mutation (60% vs. 23%, p < 0.05)1
1Czech J, et al. ASH 2017 (4194)

Ruxolitinib for PV

TH1712752757
Results From the 208-Week (4-Year) Follow-up of the RESPONSE
Trial, a Phase 3 Study Comparing Ruxolitinib (Rux) With Best
Available Therapy (BAT) for the Treatment of Polycythemia Vera (PV)
Jean-Jacques Kiladjian,1 Srdan Verstovsek,2 Martin Griesshammer,3 Tamas Masszi,4 Simon Durrant,5
Francesco Passamonti,6 Claire N. Harrison,7 Fabrizio Pane,8 Pierre Zachee,9 Keita Kirito,10 Carlos Besses,11
Masayuki Hino,12 Ana Ines Varela,13 Carole B. Miller,14 Elisa Rumi,15 Vittorio Rosti,16 Igor W. Blau,17 Ruben A.
Mesa,18 Tuochuan Dong,19 Nathalie Francillard,20 Alessandro M. Vannucchi21
1Hôpital Saint-Louis et Université Paris Diderot, Paris, France; 2Department of Leukemia, The University of Texas MD Anderson Cancer Center, Houston, Texas, USA; 3Department of Hematology, Oncology, Hemostaseology and
Palliative Care, Johannes Wesling Clinic, Minden, Germany; 43rd Department of Internal Medicine, Semmelweis University, Budapest, Hungary; 5Royal Brisbane & Women’s Hospital, Brisbane, Australia; 6Hematology, Department of
Medicine and Surgery, University of Insubria, Varese, Italy; 7Guy’s and St. Thomas’ NHS Foundation Trust, London, UK; 8 Division of Hematology, University of Naples Federico II, Naples, Italy; 9ZNA Stuivenberg, Antwerp, Belgium; 10Department of Hematology and Oncology, University of Yamanashi, Japan; 11Haematology Department, Hospital del Mar-IMIM, Universidad Autónoma de Barcelona, Barcelona, Spain; 12Department of Clinical Hematology and
Diagnostics, Osaka University Graduate School of Medicine, Osaka, Japan; 13Hospital Jose Maria Ramos Mejia, Buenos Aires, Argentina; 14Saint Agnes Cancer Institute, Baltimore, Maryland, USA; 15Department of Haematology
Oncology, Fondazione IRCCS Policlinico S. Matteo, Pavia, Italy; 16Center for the Study of Myelofibrosis, IRCCS Policlinico San Matteo Foundation, Pavia, Italy; 17Medical Department, Division of Hematology, Oncology, and Tumor
Immunology, Charité Universitätsmedizin Berlin, Germany; 18UT Health San Antonio Cancer Center, San Antonio, Texas, USA; 19Novartis Pharmaceuticals Corporation, East Hanover, New Jersey, USA; 20Novartis Pharma S.A.S,
Rueil Malmaison, France; 21University of Florence, Florence, Italy 25
ASH 2017
RESPONSE 208 week follow-up –abstract #322

TH1712752757
Introduction
• RESPONSE (NCT01243944) is a global, multicenter, open-label, Phase 3 trial
comparing the efficacy and safety of ruxolitinib with best available therapy in
patients with polycythemia vera (PV) who are resistant to or intolerant of
hydroxyurea.1
• The primary endpoint of the RESPONSE study was achieved demonstrating
that ruxolitinib was superior to best available therapy in controlling hematocrit
and reducing spleen volume at week 32.1
• This preplanned analysis of the RESPONSE study was conducted to evaluate
the long-term safety and durability of efficacy of ruxolitinib after a follow-up of
208 weeks (after last patient has been followed for 208 weeks [4 years]).
– The study is currently ongoing.
1. Vannucchi AM et al. N Engl J Med. 2015;372(5):426-435.
26

TH1712752757
Patient Disposition
Ruxolitinib
(n = 110)
BAT*
(n = 112)
Ruxolitinib
Crossover
(n = 98)
Ongoing treatment at database lock, n (%) 41 (37) 0 37 (38)
Completed treatment period 32 (29) 1 (1) 30 (31)
Reasons for discontinuation of treatment, n (%)
Adverse event 15 (14) 2 (2) 14 (14)
Disease progression 12 (11) 1 (1) 8 (8)
Patient decision 6 (6) 5 (5) 6 (6)
Lack of efficacy 0 100 (89) 0
Others (protocol deviation, lost to follow-up, and physician
decision)
3 (3) 2 (2) 3 (3)
Death† 1 (1) 0 0
Median treatment exposure, weeks 225 34 189
* Initial BAT included HU (n = 66), IFN/pegylated IFN (n = 13), anagrelide (n = 8), IMIDs (n = 5), pipobroman (n = 2), and observation (n = 17).
For patients who were randomized to BAT and then crossed over to ruxolitinib, the reasons for end of BAT are reported in the ―BAT‖ column. †One patient, determined by the Investigator to have discontinued the study treatment due to AEs, died afterwards.
27
BAT, best available therapy; HU, hydroxyurea; IFN, interferon; IMIDs, immunomodulators.
TH1712752757
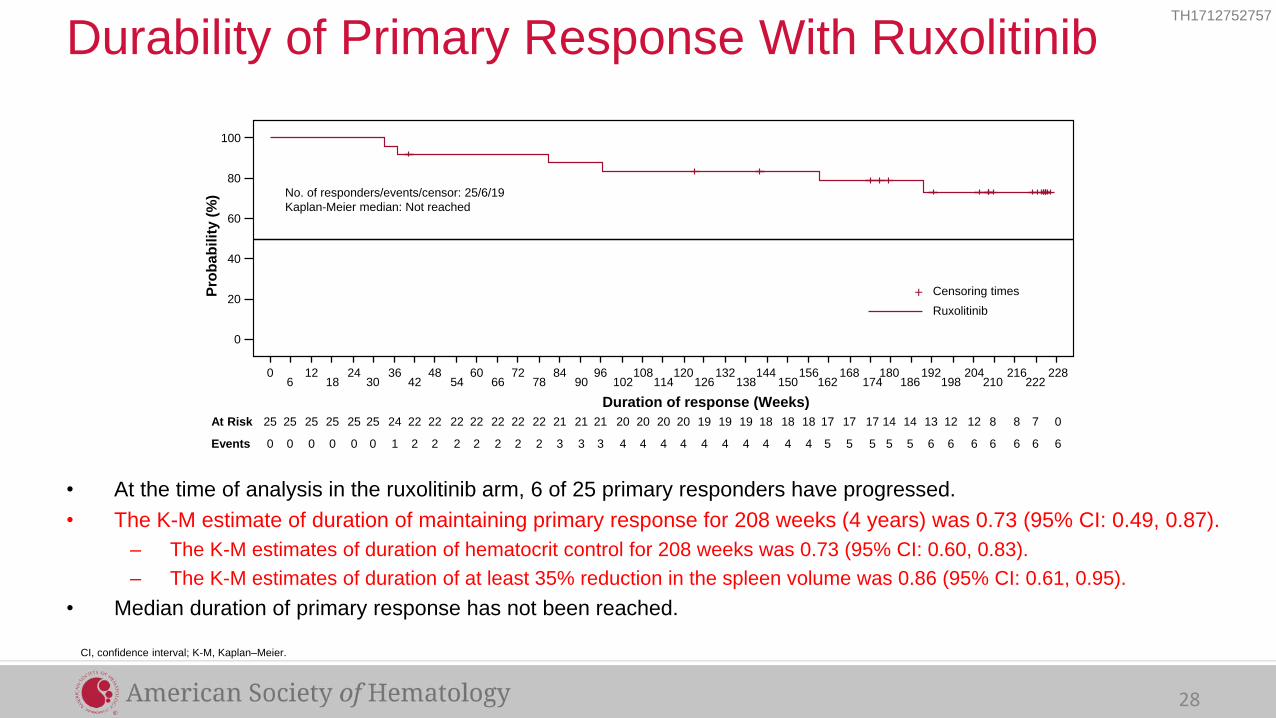
• At the time of analysis in the ruxolitinib arm, 6 of 25 primary responders have progressed.
• The K-M estimate of duration of maintaining primary response for 208 weeks (4 years) was 0.73 (95% CI: 0.49, 0.87).
– The K-M estimates of duration of hematocrit control for 208 weeks was 0.73 (95% CI: 0.60, 0.83).
– The K-M estimates of duration of at least 35% reduction in the spleen volume was 0.86 (95% CI: 0.61, 0.95).
• Median duration of primary response has not been reached.
Durability of Primary Response With Ruxolitinib
CI, confidence interval; K-M, Kaplan–Meier.
100
80
60
40
20
0
0 12 24 36 48 60 72 84 96 108 120 132 144 156 168 180 192 204 216 228 6 18 30 42 54 66 78 90 102 114 126 138 150 162 174 186 198 210 222
0 0 0 0 0 0 1 2 2 2 2 2 2 2 3 3 3 4 4 4 4 4 4 4 4 4 4 5 5 5 5 5 6 6 6 6 6 6 6
8 8 7 0 22 22 22 21 21 21 20 20 20 20 19 19 19 18 18 18 17 17 17 14 14 13 12 12 25 25 25 25 25 25 24 22 22 22 22
No. of responders/events/censor: 25/6/19
Kaplan-Meier median: Not reached
Duration of response (Weeks)
Pro
bab
ilit
y (
%)
Events
At Risk
Censoring times
Ruxolitinib
+
28

TH1712752757
• The K-M estimate of duration of CHR (hematocrit control, platelet count ≤ 400 × 109/L, and WBC count ≤ 10 × 109/L) for
208 weeks (4 years) was 0.54 (95% CI: 0.31, 0.72).
– Of 87 patients with WBC > 10 ×109/L at baseline, 42 (48.3%) achieved WBC ≤ 10 × 109/L at week 208.
– Of 54 patients with platelet count > 400 × 109/L at baseline, 26 (48.1%) achieved platelet count ≤ 400 × 109/L at week 208 .
Durability of Complete Hematologic Remission With
Ruxolitinib
CHR, complete hematologic remission; CI, confidence interval; K-M, Kaplan-Meier
29
100
80
60
40
20
0
0 12 24 36 48 72 60 84 96 108 120 132 144 156 168 180 192 204 216 228 240
6 18 30 42 54 78 66 90 102 114 126 138 150 162 174 186 198 210 222 234 246
26 24 24 24 21 17 18 16 16 15 15 14 13 13 13 10 9 9 7 5 0 24 24 24 21 18 16 17 16 16 15 15 13 13 13 12 10 9 7 6 3
0 0 0 0 3 5 4 6 6 7 7 8 8 8 8 10 10 10 10 10 10 0 0 0 3 4 6 5 6 6 7 7 8 8 8 9 10 10 10 10 10
At risk
Events
Duration of response (Weeks)
Pro
bab
ilit
y (
%)
No. of responders/events/censor: 26/10/16
Kaplan-Meier median: N/A week
Censoring times
Ruxolitinib

TH1712752757
• Of the 70 patients (63.6%) who achieved an overall CLHM response at week 32, twenty-one had progressed by week
208.
• The K-M estimate of duration of maintaining CLHM for 208 weeks (4 years) was 0.67 (95% CI: 0.54, 0.77).
– Median duration of CLHM response has not been reached.
Durability of Overall Clinicohematologic Response
With Ruxolitinib
CLHM, clinicohematologic response; CI, confidence interval; K-M, Kaplan-Meier
0 12 24 36 48 60 72 84 96 108 120 132 144 156 168 180 192 204 216 228 6 18 30 42 54 66 78 90 102 114 126 138 150 162 174 186 198 210 222
0 0 0 0 0 0 1 2 3 5 6 7 8 8 8 9 10 10 11 12 15 15 15 19 19 19 20 20 21 21 21 21 21 21 21 21 21
3 2 1 0 60 58 58 58 57 56 56 53 51 46 46 46 42 42 42 40 39 32 29 27 25 18 70 70 70 70 70 70 67 66 65 63 61
Duration of response (Weeks)
Events
At Risk
240 252 264 234 246 258
21
30
12
55
8
58
8
58 51
12
50
12
50
12
50
12
Censoring times
Ruxolitinib
+
100
80
60
40
20
0
Pro
bab
ilit
y (
%)
30
TH1712752757
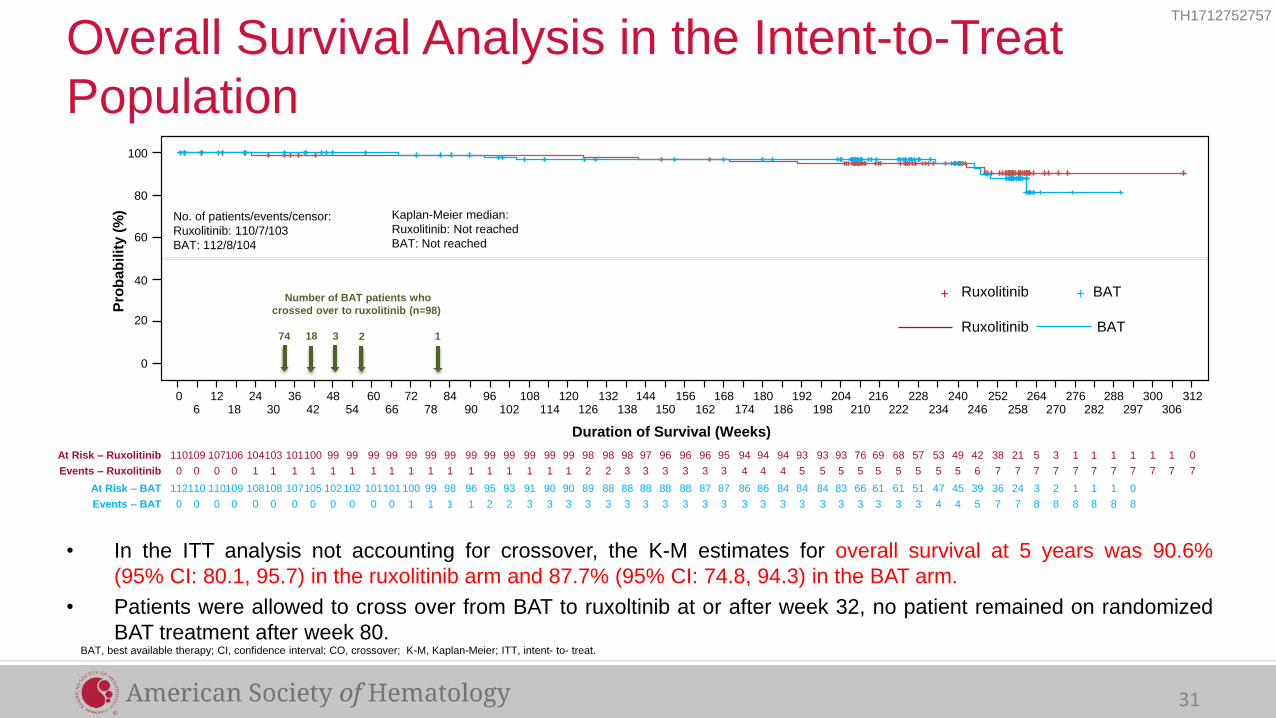
• In the ITT analysis not accounting for crossover, the K-M estimates for overall survival at 5 years was 90.6%
(95% CI: 80.1, 95.7) in the ruxolitinib arm and 87.7% (95% CI: 74.8, 94.3) in the BAT arm.
• Patients were allowed to cross over from BAT to ruxoltinib at or after week 32, no patient remained on randomized
BAT treatment after week 80.
Overall Survival Analysis in the Intent-to-Treat
Population
0 12 24 36 48 60 72 84 96 108 120 132 144 156 168 180 192 204 216 228 6 18 30 42 54 66 78 90 102 114 126 138 150 162 174 186 198 210 222
Duration of Survival (Weeks)
240 252 264 234 246 258
100
80
60
40
20
0
Pro
bab
ilit
y (
%)
276 288 300 312 270 282 297 306
110 107 104 101 99 99 99 99 99 99 99 98 97 96 95 94 93 93 69 57 109 106 103 100 99 99 99 99 99 99 98 98 96 96 94 94 93 76 68 49 38 5 53 42 21 1 1 1 0 3 1 1 1
0 0 1 1 1 1 1 1 1 1 1 2 3 3 3 4 5 5 5 5 0 0 1 1 1 1 1 1 1 1 2 3 3 3 4 4 5 5 5 5 7 7 5 6 7 7 7 7 7 7 7 7 7
112 110 108 107 102 101 100 98 95 91 90 88 88 88 87 86 84 83 61 51 110 109 108 105 102 101 99 96 93 90 89 88 88 87 86 84 84 66 61 45 36 3 47 39 24 1 1 2 1 0
0 0 0 0 0 0 1 1 2 3 3 3 3 3 3 3 3 3 3 3 0 0 0 0 0 0 1 1 2 3 3 3 3 3 3 3 3 3 3 4 7 8 4 5 7 8 8 8 8 8
At Risk – Ruxolitinib
Events – Ruxolitinib
At Risk – BAT
Events – BAT
No. of patients/events/censor:
Ruxolitinib: 110/7/103
BAT: 112/8/104
Kaplan-Meier median:
Ruxolitinib: Not reached
BAT: Not reached
Ruxolitinib BAT
Ruxolitinib BAT
+ +
BAT, best available therapy; CI, confidence interval; CO, crossover; K-M, Kaplan-Meier; ITT, intent- to- treat.
31
74 18 3 2 1
Number of BAT patients who
crossed over to ruxolitinib (n=98)

TH1712752757
Adverse Events (Adjusted for Patient-Year Exposure, Regardless of Study Drug Relationship [All Grades, Rate ≥ 5 in Either Arm])
208-Week (4-Year) Analysis 80-Week Analysis
Ruxolitinib
n = 110
Exposure, Patient-
Years = 409
Crossover
n = 98
Exposure, Patient-
Years = 310
Ruxolitinib
n = 110
Exposure, Patient-
Years = 227.7
Crossover
n = 98
Exposure, Patient-
Years = 147.6
Rate per 100 Patient-
Years of Exposure
All
Grades
Grade
3 or 4
All
Grades
Grade
3 or 4
All
Grades
Grade
3 or 4
All
Grades
Grade
3 or 4 Hematologic adverse events
Anemia 9.3 1.0 9.4 0.6 13.2 0.9 14.9 1.4
Thrombocytopenia 4.6 1.0 1.3 0.3 6.1 1.8 2.7 0.7
Non-hematologic adverse events
All infections 19.6 3.7 19.7 6.5 29.4 4.0 27.8 5.4
Herpes zoster infection 4.9 0.5 4.2 0.6 5.3 0.9 5.4 0.7
Pruritus 7.3 0.5 5.8 0 9.7 0.4 8.8 0
Diarrhea 7.1 0.2 3.2 0 9.7 0 5.4 0
Headache 6.1 0.5 5.5 0 10.5 0.9 8.8 0
Fatigue 5.1 0.2 4.2 0 8.3 0.4 6.8 0
Increased weight 5.6 0.7 4.2 0.3 7.5 0.4 6.8 0
Arthralgia 5.9 0.2 3.2 0.3 6.1 0 4.7 0
Muscle spasms 5.4 0.2 3.2 0 7.9 0.4 3.4 0
Dizziness 4.2 0.0 6.1 0 7.5 0 7.5 0
32

TH1712752757
Thromboembolic Adverse Events (SMQ) (Adjusted for Patient-Year Exposure, Regardless of Study Drug Relationship [All Grades, Rate ≥ 0.2 in Either Arm])
208-Week (4-Year) Analysis 80-Week Analysis
Ruxolitinib
n = 110
Exposure, Patient-
Years
= 409
Crossover
n = 98
Exposure, Patient-
Years = 310
Ruxolitinib
n = 110
Exposure, Patient-
Years = 227.7
Crossover
n = 98
Exposure, Patient-
Years = 147.6
n (Rate per 100 Patient-
Years of Exposure)
All
Grades
Grade
3 or 4
All
Grades
Grade
3 or 4
All
Grades
Grade
3 or 4
All
Grades
Grade
3 or 4 All thromoboembolic eventsa 5 (1.2) 3 (0.7) 9 (2.9) 5 (1.6) 4 (1.8) 2 (0.9) 6 (4.1) 4 (2.7)
Cerebral infarction 1 (0.2) 1 (0.2) 0 0 1 (0.4) 1 (0.4) 0 0
Ischemic stroke 1 (0.2) 0 1 (0.3) 1 (0.3) 1 (0.4) 0 0 0
Transient ischemic attack 0 0 2 (0.6) 2 (0.6) 0 0 2 (1.4) 2 (1.4)
Portal vein thrombosis 1 (0.2) 1 (0.2) 0 0 1 (0.4) 1 (0.4) 0 0
Pulmonary embolism 1 (0.2) 1 (0.2) 0 0 0 0 0 0
Retinal vascular thrombosis 1 (0.2) 0 0 0 1 (0.4) 0 0 0
Myocardial infarction 0 0 2 (0.6) 1 (0.3) 0 0 2 (1.4) 1 (0.7)
Deep vein thrombosis 0 0 1 (0.3) 0 0 0 0 0
Thrombophlebitis 0 0 1 (0.3) 0 0 0 0 0
Thrombosis 0 0 1 (0.3) 0 0 0 1 (0.7) 0
Bone infarction 0 0 1 (0.3) 0 0 0 1 (0.7) 0
Coronary artery occlusion 0 0 1 (0.3) 0 0 0 1 (0.7) 0
Disseminated intravascular
coagulation 0 0 1 (0.3) 1 (0.3) 0 0 1 (0.7) 1 (0.7)
aMedDRA version 19.1 was used to code the events. BAT; best available therapy; SMQ, standardized medical dictionary for regulatory activities (MedDRA) query.
33
• While on BAT, the rates of all grade and grade 3/4 thromboembolic events per 100 patient-years of exposure were 8.2 (n = 6) and 2.7 (n = 2), respectively.

TH1712752757
Other Adverse Events of Interest (Nonmelanoma Skin Cancer Adjusted for Patient-Year Exposure)
n (Rate per 100 Patient-
Years of Exposure)
208-Week (4-Year) Analysis 80-Week Analysis
Ruxolitinib
n = 110
Exposure, Patient-
Years = 409
Crossover
n = 98
Exposure, Patient-
Years = 310
Ruxolitinib
n = 110
Exposure, Patient-
Years = 227.7
Crossover
n = 98
Exposure, Patient-
Years = 147.6
Prior history of
Nonmelanoma Skin Cancer
No Yes No Yes No Yes No Yes
Total events 13 (3.6) 8 (18.6) 6 (2.1) 2 (9.5) 4 (2.0) 6 (24.2) 2 (1.4) 1 (10.6)
Basal cell carcinoma 10 (2.7) 7 (16.3) 4 (1.4) 1 (4.7) 3 (1.5) 5 (20.2) 1 (0.7) 1 (10.6)
Squamous cell carcinoma of
skin 4 (1.1) 4 (9.3) 3 (1.0) 0 1 (0.5) 2 (8.1) 0 0
Bowen's disease 1 (0.3) 1 (2.3) 0 0 0 1 (4.0) 0 0
Carcinoma in situ of skin 0 2 (4.7) 0 0 0 1 (4.0) 0 0
Metastatic squamous cell
carcinoma 0 2 (4.7) 0 0 0 1 (4.0) 0 0
Keratoacanthoma 1 (0.3) 0 0 0 0 0 0 0
Squamous cell carcinoma* 2 (0.5) 3 (7.0) 2 (0.7) 2 (9.5) 1 (0.5) 4 (16.1) 1 (0.7) 0
34
*Categorized as non-skin squamous cell carcinoma cases.

TH1712752757
• In the RESPONSE study, patients with PV who were resistant to or
intolerant of hydroxyurea had durable hematocrit control and
clinicohematologic response.
– In both the ruxolitinib arm and crossover population, 66% of patients
completed 5 years of study treatment (29%) or were still on treatment
(37%).
• With an additional 120 weeks (30 months) of follow-up, the overall
safety profile remains unchanged from the 80-week analysis.
• Taken together, these results support ruxolitinib as an effective long-
term treatment option for patients with PV who have had an
inadequate response to or are intolerant of hydroxyurea.
PV, polycythemia vera.
Discussion
35

MYSEC (Myelofibrosis SECondary to PV and ET)-MF: a Molecular-Enriched Prognostic Model
CalR mutant Longer OS (type 1 > 2) Higher Hb and platelet Lower WBC

ASH 2017 abstract 0200

MIPSS70 risk score: variable assoc with reduced OS
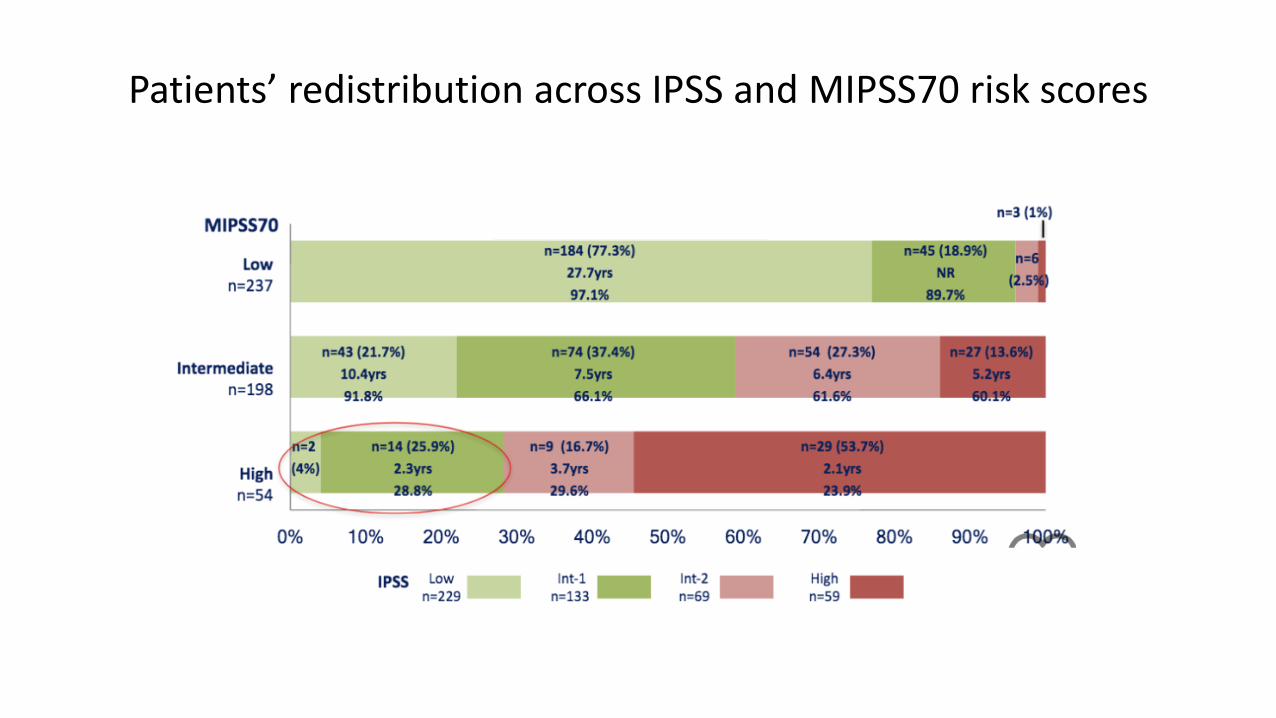
Patients’ redistribution across IPSS and MIPSS70 risk scores

Pacritinib (JAK2 inhibitor): PERSIST randomized phase III trial
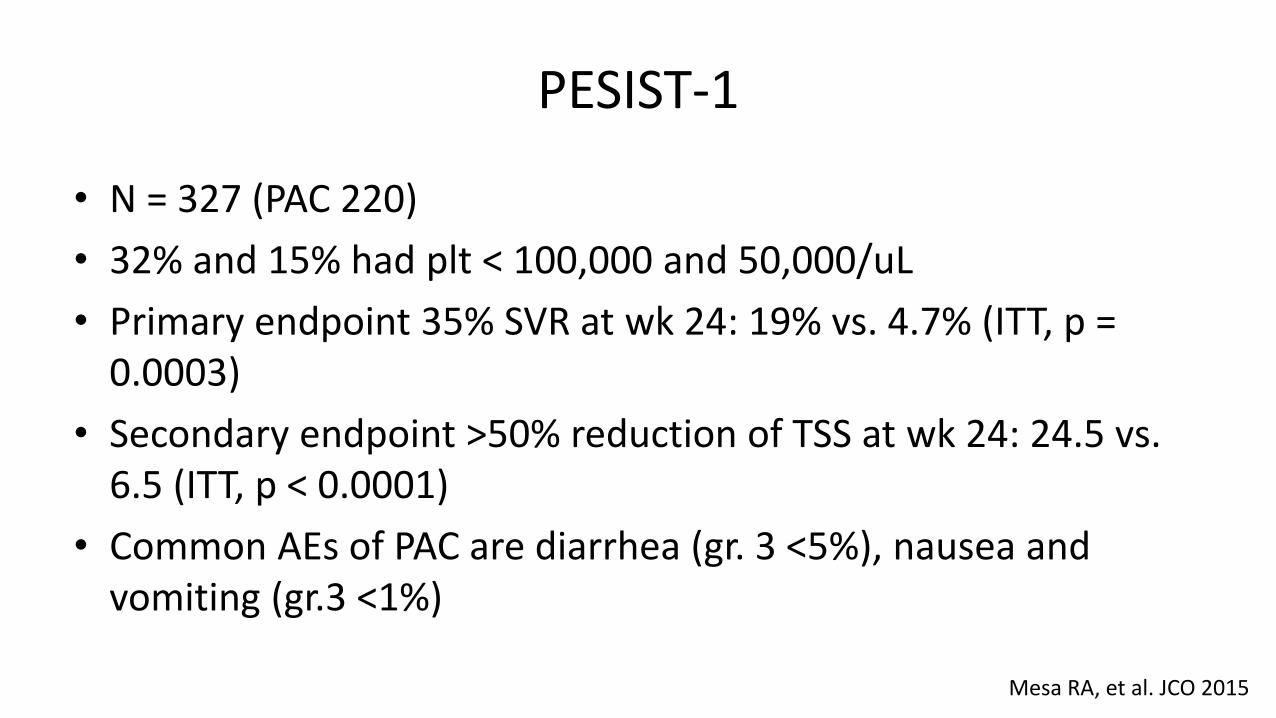
PESIST-1
• N = 327 (PAC 220)
• 32% and 15% had plt < 100,000 and 50,000/uL
• Primary endpoint 35% SVR at wk 24: 19% vs. 4.7% (ITT, p = 0.0003)
• Secondary endpoint >50% reduction of TSS at wk 24: 24.5 vs. 6.5 (ITT, p < 0.0001)
• Common AEs of PAC are diarrhea (gr. 3 <5%), nausea and vomiting (gr.3 <1%)
Mesa RA, et al. JCO 2015

PERSIST-2: >50% reduction in TSS
TSS = total symptom score

PAC203: Dose ranging clinical trial
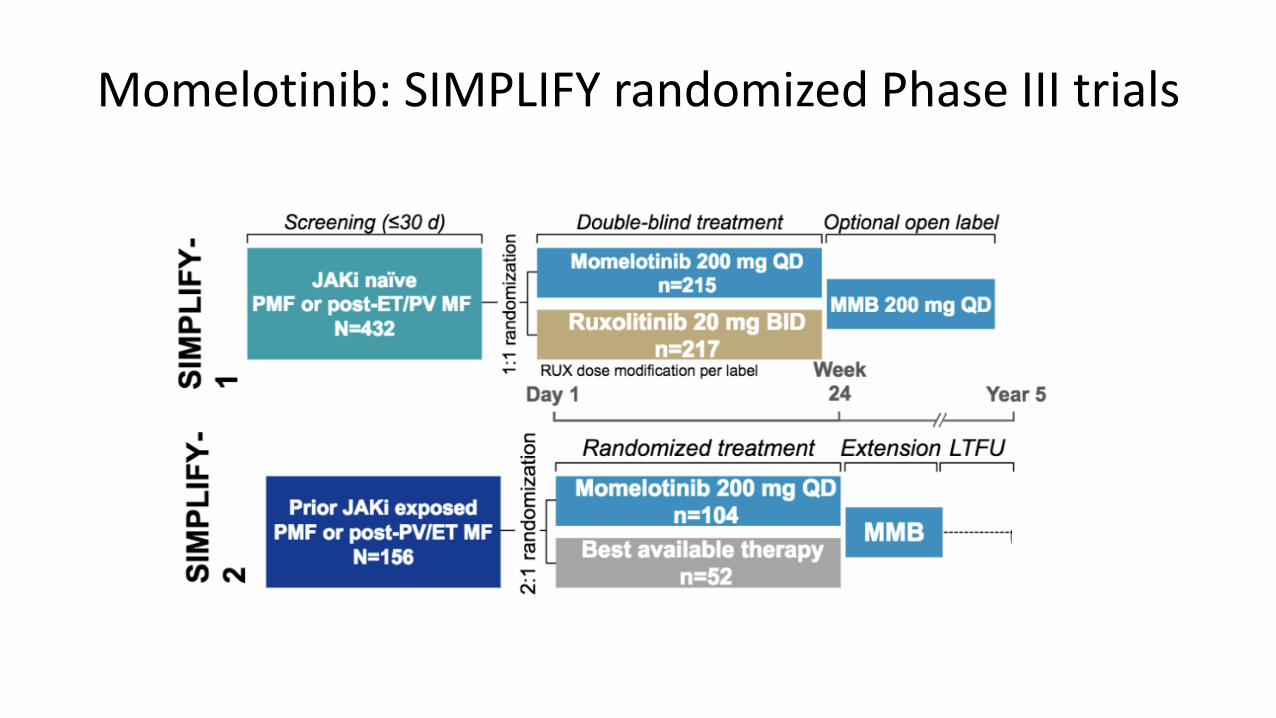
Momelotinib: SIMPLIFY randomized Phase III trials

SIMPLIFY-1: Primary endpoint: Spleen Secondary endpoint: Reduction in symptoms
At wk 24

SIMPLIFY-2: Primary endpoint SRR Secondary endpoint TSS response rate

TH1712752757
Primary Analysis of JUMP, a Phase 3b, Expanded-Access Study
Evaluating the Safety and Efficacy of Ruxolitinib in Patients With
Myelofibrosis (N = 2233)
Haifa Kathrin Al-Ali,1 Lynda Foltz,2 Giuseppe A. Palumbo,3 Bruno Martino,4 Francesca Palandri,5 Anna Marina Liberati,6
Philipp Le Coutre,7 Carmen Garcia-Hernandez,8 Andrey Zaritskey,9 Renato Tavares,10 Martin Griesshammer,11 Vikas
Gupta,12 Pia Raanani,13 Pilar Giraldo,14 Catherine Bouard,15 Julian Perez Ronco,15 Ranjan Tiwari,16 Francesco Mannelli,17
Alessandro M. Vannucchi17
1University Hospital of Halle, Halle (Saale), Germany; 2St Paul’s Hospital, University of British Columbia, Vancouver, BC, Canada; 3Azienda Ospedaliero-Universitaria ―Policlinico-
Vittorio Emanuele,‖ Catania, Italy; 4Azienda Ospedaliera ―Bianchi Melacrino Morelli,‖ Reggio Calabria, Italy; 5Department of Hematology/Oncology, ―Seràgnoli‖ Institute of
Hematology, University of Bologna School of Medicine, Bologna, Italy; 6University of Perugia, Azienda Ospedaliera S. Maria, Terni, Italy; 7Charité—Universitätsmedizin Berlin,
Germany; 8Hospital General de Alicante, Alicante, Spain; 9Federal Almazov Medical Research Center of the Russian Ministry of Health, St Petersburg, Russia; 10Universidade
Federal de Goiania, Goiás, Brazil; 11Johannes-Wesling Academic Medical Center, University of Hannover Teaching Hospital, Minden, Germany; 12Princess Margaret Cancer
Centre, Toronto, ON, Canada;13Rabin Medical Center, Petah Tikva, and Sackler School of Medicine, Tel Aviv University, Tel Aviv, Israel; 14Miguel Servet University Hospital and
Centro de Investigación Biomédica en Red de Enfermedades Raras (CIBERER), Zaragoza, Spain; 15Novartis Pharma AG, Basel, Switzerland; 16Novartis Healthcare Pvt Ltd,
Hyderabad, India; 17Center for Research and Innovation of Myeloproliferative Neoplasms, Azienda Ospedaliero-Universitaria Careggi, University of Florence, Florence, Italy
TH1712752757
Introduction
• Ruxolitinib is a potent Janus kinase 1 (JAK1)/JAK2 inhibitor that has been proven to be superior to placebo1
and best available therapy (BAT)2 in the phase 3 COMFORT studies of patients with intermediate-2 (Int-2)– or
high-risk myelofibrosis (MF)
• Ruxolitinib-treated patients demonstrated rapid and durable improvements in splenomegaly and MF-related
symptoms,1,2 as well as improved overall survival3-5
• JUMP (JAK Inhibitor RUxolitinib in Myelofibrosis Patients) is a phase 3b expanded-access trial for patients in
countries without access to ruxolitinib outside of a clinical study and is evaluating the safety and efficacy of
ruxolitinib in patients with MF
— JUMP is the largest study to date in patients with MF who have received ruxolitinib treatment
• Here we report safety and efficacy findings from the primary analysis of JUMP, which included 2233 patients
treated at 279 clinical sites across 26 countries
Al-Ali et al. Poster Presentation at ASH Annual Meeting, Atlanta, Georgia, USA, 9–12 December, 2017:(abstract 4204). 49

TH1712752757
Countries shaded in orange include patients enrolled in JUMP.
50
Introduction
Al-Ali et al. Poster Presentation at ASH Annual Meeting, Atlanta, Georgia, USA, 9–12 December, 2017:(abstract 4204).

TH1712752757
PET-MF, post–essential thrombocythemia myelofibrosis; PMF, primary myelofibrosis; PPV-MF, post–polycythemia vera myelofibrosis.
a Included by amendments to the protocol. b Patients will be treated for up to 24 months after the last patient’s first visit (December 23, 2014), unless discontinuation criteria are met.
51
Methods Figure 1. Study Design: single arm
Al-Ali et al. Poster Presentation at ASH Annual Meeting, Atlanta, Georgia, USA, 9–12 December, 2017:(abstract 4204).

TH1712752757
• Most patients (57.5% [n = 1283]) completed treatment per protocol; 42.5% of patients (n = 950) discontinued
treatment early
• Primary reasons for discontinuation from treatment included adverse events (AEs; 18.1% [n = 405]), investigator-
determined disease progression (9.1% [n = 204]), death (4.5% [n = 101]), physician decision (4.2% [n = 93]),
withdrawal of consent (3.5% [n = 79]), protocol deviation (1.2% [n = 27]), administrative problems (1.1% [n = 25]),
and lost to follow-up (0.7% [n = 16])
— The most common hematologic AEs leading to discontinuation were thrombocytopenia (3.5% [n = 77]), anemia (2.0% [n =
44]), leukocytosis (0.8% [n = 18]), and neutropenia (0.2% [n = 4])
— The most common nonhematologic AEs leading to discontinuation were infections (2.6% [n = 59]); all other AEs that led to
discontinuation occurred in < 2% of patients
• The median exposure was 12.4 months (range, < 0.1-59.7 months)
— 1138 patients (51%) had > 1 year, 674 patients (30%) had > 2 years, and 289 patients (13%) had > 3 years of exposure
— The mean daily dose was 28.7 mg (Figure 2); median average total daily dose was 36.1 mg for patients starting at 20 mg bid
(62.0% [n = 1384]), 23.1 mg for patients starting at 15 mg bid (28.9% [n = 646]), and 12.7 mg for those starting at other doses
(9.1% [n = 203])
— The majority of patients (67.4% [n = 1504]) had dose modifications; 27.2% (n = 608) had dose interruptions
52
Results Patients
Al-Ali et al. Poster Presentation at ASH Annual Meeting, Atlanta, Georgia, USA, 9–12 December, 2017:(abstract 4204).

TH1712752757
aTwenty patients started at doses other than 5, 10, 15, or 20 mg bid: 5 mg qd (once daily; n = 1); 10 mg qd (n = 3); 7.5 mg bid (n = 4); 15 mg qd (n = 7); and 20 mg qd (n =
5).
53
Results Figure 2. Mean Total Daily Dosea
Al-Ali et al. Poster Presentation at ASH Annual Meeting, Atlanta, Georgia, USA, 9–12 December, 2017:(abstract 4204).

TH1712752757
a Regardless of relationship to study drug; AEs occurring within 28 days of treatment discontinuation are included.
54
Results Table 2. Adverse Events Regardless of Study Drug Relationship (≥ 5% of patients)
Al-Ali et al. Poster Presentation at ASH Annual Meeting, Atlanta, Georgia, USA, 9–12 December, 2017:(abstract 4204).

TH1712752757
55
Results Figure 3 (A). Box Plots of Hemoglobin Levels Over Time
Al-Ali et al. Poster Presentation at ASH Annual Meeting, Atlanta, Georgia, USA, 9–12 December, 2017:(abstract 4204).
TH1712752757
56
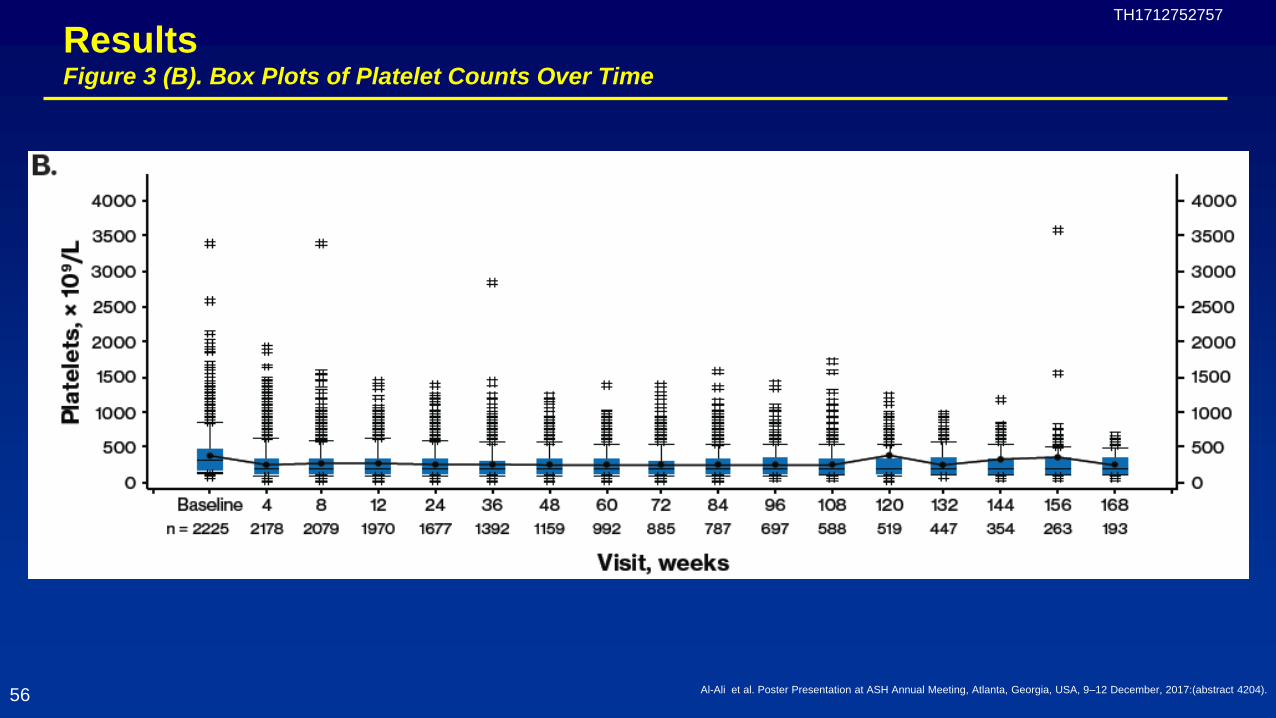
Results Figure 3 (B). Box Plots of Platelet Counts Over Time
Al-Ali et al. Poster Presentation at ASH Annual Meeting, Atlanta, Georgia, USA, 9–12 December, 2017:(abstract 4204).

TH1712752757
• Secondary malignancies that occurred in ≥ 0.1% of patients included acute leukemia (2.0% [n = 45]), basal cell
carcinoma (1.4% [n = 31]), squamous cell carcinoma (1.2% [n = 26]), lung neoplasm (0.2% [n = 5]), prostate cancer
(0.2% [n = 5]), skin neoplasm (0.2% [n = 4]), and Bowen disease (0.1% [n = 3])
— Other secondary malignancies occurred in < 0.1% of patients; there were 2 cases of non-Hodgkin’s lymphoma, and 1 case each of
B-cell lymphoma and lymphoma
• All-grade infections in ≥ 5% of patients included pneumonia (7.3% [n = 162]), urinary tract infection (5.9% [n = 132]),
herpes zoster (5.2% [n = 116]), and nasopharyngitis (5.2% [n = 115])
— Infections led to discontinuation in 59 patients (2.6%)
— Grade 3/4 infections occurring in ˃ 1% of patients included pneumonia (4.7% [n = 104]), sepsis (1.5% [n = 33]), and urinary tract
infection (1.2% [n = 27])
— Herpes zoster infection was reported in 5.2% of patients (n = 116; grade 3/4, 0.5% [n = 11]) and led to treatment discontinuation in
1 patient (< 0.1%)
— Tuberculosis was reported in 5 patients (0.2%; grade 3/4, 0.04% [n = 1]) and led to treatment discontinuation in 3 patients (0.1%)
— Hepatitis B reactivation was reported in 1 patient (grade 3/4) and led to treatment discontinuation
57
Results Safety
Al-Ali et al. Poster Presentation at ASH Annual Meeting, Atlanta, Georgia, USA, 9–12 December, 2017:(abstract 4204).

TH1712752757
58
Results Figure 4. Patients With a ≥ 25% and a ≥ 50% Decrease From Baseline in Spleen Length
Al-Ali et al. Poster Presentation at ASH Annual Meeting, Atlanta, Georgia, USA, 9–12 December, 2017:(abstract 4204).

TH1712752757
59
Results Figure 5. Best Percent Change From Baseline in Palpable Spleen Length at Any Time
Al-Ali et al. Poster Presentation at ASH Annual Meeting, Atlanta, Georgia, USA, 9–12 December, 2017:(abstract 4204).

TH1712752757
a Response was defined as the lower limit of the MID (FACT-Lym TS, 6.5 points8; FACIT-Fatigue score, 3 points9).
60
Results Figure 6. Proportion of Patients Achieving a Responsea in (A) FACT-Lym TS and on (B) FACIT-Fatigue Scale
Al-Ali et al. Poster Presentation at ASH Annual Meeting, Atlanta, Georgia, USA, 9–12 December, 2017:(abstract 4204).

TH1712752757
• The KM-estimated probability of overall survival was 93% (95% CI, 92%-94%) at week 48 and 87% (95% CI, 85%-88%)
at week 96
• The KM-estimated probability of leukemia-free survival was 92% (95% CI, 91%-93%) at week 48 and 85% (95% CI,
83%-87%) at week 96 (median follow-up, 60 weeks)
— A total of 45 patients developed acute myeloid leukemia during the study or within 28 days following treatment discontinuation
• The KM-estimated probability of progression-free survival (by IWG-MRT criteria7) was 89% (95% CI, 88%-91%) at week
48 and 80% (95% CI, 78%-82%) at week 96 (median follow-up, 55 weeks)
61
Results Overall, Leukemia-Free, and Progression-Free Survival
Al-Ali et al. Poster Presentation at ASH Annual Meeting, Atlanta, Georgia, USA, 9–12 December, 2017:(abstract 4204).

TH1712752757
Conclusions
• JUMP includes the largest cohort of patients with MF treated with ruxolitinib to date
• Ruxolitinib was well tolerated and had an AE profile consistent with what had been previously reported
— The most common AEs were anemia and thrombocytopenia, but they rarely led to discontinuation
— Nonhematologic AEs, including infections, were mainly grade 1/2
• As observed previously, most patients experienced reductions in splenomegaly and symptoms with ruxolitinib treatment
• Overall, the safety and efficacy profile of ruxolitinib in JUMP is consistent with that in the phase 3 COMFORT studies
62 Al-Ali et al. Poster Presentation at ASH Annual Meeting, Atlanta, Georgia, USA, 9–12 December, 2017:(abstract 4204).

Current status of MPN
• More personalized treatment for MPN is needed. • RESPONSE (@4 years) and JUMP trial (primary analysis)
– A highly effective drug benefitting many patients – Thrombocytopenia and anemia may limit effective dosing – AEs: infections are more frequent and evidence of skin cancer
• Re-THINK trial, lack of current evidence of benefit from early disease with aim of disease moderation in early MF with HRM (ongoing trial)
• New JAK inhibitor phase III trials have demonstrated for efficacy, safety and a tolerability in MF.