ashif s. iquebal, dinakar sagapuram, and satish ... plastic ow in polishing of rough surfaces ashif...
TRANSCRIPT
Surface plastic flow in polishing of rough surfaces
Ashif S. Iquebal, Dinakar Sagapuram, and Satish Bukkapatnama
Department of Industrial and Systems Engineering,
Texas A&M University, College Station, Texas 77840, USA
ashif [email protected], [email protected], [email protected]
Abstract
We report electron microscopy observations of the surface plastic flow in polishing of rough metal
surfaces with a controlled spherical asperity structure. We show that asperity–abrasive sliding
contacts exhibit viscous behavior, where the material flows in the form of thin fluid-like layers.
Subsequent bridging of these layers among neighboring asperities result in progressive surface
smoothening. Our study provides new phenomenological insights into the long-debated mechanism
of polishing. The observations are of broad relevance in tribology and materials processing.
a Corresponding author
1
arX
iv:1
610.
0971
9v2
[co
nd-m
at.m
trl-
sci]
31
Mar
201
7
Mechanical interactions between severely rubbing surfaces have long been of fundamental
interest for understanding friction in a wide range of domains including tribology, materials
processing and geophysics. An important practical application of such interactions is in
polishing of materials where rubbing action of fine abrasives is utilized to obtain smooth
surfaces for application in optics, microscopy and mechanical instrumentation.
The practice of polishing to impart solid surfaces with smooth, lustrous finish has been
known for centuries. The use of hard abrasives such as corundum and diamond for polishing
in fact dates back to the Neolithic period [1] and Leonardo da Vinci is credited with the
earliest systematic design of a polishing machine [2]. It might be surprising then to know
that the mechanism of polishing—how surface irregularities are smoothened out by abrasive
particles—is still unsettled. Excellent account of the history and theories of polishing can
be found in [3–5]. However, it may suffice to note that mainly two lines of thought for the
polishing mechanism have prevailed: that of abrasion and surface flow. Early theories by
Hooke and Newton [6], followed by those of Herschel [5] and Rayleigh [7] viewed polishing
essentially as an abrasion or a grinding process at a very fine scale where surface irregularities
are removed by cutting action of the abrasives. The work by Samuels [8] presented irrefutable
evidence for this mechanism and showed how abrasives act as planing tools and result in the
generation of well-defined chips as they slide past a surface. The alternative theory emerges
from the work by Beilby [9] who proposed surface smoothening occurring via surface flow
and material redistribution. Here, it is believed that the material from surface peaks ‘flows’
to fill up the valleys and forms a thin vitreous surface layer, generally referred to as the
“Beilby layer”. Bowden and Hughes [10] further developed this theory and proposed that
surface flow is in fact mediated by local melting at the surface–abrasive contacts. Electron
diffraction measurements of polished surfaces have been presented as indirect evidence for
the Beilby layer formation, but these observations were later proved to be inconclusive. To
our knowledge, no conclusive evidence for the surface flow or melting has been provided to
date. Other theories of polishing also exist, among which noteworthy is the molecular level
material removal mechanism put forward by Rabinowicz [4] based on energy considerations.
In this study, we report direct experimental observations of surface plastic flow in polish-
ing of an idealized rough metal surface having spherical asperities. Our electron microscopy
observations of polished surfaces reveal viscous flow at the asperity–abrasive sliding con-
tacts, involving surface material flow towards the asperity sides in the form of thin fluid-like
2
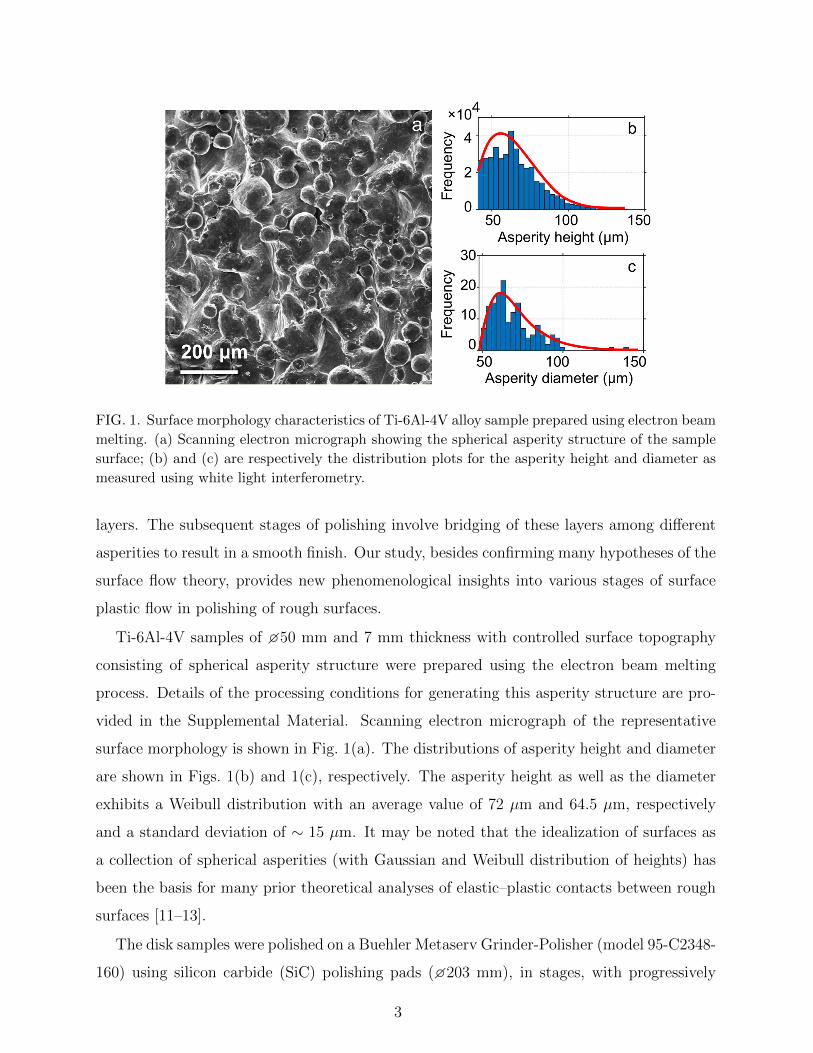
FIG. 1. Surface morphology characteristics of Ti-6Al-4V alloy sample prepared using electron beam
melting. (a) Scanning electron micrograph showing the spherical asperity structure of the sample
surface; (b) and (c) are respectively the distribution plots for the asperity height and diameter as
measured using white light interferometry.
layers. The subsequent stages of polishing involve bridging of these layers among different
asperities to result in a smooth finish. Our study, besides confirming many hypotheses of the
surface flow theory, provides new phenomenological insights into various stages of surface
plastic flow in polishing of rough surfaces.
Ti-6Al-4V samples of �50 mm and 7 mm thickness with controlled surface topography
consisting of spherical asperity structure were prepared using the electron beam melting
process. Details of the processing conditions for generating this asperity structure are pro-
vided in the Supplemental Material. Scanning electron micrograph of the representative
surface morphology is shown in Fig. 1(a). The distributions of asperity height and diameter
are shown in Figs. 1(b) and 1(c), respectively. The asperity height as well as the diameter
exhibits a Weibull distribution with an average value of 72 µm and 64.5 µm, respectively
and a standard deviation of ∼ 15 µm. It may be noted that the idealization of surfaces as
a collection of spherical asperities (with Gaussian and Weibull distribution of heights) has
been the basis for many prior theoretical analyses of elastic–plastic contacts between rough
surfaces [11–13].
The disk samples were polished on a Buehler Metaserv Grinder-Polisher (model 95-C2348-
160) using silicon carbide (SiC) polishing pads (�203 mm), in stages, with progressively
3
smaller abrasives ranging from 30 µm to 5 µm under dry conditions. A steady nominal
down pressure of ∼ 0.5 kPa was maintained and the polisher speed was fixed at 500 rpm.
The workpiece sample was manually subject to a quasi-random orbital motion. The final
polishing step involved the use of alumina abrasives (< 1 µm), suspended in an aqueous
solution (20% by wt., pH≈ 7.5) for 20 minutes to impart a specular finish to the surface. The
polishing was interrupted at every 90 s intervals to observe the surface morphology changes
and asperity structure evolution using scanning electron microscopy (SEM). Quantitative
details pertaining to the surface finish including surface roughness (Sa) and volume of inter-
asperity “valleys” (Sv) were measured using white light interferometry. Inter-asperity valleys
were characterized by the surface heights lying below 10th percentile on the bearing area
curve (i.e., the cumulative distribution of surface profile) [13]. To ensure that observations
and measurements were made at the same surface location during different polishing steps,
the sample surface was initially indented with a 2× 2 mm square grid. The vertices of this
grid enabled us to image the same surface location after each interrupted test. To facilitate
better observations of the plastic flow patterns at asperity surfaces, the sample was tilted
by 70◦ in the scanning electron microscope.
Electron microscopy of the surface asperities enabled us to capture key phenomenological
details of the polishing mechanism. Figures 2(b) and 2(c) show typical asperity structures
after 90 s of polishing. Severe shear of the asperity surface and accumulation of the ma-
terial towards asperity edges (see at arrow) is evident from Fig. 2(a). This flow pattern is
reminiscent of plastic sliding between surfaces oriented at shallow angles, such as in sliding
indentation or ‘machining’ under highly negative rake angles [14, 15]. Furthermore, the
sheared surface material is often seen to flow to the lateral sides of the asperity as thin
layers (Fig. 2(b)). Interestingly, the flow is seen to be quite symmetric around the periphery
of sheared surface, with deposited material layer showing a molten-like appearance. The
sliding direction between the asperity and abrasive particle can be inferred from the sliding
marks in Fig. 2(b). This omni-directional flow at the surface, coupled with the observation
of rheological flow features at the asperity edges (Fig. 2(a)), suggests fluid-like behavior of
the surface plastic flow in polishing.
To explore the possible origin for this flow behavior, we estimated the “flash” tempera-
ture at the asperity–abrasive sliding contacts using the circular moving heat source model
[16], where the abrasive particle was treated as a semi-infinite moving body over which a
4
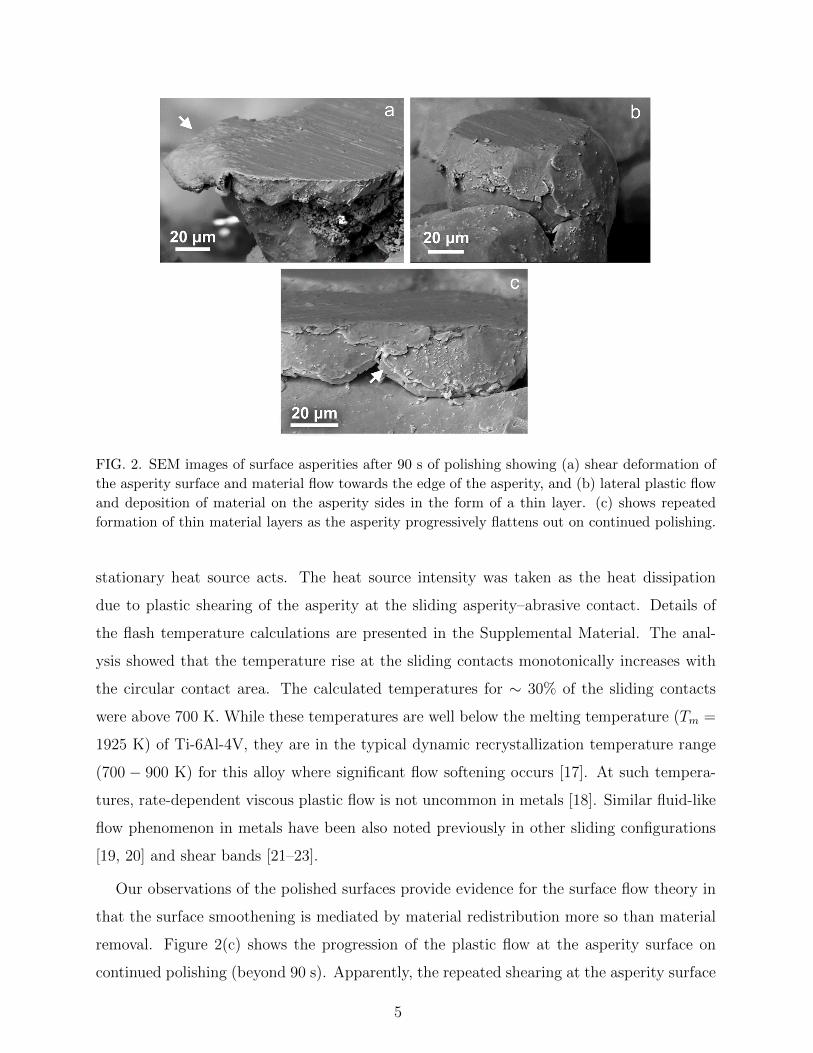
FIG. 2. SEM images of surface asperities after 90 s of polishing showing (a) shear deformation of
the asperity surface and material flow towards the edge of the asperity, and (b) lateral plastic flow
and deposition of material on the asperity sides in the form of a thin layer. (c) shows repeated
formation of thin material layers as the asperity progressively flattens out on continued polishing.
stationary heat source acts. The heat source intensity was taken as the heat dissipation
due to plastic shearing of the asperity at the sliding asperity–abrasive contact. Details of
the flash temperature calculations are presented in the Supplemental Material. The anal-
ysis showed that the temperature rise at the sliding contacts monotonically increases with
the circular contact area. The calculated temperatures for ∼ 30% of the sliding contacts
were above 700 K. While these temperatures are well below the melting temperature (Tm =
1925 K) of Ti-6Al-4V, they are in the typical dynamic recrystallization temperature range
(700 − 900 K) for this alloy where significant flow softening occurs [17]. At such tempera-
tures, rate-dependent viscous plastic flow is not uncommon in metals [18]. Similar fluid-like
flow phenomenon in metals have been also noted previously in other sliding configurations
[19, 20] and shear bands [21–23].
Our observations of the polished surfaces provide evidence for the surface flow theory in
that the surface smoothening is mediated by material redistribution more so than material
removal. Figure 2(c) shows the progression of the plastic flow at the asperity surface on
continued polishing (beyond 90 s). Apparently, the repeated shearing at the asperity surface
5
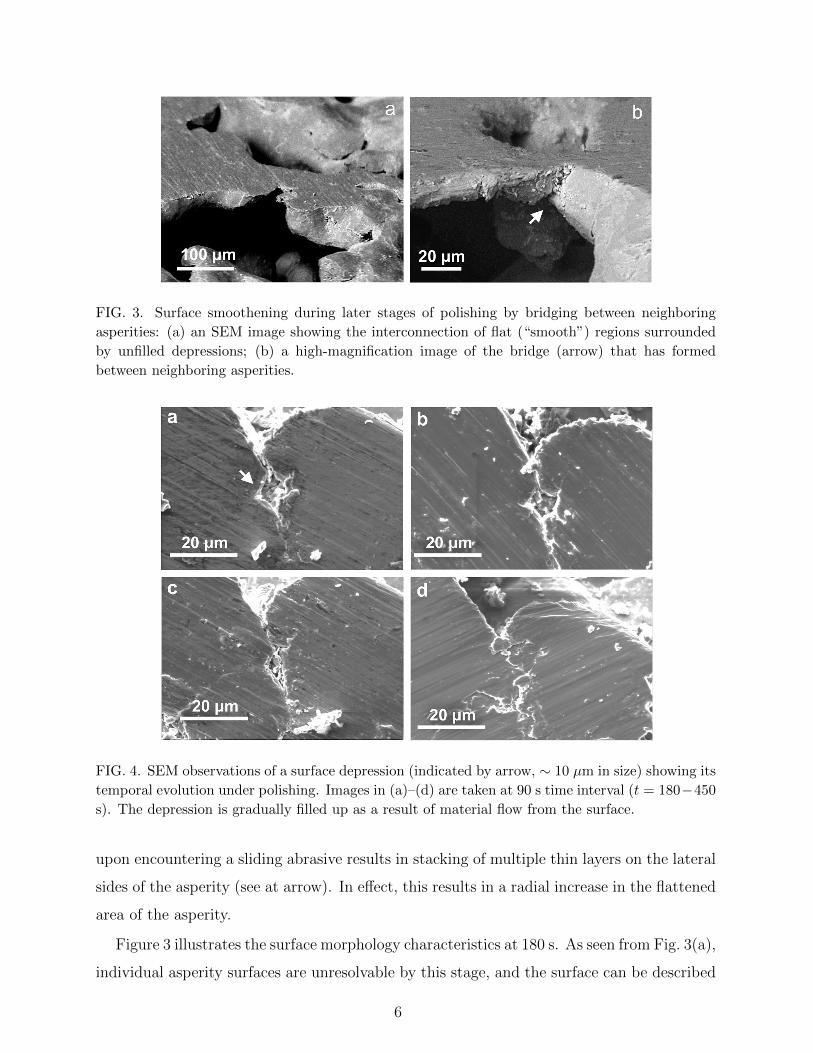
FIG. 3. Surface smoothening during later stages of polishing by bridging between neighboring
asperities: (a) an SEM image showing the interconnection of flat (“smooth”) regions surrounded
by unfilled depressions; (b) a high-magnification image of the bridge (arrow) that has formed
between neighboring asperities.
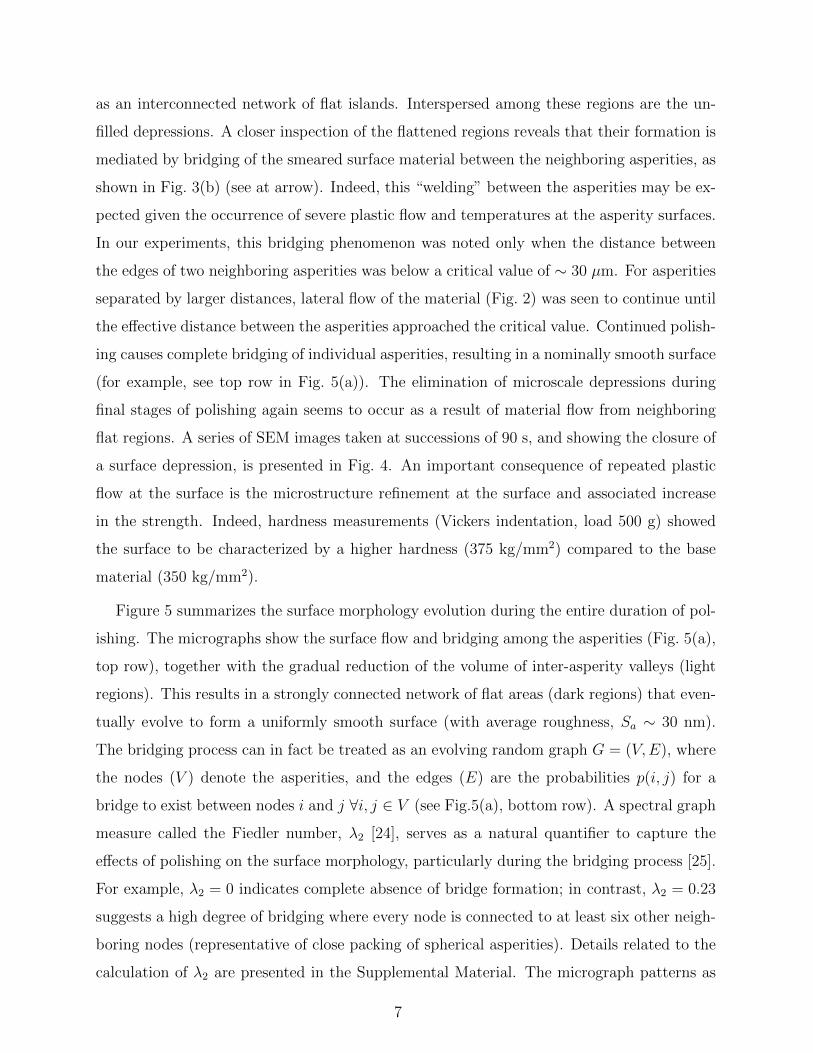
FIG. 4. SEM observations of a surface depression (indicated by arrow, ∼ 10 µm in size) showing its
temporal evolution under polishing. Images in (a)–(d) are taken at 90 s time interval (t = 180−450
s). The depression is gradually filled up as a result of material flow from the surface.
upon encountering a sliding abrasive results in stacking of multiple thin layers on the lateral
sides of the asperity (see at arrow). In effect, this results in a radial increase in the flattened
area of the asperity.
Figure 3 illustrates the surface morphology characteristics at 180 s. As seen from Fig. 3(a),
individual asperity surfaces are unresolvable by this stage, and the surface can be described
6
as an interconnected network of flat islands. Interspersed among these regions are the un-
filled depressions. A closer inspection of the flattened regions reveals that their formation is
mediated by bridging of the smeared surface material between the neighboring asperities, as
shown in Fig. 3(b) (see at arrow). Indeed, this “welding” between the asperities may be ex-
pected given the occurrence of severe plastic flow and temperatures at the asperity surfaces.
In our experiments, this bridging phenomenon was noted only when the distance between
the edges of two neighboring asperities was below a critical value of ∼ 30 µm. For asperities
separated by larger distances, lateral flow of the material (Fig. 2) was seen to continue until
the effective distance between the asperities approached the critical value. Continued polish-
ing causes complete bridging of individual asperities, resulting in a nominally smooth surface
(for example, see top row in Fig. 5(a)). The elimination of microscale depressions during
final stages of polishing again seems to occur as a result of material flow from neighboring
flat regions. A series of SEM images taken at successions of 90 s, and showing the closure of
a surface depression, is presented in Fig. 4. An important consequence of repeated plastic
flow at the surface is the microstructure refinement at the surface and associated increase
in the strength. Indeed, hardness measurements (Vickers indentation, load 500 g) showed
the surface to be characterized by a higher hardness (375 kg/mm2) compared to the base
material (350 kg/mm2).
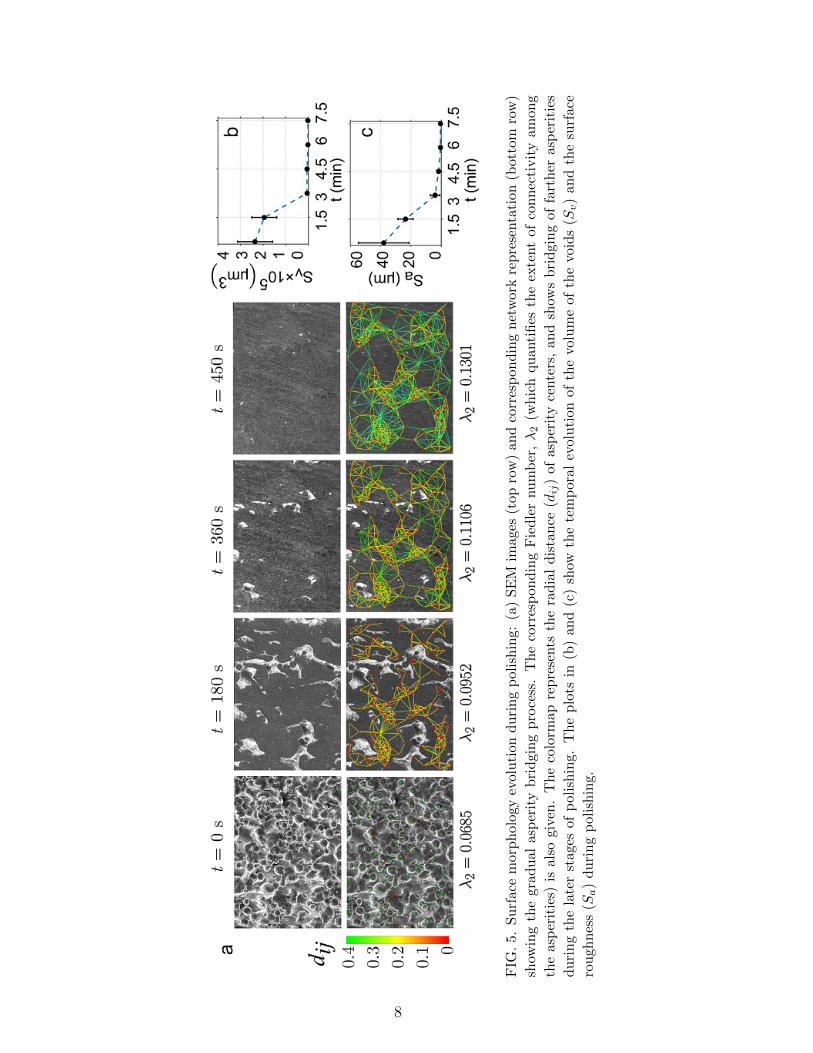
Figure 5 summarizes the surface morphology evolution during the entire duration of pol-
ishing. The micrographs show the surface flow and bridging among the asperities (Fig. 5(a),
top row), together with the gradual reduction of the volume of inter-asperity valleys (light
regions). This results in a strongly connected network of flat areas (dark regions) that even-
tually evolve to form a uniformly smooth surface (with average roughness, Sa ∼ 30 nm).
The bridging process can in fact be treated as an evolving random graph G = (V,E), where
the nodes (V ) denote the asperities, and the edges (E) are the probabilities p(i, j) for a
bridge to exist between nodes i and j ∀i, j ∈ V (see Fig.5(a), bottom row). A spectral graph
measure called the Fiedler number, λ2 [24], serves as a natural quantifier to capture the
effects of polishing on the surface morphology, particularly during the bridging process [25].
For example, λ2 = 0 indicates complete absence of bridge formation; in contrast, λ2 = 0.23
suggests a high degree of bridging where every node is connected to at least six other neigh-
boring nodes (representative of close packing of spherical asperities). Details related to the
calculation of λ2 are presented in the Supplemental Material. The micrograph patterns as
7
FIG
.5.
Su
rfac
em
orp
hol
ogy
evolu
tion
du
rin
gp
olis
hin
g:(a
)S
EM
imag
es(t
opro
w)
and
corr
esp
ond
ing
net
wor
kre
pre
senta
tion
(bot
tom
row
)
show
ing
the
gra
dual
asp
erit
yb
rid
gin
gp
roce
ss.
Th
eco
rres
pon
din
gF
ied
ler
nu
mb
er,λ
2(w
hic
hqu
anti
fies
the
exte
nt
ofco
nn
ecti
vit
yam
ong
the
asp
erit
ies)
isal
sogiv
en.
Th
eco
lorm
apre
pre
sents
the
rad
ial
dis
tan
ce(d
ij)
ofas
per
ity
cente
rs,
and
show
sb
rid
gin
gof
fart
her
asp
erit
ies
du
rin
gth
ela
ter
stag
esof
pol
ish
ing.
Th
ep
lots
in(b
)an
d(c
)sh
owth
ete
mp
oral
evol
uti
onof
the
volu
me
ofth
evoi
ds
(Sv)
and
the
surf
ace
rou
gh
nes
s(S
a)
du
rin
gp
oli
shin
g.
8
well as the corresponding λ2 values presented in Fig. 5(a) suggest that as polishing ensues
and the asperity diameters grow, the propensity of neighboring asperities to bridge (i.e.,
p(i, j)) progressively increases. Quantitatively speaking, the initial value of λ2 = 0.068 (see
Fig. 5(a), bottom row) indicates little bridging (average number of bridges connecting a
node or the “degree” is < 1) as reflected in p(i, j) being close to zero between almost all
asperities. Specifically, the edges connecting the neighboring nodes are almost absent ini-
tially, and low probability edges (red) connect only a sparse set of neighboring nodes. After
450 s of polishing, λ2 increases to 0.130, suggesting a higher degree of bridging among all
neighboring asperities (degree ≥ 4), and high p(i, j) values.
The corresponding temporal evolution of Sv and Sa, captured using surface interferome-
try, are given in Figs. 5(b) and 5(c), respectively. While both Sv and Sa decrease monoton-
ically with time, Sv drops sharply from ∼ 2 × 105 µm3 to 2.1 × 103 µm3 between 90 s and
180 s (Fig. 5(b)). This corresponds to the time interval where bridging of the asperities is
predominant (see Fig. 3). Unlike Sv, the Sa continues to decrease even after 180 s, likely
because of surface smoothening via reduction in microscale surface depressions during the
final stages of polishing (see Fig. 4).
While this study has focused on a Ti-based alloy system, the current findings are likely
to be more generic to polishing of a range of other material systems. In fact, surface
flow profiles at the asperities similar to that in Figs. 2 and 3 were also observed during
polishing of tantalum oxide (Ta2O5; see Fig. S4 in the Supplemental Material). These
observations in oxide materials, while at first surprising given their inherent brittle behavior,
can be explained by the high asperity–abrasive contact pressures that typically exceed the
workpiece material’s hardness. These high contact pressures can in turn promote plastic
flow even in highly brittle materials [26, 27]. Additionally, the asperity–abrasive contact
temperature calculations for polishing of Ta2O5 showed that the flash temperatures can be
a significant fraction (∼ 0.4Tm) of its melting temperature, which could potentially enhance
the propensity for viscous-type flow at asperity surfaces.
In closing, this letter presents direct experimental evidence for the surface flow mecha-
nism of polishing, and reports new phenomenological observations pertaining to plastic flow
aspects in smoothening of rough surfaces. These involve material flow from the asperity
contact surfaces to the lateral sides in the form of thin viscous layers, bridging of neigh-
boring asperities, and eventual filling-up of the small surface depressions by material flow
9
from the smooth surface regions. While these observations are consistent with the Beilby–
Bowden’s material redistribution theory of polishing, several important distinctions are in
order. First, no evidence for surface melting or amorphization was noted in contrast to the
original hypotheses [9, 10], although the microscopy observations of the surface flow profiles,
together with the temperature calculations of the asperity–abrasive sliding contacts, strongly
suggest the occurrence of viscous flow. Second, as demonstrated in Fig. 2, the material re-
distribution is facilitated by the material flow as thin layers that make self-contact with the
asperity sides. This is again at variance with the original ideas where the surface valleys are
believed to be filled purely via mechanical deformation (as in compression or indentation
plastic flows) of the asperities. Lastly, bridging among asperities is seen to be an important
mechanism by which neighboring asperities merge to form a smooth surface network. This
has not been accounted for in any of the prior studies. Besides polishing, our observations
are also of relevance to a range of other engineering and physical systems where micro-scale
asperity contacts, characterized by high pressures, are of intrinsic interest, e.g., tribological
systems, erosion and earthquakes. The well-known observations of the folded-layer struc-
tures in metamorphic rocks [28], which bear striking resemblance to the thin-layer stacking
profiles in Fig. 2(c), alludes to the possibility of similar viscous flow phenomena playing a
role also on a much larger scale in geophysical formations.
Acknowledgments: The authors would sincerely like to acknowledge Dr. Alex Fang,
Texas A&M University, for providing access to the lapping machine and the National Science
Foundation (CMMI- 1538501) for their kind support of this research.
[1] P. Lu, N. Yao, J. So, G. Harlow, J. Lu, G. Wang, and P. Chaikin, Archaeometry 47, 1 (2005).
[2] C. Pedretti, The Codex Atlanticus of Leonardo da Vinci: A Catalogue of its Newly Restored
Sheets (Johnson Reprint Corporation, New York, 1978).
[3] D. C. Cornish, The Mechanism of Glass Polishing: A History and Bibliography (British Sci-
entific Instrument Research Association, Chislehurst, Kent, 1961).
[4] E. Rabinowicz, Scientific American 218, 91 (1968).
[5] J. F. Archard, Physics Bulletin 36, 212 (1985).
[6] I. Newton, Opticks: Or, A Treatise of the Reflections, Refractions, Inflections and Colours of
10

Light (Dover Publications, New York, 1979).
[7] V. H. Bulsara, Y. Ahn, S. Chandrasekar, and T. Farris, Journal of Applied Mechanics 65,
410 (1998).
[8] L. E. Samuels, Metallographic Polishing by Mechanical Methods (ASM International, Materials
Park, OH, 2003).
[9] G. Beilby, Aggregation and Flow of Solids: Being the Records of an Experimental Study of the
Micro-structure and Physical Properties of Solids in Various States of Aggregation, 1900-1921
(Macmillan, London, 1921).
[10] F. P. Bowden and T. P. Hughes, Proceedings of the Royal Society of London A: Mathematical,
Physical and Engineering Sciences 160, 575 (1937).
[11] J. A. Greenwood and J. B. P. Williamson, Proceedings of the Royal Society of London A:
Mathematical, Physical and Engineering Sciences 295, 300 (1966).
[12] D. J. Whitehouse and J. F. Archard, Proceedings of the Royal Society of London A: Mathe-
matical, Physical and Engineering Sciences 316, 97 (1970).
[13] I. M. Hutchings and P. Shipway, Tribology: Friction and Wear of Engineering Materials (CRC
Press, Boca Raton, FL, 1992).
[14] J. M. Challen, L. J. McLean, and P. L. B. Oxley, Proceedings of the Royal Society of London
A: Mathematical, Physical and Engineering Sciences 394, 161 (1984).
[15] R. Komanduri, International Journal of Machine Tool Design and Research 11, 223 (1971).
[16] H. S. Carslaw and J. C. Jaeger, Conduction of Heat in Solids (Clarendon Press, Oxford, 1959).
[17] S. C. Liao and J. Duffy, Journal of the Mechanics and Physics of Solids 46, 2201 (1998).
[18] M. Ashby and H. Frost, Deformation-Mechanism Maps: The Plasticity and Creep of Metals
and Ceramics (Pergamon Press, Oxford, 1982).
[19] N. K. Sundaram, Y. Guo, and S. Chandrasekar, Physical Review Letters 109, 106001 (2012).
[20] E. M. Trent and P. K. Wright, Metal Cutting (Butterworth-Heinemann, Oxford, 2000).
[21] D. Sagapuram, K. Viswanathan, A. Mahato, N. K. Sundaram, R. M’Saoubi, K. P. Trumble,
and S. Chandrasekar, Proceedings of the Royal Society of London A: Mathematical, Physical
and Engineering Sciences 472 (2016).
[22] C. Healy, S. Koch, C. Siemers, D. Mukherji, and G. J. Ackland, Physical Review Letters 114,
165501 (2015).
[23] F. Spaepen, Nature Materials 5, 7 (2006).
11
[24] F. R. K. Chung, Spectral Graph Theory, Vol. 92 (American Mathematical Society, RI, 1997).
[25] P. K. Rao, O. F. Beyca, Z. Kong, S. T. Bukkapatnam, K. E. Case, and R. Komanduri, IIE
Transactions 47, 1088 (2015).
[26] P. W. Bridgman, Studies in Large Plastic Flow and Fracture: Emphasis on the Effects of
Hydrostatic Pressure (McGraw-Hill, New York, 1952).
[27] D. M. Marsh, Proceedings of the Royal Society of London A: Mathematical, Physical and
Engineering Sciences 279, 420 (1964).
[28] A. M. Hopgood, Determination of Structural Successions in Migmatites and Gneisses (Kluwer
Academic, Dordrecht, 1999).
12
Supplemental Material
Nomenclature
z asperity heights from the reference plane
a contact radius of the asperity–abrasive
contact area
R asperity radius
∆Tmax maximum temperature rise at the
asperity–abrasive interface
H workpiece surface hardness
V polishing speed
q total heat flux at the asperity–abrasive
interface
q1, q2 heat flux at the asperity and abrasive sur-
faces, respectively
Pe1, Pe2 Peclet number for the asperity and abra-
sive body
µ coefficient of friction at the asperity–
abrasive interface
k1, k2 thermal conductivity of asperity and
abrasive, respectively
K2 thermal diffusivity of the abrasive
ρ2 density of abrasive
C2 specific heat of abrasive
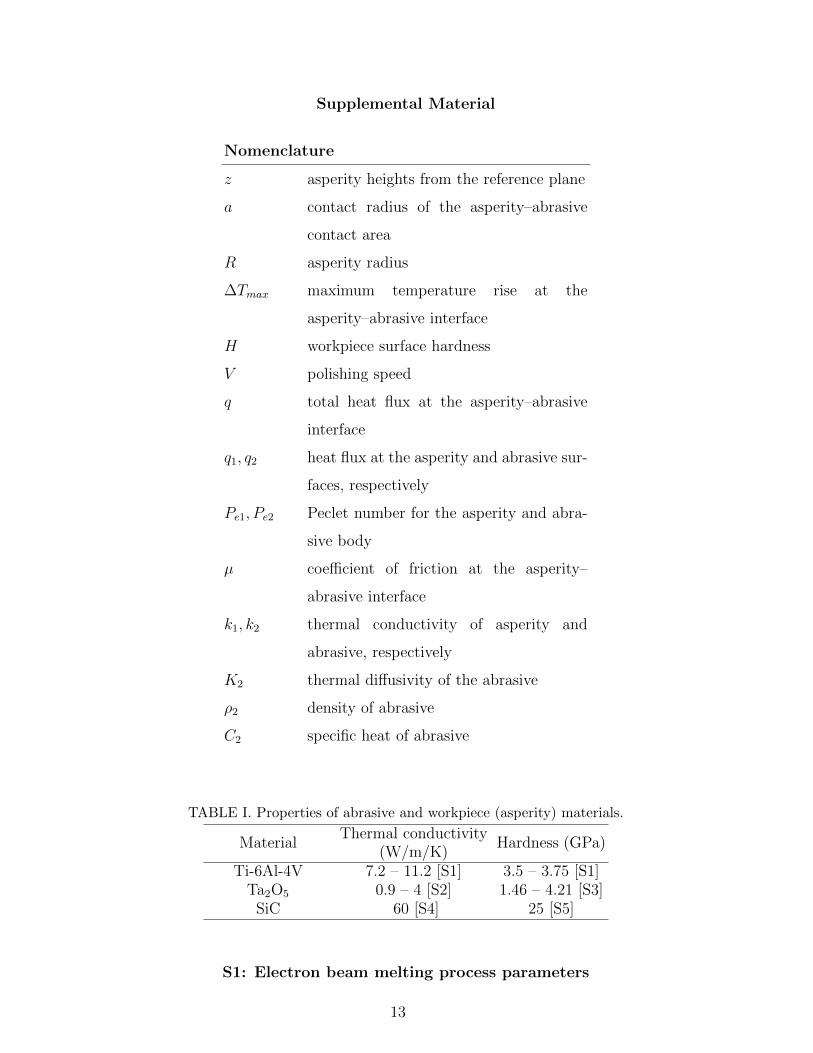
TABLE I. Properties of abrasive and workpiece (asperity) materials.
MaterialThermal conductivity
(W/m/K)Hardness (GPa)
Ti-6Al-4V 7.2 – 11.2 [S1] 3.5 – 3.75 [S1]Ta2O5 0.9 – 4 [S2] 1.46 – 4.21 [S3]
SiC 60 [S4] 25 [S5]
S1: Electron beam melting process parameters
13
Ti-6Al-4V cylindrical disks (�50 mm and 7 mm thickness) were prepared using an AR-
CAM electron beam melting machine operating at a vacuum of ∼ 2 Pa and accelerating
voltage of ∼ 60 kV. The process involved raking a 50 µm layer of Ti-6Al-4V powder of
average �72 µm (see Fig. S3) for the distribution of radius of Ti-6Al-4V particles) using
a focused beam of 3 mA, scanning at a speed of 10 m/s. The resulting surface consists of
granular Ti-6Al-4V particles with a unique spherical asperity structure. Such a controlled
asperity structure is ideal for systematic investigation of the surface flow behavior during
polishing.
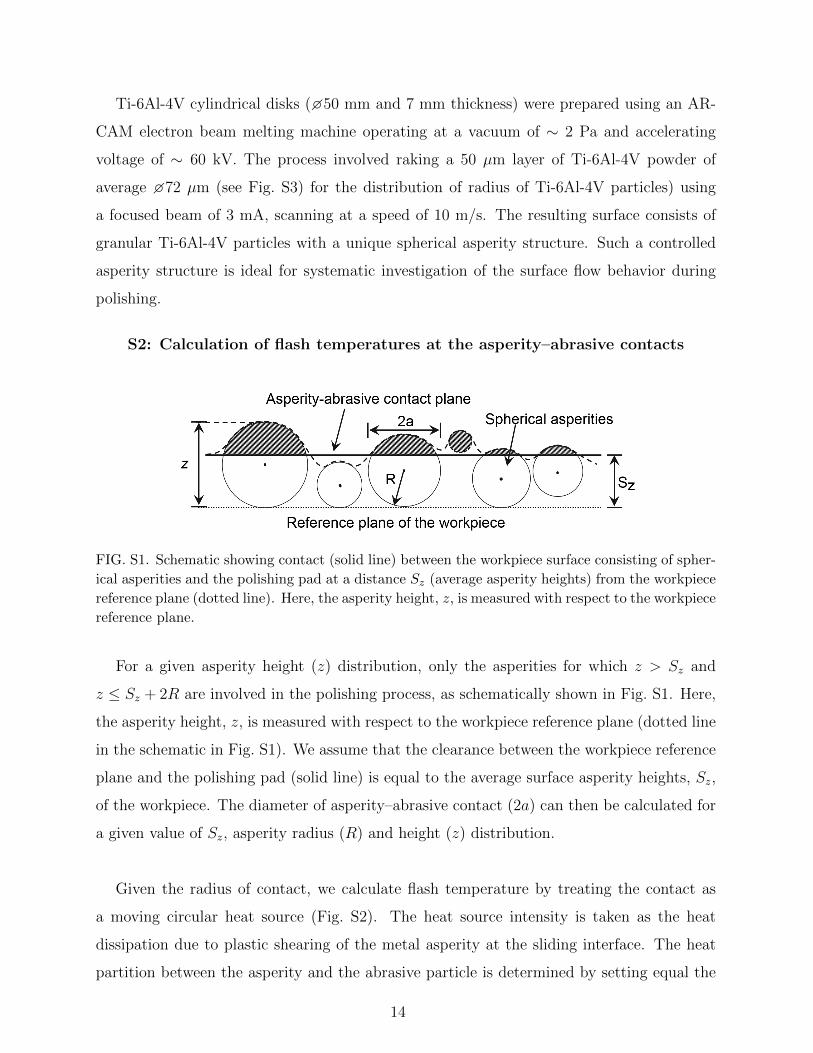
S2: Calculation of flash temperatures at the asperity–abrasive contacts
FIG. S1. Schematic showing contact (solid line) between the workpiece surface consisting of spher-
ical asperities and the polishing pad at a distance Sz (average asperity heights) from the workpiece
reference plane (dotted line). Here, the asperity height, z, is measured with respect to the workpiece
reference plane.
For a given asperity height (z) distribution, only the asperities for which z > Sz and
z ≤ Sz + 2R are involved in the polishing process, as schematically shown in Fig. S1. Here,
the asperity height, z, is measured with respect to the workpiece reference plane (dotted line
in the schematic in Fig. S1). We assume that the clearance between the workpiece reference
plane and the polishing pad (solid line) is equal to the average surface asperity heights, Sz,
of the workpiece. The diameter of asperity–abrasive contact (2a) can then be calculated for
a given value of Sz, asperity radius (R) and height (z) distribution.
Given the radius of contact, we calculate flash temperature by treating the contact as
a moving circular heat source (Fig. S2). The heat source intensity is taken as the heat
dissipation due to plastic shearing of the metal asperity at the sliding interface. The heat
partition between the asperity and the abrasive particle is determined by setting equal the
14
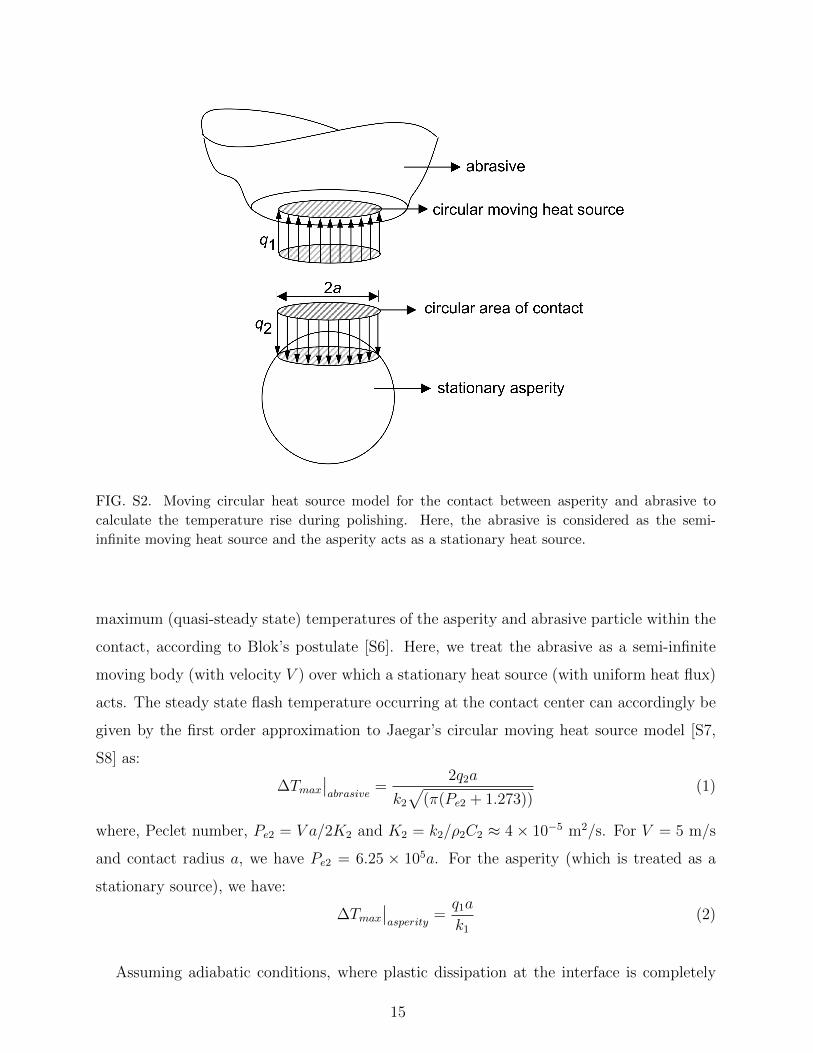
FIG. S2. Moving circular heat source model for the contact between asperity and abrasive to
calculate the temperature rise during polishing. Here, the abrasive is considered as the semi-
infinite moving heat source and the asperity acts as a stationary heat source.
maximum (quasi-steady state) temperatures of the asperity and abrasive particle within the
contact, according to Blok’s postulate [S6]. Here, we treat the abrasive as a semi-infinite
moving body (with velocity V ) over which a stationary heat source (with uniform heat flux)
acts. The steady state flash temperature occurring at the contact center can accordingly be
given by the first order approximation to Jaegar’s circular moving heat source model [S7,
S8] as:
∆Tmax
∣∣abrasive
=2q2a
k2
√(π(Pe2 + 1.273))
(1)
where, Peclet number, Pe2 = V a/2K2 and K2 = k2/ρ2C2 ≈ 4× 10⁻⁵ m2/s. For V = 5 m/s
and contact radius a, we have Pe2 = 6.25 × 10⁵a. For the asperity (which is treated as a
stationary source), we have:
∆Tmax
∣∣asperity
=q1a
k1
(2)
Assuming adiabatic conditions, where plastic dissipation at the interface is completely
15
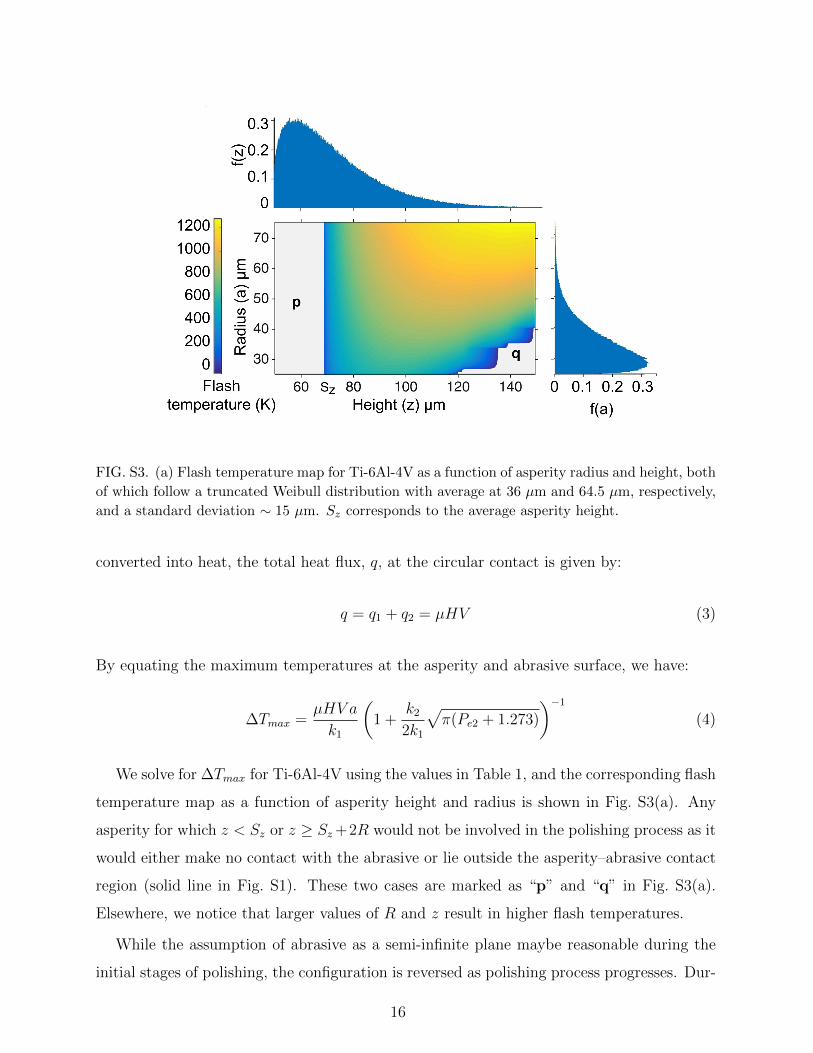
FIG. S3. (a) Flash temperature map for Ti-6Al-4V as a function of asperity radius and height, both
of which follow a truncated Weibull distribution with average at 36 µm and 64.5 µm, respectively,
and a standard deviation ∼ 15 µm. Sz corresponds to the average asperity height.
converted into heat, the total heat flux, q, at the circular contact is given by:
q = q1 + q2 = µHV (3)
By equating the maximum temperatures at the asperity and abrasive surface, we have:
∆Tmax =µHV a
k1
(1 +
k2
2k1
√π(Pe2 + 1.273)
)−1
(4)
We solve for ∆Tmax for Ti-6Al-4V using the values in Table 1, and the corresponding flash
temperature map as a function of asperity height and radius is shown in Fig. S3(a). Any
asperity for which z < Sz or z ≥ Sz +2R would not be involved in the polishing process as it
would either make no contact with the abrasive or lie outside the asperity–abrasive contact
region (solid line in Fig. S1). These two cases are marked as “p” and “q” in Fig. S3(a).
Elsewhere, we notice that larger values of R and z result in higher flash temperatures.
While the assumption of abrasive as a semi-infinite plane maybe reasonable during the
initial stages of polishing, the configuration is reversed as polishing process progresses. Dur-
16
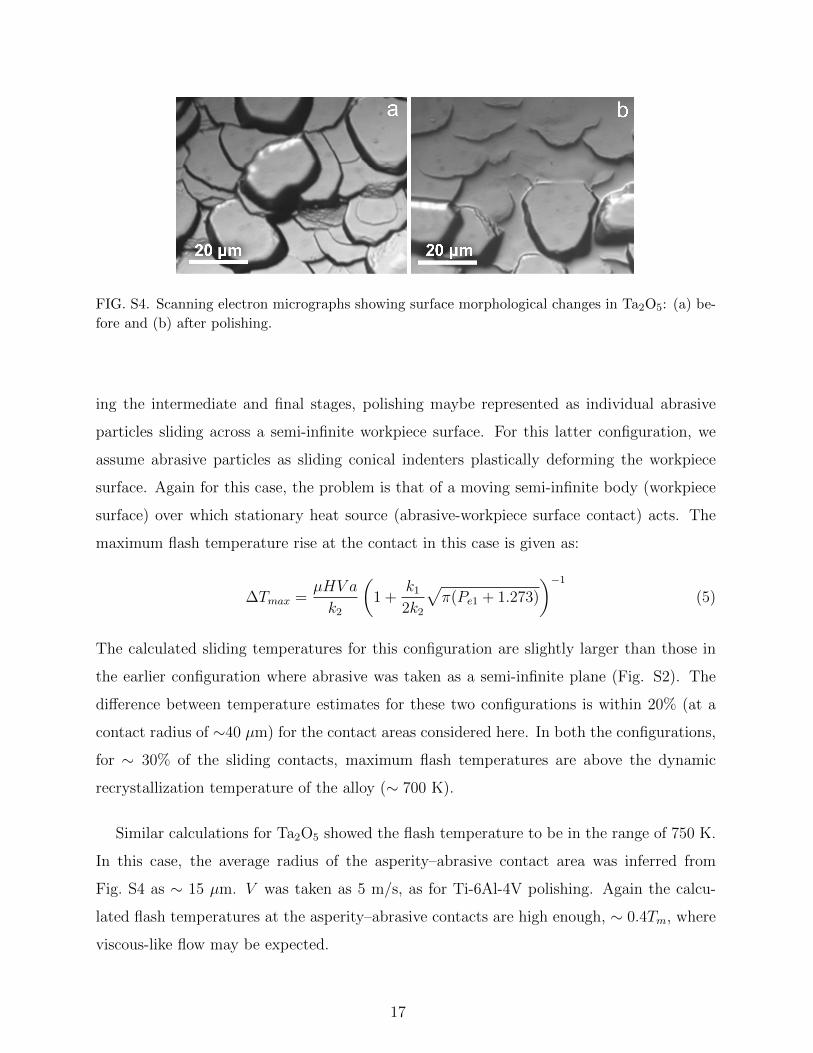
FIG. S4. Scanning electron micrographs showing surface morphological changes in Ta2O5: (a) be-
fore and (b) after polishing.
ing the intermediate and final stages, polishing maybe represented as individual abrasive
particles sliding across a semi-infinite workpiece surface. For this latter configuration, we
assume abrasive particles as sliding conical indenters plastically deforming the workpiece
surface. Again for this case, the problem is that of a moving semi-infinite body (workpiece
surface) over which stationary heat source (abrasive-workpiece surface contact) acts. The
maximum flash temperature rise at the contact in this case is given as:
∆Tmax =µHV a
k2
(1 +
k1
2k2
√π(Pe1 + 1.273)
)−1
(5)
The calculated sliding temperatures for this configuration are slightly larger than those in
the earlier configuration where abrasive was taken as a semi-infinite plane (Fig. S2). The
difference between temperature estimates for these two configurations is within 20% (at a
contact radius of ∼40 µm) for the contact areas considered here. In both the configurations,
for ∼ 30% of the sliding contacts, maximum flash temperatures are above the dynamic
recrystallization temperature of the alloy (∼ 700 K).
Similar calculations for Ta2O5 showed the flash temperature to be in the range of 750 K.
In this case, the average radius of the asperity–abrasive contact area was inferred from
Fig. S4 as ∼ 15 µm. V was taken as 5 m/s, as for Ti-6Al-4V polishing. Again the calcu-
lated flash temperatures at the asperity–abrasive contacts are high enough, ∼ 0.4Tm, where
viscous-like flow may be expected.
17
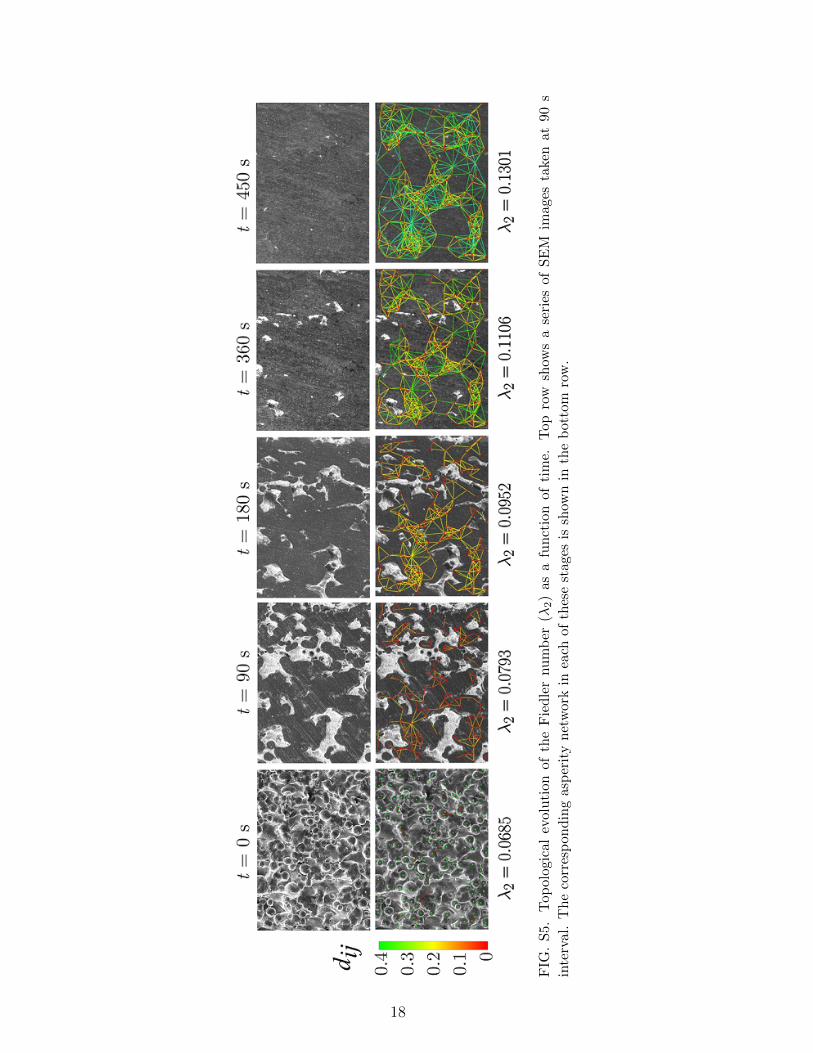
FIG
.S
5.T
op
olog
ical
evolu
tion
ofth
eF
ied
ler
nu
mb
er(λ
2)
asa
fun
ctio
nof
tim
e.T
opro
wsh
ows
ase
ries
ofS
EM
imag
esta
ken
at90
s
inte
rval
.T
he
corr
esp
ond
ing
asp
erit
yn
etw
ork
inea
chof
thes
est
ages
issh
own
inth
eb
otto
mro
w.
18
S3: Graph representation of topological evolution
The process of the merger (connectivity) among the asperities is analyzed as an evolving
random graph G = (V,E) whose nodes (V ) are the asperities, and the edges (E) are given
by the probability, pij, of the existence of a bridge connecting the asperities i, j ∈ V . The
probability of existence of an edge (pij∀i, j ∈ V ) is inversely proportional to the inter-
asperity distance and is calculated using the radial basis function as pij = (1 + exp(||Vi −
Vj||))−1. The radial basis function assigns lower pij to the edges as the physical distance
between connecting node increases. We first determine the normalized Laplacian, L, from
the graph, G as L = D− 12 × L × D− 1
2 where L is the combinatorial Laplacian defined as
L∆= D − S. Here, D is the dianognal matrix representing the degree of each node and is
given as D =(∑N
j=1 p1j
∑Nj=1 p2j ...
∑Nj=1 pNj
), and S being the similarity matrix. It has
been established that the second largest eigenvalue of L captures the algebraic connectivity
in the graph, also called the Fiedler number (λ2) [S9, S10].
The lower bound on λ2 is calculated using the geometric embedding of planar graph on a
unit sphere as presented in [S11], where each of the nodes are represented by non-overlapping
semi-spherical caps of radius ri, i ∈ V . For the micrograph in Fig. S5, |V | = 160. A strongly
connected network of asperities can be assumed as an ideal close packing of uniform spheres
such that each node is connected to at most 6 nearest neighbors. Under such conditions it
can be shown that 0.23 ≤ λ2 ≤ 0.3 holds. The initial value of λ2 = 0.068 (see Fig. S5, bottom
row) indicates that the degree of each node is < 1. After 450 s of polishing, λ2 increases
to 0.130 suggesting a minimum degree of 4 among all neighboring asperities. The network
structure along with the corresponding λ2 values is summarized in Fig. S5. Additionally, the
linear increase in the value of λ2 suggests that there are significant topological changes in
the surface even during the final stages of polishing process which otherwise are not reflected
in the Sa or Sv measurements (see Fig. 5 in the main text).
[S1] G. Welsch, R. Boyer, and E. Collings, Materials Properties Handbook: Titanium Alloys (ASM
International, Materials Park, OH, 1993).
[S2] C. D. Landon, R. H. Wilke, M. T. Brumbach, G. L. Brennecka, M. Blea-Kirby, J. F. Ihlefeld,
M. J. Marinella, and T. E. Beechem, Applied Physics Letters 107, 023108 (2015).
19
[S3] O. Shcherbina, M. Palatnikov, and V. Efremov, Inorganic Materials 48, 433 (2012).
[S4] Q. Liu, H. Luo, L. Wang, and S. Shen, Journal of Physics D: Applied Physics (2016).
[S5] Y. Ahn, S. Chandrasekar, and T. N. Farris, Journal of Tribology 119, 163 (1997).
[S6] H. Blok, in Proceedings of the general discussion on lubrication and lubricants, Vol. 2 (London:
IMechE, 1937) pp. 222-235.
[S7] H. S. Carslaw and J. C. Jaeger, Conduction of Heat in Solids (Clarendon Press, Oxford, 1959).
[S8] X. Tian and F. E. Kennedy, Journal of Tribology 116, 167 (1994).
[S9] F. R. K. Chung, Spectral Graph Theory, Vol. 92 (American Mathematical Society, RI, 1997).
[S10] P. K. Rao, O. F. Beyca, Z. Kong, S. T. Bukkapatnam, K. E. Case, and R. Komanduri, IIE
Transactions 47, 1088 (2015).
[S11] D. A. Spielman and S. H. Teng, Linear Algebra and its Applications 421, 284 (2007).
20