asia pacific energy research centre coal report 2019 ...mddb.apec.org › documents › 2019 › ewg...
TRANSCRIPT

___________________________________________________________________________
2019/EWG58/020 Agenda Item: 9c
Asia Pacific Energy Research Centre Coal Report 2019 - Presentation
Purpose: Information
Submitted by: APERC
58th Energy Working Group Meeting Antofagasta, Chile
16-17 October 2019

9.c. APERC Coal Report 2019
The 58th Meeting of APEC Energy Working Group (EWG)
Antofagasta, Chile; 16-17 October 2019
Juan Ignacio ALARCÓN, Researcher

The “Outline” slide is optional.
They are recommended for long presentations,
but not for the shorter ones.
About the report
• The coal report comprises the second edition of APERC’s fossil fuel reports
• Presentation structure:
1. Historic trends in the APEC coal market
2. Reducing the use of coal in the power generation sector
3. Coal price
4. Coal demand and supply outlook to 2021
5. Summary of latest policies and market trends related to coal in APEC

This section title has been placed to
make it easier for you to navigate the
standard slide
keep it or delete it for the actual
presentation.
1. Historic trends in the APEC coal market
3

The “Outline” slide is optional.
They are recommended for long presentations,
but not for the shorter ones.
Source: IEA, 2016 4
Six of the world’s top ten net exporters and importers are APEC economies
Global coal demand declined 2% during 2015-16. With declining demand, globalcoal production faced a decline of 5% from 2015-16.
Net coal exportersin APEC in 2016:• Australia• Indonesia• Russia• USA• Canada• China
Net coal importersin APEC in 2016:• China• Japan• Korea• Chinese Taipei• Malaysia• Thailand

The “Outline” slide is optional.
They are recommended for long presentations,
but not for the shorter ones.
Source: APERC 7th Outlook, 2019 5
APEC had a 75% share of global coal demand in 2016
APEC and global coal consumption, 2005-2016
0%
10%
20%
30%
40%
50%
60%
70%
80%
90%
100%
0
500
1000
1500
2000
2500
3000
3500
4000
4500
Mto
e
APEC Rest of the World APEC Share
APEC coal demand increased 26% from 2005 to 2016, largely because of growth inChina and southeast Asian economies

The “Outline” slide is optional.
They are recommended for long presentations,
but not for the shorter ones.
Source: IEA, 2016 6
Coal production increased 24% from 2005–16
• Five economies produced 97% of APEC’s coal production in 2016: China (59%), theUnited States (12%), Australia (10%), Indonesia (8.6%) and Russia (7.2%).
• Nearly 71% of global proved coal reserves are located in APEC economies.• Reserves are expected to last more than 100 years in Australia and Russia, 47
years in China, and 33 years in USA.
0
500
1000
1500
2000
2500
3000
3500
Mto
e
Australia China Indonesia Russia United States Others APEC APEC Coal Demand
Coal production by economy, 2005-16

The “Outline” slide is optional.
They are recommended for long presentations,
but not for the shorter ones.
Source: IEA, 2016 7
Coal in power sector increased 34% in 2005-16
• The trend varies among economies, e.g. coal generation dropped 37% in the US.• The share of coal in the power mix in APEC has remained stable between 48% -
50%.
0%
10%
20%
30%
40%
50%
60%
70%
80%
90%
100%
0
2000
4000
6000
8000
10000
12000
14000
16000
18000
TW
h
Coal Oil Gas Nuclear Renewables Other Coal
Power mix in APEC and coal share, 2005-16

This section title has been placed to
make it easier for you to navigate the
standard slide
keep it or delete it for the actual
presentation.
2. Reducing the use of coal in the power generation sector

The “Outline” slide is optional.
They are recommended for long presentations,
but not for the shorter ones.
9
Challenges for coal in the power sector
Coal-fired plants faced several challenges in the last decade.• Low natural gas prices• Declining electricity demand• Policies aimed at decreasing emissions
These are some of the challenges that the industry is facing. Four major economieshave retired coal-fired plants, either through policy goals or market operation.Some of the other economies plan to phase out coal plants after 2021.
Source: APERC 7th Outlook, 2019

The “Outline” slide is optional.
They are recommended for long presentations,
but not for the shorter ones.
10
Notable coal-related developments in the power sector
Australia
• Coal-fired generation rose by 7% in 2015–16. The rise was most apparent forblack coal generation in Queensland and New South Wales. However, this risemay be temporary, with significant coal-fired capacity being retired from themarket in 2016 and 2017.
• In 2017, coal generation plants are being retired and not being replaced,removing more than 3 600 megawatts (equivalent to half of South Australia’sgeneration capacity) and leaving a tighter supply-demand balance.
Source: AER, 2017

The “Outline” slide is optional.
They are recommended for long presentations,
but not for the shorter ones.
11
Notable coal-related developments in the power sector
Canada• In 2015, Alberta announced a new policy to accelerate the phase out of coal-fired
power generation. This would result in the retirement of six coal plants or theirconversion to natural gas plants by 2030.
• In 2016, the federal government also announced a plan to accelerate the phase-out of coal generation by 2030.
• The Alberta Electricity System Operator (AESO) recommended a capacity marketto provide greater revenue certainty for generators, to encourage investment innew generation capacity while maintaining the competitive market structureused to set wholesale prices.
Source: Alberta Energy, 2015; GOC, 2017; AESO, 2018

The “Outline” slide is optional.
They are recommended for long presentations,
but not for the shorter ones.
12
Notable coal-related developments in the power sector
China• China’s 13th FYP (2016-2020) established goals to ensure a cleaner and more
efficient use of coal. China’s plan is to optimise the development of nationalcomprehensive energy centres and step up efforts to ensure the cleaner andmore efficient use of coal.
• China plans to implement an upgraded action plan for energy conservation andemissions reduction in coal-based power generation including:o upgrades to ensure average coal consumption per kilowatt-hour is kept
below 300-310 grams;o using backpressure thermal power units for heating and develop combined
multi-source heating, cooling, and power systems;o increase the proportion of coal used for power generation.
Source: Official 13th Five-Year Plan, 2016

The “Outline” slide is optional.
They are recommended for long presentations,
but not for the shorter ones.
13
Notable coal-related developments in the power sector
United States• Coal-fired plants faced several challenges, which drove capacity retirements.
• The drop in natural gas prices made gas competitive, surpassing coal for the firsttime in 2016.
• Coal-fired power plants are subject to the Mercury and Air Toxics Standards(MATS), which require significant reductions in emissions of mercury, acid gases,and toxic metals. Between January 2015 and April 2016, about 87 GW of coal-fired plants installed mercury controls to meet compliance deadlines and nearly20 GW of coal-fired capacity was retired for not meeting the standards.
Source: EIA, 2017

This section title has been placed to
make it easier for you to navigate the
standard slide
keep it or delete it for the actual
presentation.
3. Coal price
The “Outline” slide is optional.
They are recommended for long presentations,
but not for the shorter ones.
15
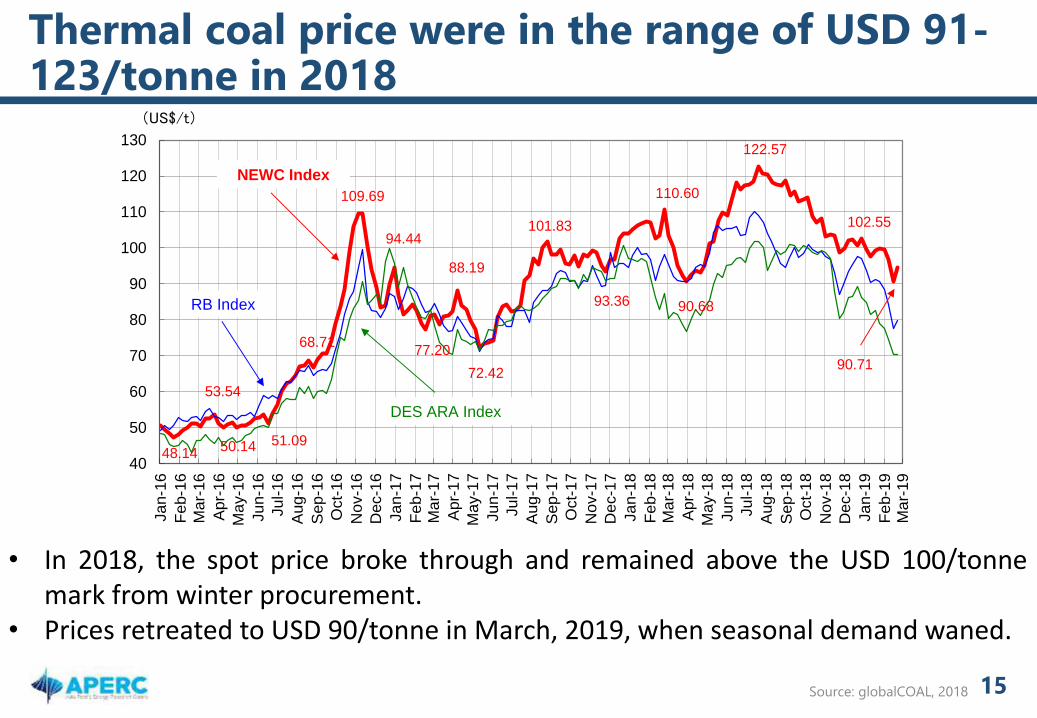
Thermal coal price were in the range of USD 91-123/tonne in 2018
• In 2018, the spot price broke through and remained above the USD 100/tonnemark from winter procurement.
• Prices retreated to USD 90/tonne in March, 2019, when seasonal demand waned.
40
50
60
70
80
90
100
110
120
130
Ja
n-1
6
Fe
b-1
6
Ma
r-16
Apr-
16
Ma
y-1
6
Ju
n-1
6
Ju
l-1
6
Aug
-16
Sep
-16
Oct-
16
Nov-1
6
Dec-1
6
Ja
n-1
7
Fe
b-1
7M
ar-
17
Apr-
17
Ma
y-1
7
Ju
n-1
7
Ju
l-1
7
Aug
-17
Sep
-17
Oct-
17
Nov-1
7
Dec-1
7
Ja
n-1
8
Fe
b-1
8M
ar-
18
Apr-
18
Ma
y-1
8
Ju
n-1
8
Ju
l-1
8
Aug
-18
Sep
-18
Oct-
18
Nov-1
8
Dec-1
8
Ja
n-1
9
Fe
b-1
9M
ar-
19
(US$/t)
NEWC Index
RB Index
DES ARA Index
53.54
50.14 51.09
68.71
94.44
72.42
48.14
109.69
88.19
77.20
101.83
93.36 90.68
110.60
122.57
90.71
102.55
Source: globalCOAL, 2018

The “Outline” slide is optional.
They are recommended for long presentations,
but not for the shorter ones.
16
Australian premium hard coking spot prices were in the range of USD 259-229/tonne in 2018
• Metallurgical coal prices have been growing recently but are projected todecrease until supply and demand reach a balanced level.
• After that, the price is expected to level off or increase gradually.
50
100
150
200
250
300
350
Ja
n-1
6
Fe
b-1
6
Ma
r-16
Apr-
16
Ma
y-1
6
Ju
n-1
6
Ju
l-1
6
Aug
-16
Sep
-16
Oct-
16
Nov-1
6
Dec-1
6
Ja
n-1
7
Fe
b-1
7
Ma
r-17
Apr-
17
Ma
y-1
7
Ju
n-1
7
Ju
l-1
7
Aug
-17
Sep
-17
Oct-
17
Nov-1
7
Dec-1
7
Ja
n-1
8
Fe
b-1
8
Ma
r-18
Apr-
18
Ma
y-1
8
Ju
n-1
8
Ju
l-1
8
Aug
-18
Sep
-18
Oct-
18
Nov-1
8
Dec-1
8
Ja
n-1
9
Fe
b-1
9
Ma
r-19
(US$/t)
311.25290.00
150.00
210.00
76.10
100.10
86.50
139.75
153.75
259.35
210.60
178.00173.65
201.40
230.80
172.55
228.95
191.80
210.05
Source: IHS, 2018

This section title has been placed to
make it easier for you to navigate the
standard slide
keep it or delete it for the actual
presentation.
4. Coal demand and supply outlook to 2021

The “Outline” slide is optional.
They are recommended for long presentations,
but not for the shorter ones.
18
Coal consumption in the electric power sector is expected to decline slightly by 2021
Other Americas and the USA will lead the reduction of coal in the power sector, witha decrease of 11%.
Historic and projected coal consumption in the power sector in APEC, 2011-2021
0
200
400
600
800
1000
1200
1400
1600
1800
2000
Mto
e
China Russia United States APEC-South-east Asia APEC-North-east Asia APEC-Other Americas APEC-Oceania
APERC Projection
Source: APERC 7th Outlook, 2019

The “Outline” slide is optional.
They are recommended for long presentations,
but not for the shorter ones.
19
Coal supply in APEC declines 4% in 2016-21
However, supply grows 4% in south-east Asia from 122 Mtoe in 2016 to 143 Mtoe in2021.
0
500
1000
1500
2000
2500
3000
3500
Mto
e
China Russia United States APEC South-east Asia APEC North-east Asia APEC Other Americas APEC Oceania
APERC Projection
Historic and projected coal supply in APEC, 2011-2021
Source: APERC 7th Outlook, 2019

This section title has been placed to
make it easier for you to navigate the
standard slide
keep it or delete it for the actual
presentation.
5. Summary of latest policies and market trends related to coal in APEC

Canada
▪ The government plans to phase out coal-fired generation sources. Coal-fired
power production will be phased out by 2030. Demand is expected to decrease,
and be replaced by natural gas. Coal will continue to be used for metallurgical
processes.
Chile
▪ In June 2019, the government presented an important agreement by the
Ministry of Energy with the power industry. The agreement announced the
shutdown of eight coal-fired power plants in five years and a goal of total
withdrawal by 2040.
Korea
▪ Its energy policy aims to gradually decrease the number of nuclear and coal
plants to have a clean and safe portfolio of energy.
21
Notable policies and market trends in APEC
Source: AESP. 2018; MinEnergia Chile 2019; IEEFA, 2019
