asian clearing union annual report 2008 - acu-home annual... · asian clearing union annual report...
TRANSCRIPT
Asian Clearing Union
ANNUAL REPORT 2008
Submitted to:The 38th Meeting of the ACU Board of Directors
held at Central Bank of Sri LankaColombo, Sri LankaJune 16-17, 2009
ACU
1974

II
ANNUAL REPORT 2008
Board of Directors at the 37th ACU Meeting
June 17-18, 2008Nay Pyi Taw, Myanmar
Board of Directors at the 37th ACU Meeting

III
ANNUAL REPORT 2008
Participants at the 37th Meeting of the ACU Board of Directors
June 17-18, 2008Nay Pyi Taw, Myanmar
Participants at the 37th Meeting

IV
ANNUAL REPORT 2008
Board of Directors
Salehuddin AhmedGovernor,
Bangladesh Bank
Daw TenzinGovernor,
Royal Monetary
Authority of Bhutan
D. Subbarao*Governor,
Reserve Bank of India
* From 05.09.2008
Mahmoud Bahmani*Governor,
Central Bank of I.R. of Iran
* From 13.10.2008
Than NyeinGovernor,
Central Bank of Myanmar
Krishna Bahadur ManandharActing Governor,
Nepal Rastra Bank
Shamshad AkhtarGovernor,
State Bank of Pakistan
Ajith Nivard CabraalGovernor,
Central Bank of Sri Lanka
Board of Directors

V
ANNUAL REPORT 2008
Alternate Directors
Ziaul Hasan SiddiquiDeputy Governor,
Bangladesh Bank
Dechen TsheringDeputy Managing
Director,
Royal Monetary
Authority of Bhutan
Meena HemchandraChief General
Manager,
Reserve Bank of India
Reza RaeiVice Governor,
Central Bank of I.R. of Iran
Maung Maung WinDeputy Governor,
Central Bank of Myanmar
Ram Jee RegmiExecutive Director,
Foreign Exchange
Management Dept.,
Nepal Rastra Bank
Yaseen AnwarDeputy Governor,
Corporate Services,
State Bank of Pakistan
J P Mampitiya*Director,
Payments &
Settlements Dept.,
Central Bank of Sri Lanka
* From 18.08.2008
Alternate Directors

VI
ANNUAL REPORT 2008
Offi cers-in-Charge
Md. Belayet HossainGeneral Manager,
Forex Reserve and
Treasury Management
Dept.,
Bangladesh Bank
P. K. Nayak*Deputy General
Manager, DEIO
Reserve Bank of India
* From 29.12.2008
Rinzin LhamuHead Banking Division,
Royal Monetary
Authority of Bhutan
Reza NadaliDirector,
International Dept.,
Central Bank of I.R. of Iran
Maung MaungDirector,
Accounts Dept.,
Central Bank of Myanmar
Shashi Dhar AryalAssistant Director,
Foreign Exchange
Management Dept.,
Nepal Rastra Bank
Muhammad Habib KhanDirector,
Finance Dept.,
State Bank of Pakistan
R. B. Weerasinghe*Deputy Director,
Payments and
Settlements Dept.,
Central Bank of Sri Lanka
* From 02.09.2008
Offi cers-in-Charge

VII
ANNUAL REPORT 2008
Contents
Administrative Organization, 2008................................................................................. 1
Board of Directors, 2008................................................................................................ 2
Offi cers-in-Charge, 2008 ............................................................................................... 3
Letter of Transmittal to the Board of Directors ............................................................... 4
Global Economic Prospects and Challenges ................................................................ 5
Economic Highlights of ACU Member Countries ......................................................... 15
Country Performance .................................................................................................. 26
Bangladesh.................................................................................................................. 26
Bhutan ......................................................................................................................... 39
India ............................................................................................................................. 46
Iran .............................................................................................................................. 59
Myanmar...................................................................................................................... 75
Nepal ........................................................................................................................... 81
Pakistan ....................................................................................................................... 89
Sri Lanka ................................................................................................................... 105
Auditor’s Report .......................................................................................................... 116
ACU Operations ......................................................................................................... 117
Clearing Operations.................................................................................................... 117
Credit Positions .......................................................................................................... 118
Debit Positions............................................................................................................ 118
Net Credit/Debit Positions .......................................................................................... 119
Interest Received/Paid ............................................................................................... 119
Swap Facility .............................................................................................................. 119
Measures and Achievements ..................................................................................... 120
Tables ......................................................................................................................... 122
Acronyms and Abbreviations ...................................................................................... 142
Contents

1
ANNUAL REPORT 2008
Asian Clearing Union
Administrative Organization, 2008
Mr. Than NyeinChairman of the Board,Governor,Central Bank of Myanmar
Mrs. Lida Borhan-AzadSecretary General
Secretariat Offi ceAddress: No. 207/1, Pasdaran Ave., P.O. Box 15875/7177Tehran, Islamic Republic of IranPhone: (+98 21) 22842076, 22854509Fax: (+98 21) 22847677Telex: (088 21) 3120, 6868Swift: BMJIIRTHACUE-mail: [email protected]: www.asianclearingunion.org
Agent BankCentral Bank of Islamic Republic of Iran
Administrative Organization, 2008

2
ANNUAL REPORT 2008
Asian Clearing Union
Board of Directors, 2008Bangladesh Bank Dr. Salehuddin Ahmed Governor, (Director) Mr. Ziaul Hasan Siddiqui Deputy Governor, (Alternate)
Royal Monetary Authority of Bhutan Mr. Daw Tenzin Governor, (Director) Mr. Dechen Tshering Deputy Managing Director, (Alternate)
Reserve Bank of India D. Subbarao* Governor, (Director) * From 05.09.2008
Mrs. Meena Hemchandra Chief General Manager, (Alternate)
Central Bank of Islamic Republic of Iran Dr. Mahmoud Bahmani* Governor, (Director) * From 13.10.2008
Dr. Reza Raei Vice Governor, (Alternate)
Central Bank of Myanmar Mr. Than Nyein Governor, (Director) Mr. Maung Maung Win Deputy Governor, (Alternate)
Nepal Rastra Bank Mr. Krishna Bahadur Manandhar Acting Governor, (Director) Mr. Ram Jee Regmi Executive Director, (Alternate)
State Bank of Pakistan Dr. Shamshad Akhtar Governor, (Director) Mr. Yaseen Anwar Deputy Governor, (Alternate)
Central Bank of Sri Lanka Mr. Ajith Nivard Cabraal Governor, (Director) Mrs. J P Mampitiya* Director, Payments and Settlements Dept., (Alternate) * From 18.08.2008
Board of Directors, 2008

3
ANNUAL REPORT 2008
Asian Clearing Union
Offi cers-in-Charge, 2008Bangladesh Bank Mr. Md. Belayet Hossain General Manager, Forex Reserve and Treasury Management Dept.
Royal Monetary Authority of Bhutan Mrs. Rinzin Lhamu Head Banking Division
Reserve Bank of India Mr. P. K. Nayak* Deputy General Manager, DEIO * From 29.12.2008
Central Bank of Islamic Republic of Iran Mr. Reza Nadali Director, International Dept.
Central Bank of Myanmar Mr. Maung Maung Director, Accounts Dept.
Nepal Rastra Bank Mr. Shashi Dhar Aryal Assistant Director, Foreign Exchange Management Dept.
State Bank of Pakistan Mr. Muhammad Habib Khan Director, Finance Dept.
Central Bank of Sri Lanka Mrs. R. B. Weerasinghe* Deputy Director, Payments and Settlements Dept. * From 02.09.2008
Offi cers-in-Charge, 2008

4
ANNUAL REPORT 2008
Letter of Transmittal to the Board of Directors
Letter of Transmittal to the Board of Directors
June 16, 2009
The Honorable Ajith Nivard CabraalChairman of the Board,Governor,Central Bank of Sri Lanka,Colombo, Sri Lanka
Dear Mr. Chairman,
I have the honor to present to the Board of Directors, the Annual Report of the Asian Clearing Union (ACU) for the year 2008, duly signed by me, in accordance withChapter III, Article VIII, Section 3(c) of the Agreement Establishing the Asian Clearing Union.
Yours sincerely,
Lida Borhan-Azad Secretary General, ACU
5Global Economic Prospects and Challenges
ANNUAL REPORT 2008
Global Economic Prospects and Challenges1
An overviewThe global economy experienced 3.2 percent growth in 2008; however it is projected to decline by 1.3 percent in 2009 which depicts a sever recession. The trend is expected to recover moderately in 2010, by 1.9 percent growth. The fi nancial crisis and economic slowdown has adversely affected the global economy.
The advanced economies experienced an unprecedented decline in real gross domestic product (GDP) in 2008, and output is anticipated to fall remarkably over the fi rst quarter of 2009. The United States (US) has severely been affected by fi nancial pressures and the continued slump in the housing market. In the Euro area, growth fell to 0.9 percent in 2008. Japan’s economy declined over the year as output growth dropped sharply by 0.6 percent. The output growth in emerging and developing economies fell to 6.1 percent in 2008 mainly due to trade and fi nancial stress. Western Europe and advanced Asia too have suffered from intensifi ed fi nancial strains and the slowdown in global trade.
In tandem with the rapid falling of global activity, infl ation pressures have become less strong. Commodity prices declined, adversely affecting income of the Middle Eastern and Commonwealth of Independent States (CIS) economies, as well as many other commodity exporters in Latin America and Africa. Consequently, in the advanced economies, 12-month headline infl ation declined below 1.0 percent in February 2009, while core infl ation remained around 1.5-2.0 percent, with the exception of Japan. Infl ation in some emerging economies has experienced a moderate pace.
Although efforts have been taken to stabilize fi nancial markets and contain the downturn in output, confi dence in fi nancial markets is still low which dampens the prospects for an early economic recovery.
Total expected write-downs on global exposures are projected around USD 4.0 trillion, of which two-thirds will fall on banks. In advanced economies, banks
1 This summary report is based on World Economic Outlook (WEO-April 2009), International Monetary Fund.

6 Global Economic Prospects and Challenges
ANNUAL REPORT 2008
face with funding strains due to limited access to credit. Many non-fi nancial corporations are unable to obtain working capital, and some have diffi culty to raise longer-term debt.
The issuance of new securities have almost stopped, bond spreads have increased, equity prices have declined, and exchange markets have come under sever pressure. There is a tendency for risk aversion and desire to move funds to mature markets with the increasing provision of guarantees.
The fi nancial crisis has had an impact on the world’s major currencies. Since September 2008, the US dollar, euro, and yen have all strengthened in real effective terms. The Chinese renminbi and currencies pegged to the US dollar (including those in the Middle East) have also appreciated. Most other emerging economy currencies have weakened remarkably, despite the use of international reserves.
Global Prospects and ChallengesThe stabilization of fi nancial market is expected to take longer than previously projected, even with hard efforts taken by policymakers. Therefore, fi nancial pressures in the mature markets are anticipated to continue until well into
2010. However, fi nancial sector will improve slowly due to clarity on bad assets, injections of public capital, lower counterparty risks and market volatility, and restore more liquid market conditions.
In the advanced economies, credit to the private sector is projected to fall in both 2009 and 2010. The emerging and developing economies are anticipated to have limited access to external fi nancing in both years.
From the point of macro-economic policy support, interest rates are projected to decline or remain near the zero bound in the major advanced economies, while central banks continue to explore ways to ease credit conditions. In both advanced and emerging economies, fi scal defi cits are expected to increase severely, as governments implement fi scal stimulus plans in G20 countries amounting to 2.0 percent of GDP in 2009 and 1.5 percent of GDP in 2010. It is expected that commodity prices move around current levels in 2009 and increase moderately in 2010. In spite of policy actions, and anticipating a moderate recovery from the second quarter onward, global activity is expected to fall by 1.3 percent in 2009. This would show by far the deepest post-World War II recession.
Furthermore, the economic slowdown is global, as output per capita is expected

7Global Economic Prospects and Challenges
ANNUAL REPORT 2008
to fall in most countries, and growth in almost all countries has declined remarkably from rates seen in 2003-07.
Overall, the current outlook is uncertain, and downside risks pertinent to insuffi cient policy action, limited public support for policy action, rising corporate and household defaults, greater losses across fi nancial balance sheets, and new systemic events that complicate the task of restoring credibility have raised concerns.
Even once the crisis is over; there will be a diffi cult transition period, with output growth noticeably below rates observed in the recent past.
Regional Economic OutlookThe United States and Canada
The fi nancial crisis has made the US to face with a severe recession. Despite the Federal Reserve’s (Fed) policy actions, credit is costly or diffi cult to access for many households and fi rms. Furthermore, households are being suffered by remarkable losses and increased uncertainty about job security which all made the slump in consumer confi dence. These, in turn, have reduced consumption; the household saving rate has escalated, to over 4.0 percent in
February 2009.
Although fi nancial markets have stabilized slightly, but they remain under sever pressure. In inter-bank markets, spreads continue to exceed normal levels.
Equity markets are 40.0 percent lower than their peaks, as economic outlooks have deteriorated and fi nancial stocks have been hit by large losses and uncertainty about solvency.
The US dollar has strengthened remarkably which refl ects tendency toward government bonds as other economies have become more deeply involved in the crisis.
Real GDP reduced by 6.3 percent in the fourth quarter of 2008, and it is estimated to fall further in the fi rst quarter of 2009.
Employment has continued its downward trend as 5.1 million jobs have been lost since December 2007, causing the unemployment rate to reach 8.5 percent in March. Fed eased monetary policy by cutting policy rates to around zero, however credit market deteriorations are weakening the effectiveness of rate cuts.
The GDP is now estimated to decline by 2.8 percent in 2009. The economy is anticipated to start recovering by the middle of 2010. The growth in 2010 is

8 Global Economic Prospects and Challenges
ANNUAL REPORT 2008
projected to be zero percent.
In 2008, infl ation increased to 3.8 percent, but it is expected to decline sharply in 2009.
Tax rebates caused consumption to rise slightly in the middle of 2008, but their effects have now disappeared. A much larger discretionary stimulus package combines further tax relief with federal assistance to states, which is anticipated to provide a 2.0 percent of GDP stimulus in 2009 and 1.8 percent in 2010. The federal budget defi cit is expected to be about 10.0 percent of GDP in 2010.
In 2008, current account defi cit declined to 4.7 percent of GDP, but further decline is anticipated in the next year.
The Canadian economy has also contracted in 2008, growing by only 0.5 percent compared to 2.7 percent a year ago. The real GDP is expected to drop sharply in 2009. Consumer prices grew by 2.4 percent in 2008, but it is projected to decline next year. Unemployment is estimated to continue its upward trend in 2009, reaching to 8.4 percent. Current account surplus dropped to 0.6 percent of GDP in 2008.
Europe
In most of advanced Europe, economic activity had declined before September 2008 due to increasing oil prices.
Financial systems deteriorated, policy actions were slow to react, confi dence, and global trade fell sharply.
The real economy contracted in 2008, owing to deterioration in funding markets. Financial policies were implemented, but insuffi cient to reinforce their cross-country effectiveness.
Equity prices declined severely, and business investment has been reduced. Furthermore, residential investment has declined in countries with housing booms such as Ireland, Spain, and the United Kingdom (UK). Despite the large fall in oil prices, consumption decreased toward the end of 2008.
Unemployment rates in the advanced economies are expected to exceed 10.0 percent in late 2009 and escalate further in 2010.
In 2008, the growth of real GDP dropped to 0.9 and 0.7 percent in euro area economies and the UK, respectively. The growth is expected to fall by more than 4.0 percent in 2009. The recession is anticipated to be deep in Ireland, Iceland, and the UK. Economic activity has also fallen drastically in many emerging European countries, owing to their heavy reliance on various capital infl ows. With deteriorated Western export markets and increased risk-aversion attitude during fall 2008, the outlook for local exports, growth, and

9Global Economic Prospects and Challenges
ANNUAL REPORT 2008
government revenues worsened severely, causing sovereign spreads to climb from 50.0-100.0 basis points (bps) to 150.0-900.0 bps. As a result, output growth in the emerging economies is expected to decline by about 3.7 percent in 2009 and recover to 0.8 percent in 2010.
Infl ation pressures are declining fast, and risks for sustained defl ation are rising in advanced economies due to the fall in oil prices and demand. In 2010, infl ation is forecast to be between 0.5 and 1.5 percent in most advanced economies. Monetary policy has been eased. The Bank of England has cut policy rates successively from 5.7 percent in 2007 to 0.5 percent in 2009. The European Central Bank (ECB) to respond to infl ation pressure raised rates in July 2008 to 4.2 percent but then lowered rates on its main refi nancing operations to 1.2 percent.
In emerging Europe, infl ation rates are also expected to fall remarkably, from 8.0 percent in 2008 to 4.2 percent in 2010. Exchange rates have depreciated in emerging economies with fl oating currencies.
The UK defi cit is expected to reach 11.0 percent of GDP in 2010.
Asia
Since September 2008, the crisis has drastically affected economies in
Asia. Japan’s economy declined at a 12.0 percent (annualized) rate in the fourth quarter. The newly industrialized economies including Hong Kong SAR, Korea, Singapore, and Taiwan Province of China contracted at rates between 10.0 to 25.0 percent, and south-east Asian emerging economies have also been hit dramatically. These falls were mainly due to the slump in demand for consumer durable goods and capital goods in (non-Asian) advanced economies and the global fi nancial crisis. China and India have been affected by deterioration in the export sector, but their economies have continued to grow, owing to smaller share of trade in their economy and policy actions.
Exports and industrial production have fallen quickly.
Equity and bond prices have dropped, sovereign and corporate spreads have escalated, and inter-bank spreads have increased. Currencies have depreciated in most of the region’s emerging economies (except the yen). The renminbi has remained unchanged relative to the US dollar.
Emerging Asia is expected to continue to grow, led by China and India. Despite contraction in exports, the current account surplus for Asia is forecast to remain unchanged at about 4.7 percent of GDP. Real GDP is expected to fall by
10 Global Economic Prospects and Challenges
ANNUAL REPORT 2008
about 6.0 percent in 2009. The output growth in Japan is estimated to decline by 6.2 percent in 2009. A mild defl ation is projected to persist during 2009 and 2010.
The output growth in China is expected to fall to about 6.5 percent in 2009 compared to 13.0 percent in 2007.
Association of Southeast Asian Nations (ASEAN) economies are being severely damaged by the effects of lower global demand and harder credit conditions. For ASEAN, the output growth is projected to decrease from 6.3 percent in 2007 to zero percent in 2009.
The growth in India is projected to drop severely from 9.3 percent in 2007 to 4.5 percent in 2009. This fall is mainly due to lower investment, refl ecting fi nancing constraints and a turn in the domestic credit cycle.
In Japan, the central bank has reduced rates to almost zero. In China, the central bank has cut interest rates and reserve requirements and loosened credit ceilings. In India, the policy rate and reserve requirements have been reduced. Other central banks in the region (in Cambodia, Korea, Malaysia, the Philippines, Singapore, and Thailand) have also reduced policy rates or decreased reserve requirements.
In Japan, the defi cit is expected to be
around 10.0 percent of GDP in 2009 and net debt to exceed 100.0 percent of GDP.
Latin America and the Caribbean (LAC)
As a result of the global fi nancial strains, LAC suffered from increasing borrowing costs and declining capital infl ows. The slump in commodity prices is hitting large economies in the region (Argentina, Brazil, Chile, Mexico, and Venezuela) which are among the world’s major exporters of primary products. In addition, the economic slowdown in advanced economies-particularly the US, the region’s largest trading partner-is reducing external demand and lowering revenues from exports, tourism, and remittances.
The global fi nancial crisis spread quickly to LAC markets after the middle of September 2008. Local equity markets have been damaged severely, with the largest losses (about 25.0 percent) in Argentina.
Domestic currencies have depreciated, particularly in Brazil and Mexico, which are large commodity-exporting countries with fl exible exchange rate regimes.
Financial markets have differentiated between borrowers, as the fi nancing cost has climbed for some countries (for example, Argentina, Ecuador, and Venezuela) but remains relatively low

11Global Economic Prospects and Challenges
ANNUAL REPORT 2008
for other countries with sound positions and larger policy buffers including Brazil, Chile, Colombia, Mexico, and Peru.
Real GDP is projected to fall by 1.5 percent in 2009. Domestic demand would decline by about 2.2 percent in 2009.
For the region, infl ation is expected to fall from 8.0 percent in 2008 to about 6.5 percent in 2009.
The region’s current account defi cit is forecast to increase to slightly more than 2.0 percent in 2009, owing to negative terms-of-trade effects.
Africa
Relatively mild fi nancial connections with advanced economies have not been a buffer for African economies against the global fi nancial crisis. The contraction of external growth, which is declining demand for African exports and reducing workers’ remittances, drastically hit the continent. The sever slump in commodity prices is also buffeting the resource-rich countries in the region. In addition, the global credit constraints is limiting foreign direct investment (FDI) and reversing portfolio fl ows, especially to emerging and frontier markets (Ghana, Kenya, Nigeria, South Africa, and Tunisia). These deteriorations led to a sharp fall in economic activity. For the region, the growth of output is estimated to drop from 5.2 in 2008 to 2.0 percent in 2009. The slowdown has
greatest impact on oil-exporting countries (Angola, and Equatorial Guinea), as well as on emerging and frontier markets (Botswana, Mauritius, and South Africa).
The economic downturn and the fall in food and fuel prices will curtail infl ation pressures. For the region, infl ation is expected to decline slowly from 10.1 percent in 2008 to 9.0 percent in 2009.
Fiscal and external balances are forecast to worsen remarkably. The overall fi scal position of the region is expected to fall by about 5.7 percent, to a defi cit of 4.5 percent of GDP in 2009.
For the region, the current account balance is also expected to deteriorate, from a surplus of 1.0 percent of GDP in 2008 to a defi cit of 6.5 percent of GDP in the following year. The fi nancing of external defi cits is forecast to remain diffi cult in some of emerging and frontier markets (Ghana, Nigeria, South Africa, and Tanzania), owing to the global credit constraints.
The South African Reserve Bank has reduced its policy rates by a cumulative 200.0 bps since early December.
Middle East
The global fi nancial crisis has affected the Middle East. The substantial slump in the oil price is damaging the region severely. The Middle Eastern countries

12 Global Economic Prospects and Challenges
ANNUAL REPORT 2008
are being affected adversely by the tight external fi nancing conditions and reversal of capital infl ows, refl ecting intense pressure on local property and equity markets. The domestic liquidity conditions have worsened, credit spreads have climbed for a number of fi rms, fi nancial system distresses have emerged in some countries, and sovereign wealth funds have faced with losses from external investments. Moreover, the sharp fall in external demand is reducing export growth, workers’ remittances, and tourism revenues particularly in Egypt, Jordan, and Lebanon.
Despite expansionary policies set to reduce the adverse effect of global fi nancial crisis, the economic activity is projected to deteriorate. The growth of output in the region is forecast to fall from 5.9 percent in 2008 to 2.5 percent a year later. The downturn is projected to be the same for oil and non-oil producing countries, even though the effective factors are quite different. The most sever turndown is anticipated in the United Arab Emirates (UAE). This fall is due to the exit of external funds; refl ecting a substantial decline in liquidity, property and equity prices; and intense pressure in the banking system. In contrast, Qatar is expected to grow by 18.0 percent in 2009 compared to 16.5 percent in the previous year. This growth is forecast to be as a result of substantial increase
in production of natural gas. Lebanon is also expected to experience the sharp slowdown because of external liquidity constraints and the slump in remittances.
Infl ation pressures in the region are estimated to decline sharply due to fall in commodity prices, rents, and economic activity (15.6 percent in 2008 compared to 11.0 percent in the following year).
For the region, the current account balance is forecast to experience a mild defi cit of about 0.6 percent of GDP in 2009.
Fiscal balances in oil-producing countries worsen dramatically due mainly to the slump in revenue.
In the region, central banks have taken sound policy actions such as injecting liquidity and reducing policy rates. In this regard, countries with pegged exchange rate regimes (Bahrain, Kuwait, Libya, Oman, Qatar, Saudi Arabia, Syrian Arab Republic, and UAE) have benefi ted from the expansionary monetary policy in the US.
The fi nancial sector is under pressure throughout the region, as credit exposure of banks elevates due to deterioration of property and stock markets and external liquidity constraints.
13Global Economic Prospects and Challenges
ANNUAL REPORT 2008
Commonwealth of Independent States
In comparison to the other regions of the global economy, the CIS countries are expected to face with the highest deterioration in economic activity in the near future. The effective factors behind the slowdown include diffi cult access to external funding, lower external demand, and the severe drop in commodity prices. In addition, households began to substitute domestic-currency-denominated assets with foreign-currency-denominated assets. Russia, Kazakhstan, Belarus, and Ukraine were severely damaged, with the fi rst two countries reducing foreign currency reserves markedly to lessen the impact of the shock on the exchange rate.
The growth prospects for the commodity exporters (Russia, Kazakhstan, Ukraine, and Turkmenistan) deteriorated. For the area, the current account balance is forecast to be about 0.1 percent of GDP in 2009 compared to 5.0 percent of GDP a year ago. The current account surpluses of energy exporter economies are expected to hit substantially, owing to the slump in commodity prices. However,
for energy importers, external defi cits are forecast to decline due to fi nancing constraints.
In the region, the output growth is estimated to contract by 5.1 percent in 2009 compared to 5.5 percent expansion in the previous year.
For the region as a whole, infl ation is expected to fall to 12.6 percent in 2009 compared to 15.6 percent in the preceding year.
Russia has let ruble to depreciate markedly and has increased interest rates, while Kazakhstan has opted for 18.0 percent devaluation. Other countries (Ukraine and Belarus) observed substantial depreciations of currency early in the crisis. The sharp depreciation of currency increases the effective debt burden on non-fi nancial fi rms that have borrowed in foreign currency.
The region enjoyed current account surplus of 5.0 percent of GDP in 2008, however the current account is projected to fall drastically to 0.1 percent of GDP a year later.

14 Global Economic Prospects and Challenges
ANNUAL REPORT 2008
World Economic Outlook (Percent change, unless otherwise noted)
Year 2007 2008Projections
2009 2010World Output 5.2 3.2 -1.3 1.9Advanced Economies 2.7 0.9 -3.8 0.0
United States 2.0 1.1 -2.8 0.0Euro area 2.7 0.9 -4.2 -0.4Japan 2.4 -0.6 -6.2 0.5United Kingdom 3.0 0.7 -4.1 -0.4Canada 2.7 0.5 -2.5 1.2Others 4.7 1.6 -4.1 0.6
Emerging and developing economies 8.3 6.1 1.6 4.0Africa 6.2 5.2 2.0 3.9Central and Eastern Europe 5.4 2.9 -3.7 0.8Commonwealth of Independent States 8.6 5.5 -5.1 1.2Developing Asia 10.6 7.7 4.8 6.1Middle East 6.3 5.9 2.5 3.5Western Hemisphere 5.7 4.2 -1.5 1.6
European Union 3.1 1.1 -4.0 -0.3World trade volume (goods and services) 7.2 3.3 -11.0 0.6Imports
Advanced economies 4.7 0.4 -12.1 0.4Emerging and developing economies 14.0 10.9 -8.8 0.6
ExportsAdvanced economies 6.1 1.8 -13.5 0.5Emerging and developing economies 9.5 6.0 -6.4 1.2
Commodity prices (USD)Oil 10.7 36.4 -46.4 20.2Non-fuel (average based on world commodity export weights) 14.1 7.5 -27.9 4.4Consumer prices
Advanced economies 2.2 3.4 -0.2 0.3Emerging and developing economies 6.4 9.3 5.7 4.7
London inter-bank offered rate (percent)On US dollar deposits 5.3 3.0 1.5 1.4On Euro deposits 4.3 4.6 1.6 2.0On Japanese yen deposits 0.9 1.0 1.0 0.5Source: World Economic Outlook, IMF, April 2009, Page 10
Source: World Economic Outlook, IMF, April 2009, Pages xv-xx, 1-17, and 63-95
Item

Economic Highlights of ACU Member Countries 15
ANNUAL REPORT 2008
BangladeshReal Gross Domestic Product (GDP) recorded a strong growth of 6.2 percent in 2007/08, marginally lower than 6.4 percent in 2006/07. The growth performance was underpinned by growth of 6.9 percent in industry sector, 6.7 percent in services sector and 3.6 percent in agriculture sector.
Domestic Savings-GDP ratio reduced marginally to 20.1 percent in 2007/08 from 20.4 percent in 2006/07. Investment-GDP ratio also decreased to 24.2 percent in 2007/08 from 24.5 percent in 2006/07.
Bangladesh Bank pursued growth supportive and prudent monetary policy stance during 2007/08.
Broad money (M2) growth was 17.6 percent during 2007/08, which was higher than 17.0 percent growth in 2006/07 and 16.0 percent growth targeted for 2007/08. The higher growth in M2 than programmed was mainly due to higher growth in net foreign assets.
Economic Highlights of ACUMember Countries
Revenue collection in 2007/08 increased by 22.3 percent over 2006/07.
A substantial growth of knitwear products (21.5 percent) and woven garments (10.9 percent) continued to support the high export growth of 15.7 percent in 2007/08.
The overall balance of payments (BOP) position of the country showed a smaller surplus of USD 604.0 million in 2007/08, against a surplus of USD 1,493.0 million in 2006/07, refl ecting reduction of current account surplus and also a substantial decline of surplus on capital and fi nancial account in 2007/08.
Workers’ remittances stood at USD 7,914.8 million in 2007/08 which was 32.4 percent higher than USD 5,978.5 million in 2006/07.
The gross foreign exchange reserves of the country stood at USD 6,149.0 million at the end of June 2008, but declined to USD 5,769.2 million as on February 19, 2009.
Economic Highlights of ACU Member Countries16
ANNUAL REPORT 2008
The foreign exchange market remained almost stable during 2007/08. However, at the end of 2007/08 the nominal Taka-US dollar exchange rate appreciated by 0.4 percent from Taka 68.8 per US dollar at the end of June 2007 to Taka 68.5 per US dollar at the end of June 2008.
Annual average consumer price index (CPI) (base: 1995/96=100) infl ation demonstrated an increase from 7.2 percent in 2006/07 to 9.9 percent in 2007/08. The rising trend in infl ation of 2006/07 as measured by CPI continued throughout 2007/08 due mainly to higher prices of oil and some other imported goods in the international market, disruptions in production and supply caused by repeated fl oods and cyclone.
BhutanIn 2007/08, Bhutan celebrated one hundred years of Monarchy.
The coronation of the fi fth King, Jigme Khesar Namgyel Wangchuck was held in 2007/08.
There was a smooth political transition from a monarchy to a democracy in March 2008.
The Indian Prime Minister, Dr. Manmohan Singh visited Bhutan in 2007/08 and addressed the fi rst session of the newly formed democratic government.
Tamabil port, was opened as the new trade route between Bhutan and Bangladesh.
The real GDP grew by an unprecedented rate of 21.0 percent in 2006/07, an exceptionally high growth due to the full commissioning of the biggest hydropower plant, Tala Hydroelectric Project Authority (THPA).
In line with the general developments in India, the major trading partner, the quarterly CPI reported a higher annual infl ation rate of 8.9 percent in the second quarter of 2008 as compared to 5.9 percent during the same period last year.
Monetary expansion continued to slow with M2 growing at 2.3 percent as compared to 8.6 percent in the previous year while credit to the private sector grew at 36.6 percent as compared to 35.5 percent in 2006/07.
In 2007/08, the substantial fall in exports resulted in a trade defi cit, reversing the surplus that was seen in 2006/07. However, current account and hence the overall balance is estimated to be in surplus due to grant and aid infl ows, resulting in an increase in the country’s gross international reserves by 8.0 percent.
On the exchange rate front, the ngultrum, which is pegged at par to the Indian

Economic Highlights of ACU Member Countries 17
ANNUAL REPORT 2008
Rupee appreciated by 8.7 percent against the US dollar since the last fi nancial year.
IndiaThe advance estimates of the Central Statistical Organisation (CSO) released in February 2009 placed the real GDP growth for 2008/09 at 7.1 percent. In its Annual Policy Statement for the year 2009/10 released in April 2009, the Reserve Bank has projected the GDP growth for 2008/09 in the range of 6.5 to 6.7 percent.
During 2008/09 so far (April-February), industrial growth based on the index of industrial production (IIP), decelerated to 2.8 percent from 8.8 percent in the corresponding period of the previous year.
As per the revised estimates for 2008/09, the gross fi scal defi cit (GFD) and revenue defi cit (RD) stood at 6.0 percent and 4.4 percent of GDP, respectively. As per the Interim Union Budget 2009/10, the GFD and RD are budgeted to decline to 5.5 percent and 4.0 percent of GDP during 2009/10.
During 2008/09, broad Money (M3) increased by 18.4 percent as at the end of March 2009 as compared to 21.2 percent as at the end of March 2008. On a year on year (YoY) basis, growth in reserve money (RM) was lower at 6.4 percent as
at the end of March 2009 as compared to 31.0 percent as at the end of March 2008.
During 2008/09, growth in bank credit moderated during 2008/09 from the strong pace of the previous three years. Aggregate deposits of commercial banks expanded by 19.8 percent as at the end of March 2009 as compared to 22.4 percent a year ago.
Commercial banks’ non-food credit decelerated to 17.5 percent as at the end of March 2009 from 23.0 percent a year ago.
Headline infl ation, as measured by YoY variations in the wholesale price index (WPI), decelerated sharply from its intra-year peak of 12.9 percent on August 2, 2008 to 0.3 percent by March 28, 2009.
During 2008/09, growth in India’s exports decelerated to 3.4 percent from 29.0 percent in 2007/08, while growth in imports was also lower at 14.3 percent as compared to 35.5 percent in 2007/08.
India’s current account defi cit (CAD) widened during 2008/09 (April-December) to USD 36.5 billion in April-December 2008 from USD 15.5 billion in April-December 2007 mainly led by larger trade defi cit on account of higher growth in imports coupled with a slowdown in

Economic Highlights of ACU Member Countries18
ANNUAL REPORT 2008
export growth. Overall, the trade defi cit was higher at USD 105.3 billion during April-December 2008 as compared with USD 69.3 billion in April-December 2007.
The capital account balance moderated during April-December 2008 mainly due to higher gross capital outfl ows coupled with lower gross capital infl ows. While the gross capital infl ows declined toUSD 246.4 billion during April-December 2008 from USD 291.8 billion in April-December 2007, the gross capital outfl ows increased to USD 231.1 billion from USD 209.8 billion during the same period.
Gross inward foreign direct investment (FDI) was USD 31.7 billion during 2008/09 so far (April-February) as compared withUSD 27.6 billion in the corresponding period of the previous year. During 2008/09, foreign institutional investors recorded a net outfl ow of USD 15.0 billion as against net infl ows of USD 20.3 billion a year ago. Refl ecting the tight liquidity conditions in the overseas credit markets and increased cost of borrowings, gross inflows under external commercial borrowings (ECBs) to India moderated sharply during April-December 2008.
India’s total external debt stood atUSD 230.8 billion at the end of December 2008. The increase in external debt stock was essentially due to increase inlong-term debt outstanding by USD 9.4
billion, especially commercial borrowings and bilateral debt, during the third quarter of 2008/09. Short-term debt, however, declined by USD 3.2 billion.
Debt sustainability indicators remained at a comfortable level at the end of December 2008. The debt service ratio was placed at 5.3 percent during the third quarter of 2008/09. The ratio of short-term to total debt was 20.6 percent while the ratio of short-term debt to reserves was 18.5 percent at the end of December 2008. India’s foreign exchange reserves exceeded the external debt by USD 25.1 billion, providing a cover of 110.9 percent to the external debt stock at the end of December 2008.
During the fi nancial year (FY) 2008/09, India’s foreign exchange reserves at USD 252.0 billion declined by USD 57.7 billion from USD 309.7 billion as at the end of March 2008.
IranDuring 2007/08 (1386), Iranian economy was stable and smooth. Sharp rise in prices and acceleration of infl ation was a foreseeable phenomenon which was realized. In spite of higher infl ation, other major real sector indicators like GDP growth and unemployment rate, did not manifest major changes from medium-term trends.

Economic Highlights of ACU Member Countries 19
ANNUAL REPORT 2008
Based on preliminary estimates, GDP at current prices rose from Rls. 2,038.0 trillion in 2006/07 to Rls. 2,623.0 trillion in 2007/08, showing 28.7 percent growth in nominal terms and 6.9 percent growth in real terms, which indicates 0.7 percentage point increase at constant prices compared with the previous year. Meanwhile, non-oil GDP registered 7.6 percent growth, up by 1.0 percentage point compared with 2006/07.
Iran’s average crude oil production, in adherence to the production quotas set by the Organization of Petroleum Exporting Countries (OPEC), amounted to 4.1 mb/d in 2007/08. Crude oil exports increased by 2.0 percent to 2.5 mb/d; however, exports of oil products plummeted by 25.2 percent to 199.0 thousand b/d compared with the previous year. The average spot price of Iran’s crude oil export grew by 30.9 percent to about USD 78.0.
Of the key objectives of the Fourth Five-Year Development Plan (FFYDP) is to reduce unemployment rate to 8.4 percent by the end of the Plan (2009/10). According to the data drawn by the Statistical Center of Iran (SCI) in the “Labor Force Survey”, unemployment rate stood at 10.5 percent in 2007/08, showing 0.8 percentage point decline compared with 2006/07.
Government general revenues amounted to Rls. 298,203.1 billion in the review year, showing 29.0 percent growth
compared with the previous year. Share of tax revenues in total revenues declined from 65.6 percent in 2006/07 to 64.3 percent in the review year. Government tax revenues rose by 26.5 percent toRls. 191,815.3 billion in 2007/08, compared with the previous year.
In the review year, the government expenses rose to Rls. 421,334.1 billion, representing 1.3 percent increase against the previous year. Meanwhile, national expenses declined by 0.9 percent, and provincial expenses grew by 7.9 percent, constituting respectively 72.6 and 27.4 percent of government expenses.
Government paid a total of Rls. 147,715.8 billion for the acquisition of non-fi nancial assets, indicating 1.5 percent growth compared with the year before. Of total payments by the government for the acquisition of non-fi nancial assets, 76.7 percent were in the form of national and 23.3 percent in the form of provincial expenses.
Trade balance posted a surplus ofUSD 40,819.0 million in the review year. This, together with the USD 7,199.0 million defi cit in foreign services balance and the USD 461.0 million surplus in the transfers account, resulted in the USD 34,081.0 million surplus in the current account of BOP. However, non-oil current account ran a defi cit of USD 47,683.0 million, up by 14.6 percent compared with

Economic Highlights of ACU Member Countries20
ANNUAL REPORT 2008
the previous year defi cit of USD 41,609.0 million. This indicates the greater role of oil sector in the external sector of the Iranian economy. Moreover, balance of the Oil Stabilization Fund (OSF) grew by 89.1 percent to USD 38,871.0 million at the end of 2007/08.
Liquidity growth stood at 27.7 percent at the end of 2007/08, indicating 11.7 percentage points reduction against the previous year-end. Among the factors affecting liquidity growth, net foreign and domestic assets of the banking system constituted respectively 3.6 and 24.1 percentage points of liquidity growth.
The Money and Credit Council (MCC) set the minimum lending rate on the facilities extended by public banks for transaction contracts at 12.0 percent for all economic sectors in 2007/08.
Upon reduction of public banks’ lending rates during 2004-08, the minimum expected lending rate of private banks was adjusted in the review year. According to the MCC approval, the minimum expected lending rate on the facilities extended by private banks and credit institutions for transaction contracts was set at 13.0 percent for all economic sectors.
Based on the recommendation of the MCC, the Parliament approved issuance of participation papers by the Central
Bank of Iran (CBI) worth Rls. 40.0 trillion at the provisional profi t rate of 15.5 percent. These papers were tax-exempt with a one-year maturity from the date of issuance.
The recessionary condition in stock market continued in 2007/08. This was largely due to regional uncertainties and certain public policies regarding price administration and short-term boom in real estate market which gravely affected investors’ decision in the stock market.
In 2007/08, the Tehran Stock Exchange Price Index (TEPIX) rose by 2.7 percent, “fi nancial index” 0.5 percent, “industrial index” 2.8 percent, “price and dividend index” 17.6 percent, and “cash dividend index” 14.5 percent. On the other hand, 50 top companies index fell by 19.6 percent. The turnover ratio1 reached 17.1 percent at the end of 2007/08, up from 15.4 percent at the end of 2006/07.
The CPI of goods and services advanced 18.4 percent (base year=2004/05), indicating 6.5 percentage points increase compared with the 11.9 percent growth of the previous year. Among the special groups, the price index of “goods”, with 17.4 percent increase compared with the previous year, accounted for 52.0 percent of the rise in the general index. The main group of “food and beverages”, with 21.7 percent rise compared with the year before, raised the general index by 34.0
1 It is the ratio of trading value to average current value of shares.

Economic Highlights of ACU Member Countries 21
ANNUAL REPORT 2008
percent.
MyanmarThe Government of Myanmar has been formulating and implementing economic short-term plans with a view to achieve balanced economic development in all the economic sectors since the FY 1992/93. The previous three consecutive economic short-term plans; 1992/93 to 1995/96, 1996/97 to 2000/01, 2001/02 to 2004/05, achieved with high growth rates. The fourth fi ve-year economic short-term plan has been formulated from 2006/07 to 2010/11. FY 2007/08 was the second year of the fourth fi ve-year plans and the growth rate of real GDP recorded 11.9 percent. During 2007/08, agriculture, livestock, fi shery and forestry sector are the main contributors to GDP with the share of 44.0 percent, followed by 36.0 percent of the services and other sector and industry sector of 20.0 percent respectively. Looking at the past trend, the share of agriculture, livestock, fi shery and forestry sector in the total GDP indicating 1.0 percent only decreased from the previous year but slightly decreased to 3.0 percent from 2005/06. The share of industry sector in the total GDP has been rising trend. On the other hand, services and other sector decreased to 6.0 percent compared to a year ago. It can be said that the growth refl ected a more diversifi ed and expansion in industry sector.
The Government emphasized the development of the infrastructure sector and encouragement of the private sectors’ economic activities. The government has also focused its expenditure on the provision of essential services building of dams, health and housing. Accordingly, these efforts have caused substantial increase in government expenditures during the recent years. Looking at the revenue side, various tax reform measures have been taken including broadening the tax base, adjusting tax rates and strengthening tax administration and enhancing the State Economic Enterprises’ (SEEs) performance resulted in a substantial increase in revenue. Therefore, the tax revenues have been rising. However, the government revenue has been offset by the increase in government expenditure, especially increase in salaries of government employees in 2006/07. Consequently, the government budget continued to remain in defi cit.
Growth in aggregate bank deposits accelerated to 32.0 percent during 2007/08. Bank credit to commercial sector expanded by 13.0 percent during 2007/08. The banking system remains the main mobilizer of funds in the economy. Monetary policy continues to support economic growth in 2007/08. However, maintaining accommodative monetary stance became more challenging particularly in light of inflationary

Economic Highlights of ACU Member Countries22
ANNUAL REPORT 2008
pressures. The Central Bank of Myanmar has monitored the domestic banks by issuing instructions and using the on-site examination and off-site monitoring.
Myanmar’s BOP continued to show positive performance. The overall BOP of the country recorded a favorable surplus of USD 1,101.2 millions in 2007/08. Total exports during 2007/08 recorded a growth of 22.3 percent mainly due to increase in gas exports. Total imports increased by 14.5 percent. Refl ecting the trade surplus and other capital infl ow, gross offi cial reserve increased and was adequated to fi nance 14 months of imports at the end of March 2008. As in the preceding years, Myanmar’s trade with Asian Clearing Union (ACU) member countries remained surplus during 2007/08. Myanmar’s trade surplus increased to 4.5 percent. During 2007/08, total exports to ACU member countries increased by 5.6 percent. Total imports from ACU countries increased by 12.1 percent during 2007/08.
NepalThe performance of Nepalese economy remained satisfactory in 2007/08 compared to that of the previous year. Nepalese economy witnessed a healthy economic growth-the highest in the last four years- in the review period and infl ation stood at a moderate level.
The real GDP at producers’ price
increased by 4.7 percent in 2007/08, compared to that of 2.5 percent in the previous year. The improved performance of agriculture sector coupled with a satisfactory expansion of service sector helped grow the economy to the peak of four years. The annual average consumer price infl ation, however, rose to 7.7 percent in 2007/08 from 6.4 percent in the previous year. The rise in food prices and the price hike in petroleum products were the driving factors for infl ation in 2007/08.
Monetary growth was higher than that of the previous year. For example, M2 rose by 25.2 percent in 2007/08 compared to a growth of 14.0 percent in the previous year. Likewise narrow money (M1) also showed a higher growth of 21.6 percent compared to an increase of 12.2 percent in the previous year. A signifi cant increase in both net foreign assets (NFA) and net domestic assets (NDA) contributed to such a substantial increase in monetary aggregates in the review year.
The Government’s budget on a cash basis recorded a defi cit of Rs. 21.2 billion in 2007/08 compared to the defi cit of Rs. 18.8 billion a year ago. The budget defi cit to GDP ratio remained at 2.6 percent in 2006/07 as in the previous year.
On the external sector front, the merchandise trade defi cit expanded by
Economic Highlights of ACU Member Countries 23
ANNUAL REPORT 2008
22.5 percent. This was on account of higher import growth of 16.1 percent and a lower export growth of 2.4 percent. However, the current account showed a surplus of Rs. 21.7 billion mainly due to the robust growth in external net transfer income. The overall BOP posted a surplus of Rs. 29.7 billion in 2007/08.
Workers’ remittance infl ow recorded an increase of 42.5 percent to Rs. 142.7 billion in 2007/08 compared to an upsurge of 2.5 percent to Rs. 100.0 billion in the previous year. The workers’ remittances to GDP ratio increased to 17.4 percent in 2007/08.
The Nepalese stock market witnessed a major expansion in 2007/08. The YoY Nepal Stock Exchange (NEPSE) index increased by 40.9 percent to 963.4 points in the middle of July 2008. The index was at 684.0 points a year ago. The increased confi dence of investors in the aftermath of political change and a number of corporate actions taken by bank and fi nancial institutions contributed to the upsurge in the NEPSE index.
PakistanThe macroeconomic stresses have visibly eased by November 2008, as the Government entered into a macroeconomic stabilization program to support medium-term reforms under the aegis of the International Monetary Fund
(IMF).
The disbursement of the fi rst tranche under the program meant that any immediate risk of default on external obligations receded, with a substantial improvement in foreign exchange reserve adequacy indicators, and lending strength to the rupee.
At the same time, a sharp decline in international commodity prices is expected to substantially lower the country’s import bill, offering the possibility of a decline in the country’s very large current account defi cit, and lower infl ation.
This supply-side improvement has been reinforced by the reasonably good performance of crops during kharif 2008/09 cropping season. These factors appear to have already halted the persistent uptrend in infl ationary pressures in the economy. Together, they could also help support a very modest improvement in the growth outlook for 2008/09.
There is also substantial progress on containing fi scal imbalances as the Government reduced subsidies, contained growth in other spending and increased revenues. Thus, there is a sharp fall in the fi scal defi cit from 3.4 percent of GDP during the fi rst half of 2007/08 to 1.9 percent of GDP in the fi rst half of 2008/09.

Economic Highlights of ACU Member Countries24
ANNUAL REPORT 2008
While many of the country’s macroeconomic indicators may no longer be worsening, the imbalances are nonetheless still quite large. Resolving them will require disciplined efforts.
The BOP position is still exposed to several risks as exports may be adversely affected due to domestic structural bottlenecks featuring intermittent power and gas supplies and global recession. The latter development may also affect the not only the growth in workers’ remittances, there is also a likelihood of a severe reduction in fi nancial infl ows to emerging market including Pakistan.
On the fi scal side, the risk of missing the tax revenue target has increased in the wake of slowing economic activity.
Currently, the decline in domestic oil prices is not in line with the sharp decline in international oil prices. A regular transfer of the international oil price impact to domestic prices is instrumental in establishing confi dence over Government’s actions. A delayed or no action by the Government after a decline in oil prices not only reduces the direct trickle down impact on domestic prices but also dissuades adjustments in infl ationary expectations.
Though CPI infl ation has eased somewhat its persistence at a high level remains a source of concern. With a
sustained period of high infl ation, there is always a risk and tendency for infl ation to take a chronic form as it becomes entrenched in public’s expectations.
Sri LankaSri Lankan economy demonstrated its resilience by recording a growth of 6.0 percent in 2008 in the midst of unprecedented and unfavorable developments globally and domestically. All the sectors comprised of services, industry, and agriculture contributed favorably towards this growth. During the fi rst part of the year, food and energy crises in the global economy was threatening the macroeconomic imbalances by way of sharply widening trade and current account balances, rising infl ation to the highest ever levels since 1980s and exerting pressures on fi scal balances due to high defense expenditure, cost of reconstruction of the Eastern province and tax exemptions arising from duty waivers in order to minimize the impact of high food and energy prices on domestic cost of living. Towards the latter part of the year, second wave of global fi nancial crisis, which was originated from the sub-prime mortgage issues in the United States (US), turned into a global fi nancial turmoil. This fi nancial turmoil triggered a reversal of capital fl ows from emerging market economies for safety. Sri Lanka also had to cope with its share of sudden withdrawal of foreign capital by

Economic Highlights of ACU Member Countries 25
ANNUAL REPORT 2008
running down almost 50.0 percent of its external offi cial reserves.
Earnings from exports in 2008 totalled USD 8,137.0 million recording a growth of 6.5 percent compared to 2007. Expenditure on imports grew signifi cantly by 24.0 percent as a result of historically high commodity prices. The services account surplus together with the increased worker remittances helped contain the current account defi cit. However, the surplus in the capital and fi nancial account was not suffi cient enough to offset the defi cit in the current account leading to an overall defi cit of USD 1,225.0 million in the BOP by the end of 2008.
The monetary policy of the Central Bank had been tight during the fi rst three quarters in order to contain the higher infl ation resulted from the global food and energy crisis. However, with the escalation of the fi nancial crisis towards the latter part of 2008 the bank had to relax its policy stance in order to enhance the market liquidity and mitigate harmful impacts of domestic fi nancial market.
Prudential regulations and timely action by the Central Bank enabled to maintain fi nancial system stability despite looming threats arising from excessive domestic credit expansion in the past and high interest rates resulting from the tight monetary policy and the collapse of some domestic illegal deposit taking institutions linked to a major fi nancial institution while global fi nancial turmoil cutting off external funding lines to the domestic banking sector.
The fi scal policy strategy of the Government continued to be in the direction enunciated within the overall development strategy of the Government pronounced in the “Ten-Year Horizon Development Framework: 2006-16” (Ten-year Vision). Accordingly, the gradual reduction of the overall budget defi cit to a sustainable level is the thrust of the fi scal policy framework. The medium-term fi scal policy priorities continue towards the fi scal consolidation process by maintaining healthy government revenue and rationalizing recurrent expenditures.
ANNUAL REPORT 2008
26 Country Performance / Bangladesh
BangladeshThe Bangladesh economy showed signs of resilience by maintaining a satisfactory growth momentum in the face of repeated fl oods and cyclone Sidr, and a spike in prices of oil, rice and most commodities in the global market. The government and the Bangladesh Bank (BB) continued to adopt policies in bringing the economy back to its growth momentum. The Government’s growth stimulating and poverty reduction programmes coupled with prudent monetary policies of BB contributed toward a strong real Gross Domestic Product (GDP) growth of 6.2 percent in 2007/08, slightly lower than 6.4 percent of 2006/07. The growth performance was underpinned, on the supply side, by a moderate growth in the agriculture sector and continued strong growth in the industry sector and the services sector, despite two consecutive fl oods and devastating cyclone Sidr and soaring commodity prices in the international market. Economic growth was also aided by the rapid growth in exports and surging remittances. Export earnings recorded a strong growth of
15.7 percent and remittances from non-resident Bangladesh nationals increased substantially by 32.4 percent in 2007/08.
The rising trend in infl ation of 2006/07 as measured by Consumer Price Index (CPI) continued throughout 2007/08 due mainly to higher prices of oil and some other imported goods in the international market, disruptions in production and supply caused by repeated fl oods and cyclone. BB pursued growth supportive and prudent monetary policy stance during 2007/08 to ease the uptrend in infl ationary tendency.
Economic Growth
The 6.2 percent real GDP growth in 2007/08 was propelled mainly by a moderate growth in the agriculture sector and continued strong growth in industry sector, and services sector. Growth rate in agriculture sector achieved a moderate growth of 3.6 percent in 2007/08 against 4.6 percent growth recorded in 2006/07. The deceleration in this sector was
Country Performance

27Country Performance / Bangladesh
ANNUAL REPORT 2008
mainly due to lower growth in crops and horticulture sub-sector. The industry sector attained a growth of 6.9 percent in 2007/08, as against 8.4 percent of 2006/07. The growth rate was led by export-oriented manufacturing and supported by strong growth in mining and quarrying sub-sector. The service sector grew by 6.7 percent in 2007/08, slightly lower than 6.9 percent recorded in 2006/07.
unprecedented rise in commodity prices in the international market particularly of foods and fuel, shortfall in domestic food production and supply due mainly to devastating fl oods and cyclone and higher domestic production cost of essential goods. Annual average CPI (base: 1995/96=100) infl ation increased from 7.2 percent in 2006/07 to 9.9 percent in 2007/08. On a point to point basis the rate of infl ation showed an increase from 9.2 percent in 2006/07 to 10.0 percent in 2007/08.
Savings and Investment
Domestic savings-GDP ratio slightly reduced from 20.4 percent of 2006/07 to 20.1 percent in 2007/08 and investment-GDP ratio also decreased from 24.5 percent of 2006/07 to 24.2 percent in 2007/08.
Price Situation
Bangladesh economy witnessed a continued upward infl ationary pressure in 2007/08. The persistent rise in infl ation during 2007/08 was attributed to
Fiscal Developments
In the revised budget, revenue as a percentage of GDP increased to 11.3 in 2007/08 as compared to 10.6 in 2006/07. Expenditure on Annual Development Program (ADP) as percentage of GDP decreased to 4.2 during 2007/08 from 4.6 in 2006/07. To meet the expenditure partially, government borrowings from the banking system was Taka 104.0 billion (1.9 percent of GDP). The rest amount of Taka 95.2 billion (1.8 percent of GDP)

ANNUAL REPORT 2008
28 Country Performance / Bangladesh
of domestic fi nancing of the defi cit was non-bank borrowings mainly consisting of non-cash bond and National Savings Scheme Certifi cate bought and held by the public. The foreign fi nancing component of the budget defi cit was Taka 131.5 billion (2.5 percent of GDP), consisting of foreign grants and loans. The overall budget defi cit (excluding grants) as percentage of GDP, however, stood at Taka 330.7 billion or 6.2 percent of the GDP in 2007/08 which was Taka 173.7 billion or 3.7 percent of the GDP in 2006/07.
Monetary and Credit Situation
BB pursued growth supportive and prudent monetary policy stance to ease the uptrend infl ationary tendency. Broad money (M2) growth was 17.6 percent during 2007/08 which was higher than 17.0 percent growth in 2006/07 and also higher than 16.0 percent growth targeted under the programme for 2007/08. The accelerated growth in broad money than programmed was mainly due to higher growth in net foreign assets although offset slightly by the lower growth in net domestic assets. The growth in net foreign assets stood at 15.1 percent as against projection of 3.4 percent during 2007/08 though notably lower than 49.4 percent growth in 2006/07.
Total domestic credit increased by 21.8 percent during 2007/08, higher than 14.4
percent increase during 2006/07. The private sector credit grew at 24.9 percent notably higher than projected growth of 14.9 percent and the actual growth of 15.0 percent during 2006/07 refl ecting increased economic activities in the real sector. The public sector credit increased by 11.9 percent during 2007/08 compared to projected growth of 26.4 percent and actual growth of 12.4 percent in 2006/07 mainly due to downsizing of ADP, better revenue collection and increased fl ow of foreign fund.
The Cash Reserve Requirement (CRR) for the scheduled banks with the BB remained same at 5.0 percent of their total demand and time liabilities since October 1, 2005. Statutory Liquidity Ratio (SLR) for the scheduled banks, except banks operating under the Islamic Shariah and the specialized banks remained same at 18.0 percent of their total demand and time liabilities, excluding inter bank items since October 1, 2005. The SLR for the Islamic banks remained unchanged at 10.0 percent. The specialized banks continued to remain exempted from maintaining the SLR.
Exchange Rate Developments
The foreign exchange market remained almost stable during 2007/08. During the fi rst quarter of 2007/08, Taka-US dollar exchange rate started with Taka 68.9. Initially there was a modest pressure on

29Country Performance / Bangladesh
ANNUAL REPORT 2008
the exchange rate due to higher demand in the foreign exchange market. With the beginning of second quarter, Taka started to appreciate and in the middle of December it stood at Taka 68.5. During the Third quarter of the year, Taka remained relatively stable with exchange rates ranging within Taka 68.56-68.60. However, at the end of 2007/08, Taka gained slightly and stood at Taka 68.5. The weighted average Taka-US dollar exchange rate came down from Taka 68.8 at the end of June 2007 to Taka 68.5 at the end of June 2008. During the second quarter of 2007/08, BB injected USD 735.5 million to ease the higher import payments related liquidity pressure in the foreign exchange market. At the end of 2007/08 BB purchased USD 202.5 million from the commercial banks for absorbing excess liquidity of the market. However, the nominal Taka-US dollar exchange rate appreciated by 0.4 percent from Taka 68.8 per US dollar at the end of June 2007 to Taka 68.5 per US dollar at the end of June 2008.
Exports (fob)
Export earnings (fob including Export Processing Zone (EPZ)) during 2007/08 increased by 15.7 percent to USD 13,945.0 million as compared to USD 12,053.0 million in the preceding year. A substantial growth of knitwear products (21.5 percent) and woven garments (10.9 percent) continued to support the high
Imports (fob)
Import payments (fob) during 2007/08 stood at USD 19,486.0 million registering a growth of 25.6 percent as compared to USD 15,511.0 million in 2006/07. Increased imports of rice (385.6 percent), fertilizer (77.0 percent), edible oil (72.6 percent), pulses (67.7 percent), milk and cream (65.1 percent) and raw cotton (41.2 percent) contributed in varying degrees to the rise in aggregate imports during 2007/08 over 2006/07.
growth of exports in 2007/08.

ANNUAL REPORT 2008
30 Country Performance / Bangladesh
Workers’ Remittances
Workers’ remittances stood at USD 7,914.8 million in 2007/08 which was 32.4 percent higher than USD 5,978.5 million in 2006/07. The underlying reason for growth of remittances was that BB made vigorous efforts such as expansion of activities of drawing arrangements, review of statements received from foreign banks/exchange houses, close monitoring and supervision of banks, etc. Besides, the concerned scheduled banks had ensured quick delivery of remittances by reducing lead time to the benefi ciaries in Bangladesh, which brought substantial development in the delivery system.
Foreign Exchange Reserves
The gross foreign exchange reserves of the BB continued to grow in the backdrop of steadily increasing export earnings and workers’ remittances and stood at USD 6,149.0 million at the end of June 2008 as against USD 5,077.0 million at the end of June 2007. Foreign exchange reserves stood at USD 5,769.2 million as on February 19, 2009.
Balance of Payments (BOP)
Notwithstanding a hefty 32.4 percent rise in workers’ remittances, the overall BOP position of the country showed a smaller surplus of USD 604.0 million in 2007/08, against a surplus of USD 1,493.0 million
in 2006/07, refl ecting reduction of current account balance surplus from USD 936.0 million in 2006/07 to USD 672.0 million in 2007/08 and substantial decline of surplus on the capital and fi nancial account to USD 145.0 million in 2007/08 from USD 1,252.0 million in 2006/07. The reduction in current account surplus occurred due to widening of the defi cits on the trade, services and income accounts. The defi cit on trade account, income account and service account increased from USD 3,458.0, USD 905.0 and USD 1,255.0 million in 2006/07 to USD 5,541.0, USD 1,005.0 and USD 1,525.0 million in 2007/08.
Trade with ACU Member Countries
Total trade (exports + imports) of Bangladesh under Asian Clearing Union (ACU) increased in 2007/08 compared to that in the previous year. As in the preceding years, Bangladesh remained a net debtor in all the six bi-monthly settlements during the year. Export

31Country Performance / Bangladesh
ANNUAL REPORT 2008
1 1 ACUD = 1 USD.
receipts and import payments both increased substantially with the ACU member countries during the year under report. Exports of Bangladesh to the ACU member countries recorded increase of USD 21.51 million or 16.4 percent to USD 153.0 million during 2007/08 from USD 131.5 million in 2006/07. On the other hand, import from the ACU member countries increased substantially by USD 1,436.3 million or 62.4 percent from USD 2,301.1 million in 2006/07 to USD 3,737.3 million in 2007/08. As a result, the net debtor position of Bangladesh increased by USD 1,414.8 million or 65.2 percent to USD 3,584.3 million in 2007/08 compared to USD 2,169.6 million in the preceding year.
Outlook and Challenges
2007/08 was a challenging and eventful year for Bangladesh on several counts. Over the fi rst half of the fi nancial year, two successive fl oods, devastating cyclone Sidr, domestic infl ation, global market scenarios and the consequent impact of these on investment and business confi dence put the economy under serious test. But the economy bounced back strongly in the second half of the fi nancial year with pro-active measures by the Government along with BB’s timely measures in improving production environment through encouraging unhindered fl ow of credit to productive sectors like agriculture, Small and
Medium Enterprises (SMEs), and other income generating rural activities being the prime targets.
Recently, Bangladesh and all other South Asian countries have been experiencing infl ationary pressures resulting mainly from higher food and energy prices in the international market. Furthermore, in Bangladesh, production losses due to repeated fl oods and cyclone Sidr have added to the infl ationary pressures. Besides, the sustained high global oil prices have heightened pressure on country’s BOP, threatened fi scal and monetary stability alongside adversely affecting the economic activity. Maintaining fi scal discipline by the Government and minimizing the dependence on fi nancing fi scal defi cit from the banking system generate less infl ationary pressure. The Government raised administered prices of oil and revised the oil prices downward following recent decline in global oil prices. It is important to introduce a pricing system providing for automatic adjustment of domestic fuel prices with some mechanisms to protect the farmer and the poor from hardships. Besides, there is a need to reduce dependence on imported petroleum products by maximizing the use of alternative indigenous fuels and enhancing the effi ciency of energy use.
The depth and severity of the recent global fi nancial crisis as well as its impact on Bangladesh economy is still

ANNUAL REPORT 2008
32 Country Performance / Bangladesh
unfolding. However, Bangladesh is relatively insulated from the fi nancial side, but the global growth outlook, especially the growth prospect in the United States (US) and the country’s other major trade partners, has weakened which could create adverse impact on export growth, particularly export growth of ready-made garments (RMGs).
By maintaining macroeconomic stability through prudent fi scal and monetary policy with supportive external sector policy and
progress in advancing structural reforms, against the backdrop of recent natural disasters and food crisis, the near and medium-term macroeconomic prospects of Bangladesh appear favourable. In the updated medium-term macroeconomic framework (MTMF) of Poverty Reduction Strategy Paper (PRSP)1 under the base case scenario, the real GDP growth has been projected to increase gradually to 6.5 percent in 2008/09, 7.0 percent in 2009/10 and 7.2 percent in 2010/11.
1 Source: Moving Ahead-National Strategy for Accelerated Poverty Reduction II (FY2009-11), Planning Commission, Government of the People’s Republic of Bangladesh, October 2008.

33Country Performance / Bangladesh
ANNUAL REPORT 2008
Bangladesh: Major Economic Indicators
Year 2003/04 2004/05 2005/06 2006/07 2007/08
National Income and PricesReal GDP growth (percent) 6.3 6.0 6.6 6.4 6.2
GDP defl ator (percent change) 4.2 5.1 5.2 6.8 8.0
CPI infl ation (annual average) 5.8 6.5 7.2 7.2 9.9
GDP at current market prices (billion Taka) 3,330.0 3,707.0 4,157.0 4,725.0 5,419.0
GDP at current market prices (billion US dollar) 56.5 60.4 62.0 68.4 79.0
Fiscal Sector (percent of GDP)Total revenue 10.6 10.6 10.8 10.6 11.3
Total expenditure 14.8 15.1 14.7 14.3 17.5
Overall budget defi cit (excluding grants) 4.2 4.5 3.9 3.7 6.2
Financing of overall budget defi cit 4.6 4.5 3.3 3.7 6.2
Net domestic fi nancing 2.2 2.1 2.0 2.1 3.7
Bank borrowings 0.8 1.0 1.2 1.4 1.9
Non bank borrowings 1.4 1.1 0.8 0.7 1.8
Net foreign fi nancing 2.4 2.4 1.3 1.6 2.5
Money and Credit (percent change)Private sector 14.2 17.0 18.1 15.0 25.0
Broad money (M2) 13.8 16.7 19.3 17.1 17.6
Balance of Payments (percent change)Exports (fob) 15.9 14.0 21.6 15.8 15.7
Imports (fob) 13.0 20.6 12.1 16.6 25.6
Remittances 10.1 14.1 24.8 24.5 32.4
Gross offi cial reserve (million US dollar) 2,705.0 2,930.0 3,484.0 5,077.0 6,149.0
Gross offi cial reserve (month of imports) 2.8 2.5 2.7 3.3 3.2
Sources: (i) Bangladesh Bank Annual Report 2007/08; (ii) Economic Trends, November 2008, Bangladesh Bank; and (iii) Bangladesh Bank Quarterly, July-September 2008
Item

ANNUAL REPORT 2008
34 Country Performance / Bangladesh
Bangladesh: Total Exports and Imports(In millions of USDs)
Year2003/04 2004/05 2005/06 2006/07 2007/08
Exports (fob, including EPZ)7,521.0 8,573.0 10,412.0 12,053.0 13,945.0
(15.9) (14.0) (21.5) (15.8) (15.7)
Imports (fob, including EPZ)9,840.0 11,870.0 13,301.0 15,511.0 19,486.0
(13.0) (20.6) (12.1) (16.6) (25.6)
Trade Balance -2,319.0 -3,297.0 -2,889.0 -3,458.0 -5,541.0
Note: Figures in the brackets indicate percentage changes over the previous year.
Source: Annual Report 2007/08, Bangladesh Bank
Item

35Country Performance / Bangladesh
ANNUAL REPORT 2008
Bangladesh: Exports to ACU Member Countriesduring January–December, 2008
(In millions of USDs)
Commodity/Country ValueBhutan 0.8
Chemical products 0.1Woven garments 0.1Others 0.6
India 369.1Frozen foods 48.5Agri-products 14.6Chemical products 159.1Leather 7.1Raw jute 16.1Jute goods 50.2Knitwear 1.2Woven garments 8.8Others 63.5
Iran 53.1Jute goods 32.8Others 20.3
Myanmar 7.7Chemical products 5.4Leather 0.0Others 2.3
Nepal 10.8Chemical products 1.5Others 9.3
Pakistan 80.9Agri-products 2.7Tea 11.1Raw jute 54.4Others 12.7
Sri Lanka 21.8Chemical products 13.3Jute goods 1.3Others 7.2Source: Export Promotion Bureau (EPB)

ANNUAL REPORT 2008
36 Country Performance / Bangladesh
Bangladesh: Import Payments to ACU Member Countriesduring January–December, 2008
(In millions of USDs)
Commodity/Country Value
Bhutan 15.0Vegetable products 8.3Mineral products 5.9Others 0.8
India 3,510.6Live animals; animals products 37.2Edible vegetable certain roots and tubers 147.8Edible fruits and nuts peel of citrus fruits or melons 39.1Coffee, tea, mate and spices 27.3Cereals 669.8Prepared foodstuffs; beverages, spirits and vinegar; tobacco and manufactured tobacco substitutes 393.6
Salt, sulphur, earths and stone, plastering materials 34.9Mineral fuels, mineral oils and products of their distillation, bituminous substances; mineral waxes 76.2
Organic chemicals 98.5Tanning or dyeing extracts 60.5Plastics and rubber and articles thereof 118.7Paper and paperboard and articles thereof 31.2Textile and textile articles thereof 840.5Base Metals and article of base metals 199.6Machinery and mechanical appliances, electrical machinery and equipment and parts thereof 214.8
Vehicles other than railway or tramway, rolling stock, parts and accessories thereof 219.0
Others 301.9
Iran 42.6Vegetable products 17.3Mineral products 17.3Cotton 5.3Others 2.7
37Country Performance / Bangladesh
ANNUAL REPORT 2008
Bangladesh: Import Payments to ACU Member Countriesduring January–December, 2008
(In millions of USDs)
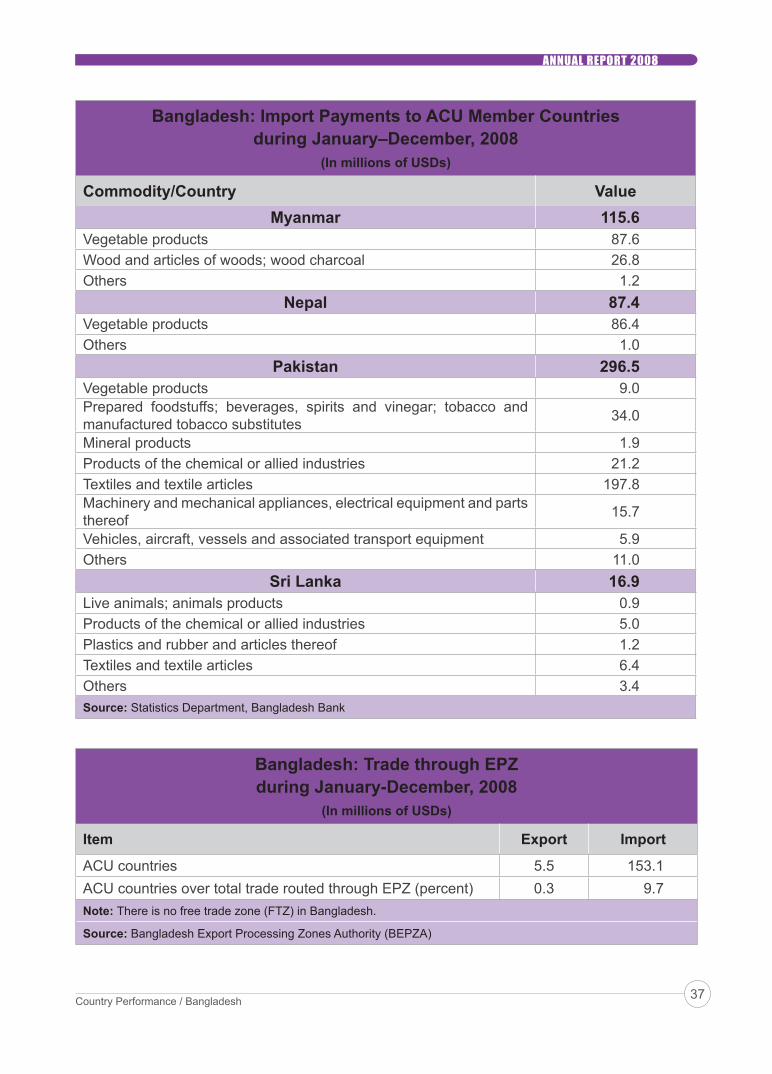
Commodity/Country ValueMyanmar 115.6
Vegetable products 87.6Wood and articles of woods; wood charcoal 26.8Others 1.2
Nepal 87.4Vegetable products 86.4Others 1.0
Pakistan 296.5Vegetable products 9.0Prepared foodstuffs; beverages, spirits and vinegar; tobacco and manufactured tobacco substitutes 34.0
Mineral products 1.9Products of the chemical or allied industries 21.2Textiles and textile articles 197.8Machinery and mechanical appliances, electrical equipment and parts thereof 15.7
Vehicles, aircraft, vessels and associated transport equipment 5.9Others 11.0
Sri Lanka 16.9Live animals; animals products 0.9Products of the chemical or allied industries 5.0Plastics and rubber and articles thereof 1.2Textiles and textile articles 6.4Others 3.4Source: Statistics Department, Bangladesh Bank
Bangladesh: Trade through EPZduring January-December, 2008
(In millions of USDs)
Item Export Import
ACU countries 5.5 153.1ACU countries over total trade routed through EPZ (percent) 0.3 9.7Note: There is no free trade zone (FTZ) in Bangladesh.
Source: Bangladesh Export Processing Zones Authority (BEPZA)
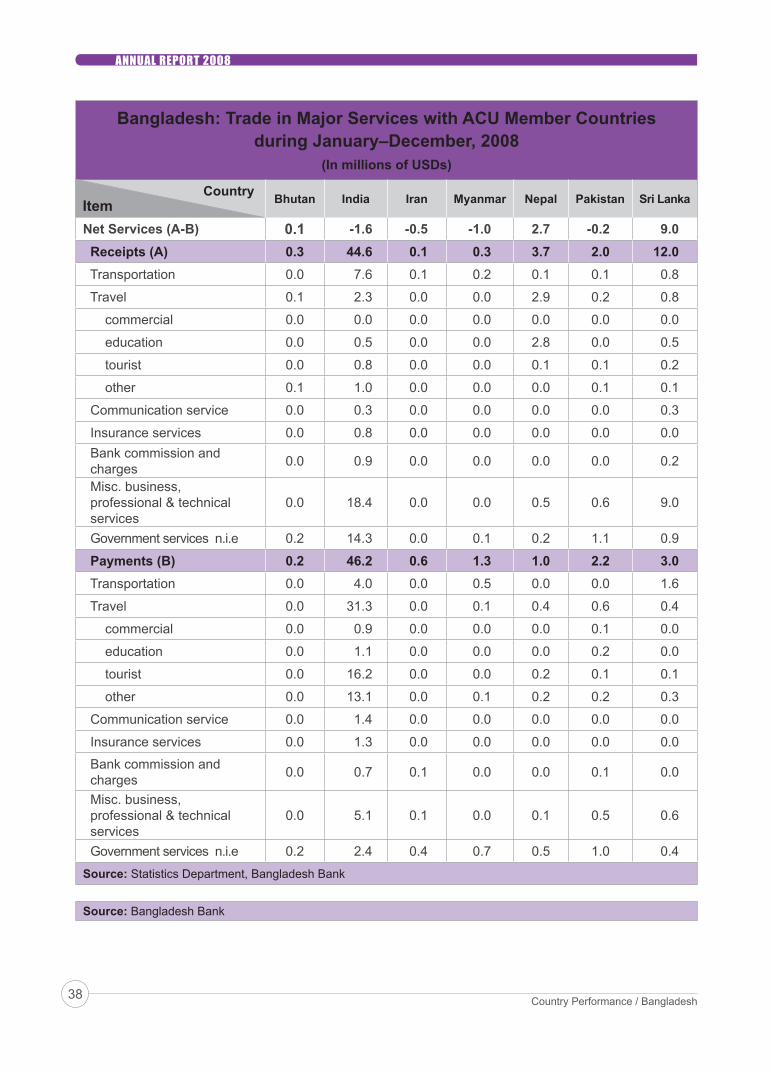
ANNUAL REPORT 2008
38 Country Performance / Bangladesh
Bangladesh: Trade in Major Services with ACU Member Countriesduring January–December, 2008
(In millions of USDs)
Country Bhutan India Iran Myanmar Nepal Pakistan Sri Lanka
Net Services (A-B) 0.1 -1.6 -0.5 -1.0 2.7 -0.2 9.0 Receipts (A) 0.3 44.6 0.1 0.3 3.7 2.0 12.0 Transportation 0.0 7.6 0.1 0.2 0.1 0.1 0.8
Travel 0.1 2.3 0.0 0.0 2.9 0.2 0.8
commercial 0.0 0.0 0.0 0.0 0.0 0.0 0.0
education 0.0 0.5 0.0 0.0 2.8 0.0 0.5
tourist 0.0 0.8 0.0 0.0 0.1 0.1 0.2
other 0.1 1.0 0.0 0.0 0.0 0.1 0.1
Communication service 0.0 0.3 0.0 0.0 0.0 0.0 0.3
Insurance services 0.0 0.8 0.0 0.0 0.0 0.0 0.0 Bank commission and charges 0.0 0.9 0.0 0.0 0.0 0.0 0.2
Misc. business, professional & technical services
0.0 18.4 0.0 0.0 0.5 0.6 9.0
Government services n.i.e 0.2 14.3 0.0 0.1 0.2 1.1 0.9
Payments (B) 0.2 46.2 0.6 1.3 1.0 2.2 3.0 Transportation 0.0 4.0 0.0 0.5 0.0 0.0 1.6
Travel 0.0 31.3 0.0 0.1 0.4 0.6 0.4
commercial 0.0 0.9 0.0 0.0 0.0 0.1 0.0
education 0.0 1.1 0.0 0.0 0.0 0.2 0.0
tourist 0.0 16.2 0.0 0.0 0.2 0.1 0.1
other 0.0 13.1 0.0 0.1 0.2 0.2 0.3
Communication service 0.0 1.4 0.0 0.0 0.0 0.0 0.0
Insurance services 0.0 1.3 0.0 0.0 0.0 0.0 0.0
Bank commission and charges 0.0 0.7 0.1 0.0 0.0 0.1 0.0
Misc. business, professional & technical services
0.0 5.1 0.1 0.0 0.1 0.5 0.6
Government services n.i.e 0.2 2.4 0.4 0.7 0.5 1.0 0.4
Source: Statistics Department, Bangladesh Bank
Source: Bangladesh Bank
Item

39Country Performance / Bhutan
ANNUAL REPORT 2008
BhutanFiscal year (FY) 2007/08 was a special year for Bhutan for several reasons. Firstly, it was a year celebrating one hundred years of Monarchy. Secondly, it was the coronation of the fi fth King, Jigme Khesar Namgyel Wangchuck and, lastly, there was a smooth political transition from a monarchy to a democracy in March 2008.
On the bilateral front with India, the Indian Prime Minister, Dr. Manmohan Singh visited Bhutan in 2007/08 and addressed the fi rst session of the newly formed democratic government.
A new development in the trade with Bangladesh has been the opening of an additional trade route between Bhutan and Bangladesh. Tamabil port, the new trade route is expected to boost the economy in the eastern region.
Real Sector
On the economic front, the real Gross Domestic Product (GDP) grew by 21.0 percent in 2006/07, an exceptionally high growth due to the full commissioning of the biggest hydropower plant, Tala Hydroelectric Project Authority (THPA). Consequently, in 2006/07 the secondary
sector (which includes manufacturing, electricity and construction) replaced tertiary sector as the main contributor to the growth. Within the secondary sector, the electricity sub-sector grew by 120.0 percent and it added around 60.0 percent to the total energy sales.
The secondary sector has overtaken the tertiary sector in the contribution to the total GDP as well, accounting for 43.3 percent of the nominal GDP, followed by the tertiary sector at 36.4 percent and lastly by the primary sector at 20.3 percent.
In line with the general developments in India, the major trading partner, the quarterly consumer price index (CPI) reported a higher annual infl ation rate of 8.9 percent in the second quarter of 2008 as compared to 5.9 percent during the same period last year.

40 Country Performance / Bhutan
ANNUAL REPORT 2008
payment (BOP) statistics in 2007/08 were infl uenced to a large degree by a substantial fall in exports, the winding down of the Tala hydropower project and increased foreign direct investment (FDI)-related infl ows. The trade balance is estimated to be in defi cit following a year of surplus while the current account balance and hence the overall balance is estimated to be in surplus.
Monetary Sector
Monetary expansion continued to slow with broad money supply (M2) growing at 2.3 percent as compared to 8.6 percent in the previous year while credit to the private sector grew at 36.6 percent as compared to 35.5 percent in 2006/07. The Royal Monetary Authority of Bhutan (RMA) further tightened its monetary policy in response to high growth in credit to private sector by increasing the cash reserve ratio (CRR) in September 2008.
The assets of fi nancial institutions (FIs) grew by 9.0 percent, reaching Nu. 33.5 billion at the end of June 2008 while total credit of the FIs grew by 31.0 percent. The total non-performing loans (NPL) of the FIs also increased by 42.0 percent, resulting in an increase in the gross NPL ratio to 13.4 percent from 12.4 percent during 2006/07.
External Sector
Developments in Bhutan’s balance of
Trade balance is generally in defi cit but year 2006/07 was an exception mainly due to a surge in exports to India. The trade defi cit in the review year due to a fall in exports to India, combined with worsening in both the services and income accounts resulted in the current account surplus declining from 13.0 percent of GDP in 2006/07 to 4.0 percent of GDP.
In terms of the direction of trade, with increased electricity exports, the share of exports to India increased from 77.0 percent in 2005/06 to around 82.0 percent in 2006/07. Major exports to India remains hydropower, base metals and articles of base metal while major exports

41Country Performance / Bhutan
ANNUAL REPORT 2008
to countries other than India include magnetic discs, tapes, cards and media (recorded and unrecorded).
Imports from India accounts for 69.0 percent of total imports with major imports being Mineral products including oils and fuels, base metals and articles of base metal, machinery, mechanical/electrical appliances and equipment and parts. From countries other than India, major imports included animal or vegetable fats & oils, base metals and articles of base metal, machinery, mechanical/electrical appliances and equipment and parts.
In the capital and fi nancial account, there has been a general decrease in infl ows, particularly those related aid after the completion of Tala hydropower project. Convertible currency loan disbursements and FDI-related infl ows also decreased. However, there was an increase in infl ows in private loans and the overall balance was positive at Nu. 2,035.3 million with a consequent increase in the country’s gross international reserves by 8.0 percent since last year. Total external reserves1 at USD 649.0 million in 2007/08 is suffi cient to fi nance 15 months of merchandise imports.
External Debt and Debt Service
Bhutan’s outstanding external debt grew by around 12.0 percent to USD 815.0
million at the end of 2007/08. Of the total, 57.0 percent were Indian rupee debts for hydropower projects while the remaining 43.0 percent were convertible currency debt. Within the convertible currency loan portfolio, concessional public debt accounted for 95.5 percent while remaining 4.5 percent was outstanding external debt of the private sector.
Debt to GDP ratio improved from 77.0 percent in 2006/07 to 61.0 percent 2007/08 mainly due to increased GDP growth. Debt service ratio however, increased from around 4.0 percent to around 18.0 percent in 2007/08 due to the combined effects of decreased exports and commencement of repayments on Tala Hydropower loans.
The government of India continues to be Bhutan’s biggest creditor, followed by the Asian Development Bank (ADB), the World Bank, and the government of Austria, in that order.
Exchange Rate Developments
Even on the exchange rate front just as in prices, developments in India had a heavy infl uence. Like the Indian rupee, the ngultrum also appreciated by 8.7 percent against the US dollar since the last FY, averaging Nu. 40.4 per US dollar in 2007/08.
1 Refers to only convertible currency reserves and excludes Indian rupee balances.

42 Country Performance / Bhutan
ANNUAL REPORT 2008
Fiscal Sector
The overall expenditure estimate increased by 40.7 percent, from Nu. 15,795.4 million in 2006/07 to Nu. 22,222.7 million in 2007/08. The increase in expenditure far outpaced the increase in total resources (27.3 percent), resulting in a budget defi cit increasing from 0.7 to 3.5 percent of GDP in the review period. Nonetheless, the royal government was able to maintain its policy of meeting the current expenditure from domestic revenue. The domestic revenue of Nu. 12,148.4 million was more than suffi cient to meet the current
expenditure of Nu. 10,591.0 million. Grant support was estimated to have fi nanced 37.5 percent of the total expenditure indicating the importance of grants in Bhutan’s development activities.
Total revenue consisting of domestic revenue (tax revenue, non-tax revenue and others receipts) and grants increased by 21.0 percent. Tax revenue, which accounted for 40.0 percent of the domestic revenue, grew by 21.0 percent while non-tax revenue, which constituted 60.0 percent of the domestic revenue, increased 16.3 percent in the review year.

43Country Performance / Bhutan
ANNUAL REPORT 2008
Bhutan: Major Economic Indicators
Year 2004/05 2005/06 2006/07 2007/08 2008/09
GDP Growth and Prices (percent change)
Real GDP at market price 6.8 7.1 8.5 21.4 na
Consumer prices 5.5 6.2 5.9 8.8 na
Wholesale prices (India) 5.2 4.6 5.4 9.6 na
Government Budget (in millions of Nu.)
Total revenue and grants 10,501.1 13,452.2 16,083.1 20,481.0 23,465.9
of which: foreign grants 4,373.1 6,424.7 6,000.9 8,332.5 9,277.5
Total expenditure and net lending 12,893.7 13,770.9 15,795.4 22,222.7 24,399.8
Current balance -42.6 355.1 2,390.8 1,557.5 na
Overall balance -2,392.6 -318.7 287.7 -1,741.7 -1,495.2
Money and Credit (percent change, end of period)
Broad Money, M2 10.7 26.3 8.6 2.3 na
Credit to private sector 26.3 32.2 35.5 36.6 na
Interest Rates (end of period)
One year deposits 4.5 4.5 4.5 4.8 na
Lending rate 10-16 10-16 10-16 10-16 na
91- day RMA bills 3.5 3.5 3.5 5.0 na
BOP (in millions of Nu.)
Trade balance -11,099.0 -5,496.7 555.1 -3,086.2 na
with India -3,601.2 -3,170.7 1,705.6 -853.2 na
Current account balance -10,487.4 -1,695.7 5,477.0 2,089.0 na
(In percent of GDP) -32.4 -4.6 13.2 3.9 na
with India -5,253.9 -2,344.6 3,349.5 1,559.7 na
(In percent of GDP) -16.3 -6.4 8.1 2.9 na
Foreign aid (concessional loans net) 2,939.4 3,474.7 881.0 -517.2 na
of which: India 1,853.1 2,324.8 -30.3 -1,049.7 na
Errors and omissions 95.5 1,057.7 -5,485.8 -1,949.7 na
Overall balance -918.6 5,209.1 5,184.4 2,035.3 na
(In percent of GDP) -2.8 14.2 12.5 3.8 na
External Indicators (end of period)
Gross offi cial reserves (in millions of USD) 366.5 478.8 600.4 649.0 na
(In months of merchandise imports) 9.3 13.6 13.3 15.1 na
External debt (percent of GDP) 82.2 84.3 77.3 61.1 56.3
Debt-service ratio 11.9 7.6 3.6 17.9 12.5
Item

44 Country Performance / Bhutan
ANNUAL REPORT 2008
Bhutan: Major Economic Indicators
Year 2004/05 2005/06 2006/07 2007/08 2008/09
Memorandum Items:Nominal GDP (in millions of Nu.) 32,319.7 36,581.2 41,443.5 53,932.6 na
Ngultrum per USD (fiscal year period average) 44.6 44.7 44.2 42.8 na
Money supply, M2 (end of period) 18,376.9 23,208.7 25,208.7 25,780.7 na
Money supply, M1 (end of period) 9,331.9 10,678.1 13,542.3 14,392.4 na
Counterparts
foreign assets (net) 16,397.2 22,505.0 24,881.3 26,365.3 na
domestic credit 6,553.7 8,651.9 10,063.3 13,362.1 na
claims on private sector 5,645.4 7,462.5 10,111.7 13,812.1 na
Components
currency outside banks 2,303.4 2,614.9 3,166.0 3,640.8 na
demand deposits 7,028.5 8,063.1 10,376.3 10,751.6 na
quasi-money 9,045.1 12,530.6 11,666.4 11,388.3 na
Reserve money, M0 9,340.1 13,474.7 13,319.6 12,871.0 na
of which: banks’ deposits 6,929.5 10,703.0 9,982.3 8,685.7 na
Money multiplier (M2/M0) 2.0 1.7 1.9 2.0 na
Income velocity (GDP/M2) 1.8 1.6 1.6 2.1 na
Population growth rate 2.5 1.3 1.3 na na
Unemployment rate 2.5 3.1 3.2 na naSource: National Accounts Statistics-NSB, Royal Monetary Authority of Bhutan
Bhutan: Real GDP Growth by Sectorduring 2004-2008
(YoY, change in percent)
Year 2004/05 2005/06 2006/07 2007/08 2008/09
GDP 6.8 7.1 8.5 21.4 na
Primary Sector 1.4 1.3 3.1 2.2 na
Secondary Sector 4.5 2.3 7.5 52.8 na
Tertiary Sector 12.6 13.4 7.1 6.0 naSource: National Statistics Bureau (NSB)
Item
Item

45Country Performance / Bhutan
ANNUAL REPORT 2008
Bhutan: Main Items of Goods and Services Exportedto ACU Member Countries in 2008
Sector/CountryBangladesh
GoodsCitrus fruits, fresh or dried, apples, pears and quinces, fresh fruit juice and mixture of juice, dolomite, not calcined or sintered, chips, lumbs and slabs, limestone and other calcareous stone, natural steatite, cardamoms
India
GoodsHydropower, copper products, palm oil, cement (portland, aluminous, slag, supersulphate), ferro-alloys, ingots (iron and non-alloy steel), carbide, textured yarn
Services Communications services, fi nancial services, royalties and license fees, trade related services, other services
Nepal
GoodsMineral and aerated waters, gypsum; anhydrite bituminous coal, poly (ethylene terephthalate), carboy, bottles, fl asks and similar articles, worn clothing and other worn articles
Bhutan: Main Items of Goods and Services Importedfrom ACU Member Countries in 2008
Sector/CountryBangladesh
Goods
Fruit and vegetable juice, medicaments, bread, pastry, cakes, biscuits and other bakers, soap, organic surface-active products, tableware, kitchenware and other household articles, track suits, ski suits, swimsuit and other garments, electric accumulators
India
GoodsHigh speed diesel, rice, gasoline/petrol, iron/non-alloy steel bars & rods, electrical transformers, static convertors and inductors, motor cars, malt beer, ferrous products (from reduction of iron ore), corrugated iron/non-alloy steel sheets
Services
Communications services, construction and installation services, fi nancial services, trade related services, operational services, legal, accounting, auditing and management consulting, architecture, engineering and other technical consultancy services, insurance services, royalties and license fees, computer and information services, other business services
Nepal
GoodsCereals goats, meal and pellets, soya beans, pasta and containing eggs, soaps, barbed wire of iron or steel, stranded wire, cables, plaited bands, electrical transformers, static converters and inductor
Source: Bhutan Trade Statistics, Department of Revenue and Customs, Ministry of Finance, 2007 (Calendar Year Basis)
Source: Royal Monetary Authority of Bhutan

46 Country Performance / India
ANNUAL REPORT 2008
IndiaReal Sector
The Indian economy, which averaged a growth rate of 8.8 percent over the past fi ve years (2003/04 to 2007/08) started experiencing a slowdown since the third quarter of 2007/08. As per the advance estimates released by Central Statistical Organisation (CSO) on February 9, 2009, the Indian economy is estimated to grow at the rate of 7.1 percent in 2008/09.
Sectoral Growth Trends
The growth rate of real gross domestic product (GDP) originating from agriculture and allied activities is estimated to decline to 2.6 percent while growth rate of real GDP originating from industry is estimated to be lower at 4.2 percent in 2008/09. While manufacturing has recorded the sharpest decline from 8.2 percent in 2007/08 to 4.1 percent in 2008/09, “electricity, gas and water supply” also suffered a moderation in growth. “Mining and quarrying”, on the other hand, witnessed higher growth of 4.7 percent in 2008/09. The growth rate of real GDP originating from services has moderated to 9.2 percent in 2008/09, due to moderation in growth in most of the sub-sectors. The sub-sector “community, social and personal services” witnessed
an increase in growth mainly on account of an increase in fi scal stimulus.
While the moderation in industrial growth was largely an outcome of some cyclical downturn, the services sector mainly refl ected weakness in demand both at home and abroad, compounded by transmission of global factors through both the trade and fi nancial channels.
Savings and Investment
As per the CSO’s quick estimates, the rate of gross domestic savings (GDS) in India, at current prices, increased to 37.7 percent in 2007/08 from 35.7 percent in 2006/07. All the three sectors, viz., the household sector, the private corporate sector and the public sector contributed to the rise in GDS in 2007/08. The rate of gross domestic capital formation (GDCF) at current prices increased to 39.1 percent in 2007/08 from 36.9 percent in 2006/07. The rate of capital formation in 2007/08 was higher than the rate of savings largely on account of net capital infl ows from abroad.
Agricultural Sector
As per the CSO’s revised estimates, real
47Country Performance / India
ANNUAL REPORT 2008
GDP growth originating from agriculture and allied activities is likely to moderate to 2.6 percent during 2008/09, refl ecting marginal decline in food grains production. The Ministry of Agriculture has set the target for food grains production for 2008/09 at 233.0 million tonnes. According to the second advance estimates released by the government, the total food grains production during 2008/09 is placed at 227.9 million tonnes as compared with 230.8 million tonnes in 2007/08. The decline in food grains production estimates in 2008/09 is mainly due to a decline in Kharif food grains. Growth in allied sector like horticulture, livestock and fi sheries is expected to remain strong in 2008/09 at 6.0 percent, 5.5 percent and 6.0 percent, respectively.
Industrial Sector
The index of industrial production growth rate moderated to 8.5 percent during 2007/08 from 11.5 percent in 2006/07. Industrial growth further declined to 3.2 percent during April-December 2008/09 as compared to 9.0 percent recorded during the same period last year. The moderation was largely due to slowdown in manufacturing and electricity sectors which recorded a growth of 3.3 percent and 2.7 percent, respectively, during April-December 2008/09 as compared with a growth rate of 9.6 percent and 6.6 percent, respectively, during the corresponding period of 2007/08. Growth
in mining sector also slipped to 3.0 percent in April-December 2008/09 from 5.2 percent during April-December 2007/08.
Services Sector
The services sector growth rate also moderated to 10.8 percent in 2007/08 from 11.3 percent during 2006/07 in line with the slackening of growth in the industrial sector. Slowdown was observed in all the sectors except community, social and personal services. The sector recorded lower growth of 10.2 percent in the fi rst quarter of 2008/09, 9.6 percent in the second quarter of 2008/09 and 9.5 percent in the third quarter of 2008/09.
Fiscal Developments
The Interim Budget 2009/10 was presented against the backdrop of uncertainties in the global economy and its attendant effects on Indian economy since the middle of September 2008. The thrust of the Budget is to keep the economy on the high trajectory of growth by creating demand through increased public expenditure in indentifi ed sectors which would lead to a temporary deviation from the path of fi scal consolidation mandated under Fiscal Responsibility and Budget Management (FRBM) Act. The medium-term objective would be to revert to the path of fi scal consolidation with improvement in economic growth.

48 Country Performance / India
ANNUAL REPORT 2008
The revised estimates for 2008/09 showed marked deterioration in all the key defi cit indicators viz., revenue defi cit (RD), gross fi scal defi cit (GFD) and primary defi cit (PD), relative to GDP over their budgeted levels. The deterioration of the defi cit indicators was due to marked deceleration in tax collection as a result of economic slowdown and cut in indirect tax rates on the one hand and substantial hike in expenditure, in particular revenue expenditure, to boost aggregate demand on the other. The gross tax revenue in 2008/09 revised estimates (RE) was lower by 8.7 percent over the Budget estimates (BE) for 2008/09, with collections under all the major taxes showing signifi cant declines from the budgeted level. However, the tax revenue is budgeted to grow by 6.9 percent in 2009/10 compared with 5.9 percent in 2008/09 RE. The GFD is budgeted to improve to 5.5 percent in 2009/10 from 6.0 percent in 2008/09 RE.
Net market borrowing is budgeted at Rs. 3,08,647.0 crore (net of Market Stabilization Scheme (MSS)) and would fi nance 92.7 percent of GFD in 2009/10 as compared with Rs. 2,66,539.0 crore (81.6 percent) in the previous year.
The State Governments presented their budgets for 2008/09 against the backdrop of continued efforts to achieve fi scal correction and consolidation. The rule-based fi scal regime for the State Governments as stipulated in
their respective Fiscal Responsibility Legislation (FRL) is slated to reach its fi nal year during 2009/10 for majority of State Governments. The States made substantial progress in meeting the targets stipulated under their FRLs, which have been enacted by all State Governments, except Sikkim and West Bengal. The efforts of State Governments towards reducing fi scal imbalances were aided by larger devolution and transfers from the Centre based on the recommendations of the Twelfth Finance Commission (TFC) along with improvement in tax buoyancy on the strength of macroeconomic fundamentals. All twenty eight States have implemented Value Added Tax (VAT) in lieu of State sales tax. VAT has turned out to be a buoyant source of revenues for the States.
During 2008/09, GFD as a percentage of GDP is budgeted to decline from 2.3 in 2007/08 RE to 2.1 percent of GDP in 2008/09 while PD would remain unchanged at the previous year’s level.
Monetary Developments
Broad Money (M3) increased by 19.9 percent as on February 13, 2009 on a year-on-year (YoY) basis, as compared with 21.6 percent a year ago. Growth in bank credit moderated during 2008/09 so far from the strong pace of the previous three years. Bank credit to commercial sector expanded by 18.8 percent YoY

49Country Performance / India
ANNUAL REPORT 2008
as on February 13, 2009 as compared with 20.5 percent growth a year ago. Acceleration of growth in aggregate deposits to 20.3 percent, as on February 13, 2009 from 22.8 percent a year ago, largely accommodated the credit expansion. Commercial banks’ holdings of Government securities was 29.0 percent of their net demand and time liabilities (NDTL) as on February 13, 2009 from 28.7 percent a year ago.
On a YoY basis, growth in reserve money was 4.3 percent as on February 27, 2009 as compared with an increase of 26.8 percent last year. Adjusted for the fi rst round effect of the hike in cash reserve ratio (CRR), reserve money growth was 17.9 percent as compared with 19.4 percent a year ago.
Price Situation
Headline infl ation, measured by YoY changes in the wholesale price index (WPI) increased to an intra-year peak of 12.9 percent on August 2, 2008 from 7.7 percent at the end of March 2008. This mainly refl ected the impact of some pass-through of international crude oil prices to domestic prices as well as elevated levels of prices of iron and steel, basic heavy inorganic chemicals, machinery and machine tools, oilseeds/oil cakes, raw cotton and textiles on account of strong demand as well as international commodity price pressures. Subsequently,
infl ation declined sharply to 3.0 percent as on February 21, 2009 (5.7 percent a year ago). The easing in infl ation during 2008/09 so far was mainly led by the decline in the prices of items in the fuel group, non-ferrous metals and some manufactured products items. Primary articles infl ation, YoY, eased to 6.0 percent on February 21, 2009 from 8.7 percent a year ago mainly refl ecting the easing of primary non-food articles infl ation to 1.7 percent from 12.4 percent a year ago, led by the decline in the prices of oilseeds and raw cotton. Fuel group infl ation, increased to an intra-year peak of 18.0 percent on August 2, 2008 from 6.8 percent at the end of March 2008 mainly due to increase in the prices of minerals oils refl ecting the effect of the hikes in the prices of petrol (Rs. 5.0 per litre), diesel (Rs. 3.0 per litre) and Liquefi ed Petroleum Gas (LPG) (Rs. 50.0 per cylinder) on June 4, 2008 as well as increase in the prices of freely priced petroleum products. Subsequently, with the easing of international crude oil prices, the Government cut the price of petrol by Rs. 5.0 per litre and diesel byRs. 2.0 per litre effective December 6, 2008 and further by Rs. 5.0 per litre for petrol and Rs. 2.0 per litre for diesel and Rs. 25.0 for LPG effective January 28, 2009. Consequently, the fuel group infl ation eased and was negative at -4.0 percent as on February 21, 2009. Manufactured products infl ation eased to 4.5 percent from a peak of 11.9 percent in August 2008 and 4.6 percent a year ago

50 Country Performance / India
ANNUAL REPORT 2008
due to a decline in the prices of edible oils, basic heavy inorganic chemicals and non-ferrous metals.
Infl ation, based on YoY variation in consumer price indices (CPIs) continued to remain above the WPI infl ation 2008 mainly refl ecting the impact of food prices and higher weight of food articles in CPIs vis-a-vis WPI. Consumer price infl ation for industrial workers increased to 10.4 percent in January 2009 from 7.9 percent in March 2008 and 5.5 percent a year ago.
The extraordinary global developments triggered by the bankruptcy/sellout/restructuring of some of the world’s largest fi nancial institutions since September 2008 resulted in a sharp deterioration in the global fi nancial environment and recession in major advanced economies. India’s growth trajectory has also been impacted both by the fi nancial crisis and the follow-on global economic downturn. Refl ecting these developments, the Reserve Bank adjusted its policy stance from demand management to arresting the moderation in growth. Accordingly, since the middle of September 2008, the Reserve Bank has reduced the repo rate under the liquidity adjustment facility (LAF) from 9.0 percent to 5.0 percent, the reverse repo rate under the LAF from 6.0 percent to 3.5 percent and the CRR from 9.0 percent to 5.0 percent. The aim of these measures was to augment
domestic liquidity and to ensure that credit continues to fl ow to productive sectors of the economy.
Banking Developments
Aggregate deposits of scheduled commercial banks (SCBs) expanded by 21.0 percent, YoY, as on February 27, 2009 as compared with 24.0 percent a year ago led by acceleration in time deposits. Demand for bank credit moderated during 2008/09. Non-food credit extended by SCBs increased by 18.5 percent, YoY, as on February 27, 2009 on top of 22.7 percent a year ago.
Disaggregated data on sectoral deployment of gross bank credit available up to January 30, 2009 showed that about 48.3 percent of incremental non-food credit YoY was absorbed by industry as compared with 43.8 percent in the corresponding period of the previous year. The expansion of incremental non-food credit to industry during this period was led by infrastructure, petroleum, iron and steel, construction, textiles, engineering, chemicals and chemical products and vehicles industries. The infrastructure sector alone accounted for 28.3 percent of the incremental credit to industry as compared with 32.9 percent in the corresponding period of the previous year. The agricultural sector absorbed around 12.4 percent of the incremental non-food bank credit

51Country Performance / India
ANNUAL REPORT 2008
expansion as compared with 10.0 percent in the corresponding period of the previous year. Personal loans accounted for nearly 13.2 percent of incremental non-food credit; within personal loans, the share of incremental housing loans was at 36.4 percent. The outstanding credit under credit card receivables witnessed a sharp increase. Growth rate of loans to commercial real estate remained high in recent months.
External Sector
According to the provisional data released by the Directorate General of Commercial Intelligence and Statistics (DGCI&S), India’s merchandise exports duringApril-January 2008/09 at USD 144.3 billion recorded a decelerated growth of 13.2 percent as compared with 24.2 percent a year ago. Imports during April-January 2008/09 at USD 243.4 billion recorded a lower growth of 25.3 percent as compared with 31.0 percent a year ago mainly due to the moderation in non-oil imports. Non-oil imports decelerated sharply by 21.9 percent as against a growth of 30.5 percent during the similar period of the preceding year. Oil imports during April-January 2008/09 at USD 83.3 billion showed a growth of 32.4 percent as compared with 32.0 percent a year ago. Trade defi cit during April-January 2008/09 widened to USD 99.1 billion, an increase of USD 32.3
billion (48.3 percent) over the trade defi cit of USD 66.8 billion during April-January 2007/08.
Current Account
India’s current account defi cit increased to USD 22.3 billion during April-September 2008 (USD 11.0 billion during April-September 2007) mainly due to widened trade defi cit. The widening of trade defi cit during April-September 2008 could be attributed to higher import payments refl ecting high international commodity prices, particularly crude oil prices. According to the DGCI&S data, while oil imports recorded a signifi cant growth of 59.2 percent during April-September 2008 (17.1 percent in the corresponding period of the previous year), non-oil imports showed a relatively modest growth of 29.4 percent (33.2 percent in the corresponding period of the previous year).
Capital Account
The surplus in the capital account balance moderated during April-September 2008 refl ecting increased gross capital outfl ows on the back of global fi nancial turmoil. While the gross capital infl ows increased to USD 176.3 billion during April-September 2008 from USD 164.5 billion in April-September 2007, the gross capital outfl ows increased from
52 Country Performance / India
ANNUAL REPORT 2008
USD 113.6 billion to USD 156.4 billion during the same period. The gross capital infl ows remained high refl ecting the higher foreign direct investment (FDI) infl ows and non-resident Indian (NRI) deposits during the period.
Net inward FDI was USD 20.7 billion while net outward FDI was USD 6.1 billion contributing to a net FDI infl ow (net inward FDI minus net outward FDI) of USD 14.6 billion duringApril-September 2008 as compared withUSD 4.9 billion during April-September 2007. Portfolio investment witnessed net outfl ows in April-September 2008 as against net infl ows in the corresponding period of the previous year. Mobilisation of resources under NRI deposits, a major constituent of “banking capital” remained high amounting to USD 1.1 billion during April-September 2008 as against a net decline of USD 78.0 million duringApril-September 2007.
The gross disbursements under external commercial borrowings (ECBs) to India remained low during April-September 2008 refl ecting tightening of overseas credit market conditions following the US sub-prime crisis.
Foreign Exchange Reserves
During April-September 2008, the decline in foreign exchange reserves on balance of payments (BOP) basis (i.e., excluding valuation) amounted to USD 20.4 billion as against an accretion of reserves of USD 67.2 billion in April-December 2007. The decline in the reserves was due to widening trade defi cits coupled with moderation in capital fl ows led by foreign institutional investments (FIIs). As on April 17, 2009, the foreign exchange reserve stood at USD 252.5 billion as compared to USD 309.7 billion as at the end of March 2008.
External Debt
India’s total external debt stood at USD 230.9 billion at the end of December 2008 as against USD 224.8 billion at the end of March 2008. The increase in external debt by around USD 6.1 billion between March and December 2008 has been primarily on account of higher level of long-term debt. Over the quarter ended December 2008 the long-term debt recorded an increase of USD 9.4 billion while the short-term debt declined by USD 3.2 billion.

53Country Performance / India
ANNUAL REPORT 2008
India: Trend in Real GDP(At 1999/00 prices)
(In percent)
Year 2006/07 2007/08 2008/092007/08 2008/09
April-December
Agriculture and Allied Activities 4.0(18.5)
4.9(17.8)
2.6(17.1)
5.5(18.1)
0.6(17.1)
Industry 10.7(19.5)
7.4(19.2)
4.2(18.7)
7.9(19.4)
3.5(18.8)
mining and quarrying 8.8 3.3 4.7 2.8 4.7
manufacturing 11.8 8.2 4.1 8.9 3.4
electricity, gas and water supply 5.3 5.3 4.3 5.5 3.2
Services 11.3(62.0)
10.8(63.0)
9.2(64.2)
10.5(62.5)
9.7(64.2)
construction 11.8 10.1 6.5 10.8 9.2
trade, hotels, restaurants and transport, storage, communication 12.8 12.4 10.3 11.9 9.4
fi nancing, insurance, real estate and business services 13.8 11.7 8.6 12.2 9.3
community, social and personal services 5.7 6.8 9.3 5.7 11.2
GDP at Factor Cost 9.7 9.0 7.1 9.0 6.9
Note: Figures in the parenthesis indicate respective percentage share in GDP.
Source: Central Statistical Organisation
Item

54 Country Performance / India
ANNUAL REPORT 2008
India: Foreign Trade(In millions of USDs)
Year 2006/07 2007/08 2007/08 2008/09
April-March April-January
Exports126,362.0 162,904.0 127,454.0 144,266.0
(22.6) (28.9) (24.2) (13.2)
Imports185,749.0 251,439.0 194,285.0 243,358.0
(24.5) (35.4) (31.0) (25.3)
Trade Balance -59,387.0 -88,535.0 -66,830.0 -99,093.0
Source: Directorate General of Commercial Intelligence and Statistics
India: Trade with ACU Member Countries(In millions of USDs)
Year2006/07 2007/08 2008/09
April-March April-October
Exports Imports Exports Imports Exports Imports
Bangladesh 1,628.0 229.0 2,917.0 257.0 1,623.0 218.0
Bhutan 58.0 141.0 87.0 194.0 63.0 98.0
Iran 1,451.0 7,628.0 1,949.0 10,915.0 1,570.0 8,774.0
Myanmar 140.0 783.0 185.0 810.0 126.0 578.0
Nepal 929.0 306.0 1,506.0 628.0 978.0 312.0
Pakistan 1,350.0 323.0 1,944.0 288.0 914.0 254.0
Sri Lanka 2,256.0 471.0 2,825.0 631.0 1,681.0 219.0
ACU 7,810.0 9,880.0 11,413.0 13,723.0 6,956.0 10,454.0ACU’s Share to India’s Total Trade (percent) 6.2 5.3 7.0 5.5 604.0 5.5
India’s Total Trade 126,362.0 185,749.0 162,904.0 251,439.0 108,407.0 189,285.0
Source: Directorate General of Commercial Intelligence and Statistics
Item
Country

55Country Performance / India
ANNUAL REPORT 2008
India: Exports of Major Commodities to ACU Member Countries(In millions of USDs)
Year 2005/06 2006/07 2007/08 2007/08 2008/091 2007/08(Apr-Mar)
2008/091
(Apr-Oct)
April-March April-October Percentage Change
Petroleum, crude and products 1,483.0 1,711.0 2,774.0 1,980.0 1,950.0 62.2 -1.5
Engineering goods 1,773.0 1,831.0 2,189.0 1,236.0 1,481.0 19.5 19.8
Chemicals and related products 1,162.0 1,407.0 1,683.0 982.0 1,142.0 19.6 16.3
Rice 169.0 157.0 780.0 310.0 260.0 396.4 -16.0
Cotton raw incl waste 95.0 246.0 525.0 48.0 81.0 113.8 69.4
Cotton yarn, fabrics, madeups, etc. 393.0 389.0 508.0 238.0 345.0 30.6 44.9
Sugar and mollases 82.0 530.0 392.0 224.0 332.0 -26.0 48.3
Oil meals 109.0 188.0 269.0 137.0 163.0 43.4 19.4
Manmade yarn, fabrics, madeups 152.0 153.0 199.0 92.0 184.0 29.9 99.9
Fresh vegetables 101.0 139.0 179.0 76.0 129.0 29.4 68.7
Spices 52.0 97.0 148.0 85.0 108.0 51.8 28.0
Paper/wood products 118.0 117.0 135.0 71.0 106.0 16.0 48.9
Other cereals 60.0 66.0 77.0 34.0 45.0 17.4 31.4
Tea 32.0 48.0 67.0 31.0 48.0 38.8 52.4
Coal 60.0 69.0 62.0 23.0 28.0 -10.6 22.5
Others 795.0 663.0 789.0 402.0 554.0 18.9 37.7
Total Export to ACU 6,636.0 7,810.0 10,776.0 5,969.0 6,956.0 38.0 16.5
India’s Total Exports 103,091.0 126,362.0 162,904.0 87,805.0 108,407.0 22.6 23.5
Percentage Share to India’s Total Exports 6.4 6.2 6.6 6.8 6.4 - -
1 Provisional data.
Source: Directorate General of Commercial Intelligence and Statistics
Commodity

56 Country Performance / India
ANNUAL REPORT 2008
India: Imports of Major Commodities from ACU Member Countries(In millions of USDs)
Year 2005/06 2006/071 2007/081 2007/08 2008/09 2007/08(Apr-Mar)
2008/092
(Apr-Oct)
April-March April-October Percentage Change
Petroleum, crude and products 0.0 6,915.0 10,077.0 5,102.0 8,037.0 45.7 57.5
Pulses 288.0 362.0 383.0 257.0 294.0 5.7 14.2
Wood and products 275.0 290.0 368.0 183.0 237.0 26.8 29.7
Chemicals, organic and inorganic 290.0 325.0 359.0 177.0 470.0 10.5 165.7
Non-ferrous metals 350.0 358.0 284.0 181.0 100.0 -20.7 -44.6
Transport equipments 3.0 4.0 253.0 4.0 3.0 5,568.8 -21.8
Iron and steel 215.0 204.0 249.0 112.0 112.0 22.2 0.2
Textile yarn, fabrics, madeup articles 153.0 175.0 246.0 104.0 140.0 40.8 35.2
Metalliferrous ores and metal scrap 77.0 94.0 215.0 166.0 247.0 127.9 49.2
Fertilizers 43.0 61.0 136.0 69.0 131.0 124.0 89.6
Fruits and nuts excl. cashew nuts 85.0 166.0 122.0 61.0 51.0 -26.9 -17.5
Spices 52.0 40.0 78.0 30.0 51.0 95.0 66.4
Artfi cial resins, plastic material, etc. 39.0 35.0 65.0 31.0 44.0 83.6 41.2
Electric machinary excl. electronic 30.0 58.0 51.0 27.0 28.0 -12.1 2.9
Vegetable oils fi xed (edible) 7.0 36.0 51.0 30.0 6.0 40.5 -79.9
Others 675.0 757.0 872.0 495.0 503.0 15.3 1.7
Total Import from ACU 2,581.0 9,880.0 13,808.0 7,029.0 10,454.0 39.8 48.7
India’s Total Imports 149,166.0 185,749.0 251,439.0 133,149.0 189,285.0 35.4 42.2
Percentage Share to India’s Total Imports 1.7 5.3 5.5 5.3 5.5 - -
1 Revised data.
2 Provisional data.
Note: Commodity-wise data for 2006/07 are provisional while the total import fi gures are revised.
Source: Directorate General of Commercial Intelligence and Statistics, and Ministry of Commerce and Industry
Commodity

57Country Performance / India
ANNUAL REPORT 2008
India: Exports from Special Economic Zones (SEZs)(In Rs. crores)
Year 2006/07 2007/08
Central Government SEZs 25,358.5 39,275.1State Government/Private SEZs Established prior to SEZ Act, 2005 9,134.5 22,167.4
SEZs Notifi ed under SEZ Act, 2005 121.6 5,195.1
Total 34,614.6 66,637.6
India: Exports from SEZs Established by Central Government(In Rs. crores)
Year Total Turnover
2006/07 2007/08
Kandla Special Economic Zone 1,735.0 2,298.4
SEEPZ Special Economic Zone 12,090.0 11,328.1
Noida Special Economic Zone 6,998.0 17,118.3
MEPZ Special Economic Zone 2,516.7 3,280.9
Cochin Special Economic Zone 1,058.3 4,706.9
Falta Special Economic Zone 1,204.3 1,204.6
Visakhapatnam SEZ 924.0 1,233.7
Total 26,526.3 41,170.9
Source: Ministry of Commerce Website
Item
Item

58 Country Performance / India
ANNUAL REPORT 2008
India: Exports from State/Private SEZ Established prior to SEZ Act(In Rs. crore)
Year Total Turnover
2006/07 2007/08
Surat Special Economic Zone 5,313.2 12,444.0
Manikanchan SEZ, W. Bengal 1,018.0 1,775.0
Jaipur SEZ 168.5 -
Indore SEZ 354.7 458.0
Jodhpur SEZ 6.5 30.3
Salt Lake Electronic City-WIPRO, West Bengal 238.6 366.0
Mahindra City SEZ (IT),Tamil Nadu 494.9 763.2
Mahindra City SEZ (Auto ancillary), Tamil Nadu 1.7 41.6
Mahindra City SEZ (Textiles), Tamil Nadu 14.3 26.8
Nokia SEZ 6,561.5 13,253.8
Moradabad SEZ 0.0 11.2
Surat Apparel Park 1.6 6.1
Total 14,173.5 29,176.0
India: Exports through SEZs and EOUs(In millions of USDs)
Year 2003/04 2004/05 2005/06 2006/07 2007/08
SEZs3,015.0
(4.7)4,076.1
(4.9)5,158.7
(5.0)7,687.9
(6.1)16,551.6
(10.2)
EOUs6,273.5
(9.8)8,343.5(10.0)
10,712.0(10.4)
- -
Total9,288.5(14.5)
12,419.6(14.9)
15,870.7(15.4)
- -
Note: Dollar values are derived by using the monthly average rupee dollar exchange rate.
Figures in brackets relate to percentage share in total exports.
Source: www.commerce.nic.in
Source: Reserve Bank of India
Item
Item

59Country Performance / Iran
ANNUAL REPORT 2008
IranIntroduction
During 2007/08 (1386), Iranian economy was stable and smooth. Sharp rise in prices and acceleration of infl ation was a foreseeable phenomenon which was realized. In spite of higher infl ation, other major real sector indicators like Gross Domestic Product (GDP) growth and unemployment rate, did not manifest major changes from medium-term trends.
Other major development in Iran’s economy in 2007/08 was the government’s revision of the expansionary fi scal policy which resulted in change of sources of liquidity expansion. Consequently, the build-up of foreign reserve assets in Central Bank’s balance sheet which was the main source of liquidity growth for many years was substituted by build-up of Central Bank claims on banks. The sharp rise of banks indebtedness to Central Bank in the said year compelled the monetary authority to gradually restrict banks’ access to Central Bank’s funds and resulted in Central Bank of Iran’s (CBI’s) demand for observing more discipline by banks in their credit and lending operations.
On the fi scal front, the overall assessment of the implementation of government
budget in 2007/08 was government’s major efforts to raise tax and non-tax revenue as well as reducing the budget dependence on oil income. On the expenditure side of government budget, major endeavors were directed towards the containment of current expenditure and the attainment of a higher and more acceptable realization of acquisition of the non-fi nancial assets.
Favorable developments in the global crude oil market in tandem with the rising trend of non-oil exports brought about the positive development in the external sector. However, intensifi cation of the sanctions imposed on the Iranian agents and organizations, especially Iranian banks, and their limited access to conventionally international banking and fi nancial instruments decelerated foreign fi nancing and raised import costs, which in turn increased reliance on domestic resources for fi nancing imports.
National Income
Based on preliminary estimates, GDP at current prices rose from Rls. 2,038.0 trillion in 2006/07 to Rls. 2,623.0 trillion in

60 Country Performance / Iran
ANNUAL REPORT 2008
Real Sector
Based on preliminary estimates, the value-added of the agriculture sector grew by 6.2 percent in 2007/08, showing a rise when compared with the 4.7 percent growth of the previous year. The review year witnessed remarkable growth in the production of farming, horticultural, and livestock products. This was mainly attributable to increased and well-distributed rainfall as well as rise in banking facilities and government budget resources allocated to this sector.
Iran’s average crude oil production, in adherence to the production quotas set by the Organization of Petroleum Exporting Countries (OPEC), amounted to 4.1 mb/d in 2007/08. Crude oil exports increased by 2.0 percent to 2.5 mb/d; however, exports of oil products plummeted by 25.2 percent to 199.0 thousand b/d compared with the previous year. The average spot price of Iran’s crude oil export grew by 30.9 percent to about USD 78.0.
2007/08, showing 28.7 percent growth in nominal terms and 6.9 percent growth in real terms, which indicates 0.7 percentage point increase at constant prices compared with the previous year. Meanwhile, non-oil GDP registered 7.6 percent growth, up by one percentage point compared with 2006/07.
According to preliminary fi gures, “agriculture”, “construction”, “transport, storage, and communication”, and “social, personal, and household services” groups had the greatest contribution to the economic growth in 2007/08. The share of the value-added of “agriculture” group in GDP was 0.9 percentage point, “oil” 0.1 percentage point, “manufacturing and mining” 2.7 percentage points, and “services” 3.5 percentage points.
Based on preliminary estimates, in 2007/08, private consumption expenditures grew by 9.1 percent at constant 1997/98 prices, while public consumption expenditures declined by 4.3 percent.

61Country Performance / Iran
ANNUAL REPORT 2008
Electricity generation amounted to 203.8 billion kwh, up by 5.9 percent compared with the previous year. Of total generated electricity, 190.2 billion kwh (93.3 percent) was generated by power plants affi liated to the Ministry of Energy and 13.6 billion kwh (6.7 percent) by other institutions. In this year, the highest amount of electricity (91.1 billion kwh) was generated by steam power plants while diesel power plants accounted for the lowest amount of generation (0.2 billion kwh). Meanwhile, the highest growth in generation of electricity belonged to gas and combined cycle power plants by 9.3 percent; however, the amount of electricity generated by hydroelectric power plants showed 1.7 percent decline.
According to preliminary estimates, manufacturing and mining sector exhibited a relatively favorable growth of 8.7 percent in 2007/08. The value-added for manufacturing and mining sectors were estimated at 8.3 and 17.7 percent, respectively. Of special note is that, according to the Fourth Five-Year Development Plan (FFYDP) Law, the Plan target for manufacturing and mining sectors was 11.0 percent. The growth rate in production of petrochemicals by 32.7 percent, and growth in production of construction materials (due to remarkable growth of supply in housing sector), and also mineral products such as copper ore and iron ore, by respectively 22.7 and 18.5
percent, contributed to the realization of high growth in manufacturing and mining sectors.
According to the Ministry of Industries and Mines, 8,135.0 operation permits were issued for new manufacturing establishments and expansion of existing units, up by 20.3 percent compared with the previous year. Required investment and job opportunities based on operation permits increased by 68.1 and 14.6 percent, respectively. Per capita investment based on operation permits was Rls. 1.8 million.
In this year, the Ministry of Industries and Mines issued 48.2 thousand establishment permits for the establishment of new manufacturing units and the expansion of existing units, showing 11.3 percent reduction compared with the previous year. Of the factors responsible for reduction in the number of establishment permits was the obligation to submit a feasibility report to general departments of the Ministry of Industries and Mines in some provinces. The amount of investment required for the establishment of the mentioned units and job opportunities created (in case of operation of manufacturing units) grew by 12.2 and 1.3 percent, respectively, compared with the previous year.
Rebound in housing market which had started in the second quarter of 2006/07

62 Country Performance / Iran
ANNUAL REPORT 2008
Population and Employment
Based on the Statistical Center of Iran (SCI) estimates, Iran’s total population
was 71.5 million persons in 2007/08, of whom 49.6 million dwelled in urban and the remainder in rural areas.
Of the key objectives of the FFYDP is to reduce unemployment rate to 8.4 percent by the end of the Plan (2009/10). According to the data drawn by the SCI in the “Labor Force Survey”, unemployment rate stood at 10.5 percent in 2007/08, showing 0.8 percentage point decline compared with 2006/07. This rate was 12.5 percent for urban areas and 6.6 percent for rural areas, showing 0.9 and 0.5 percentage point fall, respectively, in urban and rural areas.
Unemployment rates among male and female population were 9.3 and 15.8 percent, respectively. This is indicative of a fall in the unemployment rate for both men and women. Of major challenges the labor market is facing with in the coming years are increased participation rate of women and the growing number of female university graduates.
in urban areas, ran into 2007/08, and boosted construction activities. The noticeable growth in private sector investment in new buildings in urban areas (at current prices), by 80.7 percent to Rls. 205.2 trillion, was an indicator of this boom. Similarly, investment in new buildings in small and medium-sized cities amounted to Rls. 106.4 trillion, pointing to a signifi cant growth of 104.9 percent. The same growth was observed in Tehran and other large cities (53.0 percent for Tehran and 65.6 percent for other large cities).
The total number of residential buildings constructed by private sector in 2007/08 came to 491.9 thousand with a total fl oor space of 60.7 million square meters. This shows 9.8 and 9.2 percent growth in number and fl oor space, respectively, compared with the previous year.

63Country Performance / Iran
ANNUAL REPORT 2008
1 Excluding the fi gure for transparency in the price of energy bearers.
Government Budget and Finance1
Budget Law for 2007/08, as the third Budget Law during the course of the Fourth Plan (2005-10), was drawn up within the framework of the Twenty-Year Vision Plan, general policies of the government, the Fourth Plan, as well as sectoral, trans-sectoral and provincial Development Plan Documents of the country.
Government general budget sources and uses (approved) reached Rls. 639,451.7 billion. Total government budget sources include revenues, with a share of 43.4 percent, disposal of non-fi nancial assets 27.5 percent, and disposal of fi nancial assets 29.1 percent. Expenses, acquisition of non-fi nancial assets, and acquisition of fi nancial assets constituted respectively 62.5, 28.8, and 8.7 percent of the approved uses out of these sources.
Government general revenues amounted to Rls. 298,203.1 billion in the review year, showing 29.0 percent growth compared with the previous year. Share of tax revenues in total revenues declined from 65.6 percent in 2006/07 to 64.3 percent in the review year. Government tax revenues rose by 26.5 percent toRls. 191,815.3 billion in 2007/08.
In the review year, the government expenses rose to Rls. 421,334.1 billion, representing 1.3 percent increase against
the previous year. Meanwhile, national expenses declined by 0.9 percent, and provincial expenses grew by 7.9 percent, constituting respectively 72.6 and 27.4 percent of government expenses.
Government paid a total of Rls. 147,715.8 billion for the acquisition of non-fi nancial assets, indicating 1.5 percent growth compared with the year before. Of total payments by the government for the acquisition of non-fi nancial assets, 76.7 percent were in the form of national and 23.3 percent in the form of provincial expenses.
Therefore, the government operating balance ran a defi cit of Rls. 123,131.0 billion, indicating a reduction of 33.3 percent against Rls. 184,657.3 billion defi cit in the year before. Net disposal of non-fi nancial assets amounted to Rls. 27,076.1 billion, down by 27.3 percent compared with the previous year. Government operating and non-fi nancial balance, due to operating balance defi cit and surplus in net disposal of non-fi nancial assets, posted Rls. 96,054.9 billion defi cit, showing a decline of 34.8 percent compared with the previous year defi cit of Rls. 147,431.2 billion. This was largely attributable to a decrease in the operating balance defi cit. Operating and non-fi nancial balance defi cit was mainly fi nanced through withdrawals from the Oil Stabilization Fund (OSF).

64 Country Performance / Iran
ANNUAL REPORT 2008
External Sector
Positive developments in the global crude oil market and upward trend of non-oil exports improved the external sector signifi cantly. Based on the preliminary data, total foreign exchange receipts from export of goods, which were largely related to oil and gas export, reached USD 97,401.0 million in 2007/08. Total oil and gas export revenues (including crude oil, natural gas, oil products, and gas condensates) grew by 31.9 percent to USD 81,764.0 million. Non-oil exports (customs and non-customs) also rose by 11.3 percent to USD 15,637.0 million.
According to the data released by Iran’s Customs Administration, 32,118.0 thousand tons of goods worthUSD 15,312.0 million were exported in the review year, indicating respectively 15.7 and 17.8 percent rise in terms of weight and value compared with the previous year. Total non-oil exports (customs and non-customs) grew by 11.3 percent toUSD 15,637.0 million in 2007/08 as compared with the year before. Total value of imports (through customs) reached USD 48,439.0 million, up by 16.1 percent compared with the fi gure for 2006/07. Weight of goods imported amounted to 41,696.0 thousand tons, showing a fall of 4.1 percent against the year before. Total value of imports, including non-customs imports, reached USD 56,582.0 million in 2007/08, up by 13.1 percent compared
with the preceding year. It should be mentioned that the difference between customs imports and total imports is related to adjustment on customs data for full coverage of imports.
Trade balance, therefore, posted a surplus of USD 40,819.0 million in the review year. This, together with theUSD 7,199.0 million defi cit in foreign services balance and the USD 461.0 million surplus in the transfers account, resulted in the USD 34,081.0 million surplus in the current account of balance of payments (BOP). However, non-oil currentaccount ran a defi cit of USD 47,683.0 million, up by 14.6 percent compared with the previous year defi cit ofUSD 41,609.0 million. This indicates the greater role of oil sector in the external sector of the Iranian economy. Moreover, balance of the OSF grew by 89.1 percent to USD 38,871.0 million at the end of 2007/08.
Foreign exchange obligations increased by 23.9 percent from USD 45,338.0 million

65Country Performance / Iran
ANNUAL REPORT 2008
at the end of 2006/07 to USD 56,184.0 million at the end of 2007/08. Outstanding amount of actual obligations at the end of 2007/08 reached USD 28,647.0 million, up by 21.8 percent compared with the previous year-end. Contingent foreign exchange obligations, with a 26.2 percent increase, reached USD 27,537.0 million, against USD 21,825.0 million at the end of 2006/07.
compared with the previous year, had the highest share in monetary base growth by 29.6 percentage points. The noticeable rise in CBI’s claims on banks was mainly due to banks’ overdraft from the Central Bank in the review year.
Net foreign assets of the CBI had the highest share (51.5 percentage points) in monetary base growth in 2006/07, which decreased to 24.1 percentage points in 2007/08. Government obligation to implement the approved budget as well as the interbank market capability in absorbing the foreign exchange supplied by the government were the main driving forces behind the fall in the share of net foreign assets in monetary base. Therefore, in 2007/08, the highest share in monetary base growth was related to rise in banks’ indebtedness rather than rise in foreign assets.
Monetary and Credit Policies
The Money and Credit Council (MCC) set the minimum lending rate on the facilities
Money and Banking
Liquidity growth stood at 27.7 percent at the end of 2007/08, indicating 11.7 percentage points reduction against the previous year-end. Among the factors affecting liquidity growth, net foreign and domestic assets of the banking system constituted respectively 3.6 and 24.1 percentage points of liquidity growth.
Monetary base surged by 30.5 percent, representing a rise of 3.6 percentage points against the 26.9 percent rise of the year before. CBI’s claims on banks, with 21.0 percentage points growth

66 Country Performance / Iran
ANNUAL REPORT 2008
extended by public banks for transaction contracts at 12.0 percent for all economic sectors in 2007/08.
Upon reduction of public banks’ lending rates during 2004-08, the minimum expected lending rate of private banks was adjusted in the review year. According to the MCC approval, the minimum expected lending rate on the facilities extended by private banks and credit institutions for transaction contracts was set at 13.0 percent for all economic sectors.
The deposit rates (provisional) of public banks were within a range of 7.0 (for short-term deposits) to 16.0 percent (for fi ve-year investment deposits) as the previous year.
Based on the recommendation of the MCC, the Parliament approved issuance of participation papers by the CBI worth Rls. 40.0 trillion at the provisional profi t rate of 15.5 percent. These papers were tax-exempt with a one-year maturity from the date of issuance.
Payment System
The fi nancial sector in Iran witnessed great developments in the payment system in 2007/08. The Central Bank developed the Real Time Gross Settlement System - SATNA - as the main center for
settlement of Iranian banks’ transactions in Rial. Upon implementation of the fi rst and second phases of this system in 2006/07, real time settlement through the interbank information transfer network - SHETAB - and inter bank clearing house was started in the review year. Since 2007/08, bank-to-bank and customer-to-customer payments were also settled through SATNA. The Retail Funds Transfer System - SAHAB -, launched at the end of 2006/07 for real time transfer of a large volume of payments of relatively small value, was further developed in 2007/08. Moreover, there are further plans to connect Iran’s SHETAB to information transfer networks of other countries.
The upward trend of issuance of electronic cards continued in 2007/08. The number of cards issued by the banking system grew by 64.7 percent to 38.6 million. Among these cards, the growth of debit cards was 78.0 percent (30.2 million), prepaid cards 21.0 percent (8.2 million), and credit cards only one percent (264.0 thousand). The number of Automated Teller Machines (ATMs) rose by 32.8 percent to 9,917.0 in the review year. This shows a moderate growth when compared with the 121.6 percent growth in the number of Points of Sales (POSs) in 2007/08. Total number of POSs reached 427,082.0 in this year; however, the ratio of POSs to population in Iran is much less than this ratio in other countries1. Further expansion of the
1 In 2007, the number of POSs per one million persons averaged 15,862.0 for member countries of the Payment Systems Committee and the Bank for International Settlement (BIS).

67Country Performance / Iran
ANNUAL REPORT 2008
POSs is projected, although its growth is expected to slow down in the future.
The number of interbank electronic transactions processed in SHETAB through ATMs, POSs, and pin pads grew respectively by 43.3, 178.2, and 67.8 percent1, in the last nine months of 2007/08 compared with the same period last year. This brought the total settled transactions to 678.0 million andRls. 435,512.0 billion in the review year.
Capital Market
In 2007/08, inappropriate business climate, regional uncertainties and certain public policies regarding price administration and short-term boom in real estate market gravely affected investors’ decision in this market.
In 2007/08, the Tehran Stock Exchange Price Index (TEPIX) rose by 2.7 percent, “fi nancial index” 0.5 percent, “industrial index” 2.8 percent, “price and dividend index” 17.6 percent, and “cash dividend index” 14.5 percent. On the other hand, “50 top companies index” fell by 19.6 percent. The turnover ratio2 reached 17.1 percent at the end of 2007/08, up from 15.4 percent at the end of 2006/07.
Shares and rights traded in 2007/08 indicated 48.3 and 31.3 percent increase
in the number and value of trading, respectively, compared with the previous year. Meanwhile, market capitalization went up by 17.0 percent, compared with the previous year. Rise in the number and value of traded shares as well as market capitalization is mainly attributable to the transfer of large public fi rms’ shares to the private sector.
In the review year, 8,076.8 million shares of public corporations and institutions, worth Rls. 21,730.0 billion, were offered by the Privatization Organization as well as specialized holding companies. This shows a growth of about 180.0 percent in terms of number and value3.
1 Data are prepared on a monthly basis since June 2006; therefore, fi gures for 2007/08 are not comparable with the previous year.2 It is the ratio of trading value to average current value of shares.3 Of total offered shares, about 89.2 percent were offered by the Iranian Mines and Mining Industries Development and Renovation Organization.
In January 2008, the Executive Bill on the General Policies of Article 44 of the Constitution was approved by the Parliament. Pursuant to the implementation of this Bill, the privatization plan appears to follow an upward trend in the coming years.

68 Country Performance / Iran
ANNUAL REPORT 2008
Price Trends
The consumer price index (CPI) of goods and services advanced 18.4 percent (base year=2004/05), indicating 6.5 percentage points increase compared with the 11.9 percent growth of the previous year. Among the special groups, the price index of “goods”, with 17.4 percent increase compared with the previous year, accounted for 52.0 percent of the rise in the general index. The main group of “food and beverages”, with 21.7 percent rise compared with the year before, raised the general index by 34.0 percent.
In 2007/08, wholesale price index (WPI) increased by 14.9 percent on average. Among major groups, “domestically produced and consumed goods”, with 15.2 percent growth, had a share of 76.7 percent in the rise of the general index.
The producer price index (PPI) rose by 16.8 percent compared with the previous year. Among the special groups, “agriculture, animal husbandry, forestry, and fi shing” by 19.1 percent, “mining and quarrying, manufacturing, and electricity, gas and water supply” by 14.8 percent, and “services” by 17.6 percent growth, accounted for 26.7, 36.1, and 37.2 percent of the increase in the general index, respectively.

69Country Performance / Iran
ANNUAL REPORT 2008
Iran: Major Economic Indicators
Year 2004/05 2005/06 2006/07 2007/08
1997/98=100
Real GDP (at basic price) 398,234.0 420,928.0 446,880.0 477,683.0
Non-oil real GDP 352,363.0 374,784.0 399,334.0 429,736.0
Gross fi xed capital formation 144,359.0 151,685.0 156,730.0 166,129.0
CPI1 100.0 110.4 123.5 146.2
Broad money (in billions of Rls.) 685,867.2 921,019.4 1,284,199.4 1,640,293.0
In percent of GDP
Gross fi xed capital formation 41.0 40.5 39.2 38.7
In millions of USDs
Total debt 23,074.0 24,264.0 23,514.0 28,647.0
medium and long-term 12,821.0 13,578.0 14,414.0 18,756.0
short-term 10,253.0 10,686.0 9,100.0 9,891.0
Total Government revenue 18.1 22.8 20.3 17.8
o/w: oil 10.7 11.0 8.9 6.5
Total Government expenditures 21.6 26.4 27.5 21.4
Overall budget balance 3.5 3.6 7.2 3.6
Inter-bank market exchange rate (Rls/USD) 8,719.0 9,026.0 9,197.0 9,285.01 2004/05=100
Source: Economic Accounts Department & Economic Research and Policy Department, Central Bank of the Islamic Republic of Iran
Item

70 Country Performance / Iran
ANNUAL REPORT 2008
Iran: Ratio of Selected Budget Items to Nominal GDP(In percent)
Year 2003/04 2004/05 2005/06 2006/07 2007/08
Revenues 7.2 7.5 11.9 11.3 11.4
Expenses (current) 16.3 16.7 19.6 20.4 16.1
Acquisition of non-fi nancial assets 6.7 5.2 7.0 7.1 5.6
Operating balance -9.1 -9.3 -7.7 -9.1 -4.7
Operating and non-fi nancial balance -4.0 -3.6 -3.6 -7.2 -3.7
Iran: Electronic Payment Instruments
Year 2006/07 2007/08 Percentage Change
Bank cards 23,437,601.0 38,593,283.0 64.7
ATMs 7,468.0 9,917.0 32.8
POSs 192,765.0 427,082.0 121.6
Pin pads 15,692.0 21,707.0 38.3
Iran: GDP Growth by Economic Sectors(at Constant 1997/98 Prices)
(In percent)
Year 2003/04 2004/05 2005/06 2006/07 2007/08
Agriculture 7.1 2.2 9.3 4.7 6.2
Manufacturing 7.8 8.4 6.7 8.5 10.8
Oil 13.4 2.6 0.6 3.0 0.8
Services 4.7 4.6 5.6 6.5 6.8
Total 6.8 4.8 5.8 6.2 6.9
Source: Economic Research and Policy Department, Central Bank of the Islamic Republic of Iran
Item
Item
Item
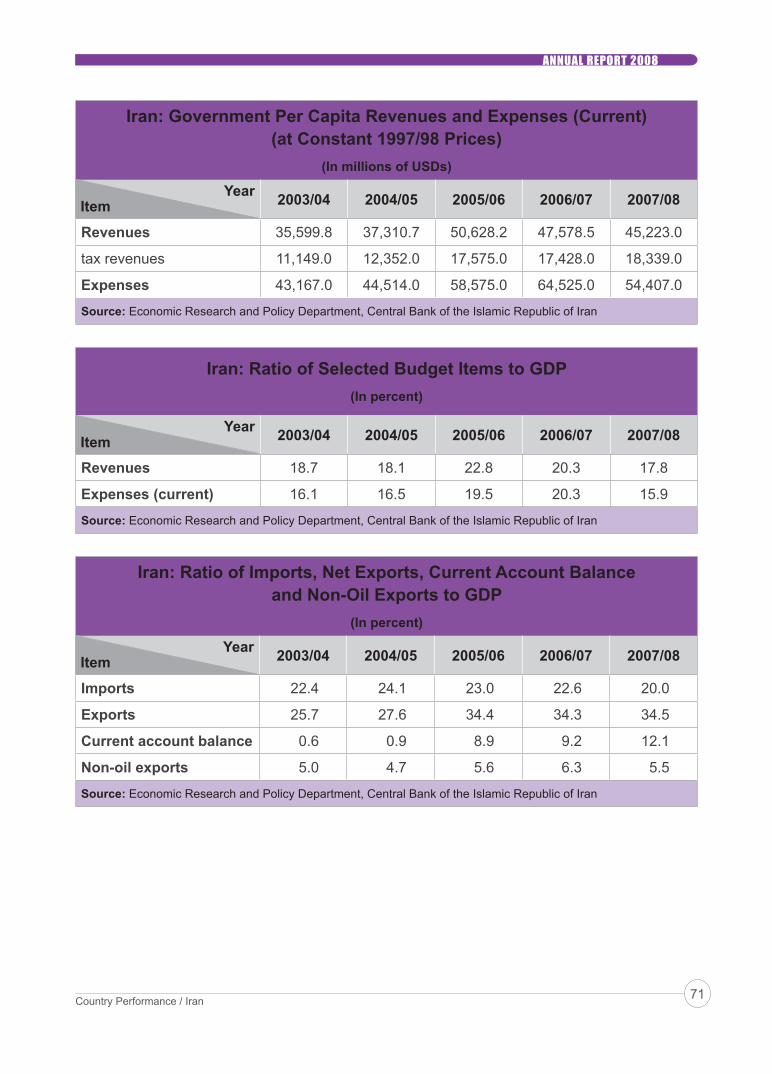
71Country Performance / Iran
ANNUAL REPORT 2008
Iran: Government Per Capita Revenues and Expenses (Current)(at Constant 1997/98 Prices)
(In millions of USDs)
Year 2003/04 2004/05 2005/06 2006/07 2007/08
Revenues 35,599.8 37,310.7 50,628.2 47,578.5 45,223.0
tax revenues 11,149.0 12,352.0 17,575.0 17,428.0 18,339.0
Expenses 43,167.0 44,514.0 58,575.0 64,525.0 54,407.0
Source: Economic Research and Policy Department, Central Bank of the Islamic Republic of Iran
Iran: Ratio of Selected Budget Items to GDP(In percent)
Year 2003/04 2004/05 2005/06 2006/07 2007/08
Revenues 18.7 18.1 22.8 20.3 17.8
Expenses (current) 16.1 16.5 19.5 20.3 15.9
Source: Economic Research and Policy Department, Central Bank of the Islamic Republic of Iran
Iran: Ratio of Imports, Net Exports, Current Account Balanceand Non-Oil Exports to GDP
(In percent)
Year 2003/04 2004/05 2005/06 2006/07 2007/08
Imports 22.4 24.1 23.0 22.6 20.0
Exports 25.7 27.6 34.4 34.3 34.5
Current account balance 0.6 0.9 8.9 9.2 12.1
Non-oil exports 5.0 4.7 5.6 6.3 5.5
Source: Economic Research and Policy Department, Central Bank of the Islamic Republic of Iran
Item
Item
Item
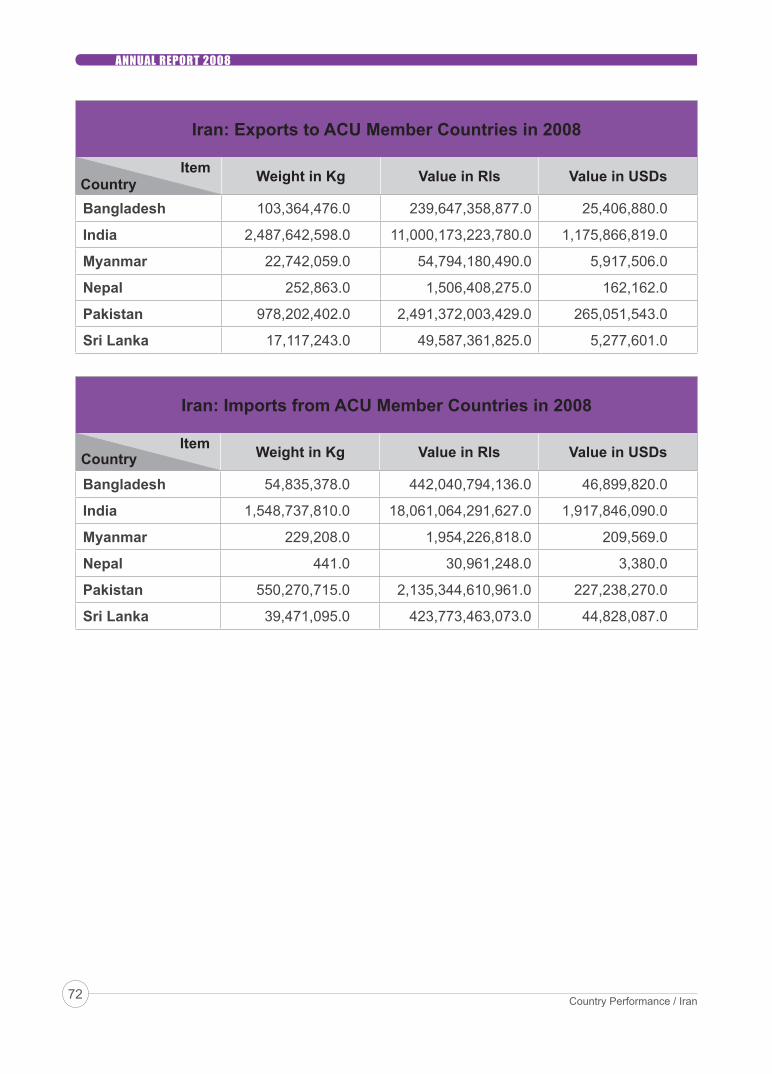
72 Country Performance / Iran
ANNUAL REPORT 2008
Iran: Exports to ACU Member Countries in 2008
Item Weight in Kg Value in Rls Value in USDs
Bangladesh 103,364,476.0 239,647,358,877.0 25,406,880.0
India 2,487,642,598.0 11,000,173,223,780.0 1,175,866,819.0
Myanmar 22,742,059.0 54,794,180,490.0 5,917,506.0
Nepal 252,863.0 1,506,408,275.0 162,162.0
Pakistan 978,202,402.0 2,491,372,003,429.0 265,051,543.0
Sri Lanka 17,117,243.0 49,587,361,825.0 5,277,601.0
Iran: Imports from ACU Member Countries in 2008
Item Weight in Kg Value in Rls Value in USDs
Bangladesh 54,835,378.0 442,040,794,136.0 46,899,820.0
India 1,548,737,810.0 18,061,064,291,627.0 1,917,846,090.0
Myanmar 229,208.0 1,954,226,818.0 209,569.0
Nepal 441.0 30,961,248.0 3,380.0
Pakistan 550,270,715.0 2,135,344,610,961.0 227,238,270.0
Sri Lanka 39,471,095.0 423,773,463,073.0 44,828,087.0
Country
Country
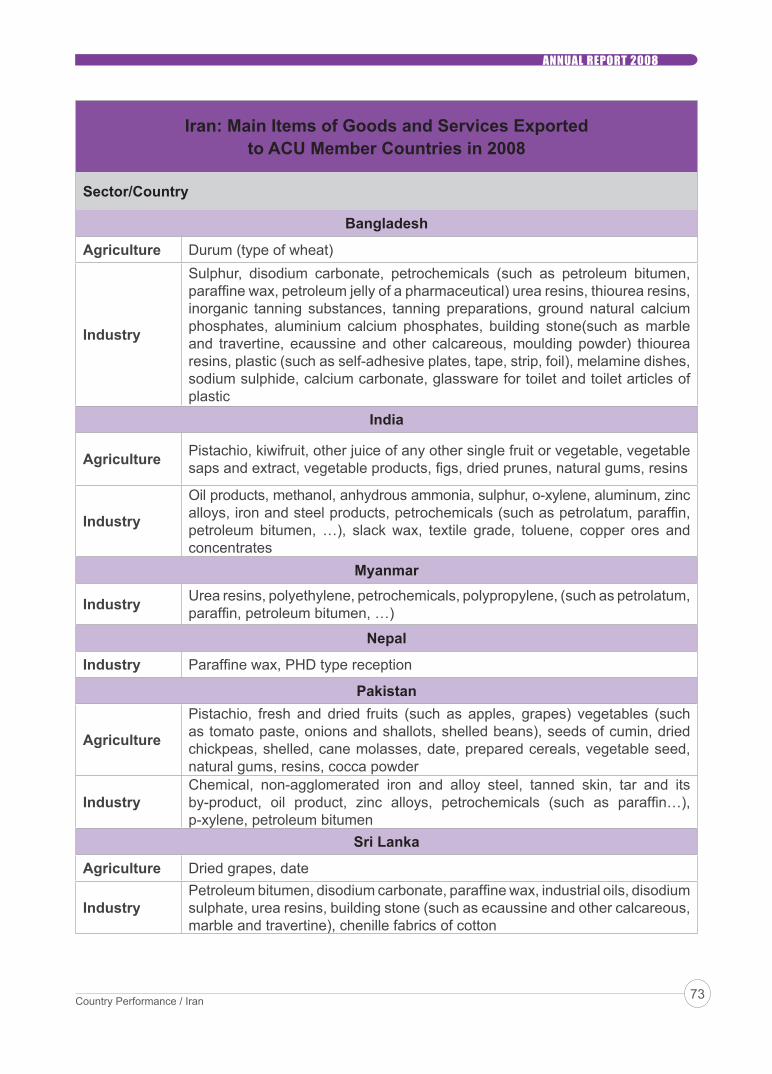
73Country Performance / Iran
ANNUAL REPORT 2008
Iran: Main Items of Goods and Services Exportedto ACU Member Countries in 2008
Sector/Country
Bangladesh
Agriculture Durum (type of wheat)
Industry
Sulphur, disodium carbonate, petrochemicals (such as petroleum bitumen, paraffi ne wax, petroleum jelly of a pharmaceutical) urea resins, thiourea resins, inorganic tanning substances, tanning preparations, ground natural calcium phosphates, aluminium calcium phosphates, building stone(such as marble and travertine, ecaussine and other calcareous, moulding powder) thiourea resins, plastic (such as self-adhesive plates, tape, strip, foil), melamine dishes, sodium sulphide, calcium carbonate, glassware for toilet and toilet articles of plastic
India
Agriculture Pistachio, kiwifruit, other juice of any other single fruit or vegetable, vegetable saps and extract, vegetable products, fi gs, dried prunes, natural gums, resins
Industry
Oil products, methanol, anhydrous ammonia, sulphur, o-xylene, aluminum, zinc alloys, iron and steel products, petrochemicals (such as petrolatum, paraffi n, petroleum bitumen, …), slack wax, textile grade, toluene, copper ores and concentrates
Myanmar
Industry Urea resins, polyethylene, petrochemicals, polypropylene, (such as petrolatum, paraffi n, petroleum bitumen, …)
Nepal
Industry Paraffi ne wax, PHD type reception
Pakistan
Agriculture
Pistachio, fresh and dried fruits (such as apples, grapes) vegetables (such as tomato paste, onions and shallots, shelled beans), seeds of cumin, dried chickpeas, shelled, cane molasses, date, prepared cereals, vegetable seed, natural gums, resins, cocca powder
IndustryChemical, non-agglomerated iron and alloy steel, tanned skin, tar and its by-product, oil product, zinc alloys, petrochemicals (such as paraffi n…), p-xylene, petroleum bitumen
Sri Lanka
Agriculture Dried grapes, date
IndustryPetroleum bitumen, disodium carbonate, paraffi ne wax, industrial oils, disodium sulphate, urea resins, building stone (such as ecaussine and other calcareous, marble and travertine), chenille fabrics of cotton

74 Country Performance / Iran
ANNUAL REPORT 2008
Iran: Main Items of Goods and Services Importedfrom ACU Member Countries in 2008
Sector/Country
Bangladesh
Industry Textiles, cabled yarn, sack kraft paper, polyurethanes, jute, cotton yarn, gelatin empty capsules, battery carbon electrodes
India
Agriculture Black tea, vegetable saps, vegetable seed, fruit (such as coconuts, …)
Industry light oils and preparations gasoline, carbon electrodes, iron/steel line pipe, cold metal-rolling mills, fl at/-rolled iron/steel, aluminum
Myanmar
Agriculture Dried adzuki beans, shelled
Nepal
Industry Other parts (excl. of glass or plastics) of lamps and lighting fi ttings, table linen of other textiles, handbags
Pakistan
AgricultureRice, vegetable products, sesame seeds, fresh and dries fruit, juice fruit, garlic, potatoes, live bovine animals, dried chickpeas, shelled, garlic, castor oil seeds
Industry Textile, polystyrene
Sri Lanka
Agriculture Black and grean Tea, coconut, nutmeg, vegetables
IndustryFibreboard, bags and carton, iron/steel cloth, grill, netting and fencing, paper, linseed oil, animal or vegetable fertilizer, activated natural mineral products, cotton wadding
Source: Central Bank of the Islamic Republic of Iran

75Country Performance / Myanmar
ANNUAL REPORT 2008
MyanmarCurrent Economic Performance
The Government of Myanmar has been formulating and implementing economic short-term plans with a view to achieve balanced economic development in all the economic sectors since the fi nancial year (FY) 1992/93. The previous three consecutive economic short-term plans; 1992/93 to 1995/96, 1996/97 to 2000/01, 2001/02 to 2004/05, achieved with high growth rates.
The fourth fi ve-year economic short-term plan has been formulated from 2006/07 to 2010/11. FY 2007/08 was the second year of the fourth fi ve-year plans and the growth rate of real Gross Domestic Product (GDP) recorded 11.9 percent. Reviewing the past six years trend, the growth rate of real GDP recorded in average of 13.0 percent.
During FY 2007/08, Agriculture, livestock, fi shery and forestry sector are the main contributor to GDP with the share of 44.0 percent, followed by 36.0 percent of the services and other sector and industry sector of 20.0 percent respectively.
Looking at the past trend, the share of agriculture, livestock, fi shery and forestry sector in the total GDP indicating 1.0 percent only decreased from the previous year but slightly decreased to 3.0 percent from 2005/06. The share of industry sector in the total GDP has been rising trend. On the other hand, services and other sector decreased to 6.0 percent compared to a year ago. It can be said that the growth refl ected a more diversifi ed and expansion in industry sector.
Fiscal Sector
The Government emphasized the

76 Country Performance / Myanmar
ANNUAL REPORT 2008
development of the infrastructure sector and encouragement of the private sectors’ economic activities. The government has also focused its expenditure on the provision of essential services building of dams, health and housing. Accordingly, these efforts have caused substantial increased in government expenditures during the recent years.
Looking at the revenue side, various tax reform measures have been taken including broadening the tax base, adjusting tax rates and strengthening tax administration and enhancing the State Economic Enterprises (SEEs) performance resulted in a substantial increase in revenue. Therefore, the tax revenues have been rising.
However, the government revenue has been offset by the increase in government expenditure, especially increase in salaries of government employees in 2006/07. Consequently, the government budget continued to remain in defi cit.
Monetary Sector
Growth in aggregate bank deposits accelerated to 32.0 percent during 2007/08. Bank credit to commercial sector expanded by 13.0 percent during 2007/08. The banking system remains the main mobilizer of funds in the economy. Monetary policy continues to support economic growth in 2007/08. However,
maintaining accommodative monetary stance became more challenging particularly in light of inflationary pressures.
The Central Bank of Myanmar has monitored the domestic banks by issuing instructions and using the on-site examination and off-site monitoring.
To promote efficient payments mechanisms, Payment System Committee and Banking Network Committee have been organized under the guidance of the Central Bank of Myanmar since 2006/07. The Central Bank of Myanmar developed and adopted strategy for modernizing the payment system particularly, fund transfer among domestic banks.
To develop capital market in Myanmar, the government actively encouraged to cooperate with the Association of Southeast Asian Nations (ASEAN) Capital Market Forum and made discussions with Asian Development Bank (ADB) and International Monetary Fund (IMF) to have a technical assistance. The capital market committee urged the banks and fi nancial institutions to contribute to the expansion of the stock market.
Price Trend
The infl ation rate in 2007/08 measured by the consumer price index (CPI) increased
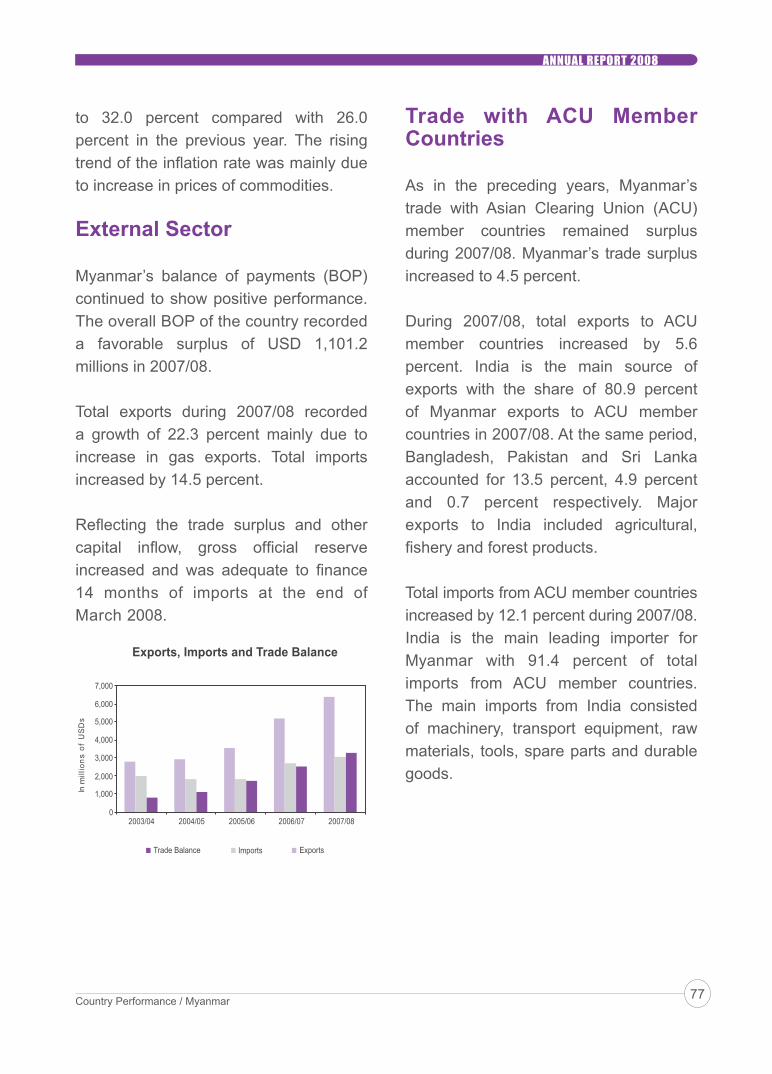
77Country Performance / Myanmar
ANNUAL REPORT 2008
Trade with ACU Member Countries
As in the preceding years, Myanmar’s trade with Asian Clearing Union (ACU) member countries remained surplus during 2007/08. Myanmar’s trade surplus increased to 4.5 percent.
During 2007/08, total exports to ACU member countries increased by 5.6 percent. India is the main source of exports with the share of 80.9 percent of Myanmar exports to ACU member countries in 2007/08. At the same period, Bangladesh, Pakistan and Sri Lanka accounted for 13.5 percent, 4.9 percent and 0.7 percent respectively. Major exports to India included agricultural, fi shery and forest products.
Total imports from ACU member countries increased by 12.1 percent during 2007/08. India is the main leading importer for Myanmar with 91.4 percent of total imports from ACU member countries. The main imports from India consisted of machinery, transport equipment, raw materials, tools, spare parts and durable goods.
to 32.0 percent compared with 26.0 percent in the previous year. The rising trend of the infl ation rate was mainly due to increase in prices of commodities.
External Sector
Myanmar’s balance of payments (BOP) continued to show positive performance. The overall BOP of the country recorded a favorable surplus of USD 1,101.2 millions in 2007/08.
Total exports during 2007/08 recorded a growth of 22.3 percent mainly due to increase in gas exports. Total imports increased by 14.5 percent.
Refl ecting the trade surplus and other capital infl ow, gross offi cial reserve increased and was adequate to fi nance 14 months of imports at the end of March 2008.
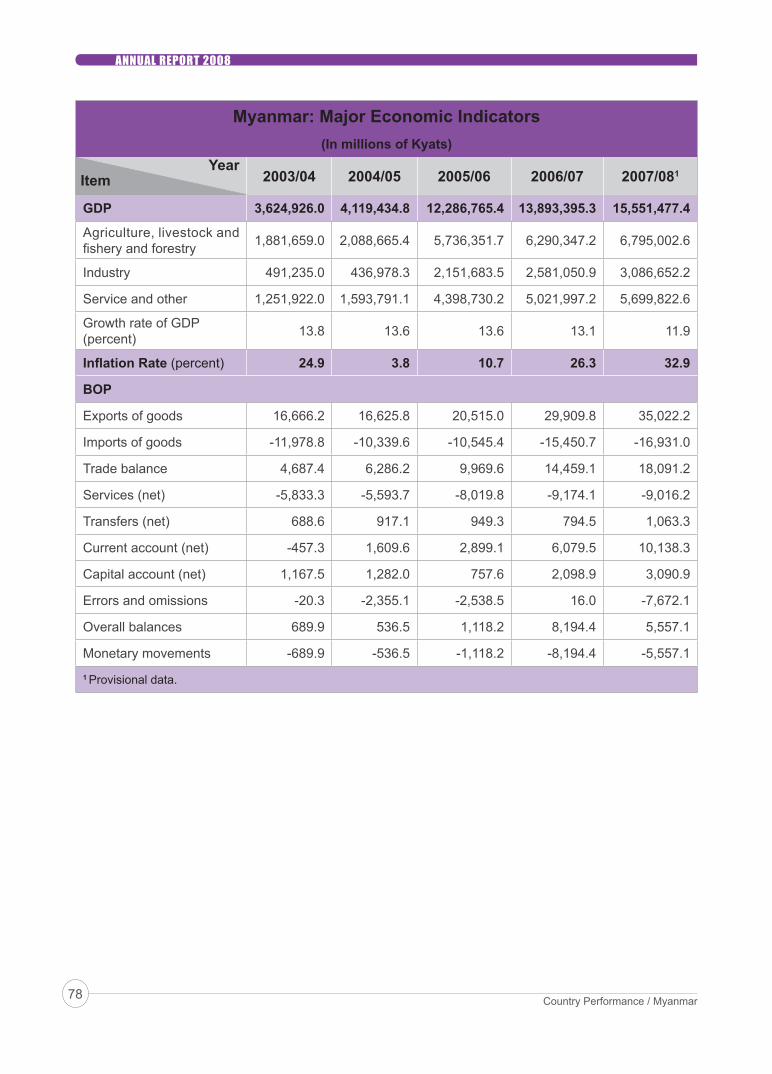
78 Country Performance / Myanmar
ANNUAL REPORT 2008
Myanmar: Major Economic Indicators(In millions of Kyats)
Year2003/04 2004/05 2005/06 2006/07 2007/081
GDP 3,624,926.0 4,119,434.8 12,286,765.4 13,893,395.3 15,551,477.4
Agriculture, livestock and fi shery and forestry 1,881,659.0 2,088,665.4 5,736,351.7 6,290,347.2 6,795,002.6
Industry 491,235.0 436,978.3 2,151,683.5 2,581,050.9 3,086,652.2
Service and other 1,251,922.0 1,593,791.1 4,398,730.2 5,021,997.2 5,699,822.6
Growth rate of GDP (percent) 13.8 13.6 13.6 13.1 11.9
Infl ation Rate (percent) 24.9 3.8 10.7 26.3 32.9
BOP
Exports of goods 16,666.2 16,625.8 20,515.0 29,909.8 35,022.2
Imports of goods -11,978.8 -10,339.6 -10,545.4 -15,450.7 -16,931.0
Trade balance 4,687.4 6,286.2 9,969.6 14,459.1 18,091.2
Services (net) -5,833.3 -5,593.7 -8,019.8 -9,174.1 -9,016.2
Transfers (net) 688.6 917.1 949.3 794.5 1,063.3
Current account (net) -457.3 1,609.6 2,899.1 6,079.5 10,138.3
Capital account (net) 1,167.5 1,282.0 757.6 2,098.9 3,090.9
Errors and omissions -20.3 -2,355.1 -2,538.5 16.0 -7,672.1
Overall balances 689.9 536.5 1,118.2 8,194.4 5,557.1
Monetary movements -689.9 -536.5 -1,118.2 -8,194.4 -5,557.11 Provisional data.
Item
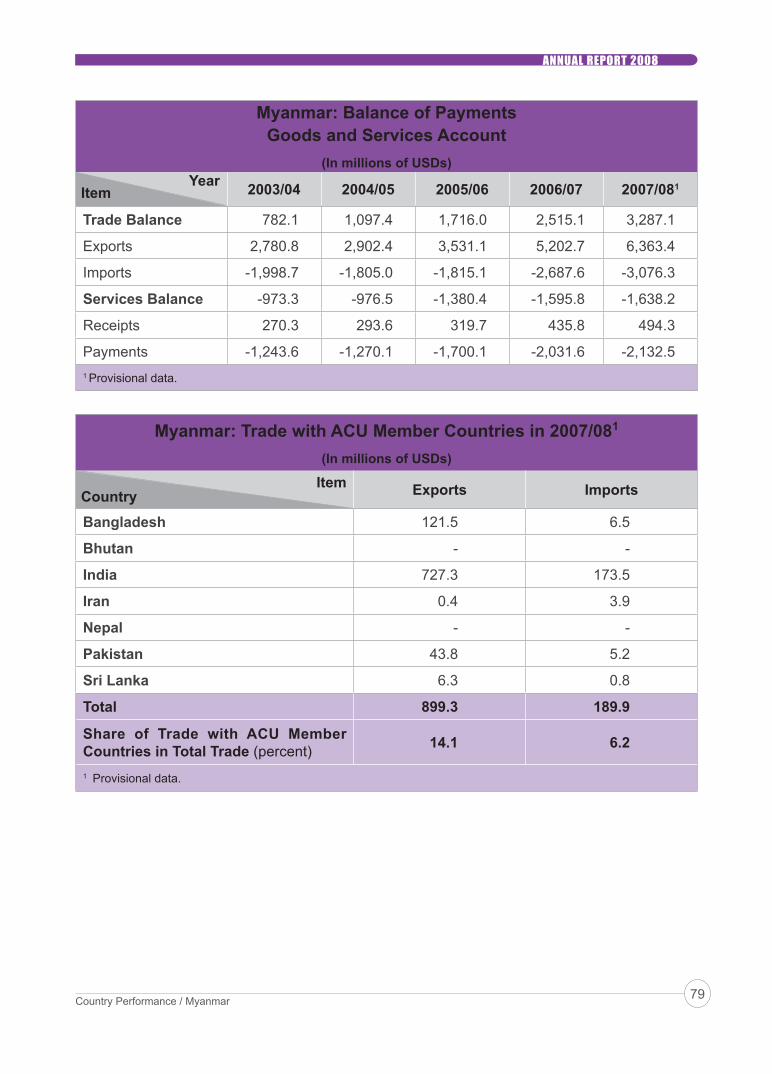
79Country Performance / Myanmar
ANNUAL REPORT 2008
Myanmar: Balance of PaymentsGoods and Services Account
(In millions of USDs)Year 2003/04 2004/05 2005/06 2006/07 2007/081
Trade Balance 782.1 1,097.4 1,716.0 2,515.1 3,287.1
Exports 2,780.8 2,902.4 3,531.1 5,202.7 6,363.4
Imports -1,998.7 -1,805.0 -1,815.1 -2,687.6 -3,076.3
Services Balance -973.3 -976.5 -1,380.4 -1,595.8 -1,638.2
Receipts 270.3 293.6 319.7 435.8 494.3
Payments -1,243.6 -1,270.1 -1,700.1 -2,031.6 -2,132.51 Provisional data.
Myanmar: Trade with ACU Member Countries in 2007/081
(In millions of USDs)
Item Exports Imports
Bangladesh 121.5 6.5
Bhutan - -
India 727.3 173.5
Iran 0.4 3.9
Nepal - -
Pakistan 43.8 5.2
Sri Lanka 6.3 0.8
Total 899.3 189.9
Share of Trade with ACU Member Countries in Total Trade (percent) 14.1 6.2
1 Provisional data.
Item
Country

80 Country Performance / Myanmar
ANNUAL REPORT 2008
Myanmar: Main Items of Goods and Services Exportedto ACU Member Countries in 2007/08
Sector/CountryBangladesh
Agriculture Rice, various beansLivestock and Fishery Fishery products
IndiaAgriculture Various beans, plywoodLivestock and Fishery Fishery products
Pakistan
Agriculture Various beans, bamboo stick, fl ower broom stick, fresh ginger, tamarind with seeds
Industry Medical herbs and crude drugsSri Lanka
Agriculture Forest products
Myanmar: Main Items of Goods and Services Imported fromACU Member Countries in 2007/08
Sector/CountryBangladesh
Industry Medicine, medical equipmentIndia
Industry
Raw material for AME product, tractor, raw material for tractor, component parts for tractor, raw material for trailer, pharmaceutical raw materials, raw material for x2000 Jeep, CKD for TE 21 truck, aluminum plastic, yellow soft, supply and commission, engineering supply and commissioning, electrical and instrument spare, metformin, tundish coating motor, medicine, covered electrode, surgical dressing, malted milk, transformer accessories, tractor, motion picture, textile dyes, ink, cinema ARC carbon, medical equipment, staplers, insect ides, acetic acid, lubricants, steel fi les for alloy steel, orissa pan, tower, medicines, bakery and confectionery
IranIndustry Engine oil
PakistanIndustry Medicine, herbal medicine, medical equipment
Sri LankaIndustry RubberSource: Myanmar Foreign Trade Bank and Myanmar Investment and Commercial Bank
Source: Central Bank of Myanmar

81Country Performance / Nepal
ANNUAL REPORT 2008
NepalReal Sector
The real Gross Domestic Product (GDP) at producers’ price grew by a four-year high of 4.7 percent in 2007/08 compared to a growth of 3.2 percent in the previous year. The robust performance of agriculture sector coupled with the satisfactory expansion of service sector helped grow the economy to a peak of four years. In the review period, agriculture sector grew by 5.7 percent compared to 1.0 percent in the previous year. The non-agriculture sector expanded by 5.6 percent in 2007/08 compared to a growth of 4.1 percent in the previous year.
Monetary Sector
In 2007/08, broad money (M2) expanded by 25.2 percent compared to a growth of 14.0 percent a year ago. Narrow money (M1) also registered a growth of 21.6 percent compared to a growth of 12.2 percent in the previous year. A signifi cant increase in both Net Foreign Assets (NFA) and Net Domestic Assets (NDA) contributed to such a substantial increase in monetary aggregates in the review year. Similarly, the time deposit grew by 27.0 percent in 2007/08 from 14.9 percent a year ago, due to an elevated level of
remittance infl ow. The domestic credit increased by 20.9 percent compared to a growth of 16.7 percent in the previous year. Such an increase in domestic credit was on account of a higher growth of private sector credit.
NFA, after adjusting foreign exchange valuation gain/loss, rose by 22.5 percent (Rs. 29.7 billion) compared to a growth of 4.2 percent (Rs. 5.9 billion) in the previous year.
Stock Market
In 2007/08, stock market activities expanded, including the growth in the market capitalization and stock turnover. The year-on-year (YoY) Nepal Stock Exchange (NEPSE) index increased by 40.9 percent to 963.4 points in the middle of July 2008, from 684.0 points a year ago.
The market capitalization of the listed shares, which stood at Rs. 186.3 billion in the middle of July 2007, increased by 96.6 percent to Rs. 366.3 billion in the middle of July 2008. The market capitalization to GDP ratio reached 44.6 percent in the middle of July 2008, from 25.6 percent a year ago. Similarly, the

82 Country Performance / Nepal
ANNUAL REPORT 2008
ratio of the monthly turnover to market capitalization stood at 0.7 percent in themiddle of July 2008, compared to 0.8 percent a year ago.
The Nepalese stock market continued to be highly concentrated and dominated by the stocks of commercial banks. The total number of companies listed at NEPSE reached 142 in the middle of July 2008, compared to 135 a year ago. Among the currently listed companies, 112 are bank and fi nancial institutions. Of the total market capitalization, bank and fi nancial institutions had the highest share of 89.3 percent.
Infl ation
In 2007/08, the annual average consumer infl ation rate rose to 7.7 percent from a level of 6.4 percent in 2006/07. The rise in food prices and the price hike in the petroleum products were the driving factors for infl ation in 2007/08.
The annual average wholesale price surged by 9.1 percent in 2007/08 compared to an increase of 9.0 percent in the previous year. The higher level of annual average wholesale price infl ation was mainly due to the increase in prices of imported commodities.
Fiscal Developments
Nepal maintained the fi scal discipline
due to both the containment of overall expenditure and a pick up in revenue mobilization. Though the resources showed a growth on account of high growth of revenue mobilization and foreign cash grants, the widening gap between expenditure and resources led to an expansion in fi scal defi cit. As a result, the budget defi cit grew in 2007/08 compared to that of 2006/07.
In 2007/08, total government expenditure, on a cash basis, went up by 18.5 percent to Rs. 148.6 billion compared to a rise of 23.3 percent in 2006/07. While recurrent expenditure grew by 18.0 percent toRs. 87.5 billion in 2007/08 compared to the growth of 14.8 percent a year earlier, capital expenditure went up by 32.2 percent to Rs. 42.7 billion compared to an increase of 57.7 percent in the preceding year.
Total government revenue registered a signifi cant growth of 22.6 percent toRs. 107.6 billion in 2007/08 compared to an increase of 21.3 percent a year ago. Such an impressive growth of revenue was on account of substantial increase in the import of merchandise goods and the resulting increase in customs duties, Value Added Tax (VAT) revenue and excise duties, the increase in income tax as well as in non-tax revenue.
Amongst the components of revenue, the VAT collection increased by 19.2 percent to

83Country Performance / Nepal
ANNUAL REPORT 2008
Rs. 31.2 billion. It had increased by the same rate of 19.2 percent in 2006/07. Customs revenue increased by 18.6 percent toRs. 19.8 billion in 2007/08 in contrast to a rise of 9.0 percent in the previous year. Income tax revenue increased by21.4 percent to Rs. 19.2 billion in 2007/08. It had increased by 42.7 percent in the previous year. Also the non-tax revenue increased by 29.0 percent toRs. 21.3 billion in 2007/08. In the previous year, non-tax revenue had increased by 17.2 percent. Excise revenue increased by 20.0 percent to 11.2 billion compared to an increase of 43.0 percent in the previous year.
VAT remained the largest source of revenue collection with a contribution of 29.0 percent on total revenue in 2007/08, compared to 29.8 percent in the previous year. With the largest share in revenue generation, VAT has remained the backbone of Nepalese revenue administration as envisaged by the Government of Nepal (GON) while introducing it. In terms of contribution, VAT was followed by customs duty with a contribution of 18.4 percent income tax with 17.8 and excise duty with 10.4 in total revenue mobilization. In the previous year, the contribution of customs duty was 19.0 percent, income tax was 17.9 percent and excise duty was 10.7 percent.
Foreign cash grants recorded a signifi cant increment of 37.5 percent to Rs.17.5
billion in 2007/08. In the previous year, the government had received Rs. 12.8 billion in foreign cash grants.
In 2007/08, the GON’s budget defi cit increased to Rs. 21.2 billion, compared to a defi cit of Rs. 18.8 billion in 2006/07. The ratio of budget defi cit to GDP stood at 2.6 percent as in the previous year.
The domestic fi nancing of the budget defi cit through issuance of securities stood at Rs. 20.5 billion. For this purpose the GON issued fresh treasury bills ofRs. 12.5 billion, development bonds worth Rs. 6.1 billion and citizen saving bonds of Rs. 1.9 billion.
The ratio of domestic fi nancing to GDP stood at 2.5 percent in 2007/08. Total outstanding domestic debt (including the government balance with the Nepal Rastra Bank (NRB)) increased toRs. 106.0 billion in 2007/08 compared to Rs. 96.1 billion in 2006/07.
The foreign cash (loans) fi nancing of the budget declined to Rs. 3.9 billion in 2007/08. Foreign cash loan of Rs. 4.4 billion was received in the previous year.
The government maintained a cash deposit of Rs. 2.1 billion with the NRB as at the middle of July 2008.
The outstanding public debt (both internal and external) amounted to Rs. 315.9

84 Country Performance / Nepal
ANNUAL REPORT 2008
billion as at the middle of July 2007, which was lower by 2.5 percent compared to that of the previous year. The share of total external debt and internal debt in total outstanding debt remained at 68.6 percent and 31.4 percent respectively in 2007/08. As percent of GDP, such ratios were 30.1 percent and 13.8 percent respectively.
External Sector
In 2007/08, the external sector depicted a marginal rise in the exports. Total exports rose marginally by 2.4 percent compared to a decline of 1.4 percent in the previous year. While exports to India went down by 7.4 percent compared to a rise of 2.5 percent a year ago, exports to other countries soared by 25.5 percent compared to a decrease of 9.6 percent in the previous year. Export to GDP ratio stood at 10.5 percent in 2007/08 compared to that of 11.0 percent a year ago.
The decline in exports to India was on account of the deceleration in the exports of vegetable ghee, textiles, chemicals, rosin and readymade garments. The upsurge in exports to other countries was on account of the rise in exports of pulses, Nepalese paper and paper products, herbs, wheat, noodles, ceramic products, electric wire and stationary.
Total imports rose by 16.1 percent compared to a growth of 12.0 percent in
the previous year. Of the total imports, imports from India increased by 24.7 percent compared to a growth of 8.2 percent in the previous year. And imports from other countries rose by3.5 percent compared to a signifi cant growth of 18.3 percent in the previous year. As a result, the total trade defi cit expanded by 22.2 percent in 2007/08 in comparison to its growth of 19.2 percent a year earlier.
The increase in total imports from India was on accounts of a rise in the import of petroleum products, M.S. billet, vehicles and spare parts, hot rolled sheet in coil and cold rolled sheet in coil, among others. Similarly, the rise of imports from other countries was due to the acceleration of imports of telecommunication equipment and parts, other machinery and parts, transport equipment and parts, video television and parts and polythene granules.
In 2007/08, the merchandise trade defi cit widened by 22.2 percent to Rs. 165.3 billion compared to an increase of 19.2 percent in the previous year. The ratio of merchandise trade defi cit to GDP was 20.0 percent in 2007/08. Of the total, the trade defi cit with India amounted toRs. 105.9 billion and the remaining defi cit of Rs. 59.4 billion with other countries.
Balance of Payments (BOP)
The overall BOP recorded a surplus of

85Country Performance / Nepal
ANNUAL REPORT 2008
Rs. 29.7 billion in 2007/08. The BOP surplus was at a lower level of Rs. 5.9 billion in 2006/07.
The current account was at a surplus of Rs. 21.7 billion in 2007/08. The current account had recorded a surplus ofRs. 900.0 million in 2006/07.
Remittance infl ows recorded an increase of 42.5 percent to Rs. 142.7 billion in 2007/08 compared to an upsurge of2.5 percent to Rs. 100.0 billion in the previous year. The workers’ remittances/GDP ratio increased to 17.4 percent in 2007/08.
Foreign Exchange Reserve
In the middle of July 2008, the gross foreign exchange reserves stood atRs. 212.6 billion, showing a growth of 28.8 percent from the level of Rs. 165.1 billion inthe middle of July 2007. Such reserves
had gone up by barely 0.1 percent in the preceding year. In US dollar terms, the gross foreign exchange reserves went up by 21.9 percent to USD 3.1 billion inthe middle of July 2008. Such reserves had increased by 14.3 percent in the same period of the previous year. Based on the import fi gures of 2007/08, the current level of reserves is adequate for fi nancing merchandise imports of 11.3 months and merchandise and service imports of9.1 months.
Exchange Rate Movement
The Nepalese currency depreciated by5.3 percent vis-à-vis US dollar between the middle of July 2007 and 2008. It had appreciated by 14.3 percent in the corresponding period of the previous year. The exchange rate of one US dollar was at Rs. 68.5 in the middle of July 2008, in comparison to Rs. 64.9 in the middle of July 2007.

86 Country Performance / Nepal
ANNUAL REPORT 2008
Nepal: Exports to ACU Member Countries in 2008
Item Value in NPRs Value in USDs
Bangladesh 4,664,362,564.0 68,092,884.2
Bhutan 142,688,022.0 2,083,036.8
Iran 8,073,443.0 117,860.5
Myanmar 84,125.0 1,228.1
Pakistan 80,681,287.0 1,177,829.0
Sri Lanka 35,146,798.0 513,091.9
Total 4,931,036,239.0 71,985,930.5
Source: Trade Promotion Center, Nepal
Nepal: Imports from ACU Member Countries in 2008
Item Value in NPRs Value in USDs
Bangladesh 491,210,924.0 7,170,962.4
Bhutan 136,425,225.0 1,991,609.1
Iran 74,502,861.0 1,087,633.0
Myanmar 295,834,760.0 4,318,755.6
Pakistan 179,766,273.0 2,624,325.2
Sri Lanka 24,928,849.0 363,924.8
Total 1,202,668,892.0 17,557,210.1
Note: FY 2007/08 starts in the middle of July 2007 and ends in the middle of July 2008.
Source: Trade Promotion Center, Nepal
Country
Country

87Country Performance / Nepal
ANNUAL REPORT 2008
Nepal: Main Items of Goods and Services Exported to ACU Member Countries in 2008
Sector/Country
Bangladesh
Agriculture Lentils (pulses), grouts and meal, cardamom (large), wheat and meslin, plants and parts of plants, etc.
IndustryFood preparations, medicaments, coloring matter of vegetable or animal origin, carboys, bottles and fl asks, stoppers, lid caps and other closures, tanned or crust hides and skins, polyester yarns, machineries, etc.
Bhutan
Agriculture Live poultry, grouts and meal
Industry
Prepared foods obtained by swelling or roasting of cereal or cereal products, food preparations, soaps, uncooked pasta, polyester yarns, carpet, cotton sacks and bags, barbed wire of iron or steel, grill, netting and fencing, stranded wires, statuettes and ornaments plated with precious metals, hydraulic turbines and water wheels, transformers, electric conductors, etc.
Iran
Industry Carpets, jerseys, pullovers, cardigans, woolen shawls, scarves, muffl ers, hats and headgears, etc.
Pakistan
Agriculture Cardamom, plants and parts of plants, etc.
IndustryMedicaments, tanned or crust hides and skins, shawls, scarves, muffl ers, worn clothing and articles, parts of kneading, crushing machines, optical fi bers, bundles and cables, Electro-diagnostic apparatus, etc.
Sri Lanka
Agriculture Lentils
Industry Printed books and brochures, slide projectors, brooms and brushes, etc.

88 Country Performance / Nepal
ANNUAL REPORT 2008
Nepal: Main Items of Goods and Services Imported from ACU Member Countries in 2008
Sector/Country
Bangladesh
Agriculture Vegetable seeds
Industry
Sugar (raw), chocolates (slabs or bars), sweet biscuits, bakers’ wares, juice (vegetable and fruits), water and non alcoholic beverages, animal food, cement, briquettes, lubricating oil, homoeopathic and other medicaments, plastic apparel and gloves binders folders and fi le covers, adhesive dressings, hydraulic brake fl uids garneted stock, woven fabric of cotton, jute and other textiles, knitted and crocheted fabrics, cottont-shirts and vests, cotton undergarments, non-wired glass, ceramic sinks and wash basins, electronic and lead acid accumulators, etc.
Bhutan
Industry Gypsum, coal, M S steel billet, M S billet, hydraulic turbines and water wheels, etc.
Iran
Agriculture Pistachios
Industry Soups and broths and preparations, paraffi n and mineral wax, petroleum bitumen, apparatus of transmission, etc.
Myanmar
Agriculture Dried peas beans, dried leguminous vegetables, betel nuts, etc.
Pakistan
Agriculture Walnuts in shell, dates, fi gs, dried apricots, anise seeds, seeds of caraway, natural gum, resin, etc.
IndustryMarble, cement, medicament, fi lm for colour photography, fl oor covering of polymers and plastics, pet bottle, sacks and bags, woven fabrics, cotton yarn waste, fabric of cotton, infl atable balls, etc.
Sri Lanka
Agriculture Live poultry, black tea
Industry
Chocolates (bars and slabs), vodka, cigarettes (containing tobacco), toiletries, plastic sacks and bags, fl ax yarn, transmission apparatus, orthopedic appliances, electro medical instruments, wooden furniture, etc.
Source: Trade Promotion Center, Nepal
Source: Nepal Rastra Bank

89Country Performance / Pakistan
ANNUAL REPORT 2008
PakistanPakistan, being a gateway to central Asia, enjoys strategically key location in South Asia. On its South lies the Arabian Sea which adds considerable weight to Pakistan’s strategic role in international political sphere.
The country has a total area of 796,095.0 sq Km with huge oil & gas resources, millions of hectare cultivatable agricultural land, forests, mines of coal and other minerals resources, etc.
Over the past 50 years, the average annual per capita Gross Domestic Product (GDP) growth has remained around 2.0 percent. During 2007/08, the agriculture sector contributes 20.9 percent in total GDP. The industrial sector has 25.9 percent share and the remaining 53.2 percent is contributed by the services sector.
Agriculture Sector
Pakistan’s principal natural resources are arable land and water. It also has signifi cant other mineral resources such as natural gas, copper, coal marble, etc. About 25.0 percent of Pakistan’s total land area is under cultivation and is watered by one of the largest irrigation systems in
the world. Agriculture accounts for about 20.0 percent of GDP and employs about 44.0 percent of the labor force. According to recent information, the major crops as well as the major fruits covers about 28.0 percent of the total available area. The major agriculture produce include food crops (e.g. wheat, rice, sugarcane, major pulses), cash crop (e.g. cotton); and fruits (e.g. mango and citrus varieties and a number of seasonal fruits).
During fi scal year (FY) 2007/08 (i.e., July 2007-June 2008), agriculture sector experienced a slowdown in growth. While the share of major crops in the total value addition by the agriculture sector reduced by 3.0 percentage points, the minor crops, which includes pulses, vegetables, etc. showed recovery during this period.
Manufacturing Sector
The manufacturing sector is mainly concentrated around traditional low value added industries, whose share in world trade is continuously declining.
During 2007/08, the growth in manufacturing sector declined, with most of the slowdown evident in large scale manufacturing, particularly in cotton

90 Country Performance / Pakistan
ANNUAL REPORT 2008
Energy Resources
The country has extensive energy resources, including sizeable natural gas reserves, proven oil reserves, one of the world’s largest coal reserves and large hydropower potential. Pakistan is among those developing countries where the energy demand has increased sharply in recent years. The supply of energy, on the other hand, has not kept pace with the growing demand. The growth of the energy sector remained slow due to a host of factors such as inadequate institutional framework, fi nancial constraints, sky-rocketing oil prices, high risks, low interest of private sector, heavy costs and complex character of hydrocarbon development. To address these issues, the government is already working on many fronts, including increased utilization of coal reserves, development of small hydro projects, promotion of effi cient use of energy, and acceleration of current programs of alternative energy.
Foreign Investment
The rapid economic growth and relative political stability have led to booming foreign direct investment (FDI) infl ows in Pakistan during the recent years. These infl ows were further strengthened by an aggressive privatization program. Thus, FDI increased from below USD 1.0 billion in 2002/03 to USD 5.2 billion in 2007/08.
ginning, yarn manufacturing, metal sector and the fertilizer production. The slowdown was mainly due to structural weaknesses, e.g., energy and input constraints in the economy.
The external demand for domestic manufactured goods however increased in 2007/08. The textile sector accounted for over 55.4 percent of the country exports, with most of them destined for the North American and European Union (EU) markets. The textile sector has also been the major employer in the manufacturing sector. The other major areas of manufacturing activity include the sugar, fertilizer, automobiles, cement and the pharmaceutical sector.
Services
The services sector, which is the largest employment generating sector in Pakistan, has shown a growth of 8.2 percent in 2007/08. This high growth contributed about three-fourth of total value addition during the year, helped Pakistan’s economy to achieve a respectable growth during 2007/08. The performance of services has improved over the years as a result of broad-based reforms of 1990s and policy focus on deregulating the economy. This is particularly evident in continued improved performance of fi nance and insurance and telecommunication sub-sectors.

91Country Performance / Pakistan
ANNUAL REPORT 2008
was hit by subprime crisis which led to capital fl ight from emerging economies’ stock markets and also increased the risk premium of raising funds from international market. The effect of adverse development on external front was further compounded by political uncertainty and emerging imbalances in Pakistan economy which increased country risk as was refl ected by downgrading of Pakistan’s sovereign ratings. As a result, foreign portfolio investment plunged to USD 36.0 million in 2007/08.
Foreign Trade
Pakistan has been experiencing persistent trade defi cit for the sixth consecutive years. This widening of trade defi cit is attributable essentially to a sharp jump in imports that overshadowed a reasonably strong recovery in export growth. The rise in international commodity prices has played an important role in infl ating the import bill in recent years. Import growth was also sustained by the government’s decision to subsidize the local prices of key fuels.
The main contributor in overall import growth includes higher import of cotton, fertilizer and the power generating machinery in 2007/08. On the other hand, the overall export displayed a remarkable performance due to rising non-textile exports.
Traditionally, the United States (US) and United Kingdom (UK) have been the major sources of FDI in Pakistan.
A signifi cant change in the composition of FDI is also witnessed in the last fi ve years. Oil and gas producing sector have traditionally dominated the preferences of foreign investors which now have been diversifi ed to telecommunication and fi nancial sectors. The increased infl ows in the telecommunication and fi nancial sectors not only benefi ted the consumers in the form of variety of products and low prices but it also contributed signifi cantly in the overall GDP growth through expansion of services.
In the three years (2005-07) foreign fl ows in portfolio investment picked up sharply on account of liquidity comfort in international market and political and economic stability in the country. This enabled Pakistan to raise funds from international capital market, in the form of euro (sukuk) bonds and Global Depository Receipts (GDRs), at favorable rate. At the same time, remarkable performance of stock market also attracted sizeable amount of foreign investment in the last two years. As a result, foreign portfolio investment increased from USD 0.6 billion in 2004/05 to USD 3.3 billion in 2006/07.
However, the congenial international and domestic environment changed in 2007/08. International fi nancial market
92 Country Performance / Pakistan
ANNUAL REPORT 2008
with International Monetary Fund (IMF). This has improved foreign exchange reserves of the country. Also, exports growth has strengthened and imports growth moderated somewhat. This lent strength to the rupee, reducing the impact of an important generator of infl ationary pressures.
This improvement has been reinforced by the reasonably good performance of crops during kharif (April-September) cropping season. These factors appear to have already halted the persistent uptrend in infl ationary pressures in the economy. Together, they could also help support a very modest improvement in the growth outlook for 2008/09.
Large scale manufacturing (LSM) however continued to decline mainly due to (1) energy shortages, (2) slowdown in external demand amid global recession, (3) decline in bank fi nancing for consumer durables due to more cautious lending policies of banks, (4) depreciation of rupee during the fi rst four months of the current fi scal year, as well as (5) easing domestic demand pressures (as both monetary and fi scal policies are focusing on effective demand management).
Consumer price index (CPI) infl ation has eased somewhat, but its persistence at a high level remained a source of concern. With a sustained period of high infl ation, there is always a risk and
Fiscal and Public Debt
During the last eight years (2000-07), Pakistan’s fi scal position improved considerably, given that the overall defi cit had averaged 7.0 percent of GDP during 1990s. The Fiscal Responsibility Act 2004/05 provided a predetermined path of improvement in the key fi scal and debt indicators.
However, during 2007/08, Pakistan’s fi scal defi cit ballooned to 7.4 percent of GDP, a level not observed since 1998/99. This strong rise was due to government’s decision to provide price subsidy on key oil products.
Pakistan’s debt position deteriorated sharply in 2007/08, refl ecting the country’s large fi scal and current account defi cits, as well as slowing economic growth. The ratio of total debt and liabilities (TDL) to GDP, a broad measure of the country’s capacity to sustain debt saw an end to seven years declining trend, rising in 2007/08 to 61.3 percent.
Recent Economic Developments
The macroeconomic stresses on Pakistan’s economy visibly eased during initial months of 2008/09, as the government moved to address the most immediate risks, and entered into a macroeconomic stabilization program

93Country Performance / Pakistan
ANNUAL REPORT 2008
tendency for infl ation to take a chronic form as it becomes entrenched in public’s expectations. The will of the State Bank of Pakistan (SBP) and the government to credibly commit and follow through the stabilization program and tackle the structural weaknesses would play an essential role to fi ght this tendency. SBP has already undertaken aggressive monetary tightening during 2008/09, further increasing the policy rate by 300.0 basis points (bps) in two rounds.
There is a substantial progress on containing fi scal imbalances, with the government moving bravely to reduce subsidies, contain growth in other spending and increase revenues. The result has been an encouraging improvement in some fi scal indicators, including a sharp fall in the fi scal defi cit to 1.9 percent of GDP in fi rst half of 2008/09 as compared to 3.4 percent of GDP during the corresponding period of last year.
After remaining under stress during initial month of 2008/09, Pakistan’s external account showed improvement in the recent months as fall in current account defi cit was complemented by modest revival of fi nancial infl ows. This improvement helped in stabilizing the
exchange rate and building up of foreign exchange reserves. The improvement in current account defi cit is mainly owed to substantial reduction in import bill in the wake of lower import prices and lower demand and impressive increase in workers’ remittances.
On the fi nancing side, modest revival in fi nancial infl ows is registered in the aftermaths of IMF support macroeconomic stabilization program in November 2008. In particular, FDI and the infl ows categorized as other investment depicted considerable increase.
During July-January 2008/09, deceleration in import growth due to ebbing of demand pressures and a fall in international commodity prices, led to a smaller growth in the trade defi cit for the period. Export growth on the other hand also recorded a slowdown during July-January 2008/09. This was due to fall in textile sector exports, which was accompanied by a slower growth in non-textile exports during this period. In the wake of current global recession and domestic structural issues together with the ongoing power crisis in the country, this slowdown in export growth, however, was anticipated.

94 Country Performance / Pakistan
ANNUAL REPORT 2008
Pakistan: Selected Economic Indicators
Year 2006/07 2007/08 2008/09
Period Growth Rate(percent)
Large scale manufacturing Jul-Dec 8.8 5.2 4.7
Exports (fob)1 Jul-Jan 3.4 6.0 8.0
Imports (fob) Jul-Jan 9.0 18.9 5.8
Tax revenue (FBR)2 Jul-Dec 26.7 6.0 27.3
CPI (12 months moving average) Jan 7.7 8.0 21.0
Private sector credit Jul-Jan 10.9 9.9 5.5
Money supply (M2) Jul-Jan 6.4 5.8 1.0
In millions of USDs
Total liquid reserves3 end-Feb 13,316.0 14,039.0 10,148.1
Home remittances Jul-Jan 2,959.0 3,621.0 4,277.0
Foreign investment Jul-Jan 3,417.0 2,261.0 2,213.0
In percent of GDP4
Fiscal defi cit Jul-Dec 1.9 3.4 1.9
Trade defi cit Jul-Jan 5.3 6.2 6.1
Current account defi cit Jul-Jan 3.6 4.6 4.41 It stands for Free on Board.
2 It refers to Federal Board of Revenue.
3 With State Bank of Pakistan (SBP) and commercial banks.
4 Based on full-year GDP in the denominator. For 2007/08 estimated full-year GDP has been used.
Item

95Country Performance / Pakistan
ANNUAL REPORT 2008
Pakistan: Main Items of Goods and Services Tradedwith ACU Member Countries in 2008
(In thousands of USDs)Item Exports Imports
BangladeshArms and ammunition, parts and accessories thereof 320.3 -Articles of stone, plaster, cement, asbestos, mica or similar materials 535.4 807.3Base metals and articles or base metal 959.1 5.7Footwear, headgear, umbrellas, walking sticks, etc. 406.2 14.0Live animals and animals products 183.9 71.5Machinery and mechanical appliances 21,752.5 430.5Mineral products 1,779.7 0.0Miscellaneous manufactured articles 519.6 52.2Natural or cultured pearls, precious or semi precious stones, metals 13.7 -Optical, photographic, cinematographer, measuring, checking, precision apparatus 1,057.5 88.8
Plastics and articles thereof; rubber and articles thereof 1,235.8 284.4Prepared foodstuffs; beverages, spirits, vinegar and tobacco 33,508.7 2,760.0Products of chemical or allied industries 8,911.8 669.4Pulp of wood or of other fi brous cellulosic material 2,150.6 50.3Raw hide and skins, leather, fur skins and articles thereof 4,277.6 135.7Textiles and textile articles 299,520.0 60,206.1Vegetable products 10,321.9 12,561.2Vehicles, aircraft, vessels and associated transport equipment 5,945.0 -Wood and articles of wood 31.3 -Works of arts, collectors, pieces, antiques and special transactions (NES1) 27.0 -Sub-Total 393,457.6 78,137.1
Item Exports Imports
Communication services 14.0 10.5Computer and information services 1.5 12.2Financial services 76.7 187.0Government services 1,262.4 2,715.2Insurance services 147.3 -Other business services -51.7 2,047.9Royalties and license fees 0.0 4.2Transportation 1,616.5 6,472.7Travel 54.7 206.9Sub-Total 3,121.4 11,656.6Total 396,579.0 89,793.71 It stands for not elsewhere specifi ed.Note: Data is based on reporting by the banking channel only.
Minus sign represents refund of loss in weight, quality, claims, and difference in price, etc. in respect of export of services.
Commodity
Services

96 Country Performance / Pakistan
ANNUAL REPORT 2008
Pakistan: Main Items of Goods and Services Tradedwith ACU Member Countries in 2008
(In thousands of USDs)
Item Exports Imports
Bhutan
Base metals and articles or base metal 1.2 74.9
Machinery and mechanical appliances - 34.1
Miscellaneous manufactured articles - 2.3
Plastics and articles thereof; rubber and articles thereof - 34.8
Products of chemical or allied industries 3.5 17.6
Textiles and textile articles 159.0 226.1
Vegetable products 6.5 172.7
Sub-Total 170.2 562.5
Item Exports Imports
Financial services - 0.0
Other business services - -
Transportation - 45.0
Sub-Total - 45.0
Total 170.2 607.5
Note: Data is based on reporting by the banking channel only.
Commodity
Services

97Country Performance / Pakistan
ANNUAL REPORT 2008
Pakistan: Main Items of Goods and Services Tradedwith ACU Member Countries in 2008
(In thousands of USDs)Item Exports Imports
IndiaAnimal or vegetable fats, oils and waxes 9.5 3,848.4Articles of stone, plaster, cement, asbestos, mica or similar materials 4,194.5 4,273.9Base metals and articles or base metal 8,165.5 64,537.5Footwear, headgear, umbrellas, walking sticks, etc. 494.1 5.6Live animals and animals products 986.7 5,580.6Machinery and mechanical appliances 1,274.6 79,522.5Mineral products 184,193.9 69,587.6Miscellaneous manufactured articles 298.4 1,260.8Natural or cultured pearls, precious or semi precious stones, metals 259.0 24.1Optical, photographic, cinematographer, measuring, checking, precision apparatus 2,927.3 1,287.7
Plastics and articles thereof; rubber and articles thereof 2,941.5 100,531.8Prepared foodstuffs; beverages, spirits, vinegar and tobacco 1,372.0 90,062.4Products of chemical or allied industries 6,901.4 533,795.8Pulp of wood or of other fi brous cellulosic material 328.5 3,015.3Raw hide and skins, leather, fur skins and articles thereof 12,394.8 352.6Textiles and textile articles 66,894.1 410,001.1Vegetable products 37,354.0 130,352.1Vehicles, aircraft, vessels and associated transport equipment 963.8 42.0Wood and articles of wood 104.2 242.0Works of arts, collectors, pieces, antiques and special transactions NES 2.4 33.6Sub-Total 332,060.2 1,498,357.4
Item Exports Imports
Communication services 13.4 199.1Computer and information services 108.0 310.3Construction services 0.8 -Financial services 233.8 489.2Government services 1,065.0 426.7Insurance services 70.9 37.1Other business services 1,468.9 35,917.6Personal, cultural and recreational services 64.9 17.4Royalties and license fees 52.9 57.0Transportation 980.2 108,250.5Travel 131.0 393.1Sub-Total 4,189.8 146,098.0Total 336,250.0 1,644,455.4Note: Data is based on reporting by the banking channel only.
Services
Commodity

98 Country Performance / Pakistan
ANNUAL REPORT 2008
Pakistan: Main Items of Goods and Services Tradedwith ACU Member Countries in 2008
(In thousands of USDs)
Item Exports Imports
IranArticles of stone, plaster, cement, asbestos, mica or similar materials 2.1 -
Base metals and articles or base metal 804.8 11,923.7Footwear, headgear, umbrellas, walking sticks, etc. 58.2 0.0Live animals and animals products 199.9 157.4Machinery and mechanical appliances 578.0 3,238.6Mineral products 1,015.9 332,297.1Miscellaneous manufactured articles 433.1 -Natural or cultured pearls, precious or semi precious stones, metals 6.1 -
Optical, photographic, cinematographer, measuring, checking, precision apparatus 1,259.5 -
Plastics and articles thereof; rubber and articles thereof 5,226.3 1,775.5Prepared foodstuffs; beverages, spirits, vinegar and tobacco 492.0 848.3Products of chemical or allied industries 1,532.7 81,578.7Pulp of wood or of other fi brous cellulosic material 0.0 187.8Raw hide and skins, leather, fur skins and articles thereof 439.0 4,359.1Textiles and textile articles 21,049.6 3,574.4Vegetable products 97,724.8 623.4Vehicles, aircraft, vessels and associated transport equipment 2,020.2 -Wood and articles of wood 57.2 -Works of arts, collectors, pieces, antiques and special transactions NES - 6,468.2
Sub-Total 132,899.4 447,032.2Item Exports Imports
Communication services 12.9 0.2Computer and information services 2.8 -Financial services 396.5 91.8Government services 368.1 1,213.8Other business services 51.9 77.6Royalties and license fees - 0.9Transportation - 27,151.3Travel - 28.1Sub-Total 832.2 28,563.7Total 133,731.6 475,595.9Note: Data is based on reporting by the banking channel only.
Commodity
Services

99Country Performance / Pakistan
ANNUAL REPORT 2008
Pakistan: Main Items of Goods and Services Tradedwith ACU Member Countries in 2008
(In thousands of USDs)
Item Exports Imports
Myanmar
Base metals and articles or base metal 6.3 -
Live animals and animals products - 49.1
Machinery and mechanical appliances 84.0 -
Mineral products 112.9 -
Miscellaneous manufactured articles 1.5 -
Optical, photographic, cinematographer, measuring, checking, precision apparatus 25.8 -
Products of chemical or allied industries 1,002.3 -
Raw hide and skins, leather, fur skins and articles thereof 697.4 -
Textiles and textile articles 1,646.0 1,425.1
Vegetable products 191.9 2,965.5
Sub-Total 3,768.1 4,439.7
Item Exports Imports
Communication services - 0.1
Financial services 0.1 0.2
Government services 15.0 493.1
Other business services 0.5 -
Transportation - 343.0
Travel - -
Sub-Total 15.6 836.4
Total 3,783.7 5,276.1
Note: Data is based on reporting by the banking channel only.
Commodity
Services

100 Country Performance / Pakistan
ANNUAL REPORT 2008
Pakistan: Main Items of Goods and Services Tradedwith ACU Member Countries in 2008
(In thousands of USDs)
Item Exports Imports
NepalArticles of stone, plaster, cement, asbestos, mica or similar materials 51.6 -
Base metals and articles or base metal 8.5 123.7
Machinery and mechanical appliances 244.7 263.5
Mineral products 32.5 -
Miscellaneous manufactured articles 12.8 -
Natural or cultured pearls, precious or semi precious stones, metals 1.6 -
Optical, photographic, cinematographer, measuring, checking, precision apparatus 229.0 92.5
Plastics and articles thereof; rubber and articles thereof 564.5 134.9
Prepared foodstuffs; beverages, spirits, vinegar and tobacco 534.5 -
Products of chemical or allied industries 10.1 9.2
Raw hide and skins, leather, fur skins and articles thereof 7.0 52.1
Textiles and textile articles 481.2 -
Vegetable products 576.8 221.7
Sub-Total 2,754.8 897.6Item Exports Imports
Communication services - 56.5
Financial services 41.0 1.1
Other business services 4.5 455.7
Transportation - 63.2
Travel 19.0 26.6
Sub-Total 64.5 603.1
Total 2,819.3 1,500.7
Note: Data is based on reporting by the banking channel only.
Commodity
Services

101Country Performance / Pakistan
ANNUAL REPORT 2008
Pakistan: Main Items of Goods and Services Tradedwith ACU Member Countries in 2008
(In thousands of USDs)Item Exports Imports
Sri LankaAnimal or vegetable fats, oils and waxes 42.4 364.8Arms and ammunition, parts and accessories thereof 43,005.6 -Articles of stone, plaster, cement, asbestos, mica or similar materials 907.4 477.2
Base metals and articles or base metal 11,140.3 1,411.1Footwear, headgear, umbrellas, walking sticks, etc. 302.1 0.0Live animals and animals products 5,390.3 91.7Machinery and mechanical appliances 4,899.3 510.3Mineral products 4,009.7 112.9Miscellaneous manufactured articles 269.2 220.2Natural or cultured pearls, precious or semi precious stones, metals 4.4 -
Optical, photographic, cinematographer, measuring, checking, precision apparatus 173.7 160.7
Plastics and articles thereof; rubber and articles thereof 3,501.3 23,031.6Prepared foodstuffs; beverages, spirits, vinegar and tobacco 3,265.3 715.9Products of chemical or allied industries 12,322.6 1,758.2Pulp of wood or of other fi brous cellulosic material 2,674.7 495.9Raw hide and skins, leather, fur skins and articles thereof 1,869.5 8.9Textiles and textile articles 112,406.1 2,735.5Vegetable products 30,147.8 28,624.4Vehicles, aircraft, vessels and associated transport equipment 650.5 289.6Wood and articles of wood 28.9 1,263.3Works of arts, collectors, pieces, antiques and special transactions NES 0.4 -
Sub-Total 237,011.5 62,272.2Item Exports Imports
Communication services 5.5 11.4Computer and information services 12.1 138.3Financial services 46.3 134.2Government services 1,661.3 1,738.1Insurance services - 34.2Other business services 737.3 2,990.5Royalties and license fees 1.1 0.9Transportation 1,804.9 10,194.7Travel 57.7 407.2Sub-Total 4,326.2 15,649.5Total 241,337.7 77,921.7Note: Data is based on reporting by the banking channel only.
Commodity
Services

102 Country Performance / Pakistan
ANNUAL REPORT 2008
Pakistan: Trade with ACU Member Countries in 2008(In thousands of USDs)
Item Exports Imports
Animal or vegetable fats, oils and waxes 51.9 4,213.2Arms and ammunition, parts and accessories thereof 43,325.9 -Articles of stone, plaster, cement, asbestos, mica or similar materials 5,691.0 5,558.4Base metals and articles or base metal 21,085.3 78,076.7Footwear, headgear, umbrellas, walking sticks, etc. 1,260.6 19.6Live animals and animals products 6,760.8 5,950.2Machinery and mechanical appliances 28,833.0 83,999.5Mineral products 191,144.6 401,997.6Miscellaneous manufactured articles 1,534.6 1,535.5Natural or cultured pearls, precious or semi precious stones, metals 284.8 24.1Optical, photographic, cinematographer, measuring, checking, precision apparatus 5,672.9 1,629.8
Plastics and articles thereof; rubber and articles thereof 13,469.5 125,793.0Prepared foodstuffs; beverages, spirits, vinegar and tobacco 39,172.5 94,386.7Products of chemical or allied industries 30,684.4 617,828.9Pulp of wood or of other fi brous cellulosic material 5,153.9 3,749.2Raw jide and skins, leather, fur skins and articles thereof 19,685.3 4,908.4Textiles and textile articles 502,156.1 478,168.1Vegetable products 176,323.7 175,521.0Vehicles, aircraft, vessels and associated transport equipment 9,579.5 331.7Wood and articles of wood 221.6 1,505.3Works of arts, collectors, pieces, antiques and special transactions NES 29.8 6,501.8
Sub-Total 1,102,121.7 2,091,698.7
Item Exports Imports
Communication services 45.8 277.8Computer and information services 124.3 460.8Construction services 0.9 -Financial services 794.4 903.6Government services 4,371.9 6,586.9Insurance services 218.2 71.3Other business services 2,211.4 41,489.3Personal, cultural and recreational services 64.9 17.4Royalties and license fees 54.0 63.0Transportation 4,401.6 152,520.4Travel 262.6 1,061.8Sub-Total 12,549.8 203,452.3 Total 1,114,671.5 2,295,151.0Note: Data is based on reporting by the banking channel only.
Commodity
Services

103Country Performance / Pakistan
ANNUAL REPORT 2008
Pakistan: Trade with ACU Member Countriesduring 2007-2008(In thousands of USDs)
Item Exports of Commodities Imports of Commodities
2007 2008 2007 2008
Bangladesh 257,798.5 393,457.6 58,246.8 78,137.0
Bhutan 33.4 170.2 - 562.5
India 325,900.2 332,060.2 1,113,881.7 1,498,357.5
Iran 117,816.8 132,899.4 323,568.5 447,032.2
Myanmar 2,575.6 3,768.0 4,045.4 4,439.7
Nepal 2,123.0 2,754.8 789.7 897.6
Sri Lanka 206,690.9 237,011.5 53,616.2 62,272.2
Sub-Total 912,938.4 1,102,121.7 1,554,148.3 2,091,698.7
Item Exports of Services Imports of Services
2007 2008 2007 2008
Bangladesh 4,604.6 3,121.4 7,176.5 11,656.6
Bhutan - - 1.5 45.0
India 10,911.1 4,189.8 119,470.8 146,098.0
Iran 1,442.5 832.3 30,221.2 28,563.7
Myanmar 10.7 15.6 616.6 836.4
Nepal 150.4 64.5 840.2 603.1
Sri Lanka 2,021.5 4,326.2 13,898.6 15,649.5
Sub-Total 19,140.8 12,549.8 172,225.4 203,452.3
Total 932,079.2 1,114,671.5 1,726,373.7 2,295,151.0
Note: Data is based on reporting by the banking channel only.
Country
Country

104 Country Performance / Pakistan
ANNUAL REPORT 2008
Pakistan: Trade with ACU Member Countriesduring 2007-2008(In millions of USDs)
Item Exports of Commodities Imports of Commodities2007 2008 2007 2008
January 77.3 69.2 144.8 295.8February 82.3 73.3 139.2 208.0March 73.0 93.5 117.0 174.0April 83.2 90.3 143.0 176.9May 128.9 96.6 121.4 173.9June 73.6 78.2 118.0 158.0July 67.8 121.4 147.4 201.5August 64.2 118.9 146.6 184.4September 56.1 98.0 121.4 158.9October 61.2 94.5 109.5 152.7November 87.9 81.0 133.2 116.0December 57.4 87.2 112.6 91.6Sub-Total 912.9 1,102.1 1,554.1 2,091.7
Item Exports of Services Imports of Services2007 2008 2007 2008
January 1.4 1.5 14.2 32.8February 1.2 1.4 13.4 23.9March 1.8 -3.0 12.5 22.4April 1.9 1.5 14.2 23.4May 0.9 1.5 10.2 19.3June 2.4 1.5 11.8 15.3July 1.1 0.4 15.8 2.6August 2.0 1.0 17.0 17.1September 1.4 1.6 12.6 14.4October 1.9 1.9 16.7 11.3November 1.6 1.5 17.1 11.3December 1.5 1.8 16.7 9.8Sub-Total 19.1 12.6 172.2 203.5Total 932.0 1,114.7 1,726.3 2,295.2Note: Data is based on reporting by the banking channel only.
Minus sign represents refund of loss in weight, quality, claims, and difference in price, etc. in respect of export of services.
Source: State Bank of Pakistan
Month
Month

105Country Performance / Sri Lanka
ANNUAL REPORT 2008
Sri LankaOverview
The Sri Lankan economy recorded a growth of 6.0 percent in 2008. This is the fourth year in a row that the economy grew by 6.0 percent or over. All key sectors positively contributed to the annual growth. This growth was achieved in the midst of unprecedented and unfavorable developments globally and domestically. The satisfactory performance in the fi rst nine months of the year in the domestic and external sectors slowed down signifi cantly during the last quarter mainly due to global fi nancial crisis. During the fi rst part of the year, food and energy crises in the global economy was threatening the macroeconomic imbalances, raising infl ation and exerting pressures on fi scal balances. In containing the second round effects of increases in prices of imported items, the Central Bank continued its tight monetary policy stance in the fi rst three quarters of 2008. However, the deepening of the fi nancial crisis by September 2008 resulted in a reversal of capital fl ows. With the increased outfl ow of foreign exchange there was a pressure on exchange rate to depreciate. To ensure adequate US dollar liquidity in the foreign exchange market, the Central Bank supplied US dollars to the market while relaxing its policy stance to enhance the
market liquidity and mitigate any harmful impacts on the domestic fi nancial market. Positive trends recorded in the Balance of Payments (BOP) during the previous three years continued to maintain during the fi rst nine months of 2008, but reversed rapidly thereafter. Sudden withdrawal of a large part of investment in Treasury bills and bonds by foreign investors, the hasty claims on short term credit facilities and drying up of commercial fi nancing and severe valuation losses arising from a sharp depreciation of major international currencies against the US dollar resulted in a high defi cit in the BOP by the end of 2008.
Central Bank’s exchange rate policy in 2008 mainly focused more on the stability amidst unprecedented high volatility in global currency markets while allowing some fl exibility to maintain external competitiveness. Refl ecting these developments, the exchange rate appreciated against the US dollar during the fi rst three quarters of 2008 and depreciated in the last quarter with the intensifi cation of the fi nancial crisis.
Gross Domestic Product (GDP) Growth and Infl ation
The GDP grew by 6.0 percent, in real

106 Country Performance / Sri Lanka
ANNUAL REPORT 2008
terms, in 2008, compared to the 6.8 percent growth in 2007 and this was the fourth consecutive year that the economy grew over 6.0 percent. In the fi rst nine months of the year, the economy grew at an impressive rate of 6.5 percent, but decelerated to a growth of 4.3 percent during the last quarter of the year mainly due to the global economic slowdown. All three sectors contributed positively to the annual growth in 2008. The Agriculture sector contributed with the highest sectoral growth of 7.5 percent supported by the record paddy harvest and a signifi cantly high output in fi sh and tea. Both the Industry and Services sectors showed decelerations compared to 2007 and expanded at 5.9 percent and 5.6 percent, respectively. The deceleration in the Industry sector was witnessed in all sub-sectors consisting of factory industry and construction sectors. The Services sector which constitutes the largest share of 59.5 percent in the economy showed only a marginal decline in its share compared to 2007. Other than the import trade and post and telecommunication sub-sectors which expanded at a higher rate during 2008 compared to that of 2007, sub-sectors in the Services sector decelerated. Hotels and restaurants sub-sector showed a contraction. The unemployment rate dropped to 5.2 percent in 2008 as compared to 6.0 percent recorded in 2007, indicating the continuation of the steady declining trend observed over the past few years.
The lagged effect of monetary expansion during 2005-06 was refl ected in demand driven infl ation through 2007 to the middle of 2008. However, in response to the building up of infl ationary pressures in the economy, the Central Bank commenced tightening monetary policy from 2006 onwards. This was instrumental in checking the demand pressure in the economy towards the second half of 2008. The supply side factors led by high international commodity prices including oil prices also caused high infl ation in the fi rst half of 2008. The rate of infl ation as measured by the year-on-year (YoY) change in the offi cial consumer price index (CPI) in Sri Lanka, the Colombo Consumers’ Price Index (CCPI; 2002=100), reached its peak of 28.2 percent in June 2008, and thereafter continuously decelerated to 14.4 percent by December 2008, as a culmination of the reaction to monetary policy, favourable domestic supply conditions and easing of commodity prices in the international market.
Monetary Sector
The conduct of monetary policy by the Central Bank of Sri Lanka (CBSL) in 2008 could be divided into two distinct phases. The fi rst phase, which lasted through the fi rst three quarters, saw a continuation of the tight monetary policy stance pursued by the Central Bank. However, with the deepening of the global fi nancial crisis

107Country Performance / Sri Lanka
ANNUAL REPORT 2008
from the middle of September, the Bank had to relax its policy stance somewhat in order to enhance market liquidity and mitigate the harmful impacts exerted on the domestic fi nancial market.
During the year, the monetary policy stance of the Central Bank was enforced by continuing the more direct approach of curtailing market liquidity by placing stringent quantitative controls on its operating target, the reserve money. This strategy, which was introduced in 2007, was modifi ed in 2008 by setting the targets based on the quarterly averages of daily reserve money. This ensured a more disciplined movement in reserve money by eliminating the temporary impact of transitory components within reserve money. In order to maintain market liquidity at levels consistent with the reserve money targets, the Central Bank also placed restrictions on the access to the reverse repurchase facility at the Reverse Repurchase rate while allowing market participants access over and above this level at a penal rate. In addition, the Bank refrained from purchasing Treasury bills from the primary market except on occasions where the injection of additional liquidity was required to mitigate shortages in market liquidity that arose through supply of foreign exchange by the Central Bank.
The targets on reserve money were revised on several occasions in line
with the changes in the macroeconomic outlook. The signifi cant rise in infl ation, driven by the surge in international commodity prices caused infl ation to rise from the latter half of 2007. In order to contain the second round impact of such increases and to control the rising infl ation expectations, the Central Bank revised downward its original annual average reserve money target of 14.7 percent in April and July 2008 to 12.5 percent and 11.8 percent, respectively. A third revision was made in November 2008, reducing it further to 9.7 percent to maintain the policy stance unchanged in the face of the reduction in the Statutory Reserve Ratio (SRR).
During the fi nal quarter, the Central Bank took measures to safeguard fi nancial system stability from the adverse impacts of the unwinding global fi nancial crisis. The Central Bank had to actively intervene in the foreign exchange market to contain the pressure on the exchange rate resulting from the outfl ow of foreign investments in government securities and the slowdown in other foreign infl ows to the country. The supply of foreign exchange by the Central Bank dried up rupee liquidity in the market and in order to address this, the Bank was required to take steps to enhance market liquidity. During October, the Central Bank eased the restrictions placed on the access to its reverse repurchase facility. Accordingly, the number of times that market participants were allowed

108 Country Performance / Sri Lanka
ANNUAL REPORT 2008
access to the reverse repurchase facility at the reverse repurchase rate was doubled, to 6.0, and further to 10.0, over October 2008. Also, the Bank reduced the SRR applicable to all rupee deposit liabilities of commercial banks in two steps. It was fi rst reduced by 75.0 basis points to 9.3 percent in October while the second revision brought it down to 7.8 percent in November 2008.
The tight monetary policy stance maintained by the Central Bank was able to bring down the high growth in monetary aggregates observed in the previous years to moderate levels. In line with the downward revisions to targeted levels of reserve money, the actual reserve money was maintained within the respective targets during of all four quarters. Meanwhile, the impact of the more restrictive monetary policy stance on monetary developments was re-imposed by the slow-down in real economic activity towards the end of the year. Accordingly, annual reserve money growth at the end of the year stood at 8.5 percent compared to the revised target of 9.7 percent. The growth in credit to the private sector also declined to 7.9 percent by the end of 2008 from 19.3 percent at the end of the previous year. Following these developments, growth in broad money, which was expected to be around 11.0 percent in 2008, decelerated to a single digit level of 8.5 percent by the end of 2008, from 16.6 percent at the end of
the previous year.
Fiscal Sector
The fi scal policy strategy of the government continued to be in the direction enunciated within the overall development strategy of the government enunciated in the “Ten-Year Horizon Development Framework: 2006-16” (Ten-year Vision), which aims at achieving a higher level of economic and social development. Accordingly, the gradual reduction of the overall budget defi cit to a sustainable level is the thrust of the fi scal policy framework.
Despite the sharp reduction in international trade related taxes in 2008, in nominal terms government revenue increased due to strong efforts made by the government through the measures for broadening the tax base, changing the tax rates while providing some exemptions as development initiatives for specifi c areas, and improving tax administration. However, public investment was below the targeted level due to non availability of foreign commercial fi nancing as expected resulting from global fi nancial crisis. There was an overrun in recurrent expenditure due to the increase in expenditure on salaries and wages, pension payments, interest payments, fertiliser subsidy, and counter terrorism activities. The government debt to GDP ratio continued to decline to 81.1 percent

109Country Performance / Sri Lanka
ANNUAL REPORT 2008
by the end of 2008 from 85.0 percent by the end of 2007.
The medium-term fi scal policy priorities continue towards the fi scal consolidation process by maintaining healthy government revenue and rationalizing recurrent expenditure thereby generating revenue surplus to maintain public investment at desirable level. The debt to GDP ratio is also expected to reduce further in the medium-term.
External Sector
Earnings from exports in 2008 totalled USD 8,137.0 million recording a growth of 6.5 percent compared to USD 7,640.0 million recorded in 2007. Exports, which recorded a healthier growth of 12.7 percent during the fi rst eight months of the year, suffered by the contraction in global demand, towards the end of the year. A sharp increase in international commodity prices led imports to grow by 35.3 percent during the fi rst three quarters of 2008 which decelerated signifi cantly in the fi nal quarter. As a result, expenditure on imports grew by 14.0 percent and trade defi cit widened to USD 5,871.0 million in 2008. Earnings from the export of services such as transportation, travel, Information Technology (IT) continued to increase, though there was a decline in earnings from tourism. Sri Lanka has also emerged as a favorite offshore outsourcing destination for specialized services such
as software developments, Information Technology Enabled Services (ITES) including Business Process Outsourcing (BPO) and Knowledge Process Outsourcing (KPO) and other IT related services as well. Worker remittances which grew by 16.7 percent to USD 2,918.0 million partly contributed to compensate the large trade defi cit. However, the current account defi cit more than doubled to USD 3,716.0 million in 2008 from USD 1,401.0 million in 2007 due to increased trade defi cit led by unprecedentedly high import expenditure.
The BOP recorded a surplus of USD 525.0 million by the end of July 2008 due to the favorable external environment. However, with the intensifi cation of global fi nancial crisis from September 2008 triggered a sudden outfl ow of foreign exchange in the last quarter. As a result, the surplus in the capital and fi nancial account was not suffi cient enough to offset the defi cit in the current account leading to an overall defi cit of USD 1,225.0 million in the BOP as at the end of 2008. The gross offi cial reserves which were maintained at a comfortable level equivalent to well over 3 months of imports during the fi rst three quarters of 2008, declined gradually as total foreign outfl ows were higher than total foreign infl ows. By the end of 2008, the gross offi cial reserves reachedUSD 2,561.0 million while external resources including ACU receipts stood at USD 3,799.0 million.

110 Country Performance / Sri Lanka
ANNUAL REPORT 2008
Total external debt of the country, as a percent of GDP decreased to 36.2 percent in 2008, from 43.1 percent in 2007. In US dollar terms, the total external debt increased by 9.4 percent to USD 15,077.0 million in 2008. Of the total medium and long-term debt, the government debt accounts for as much as 92.0 percent, with the remaining 8.0 percent representing borrowings of both the private sector and public corporations and debt obligations to the International Monetary Fund (IMF). Of the government’s external debt stock, concessional debt accounts for about 86.1 percent.
Central Bank’s exchange rate policy in 2008 mainly focused more on the stability amidst unprecedented high volatility in global currency markets while allowing some gradual depreciation to maintain external competitiveness. The rupee strengthened against the US dollar with the announcement of an increase in
foreign investment in Treasury bonds in December 2007 and the weakening of the US dollar against major currencies during the fi rst half of 2008. To mitigate excessive volatility in the foreign exchange market and to ensure that the competitiveness of the export sector is not hurt by an undue appreciation of the rupee, CBSL purchased foreign exchange from the domestic foreign exchange market strengthening its reserves position. With the intensifi cation of the fi nancial crisis, heavy outfl ows of foreign exchange due to the repatriation of short-term investments in the Treasury bills and bonds and payments of high valued petroleum bills exerted heavy pressure on the exchange rate to depreciate in the last quarter of 2008. As a result, by the end of 2008 the depreciation of the rupee against the US dollar was around 3.9 percent as compared to a depreciation of around0.9 percent in 2007.

111Country Performance / Sri Lanka
ANNUAL REPORT 2008
Sri Lanka: Major Economic Indicators
Year 2004 2005 2006 2007 20081
Output and Infl ation (percent change)
GDP (real) 5.4 6.2 7.7 6.8 6.0
Infl ation (annual average) 11.0 10.0 15.8 22.6
Infl ation (point to point) 13.0 7.4 13.5 18.8 14.4
Unemployment 8.3 7.2 6.5 6.0 5.2
Government Finance (percent of GDP)
Total revenue 14.9 15.5 16.3 15.8 14.9
Expenditure and net lending 22.8 23.8 24.3 23.5 22.6
Budget defi cit (with tsunami funds) 7.9 8.4 8.1 7.7 7.7
External Sector (percent change)
Exports 12.2 10.2 8.4 11.0 6.5
Imports 19.9 10.8 15.7 10.2 24.0
Trade balance (million US dollar) -2,243.0 -2,516.0 -3,370.0 -3,657.0 -5,871.0
Overall balance (million US dollar) -205.0 501.0 204.0 531.0 -1,225.0
Total external assets (million US dollar) 3,438.0 4,201.0 4,005.0 4,956.0 3,799.0
Months of imports coverage 5.2 5.7 4.7 5.3 3.3
Monetary Aggregates (percent change)
Broad money (M2b) 19.6 19.1 17.8 16.6 8.5
Reserve money 20.9 15.8 21.2 10.2 1.5
Narrow money 16.6 22.4 12.6 2.7 4.0
Private sector credit 22.1 21.5 24.0 19.3 7.9
Interest Rates (percent)
Repurchase rate (overnight) 7.5 8.8 10.0 10.5 10.5
Reverse repurchase rate (overnight) 9.0 10.3 11.5 12.0 12.0Weighted average prime lending rate (AWPR) 10.2 12.2 15.2 18.0 18.5
Treasury bill rate (91 days) 7.3 10.1 12.8 21.3 17.3
Treasury bill rate (364 days) 7.7 10.4 13.0 20.0 19.11 Provisional data.
Source: Central Bank of Sri Lanka
Item

112 Country Performance / Sri Lanka
ANNUAL REPORT 2008
Sri Lanka: Major Indicators(In percent)
Year 2004 2005 2006 2007 20081
Licensed Commercial Banks
Non-performing loans to gross loans 9.0 6.8 5.5 5.0 6.0
Non-performing loans net of provisions to capital 29.8 16.5 13.0 11.9 16.9
Regulatory capital to risk-weighted assets 10.3 12.8 12.7 13.6 0.0
Return on assets (ROA) 1.4 1.7 1.8 1.9 0.0
Return on equity (ROE) 18.3 16.8 15.6 15.0 0.0
Interest margin to gross income 38.4 39.3 32.9 38.1 33.1
Non-interest expense to gross income 37.2 34.5 25.2 32.0 25.31 Provisional data.
Source: Bank Supervision Department, Central Bank of Sri Lanka
Sri Lanka: Trade with ACU Member Countriesduring 2004-2008(In millions of USDs)
Item Export Import2005 2006 2007 20081 2005 2006 2007 20081
Bangladesh 15.8 18.7 22.8 23.1 8.9 8.0 10.9 9.1
India 566.4 489.5 515.3 418.3 1,835.4 2,172.9 2,610.1 3,443.0
Iran 74.1 83.4 117.1 154.5 523.9 758.9 844.2 1,194.3
Myanmar 2.4 0.1 0.5 0.2 4.1 2.8 5.5 6.7
Nepal 0.4 3.6 0.2 0.2 0.1 0.1 0.1 3.6
Pakistan 43.6 58.4 55.4 71.3 115.6 146.6 178.0 191.9Total Trade with ACU Countries
702.7 653.6 712.7 667.6 2,488.0 3,089.3 3,648.9 4,848.6
Total Trade with the World
6,351.1 6,892.7 7,644.7 8,135.2 8,869.3 10,260.3 11,303.1 14,000.1
1 Provisional data.
Sources: Central Bank of Sri Lanka and Sri Lanka Customs
Item
Country

113Country Performance / Sri Lanka
ANNUAL REPORT 2008
Sri Lanka: Trade through FTZ in 2008
Item Export Import
Total Value (CIF)(In millions of USDs)
As a Percentage ofTotal Exports of theRelevant Country
Total Value (CIF)(In millions of USDs)
As a Percentage ofTotal Imports of theRelevant Country
Bangladesh 12.6 54.5 2.1 23.2
Bhutan - - - -
India 243.1 58.2 438.8 15.5
Iran 13.8 8.9 0.5 0.0
Myanmar 0.0 14.3 0.0 0.7
Nepal 0.1 45.1 0.0 0.3
Pakistan 10.4 14.7 106.0 55.2
Total 280.0 - 547.4 -
Sources: Central Bank of Sri Lanka and Sri Lanka Customs
Country

114 Country Performance / Sri Lanka
ANNUAL REPORT 2008
Sri Lanka: Main Items of Goods and Services Exportedto ACU Member Countries in 2008
Sector/CountryBangladesh
Agriculture Frozen fi sh, vegetables, coconuts, desiccated and fresh, fruits, cocoa powder, copra, smoked rubber-RSS 3, new pneumatic tyres
IndustryCoral and similar, lactose and lactose syrup, insecticides, essential oils, mosquito coils, petroleum gases, paints, yarn, machinery, paper or paperboard, textile material
India
Agriculture
Black tea, cloves, coconut milk powder, coconut desiccated, sugar confectionary, vegetable pepper, crude palm oil, new pneumatic tyres, smoked rubber, pale crepe and brown crept, fruits, fresh arecanuts, nutmeg, mace, fl owers, fresh fruits, cocoa nuts, oil cake, cuttle fi sh and squid cinnamon, turmeric, copra, margarine
Industry
Billets of refi ned copper, aluminium alloys, single or multi cored wire and cable, standard wire, cables of copper, unbleached kraft paper or paperboard, waste and scrap of stainless steel, wire of aluminium not alloyed, antibiotics, anodised wire of lacqueres enamelled, electric conductors, electrical discharge or fi lament lamps, fi breboard of a density, zinc not alloyed, magnetic or optical readers, marble, travertine and alabaster, refi ned copper unwrought, pains and varnishes, fats and oils, coral and similar balsams, lead oxides, tetrahydrofuran, organic compounds, connectors, apparel and clothing accessories, glycerol, ash and residues, stearic acid, fatty acids and acidoils, surgical gloves, trunks and suitcases, lorries, soap, yarn, woven fabric, air-conditioning machines
Iran
Agriculture Black tea, coconuts-in shell, fresh, desiccated, coir fi ber, rubber products, copra
Industry Fibreboard of a density, textile materialsMyanmar
Agriculture Types of rubber, nutmegIndustry Paints, garments, accessories
NepalAgriculture Black tea, desiccated coconuts, copraIndustry Labels, articles of apparels clothing accessories, copper waste and scarp
Pakistan
AgricultureBlack tea and green tea & other, betal leaves, copra, coconuts in shell (fresh), desiccated coconut, smoked rubber, pale brown scarp crepe, fruits, nutmeg, rice, rubber, pepper, mace, cloves, coir yarn
Industry Fibreboard of a density, paper and paperboard, balls, activated carbon

115Country Performance / Sri Lanka
ANNUAL REPORT 2008
Sri Lanka: Main Items of Goods and Services Importedfrom ACU Member Countries in 2008
Sector/CountryBangladesh
AgriculturePotatoes, seeds of coriander, rice, multiple (folded) or cabled yarn of jute, unbleached woven fabrics of jute or other textile, medicaments of fi xed or unmixed products
Industry Measuring equipments, hydrocarbons, perfumes, plastics, clothing accessories, paper or paperboard
India
Agriculture
Fruits of genus capsicum-chillies, rice, turmeric, maize, millet, masoor dhal, medicaments, oil cake and other solid residues of soya bean, oniona and shallots fresh or chilled, wheat grain, palm oil, dried vegetables, semi milled or wholly milled rice, white crystalline cane sugar, cigarettes, beedi leaves, potatoes, crude palm oil, milk and milk products, natural rubber
Industry
Stainless steel tanks, aluminium, auto trishaws, carbon, chassis, crude oil, diesel, petrol and other petroleum, kerosene typeset fuel, crude palm oil, fl at rolled iron or non alloy steel, busses and lorries, trankers and browsers, measuring, motor cars and motor vehicles, motor cycles, cement, knitted or crocheted fabrics, paper and paperboard, polyethylene, printed: plain weave, thread, tractors, wire or refi ned copper, wire of brass, books machinery and equipments, motor accessories, denim, fi sh frozen or dried, sodium hydroxide, sulphuric acids, inorganic acids, sulphates, yeasts, diamonds, pharmaceutical goods, tyres, tubes and pipes
IranAgriculture Dried grapes and dates, synthetic rubber products, medicaments
Industry Petroleum oils and oil products, urea, urea resins, strip, carbon, copper waste and scrap
MyanmarAgriculture Seeds of coriander, maize seed, black gram, vegetablesIndustry Blow moulding machines for working rubber or plastics, precious stones, wood
Nepal
Industry Ash and residues containing mainly copper, scoops of base metal, buttons of base metal, books
Pakistan
AgricultureBeans of the species, rice, cotton sewing thread, fruits, onions, potatoes, denim, seeds of cumin, fruits, semi-milled wholly milled rice, dried vegetables, medicaments
Industry
Unbleached: plain weave, woven fabrics, agricultural tractors, carbon, carboys, bottles, fl asks and similar articles of plastics, crosstwill, gloves, mittens and mitts of other textiles, knitted or crocheted, measuring equipmens, fabrics, zinc not alloyed
Source: Central Bank of Sri Lanka

116 Auditor’s Report
ANNUAL REPORT 2008

117ACU Operations
ANNUAL REPORT 2008
Clearing Operations
Volume of transactions (one way plus accrued interest) booked at the Secretariat of the Asian Clearing Union in the fi nancial year 2008 amounted to USD 20,966.7 million showing an increase of 32.4 percent over the corresponding fi gure of the last year. The total transactions including receipts, payments, and accrued interest among the ACU member countries through the ACU mechanism reached to USD 41,933.4 million. The volume of business through the Union was the highest, since the inception of the ACU. (Tables 1 and 2)
The average monthly total transactions credited/debited to the member central banks was USD 1,747.2 million compared with USD 1,319.2 million in the preceding year. The level of total annual trade (including exports, imports, and accrued interest) of member countries in the year under review shows that India was at the top with USD 18,780.6 million, depicting USD 4,675.4 million increase over the previous year, followed by I.R. of Iran, Bangladesh, Sri Lanka, Pakistan, Nepal,
Bhutan, and Myanmar with USD 13,363.5, 3,856.9, 3,354.3, 2,458.5, 99.1, 15.0, and 5.5 million, representing annual increase of USD 3,431.6, 1,089.0, 299.6, 699.5, 70.3, 3.0, and 4.0 million, respectively. (Table 2)
In percentage terms, Myanmar with 266.7 percent increase registered the highest annual growth rate, followed by Nepal, Pakistan, Bangladesh, Iran, India, Bhutan, and Sri Lanka with 244.1, 39.8, 39.3, 34.6, 33.1, 25.0, and 9.8 percent, respectively. (Table 2)
In the year under review, 38.3 percent of total trade amounting to USD 8,031.3 million was cleared through the ACU mechanism and the remaining amount of USD 12,935.5 million was settled in hard currency. Payments in hard currency improved by USD 4,082.3 million or 46.1 percent over the year. India and Pakistan with 58.9 and 20.8 percent clearing in the system stood at the top, followed by Nepal, Sri Lanka, Bangladesh, Iran, and Bhutan with 10.1, 7.1, 4.0, 2.0, and 0.6 percent, respectively. (Tables 1 and 3)
ACU Operations
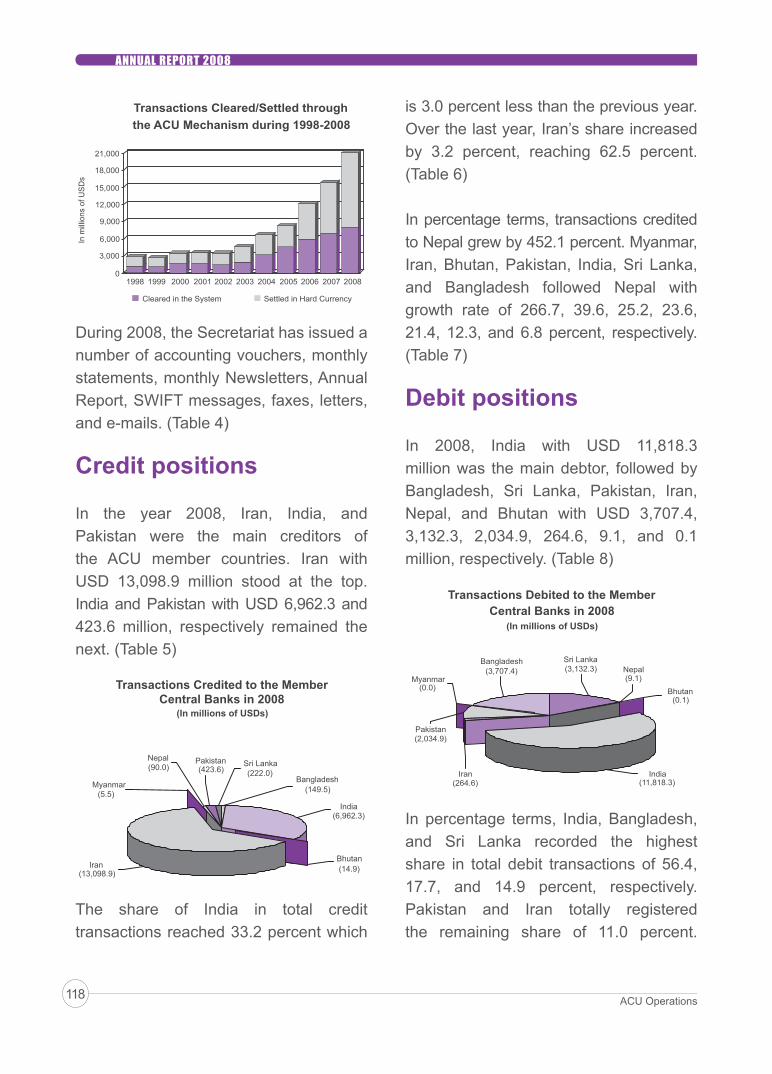
118 ACU Operations
ANNUAL REPORT 2008
During 2008, the Secretariat has issued a number of accounting vouchers, monthly statements, monthly Newsletters, Annual Report, SWIFT messages, faxes, letters, and e-mails. (Table 4)
Credit positions
In the year 2008, Iran, India, and Pakistan were the main creditors of the ACU member countries. Iran with USD 13,098.9 million stood at the top. India and Pakistan with USD 6,962.3 and 423.6 million, respectively remained the next. (Table 5)
is 3.0 percent less than the previous year. Over the last year, Iran’s share increased by 3.2 percent, reaching 62.5 percent. (Table 6)
In percentage terms, transactions credited to Nepal grew by 452.1 percent. Myanmar, Iran, Bhutan, Pakistan, India, Sri Lanka, and Bangladesh followed Nepal with growth rate of 266.7, 39.6, 25.2, 23.6, 21.4, 12.3, and 6.8 percent, respectively. (Table 7)
Debit positions
In 2008, India with USD 11,818.3 million was the main debtor, followed by Bangladesh, Sri Lanka, Pakistan, Iran, Nepal, and Bhutan with USD 3,707.4, 3,132.3, 2,034.9, 264.6, 9.1, and 0.1 million, respectively. (Table 8)
In percentage terms, India, Bangladesh, and Sri Lanka recorded the highest share in total debit transactions of 56.4, 17.7, and 14.9 percent, respectively. Pakistan and Iran totally registered the remaining share of 11.0 percent.
The share of India in total credit transactions reached 33.2 percent which

119ACU Operations
ANNUAL REPORT 2008
(Table 9)
Iran, Bhutan, Myanmar, and Nepal experienced negative annual payment growth of 51.7, 48.7, 31.2, and 27.2 percent, respectively while Pakistan, India, Bangladesh, and Sri Lanka posted rise in their payments. Pakistan recorded the highest annual payment growth of 43.7 percent, India and Bangladesh with 41.2 and 41.1 percent, respectively stood the next. (Table 10)
Net credit/debit positions
In the year 2008, Iran was the main net creditor of the ACU member countries with the amount of USD 12,834.3 million, representing 45.2 percent increase over the previous year. The second net creditor was Nepal with USD 80.9 million, followed by Bhutan. In contrast, the main net debtor was India with the amount of USD 4,856.0 million followed by Bangladesh, Sri Lanka, and Pakistan.(Tables 3 and 17)
Swap facility
In accordance with the Article (VIIA) of Agreement Establishing the Asian Clearing Union, the Currency Swap Arrangement became available to all
Interest received/paid
In 2008, the accrued interest credited/debited to the member central banks amounted to USD 26.2 million which was 0.2 percent of central banks’ net positions and 0.1 percent of the total transactions channeled through the ACU mechanism. In the year under review, total interest received/paid was USD 14.7 million less than the last year’s corresponding fi gure.(Tables 11 and 12)
The average monthly interest rates applied in the ACU mechanism in the year 2008 was 1.9 percent, compared to 4.9 percent in the corresponding period last year. The applied interest rates continued their downward trend in the year under review. (Table 13)

120 ACU Operations
ANNUAL REPORT 2008
debtor participants during a settlement period, to avail two-month facility for settling imbalances in clearing.
Every eligible participant shall be entitled to the facility from every other participant up to 20.0 percent of the average gross payment made by it through the ACU mechanism to other participants during the three previous calendar years.
In the year 2008, the total entitlement of each member country to avail Swap facility of other members were allocated as India stood at the top with USD 1,173.9 million, followed by Sri Lanka, Bangladesh, Pakistan, Iran, and Nepal. (Table 14)
In 2008, Central Bank of Sri Lanka applied for Swap facility. The total amount of Swap facility used by the ACU member central banks since the inception of this arrangement (September 1989-December 2008) was USD 1,081.8 million. (Table 15)
Measures and Achievements
The ACU was established in December 1974 when the countries in the region were facing settlement diffi culties, mainly due to resource constraints. The ACU started its operations a year later in November 1975. Over the years, the ACU has displayed a sense of true commitment,
consolidated and nurtured throughout its operations. By applying sound strategies, it achieved pre-determined objectives to facilitate settlement on a multilateral basis, to promote the use of participants’ currencies, to improve monetary and banking co-operation, and to expand trade and economic activity among the countries of the ESCAP region.
The results of long-term initiatives to raise the Union achievements are evident from the following facts:
1) Rapid expansion of trade: Since the inception of the ACU, transactions have experienced a remarkable growth. In 2008, volume of transactions (one way plus accrued interest) amounted toUSD 20,966.7 million depicting 32.4 percent growth compared to the preceding year. On a monthly basis, the average transactions stood at USD 1,747.2 million compared to USD 1,319.2 million last year.
2) Timely settlement: Under the ACU Procedure Rules, the debtor members should pay up their dues in convertible

121ACU Operations
ANNUAL REPORT 2008
currencies within 4 working days of the receipt of the notice of payment from the Secretary General. There has been no default by any member so far in meeting its obligation for the settlement of its net position within the stipulated time.
3) Establishment of multi-currency settlement system: Based on the approval of the ACU Board of Directors at the 37th Meeting in Myanmar (June 2008), the accounts of the ACU are held in “Asian Monetary Units” (AMUs), comprising ACU dollar and ACU euro with effect from January 1, 2009. Since then, the participants are authorized to settle transactions either in US dollar or Euro within the ACU mechanism.
4) Revision of the Agreement Establishing the ACU and Procedure Rules: In tandem with developments and challenges ahead, the ACU Board of Directors amended the Agreement Establishing the ACU and Procedure Rules.
5) Quality management and information
technology: Believing in the fact that developing an online access to information would be a worldwide requirement; the ACU has developed both the quality and quantity of the system. In order to accelerate the process of presenting services and to make dispersion of information smoother, the participants were enabled to access their ACU accounts on a daily basis through the Internet.
6) Expansion of the ACU: Based on a decision made at the 36th Board of Directors Meeting in Bangladesh (May 2006), the expansion of the Union was put at the top of its agenda. In this regard, representatives of target countries were invited to attend the 38th Meeting as observers. Seminars/scheduled meetings were also conducted to demonstrate the ACU mechanism.
Nevertheless, there is still a long way to go. The ACU challenges are to strengthen, smoothen, and streamline the mechanism to cope with fast pacing developments in the international markets.

122 ACU Operations / Tables
ANNUAL REPORT 2008
Asian Clearing UnionTransactions1 Channeled through the ACU Mechanism during 1976-2008
(In millions of USDs)Table (1)
Year
Yearly Transactions Cleared in the System Settled in Hard Currency
Amount 2 Growth(percent) Amount
Share in yearly transactions
(percent)Amount
Share in yearly transactions
(percent)1976 25.7 5,040.0 4.1 16.0 21.6 84.01977 79.4 208.9 16.7 21.0 62.7 79.01978 137.6 73.3 39.9 29.0 97.7 71.01979 161.3 17.2 83.9 52.0 77.4 48.01980 183.0 13.5 98.8 54.0 84.2 46.01981 269.4 47.2 166.9 62.0 102.5 38.01982 300.4 11.5 196.6 65.4 103.8 34.61983 498.6 66.0 192.3 38.6 306.3 61.41984 662.8 32.9 322.2 48.6 340.6 51.41985 605.2 -8.7 373.5 61.7 231.7 38.31986 690.6 14.1 581.1 84.1 109.5 15.91987 625.4 -9.4 397.0 63.5 228.4 36.51988 940.8 50.4 698.5 74.2 242.3 25.81989 1,041.8 10.7 832.4 79.9 209.4 20.11990 1,366.6 31.2 947.8 69.4 418.8 30.61991 1,851.5 35.5 1,424.4 76.9 427.1 23.11992 1,928.4 4.2 1,172.5 60.8 755.9 39.21993 1,448.9 -24.9 1,018.0 70.3 430.9 29.71994 1,965.4 35.6 1,110.7 56.5 854.7 43.51995 2,702.9 37.5 1,353.4 50.1 1,349.5 49.91996 3,161.1 17.0 1,448.3 45.8 1,712.8 54.21997 2,655.0 -16.0 1,251.6 47.1 1,403.4 52.91998 2,842.8 7.1 1,130.6 39.8 1,712.2 60.21999 2,630.8 -7.5 1,057.4 40.2 1,573.4 59.82000 3,383.6 28.6 1,634.7 48.3 1,748.9 51.72001 3,553.7 5.0 1,643.6 46.3 1,910.1 53.72002 3,448.4 -3.0 1,446.4 41.9 2,002.0 58.12003 4,546.4 31.8 1,878.0 41.3 2,668.4 58.72004 6,679.8 46.9 3,163.3 47.4 3,516.5 52.62005 8,199.7 22.8 4,512.2 55.0 3,687.5 45.0
2006 12,049.9 47.0 5,864.3 48.7 6,185.6 51.3
2007 15,830.5 31.4 6,977.3 44.1 8,853.2 55.92008 20,966.7 32.4 8,031.3 38.3 12,935.5 61.7Total 107,434.1 - 51,069.7 47.5 56,364.4 52.5
1 Figures indicate one-way transactions, and accrued interest.2 Amount relevant to years 1976 to 1995 converted from SDRs to US Dollars.

123ACU Operations / Tables
ANNUAL REPORT 2008
Asian Clearing UnionTotal Transactions1 Routed through the ACU during 2007-2008
(In millions of USDs)
Table (2)
Item 2007 2008
Change Growth(percent)Amount
Share in Total Transactions
(percent)Amount
Share in Total Transactions
(percent)
Bangladesh 2,767.9 8.7 3,856.9 9.2 1,089.0 39.3
Bhutan 12.0 0.0 15.0 0.0 3.0 25.0
India 14,105.2 44.6 18,780.6 44.8 4,675.4 33.1
Iran 9,931.9 31.4 13,363.5 31.9 3,431.6 34.6
Myanmar 1.5 0.0 5.5 0.0 4.0 266.7
Nepal 28.8 0.1 99.1 0.2 70.3 244.1
Pakistan 1,759.0 5.6 2,458.5 5.9 699.5 39.8
Sri Lanka 3,054.7 9.6 3,354.3 8.0 299.6 9.8
Total 31,661.0 100.0 41,933.4 100.0 10,272.4 32.4
1 Figures include exports, imports, and accrued interest.
Country

124 ACU Operations / Tables
ANNUAL REPORT 2008
Asian Clearing UnionTransactions1 Cleared/Settled in the ACU Mechanism in 2008
(In millions of USDs)
Table (3)
Item Total Credit Total Debit Net Balance
Cleared in the System(percent)
Settled in HardCurrency(percent)
Bangladesh 149.5 3,707.4 -3,557.9 4.0 96.0
Bhutan 14.9 0.1 14.8 0.6 99.4
India 6,962.3 11,818.3 -4,856.0 58.9 41.1
Iran 13,098.9 264.6 12,834.3 2.0 98.0
Myanmar 5.5 0.0 5.5 0.0 100.0
Nepal 90.0 9.1 80.9 10.1 89.9
Pakistan 423.6 2,034.9 -1,611.3 20.8 79.2
Sri Lanka 222.0 3,132.3 -2,910.3 7.1 92.9
Total 20,966.7 20,966.7 ±12,935.52 38.3 61.7
1 Figures indicate one-way transactions, and accrued interest.
2 Figure indicates net credit/net debit position.
Country

125ACU Operations / Tables
ANNUAL REPORT 2008
Asian Clearing UnionPaper Works and Communications of ACU Secretariat during 2007- 2008
(Number)
Table (4)
Year2007 2008
Incoming SWIFT messages and letters 3,421 4,327
Outgoing SWIFT messages and letters 944 1,581
Outgoing union messages 231 193
Incoming Faxes 518 1,003
Outgoing Faxes 489 647
Incoming E-mails 391 440
Outgoing E-mails 384 316
Accounting vouchers 8,840 9,496
Monthly statements 741 726
Newsletters 1,488 1,572
Annual report 300 220
Item

126 ACU Operations / Tables
ANNUAL REPORT 2008
Asian Clearing UnionTransactions1 Credited to the Member Central Banks during 2004-2008
(In millions of USDs)
Table (5)
Year 2004 2005 2006 2007 2008
Bangladesh 104.3 127.9 144.7 140.0 149.5
Bhutan 7.6 11.4 10.6 11.9 14.9
India 3,328.1 3,677.5 4,835.2 5,736.6 6,962.3
Iran 2,929.1 3,991.7 6,594.8 9,384.0 13,098.9
Myanmar 2.1 2.7 3.3 1.5 5.5
Nepal 5.4 4.7 6.0 16.3 90.0
Pakistan 216.0 242.9 302.1 342.6 423.6
Sri Lanka 87.2 140.9 153.2 197.6 222.0
Total 6,679.8 8,199.7 12,049.9 15,830.5 20,966.7
1 Figures indicate one-way transactions, and accrued interest.
Country

127ACU Operations / Tables
ANNUAL REPORT 2008
Asian Clearing UnionShare of the Member Central Banks in
Total Credit Transactions1 during 2004-2008(In percent)
Table (6)
Year2004 2005 2006 2007 2008
Bangladesh 1.6 1.6 1.2 0.9 0.7
Bhutan 0.1 0.1 0.1 0.1 0.1
India 49.8 44.8 40.1 36.2 33.2
Iran 43.9 48.7 54.7 59.3 62.5
Myanmar 0.0 0.0 0.0 0.0 0.0
Nepal 0.1 0.1 0.1 0.1 0.4
Pakistan 3.2 3.0 2.5 2.2 2.0
Sri Lanka 1.3 1.7 1.3 1.2 1.1
Total 100.0 100.0 100.0 100.0 100.0
1 Figures include accrued interest.
Country
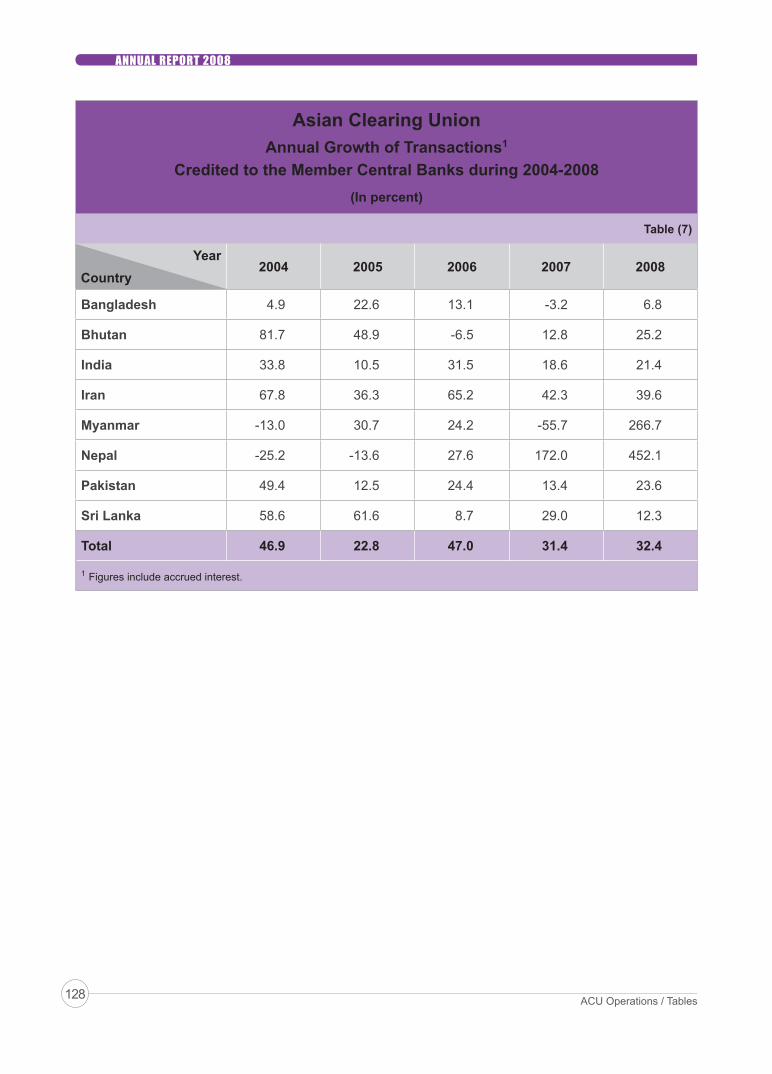
128 ACU Operations / Tables
ANNUAL REPORT 2008
Asian Clearing UnionAnnual Growth of Transactions1
Credited to the Member Central Banks during 2004-2008(In percent)
Table (7)
Year2004 2005 2006 2007 2008
Bangladesh 4.9 22.6 13.1 -3.2 6.8
Bhutan 81.7 48.9 -6.5 12.8 25.2
India 33.8 10.5 31.5 18.6 21.4
Iran 67.8 36.3 65.2 42.3 39.6
Myanmar -13.0 30.7 24.2 -55.7 266.7
Nepal -25.2 -13.6 27.6 172.0 452.1
Pakistan 49.4 12.5 24.4 13.4 23.6
Sri Lanka 58.6 61.6 8.7 29.0 12.3
Total 46.9 22.8 47.0 31.4 32.4
1 Figures include accrued interest.
Country

129ACU Operations / Tables
ANNUAL REPORT 2008
Asian Clearing UnionTransactions1 Debited to the Member Central Banks during 2004-2008
(In millions of USDs)
Table (8)
Year2004 2005 2006 2007 2008
Bangladesh 1,773.1 1,981.8 2,132.4 2,627.9 3,707.4
Bhutan 0.0 0.1 0.0 0.1 0.1
India 2,415.1 3,572.0 5,684.8 8,368.6 11,818.3
Iran 335.2 423.6 423.1 547.9 264.6
Myanmar 0.0 0.0 0.0 0.0 0.0
Nepal 11.1 8.4 9.6 12.5 9.1
Pakistan 649.7 695.2 1,373.6 1,416.4 2,034.9
Sri Lanka 1,495.6 1,518.6 2,426.4 2,857.1 3,132.3
Total 6,679.8 8,199.7 12,049.9 15,830.5 20,966.7
1 Figures include accrued interest.
Country

130 ACU Operations / Tables
ANNUAL REPORT 2008
Asian Clearing UnionShare of the Member Central Banks in
Total Debit Transactions1 during 2004-2008(In percent)
Table (9)
Year2004 2005 2006 2007 2008
Bangladesh 26.5 24.2 17.7 16.6 17.7
Bhutan 0.0 0.0 0.0 0.0 0.0
India 36.2 43.5 47.2 52.9 56.4
Iran 5.0 5.2 3.5 3.5 1.3
Myanmar 0.0 0.0 0.0 0.0 0.0
Nepal 0.2 0.1 0.1 0.1 0.0
Pakistan 9.7 8.5 11.4 8.9 9.7
Sri Lanka 22.4 18.5 20.1 18.0 14.9
Total 100.0 100.0 100.0 100.0 100.0
1 Figures include accrued interest.
Country

131ACU Operations / Tables
ANNUAL REPORT 2008
Asian Clearing UnionAnnual Growth of Transactions1
Debited to the Member Central Banks during 2004-2008(In percent)
Table (10)
Year2004 2005 2006 2007 2008
Bangladesh 16.6 11.8 7.6 23.2 41.1
Bhutan -96.0 436.9 -90.9 950.8 -48.7
India 86.9 47.9 59.2 47.2 41.2
Iran 20.8 26.4 -0.1 29.5 -51.7
Myanmar -99.4 -2.6 -43.4 -59.0 -31.2
Nepal 71.4 -24.5 14.3 30.2 -27.2
Pakistan 43.2 7.0 97.6 3.1 43.7
Sri Lanka 50.8 1.5 59.8 17.8 9.6
Total 46.9 22.8 47.0 31.4 32.4
1 Figures include accrued interest.
Country

132 ACU Operations / Tables
ANNUAL REPORT 2008
Asi
an C
lear
ing
Uni
onM
onth
ly D
istr
ibut
ion
of A
ccru
ed In
tere
st C
redi
ted
to th
e M
embe
r Cen
tral
Ban
ks in
200
8(In
USD
s)
Tabl
e (1
1)
Cou
ntry
Ban
glad
esh
Bhu
tan
Indi
aIra
nM
yanm
arN
epal
Paki
stan
Sri L
anka
Tota
l
Janu
ary
0.0
2,04
7.6
0.0
2,52
2,86
1.9
21.9
6,12
9.7
0.0
0.0
2,53
1,06
1.1
Febr
uary
0.0
5,34
2.7
0.0
3,30
7,57
4.9
225.
611
,842
.40.
00.
03,
324,
985.
6
Mar
ch0.
04,
350.
60.
02,
300,
846.
935
2.8
13,1
30.4
0.0
0.0
2,31
8,68
0.7
Apr
il0.
04,
512.
00.
03,
041,
140.
71,
649.
517
,299
.80.
00.
03,
064,
602.
0
May
0.0
1,84
4.6
0.0
1,39
6,73
8.0
1,47
8.1
7,94
9.4
0.0
0.0
1,40
8,01
0.1
June
0.0
2,06
6.6
0.0
2,07
4,92
7.1
799.
114
,813
.70.
00.
02,
092,
606.
5
July
0.0
1,95
9.6
0.0
2,05
5,06
7.0
466.
012
,175
.70.
00.
02,
069,
668.
3
Aug
ust
0.0
2,87
3.0
0.0
4,35
5,33
1.5
380.
421
,259
.10.
00.
04,
379,
844.
0
Sept
embe
r0.
077
2.3
0.0
2,01
2,88
4.1
49.3
11,8
26.5
0.0
0.0
2,02
5,53
2.2
Oct
ober
0.0
1,14
4.1
0.0
2,55
6,70
0.2
0.0
13,2
39.0
0.0
0.0
2,57
1,08
3.3
Nov
embe
r0.
026
3.6
0.0
245,
398.
215
5.8
3,69
1.0
0.0
0.0
249,
508.
6
Dec
embe
r0.
026
4.0
111,
376.
954
,730
.229
3.2
3,15
7.2
0.0
0.0
169,
821.
5
Tota
l0.
027
,440
.711
1,37
6.9
25,9
24,2
00.7
5,87
1.7
136,
513.
90.
00.
026
,205
,403
.9
Mon
th

133ACU Operations / Tables
ANNUAL REPORT 2008
Asi
an C
lear
ing
Uni
onM
onth
ly D
istr
ibut
ion
of A
ccru
ed In
tere
st D
ebite
d to
the
Mem
ber C
entr
al B
anks
in 2
008
(In U
SDs)
Tabl
e (1
2)
Cou
ntry
Ban
glad
esh
Bhu
tan
Indi
aIra
nM
yanm
arN
epal
Paki
stan
Sri L
anka
Tota
l
Janu
ary
789,
346.
00.
050
3,02
1.6
0.0
0.0
0.0
581,
994.
865
6,69
8.7
2,53
1,06
1.1
Febr
uary
1,24
8,04
3.5
0.0
239,
440.
50.
00.
00.
086
3,47
0.2
974,
031.
43,
324,
985.
6
Mar
ch66
3,15
6.4
0.0
942,
269.
30.
00.
00.
036
2,92
1.1
350,
333.
92,
318,
680.
7
Apr
il82
6,58
0.7
0.0
1,52
7,39
2.3
0.0
0.0
0.0
449,
681.
526
0,94
7.5
3,06
4,60
2.0
May
347,
584.
10.
057
8,39
1.4
0.0
0.0
0.0
210,
926.
927
1,10
7.7
1,40
8,01
0.1
June
699,
305.
70.
070
7,72
3.2
0.0
0.0
0.0
276,
687.
240
8,89
0.4
2,09
2,60
6.5
July
405,
866.
30.
092
2,39
3.8
0.0
0.0
0.0
169,
049.
957
2,35
8.3
2,06
9,66
8.3
Aug
ust
682,
777.
00.
02,
269,
741.
40.
00.
00.
037
4,04
2.8
1,05
3,28
2.8
4,37
9,84
4.0
Sept
embe
r23
6,07
7.8
0.0
1,22
7,76
1.2
0.0
0.0
0.0
106,
517.
745
5,17
5.5
2,02
5,53
2.2
Oct
ober
473,
051.
10.
01,
309,
408.
00.
00.
00.
018
3,52
1.4
605,
102.
82,
571,
083.
3
Nov
embe
r98
,405
.90.
062
,228
.50.
00.
00.
040
,287
.748
,586
.524
9,50
8.6
Dec
embe
r90
,750
.40.
00.
00.
00.
00.
022
,252
.356
,818
.816
9,82
1.5
Tota
l6,
560,
944.
90.
010
,289
,771
.20.
00.
00.
03,
641,
353.
55,
713,
334.
326
,205
,403
.9
Mon
th

134 ACU Operations / Tables
ANNUAL REPORT 2008
Asian Clearing UnionInterest Rates1 Applied in the ACU Settlement Mechanism during 2004-2008
(In percent)
Table (13)
Year2004 2005 2006 2007 2008
January 0.9 2.1 4.1 5.1 3.9
February 0.8 2.4 4.4 5.1 2.8
March 0.9 2.5 4.4 5.2 2.6
April 0.9 2.7 4.6 5.1 1.9
May 0.9 2.8 4.7 5.1 1.8
June 1.0 2.9 4.9 5.1 1.9
July 1.1 3.1 5.1 5.1 1.8
August 1.3 3.3 5.2 5.1 1.8
September 1.4 3.4 5.1 4.8 1.8
October 1.6 3.6 5.1 4.5 1.5
November 1.8 3.9 5.1 4.3 0.6
December 2.1 4.0 5.1 4.1 0.3
1 The interest rate applicable for a settlement period is the closing rate on the fi rst working day of the last week of the previous
calendar month offered by the Bank for International Settlements (BIS) for one month Euro-dollar deposits.
Month
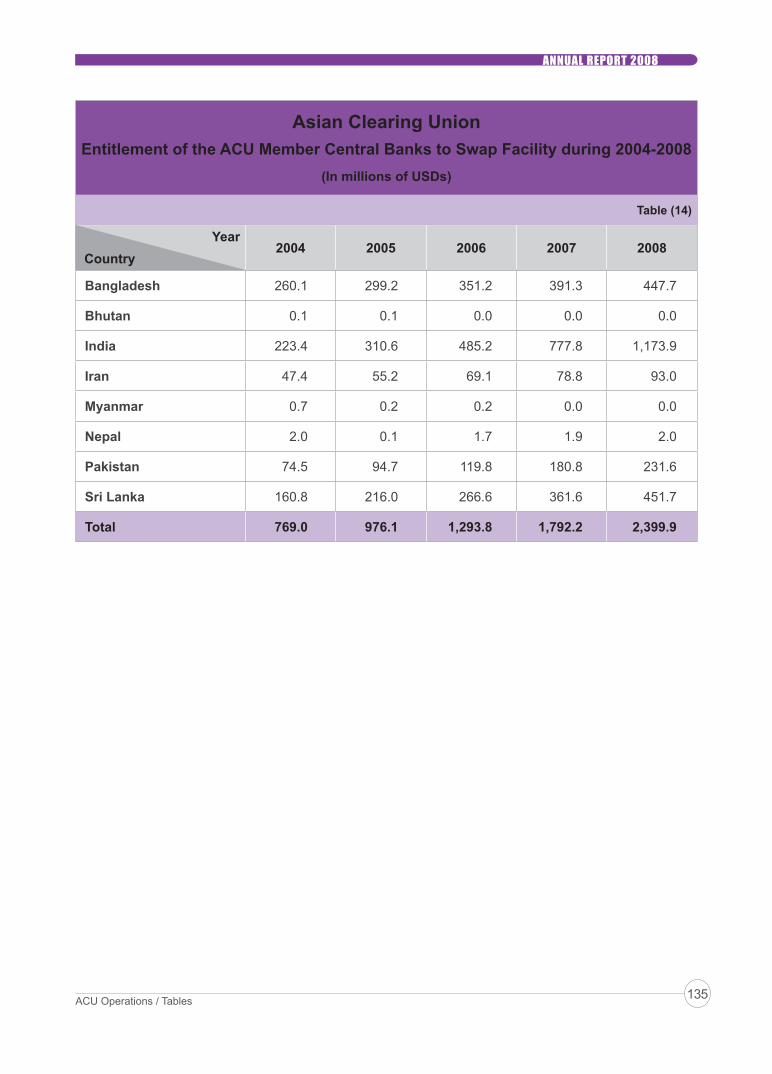
135ACU Operations / Tables
ANNUAL REPORT 2008
Asian Clearing UnionEntitlement of the ACU Member Central Banks to Swap Facility during 2004-2008
(In millions of USDs)
Table (14)
Year2004 2005 2006 2007 2008
Bangladesh 260.1 299.2 351.2 391.3 447.7
Bhutan 0.1 0.1 0.0 0.0 0.0
India 223.4 310.6 485.2 777.8 1,173.9
Iran 47.4 55.2 69.1 78.8 93.0
Myanmar 0.7 0.2 0.2 0.0 0.0
Nepal 2.0 0.1 1.7 1.9 2.0
Pakistan 74.5 94.7 119.8 180.8 231.6
Sri Lanka 160.8 216.0 266.6 361.6 451.7
Total 769.0 976.1 1,293.8 1,792.2 2,399.9
Country

136 ACU Operations / Tables
ANNUAL REPORT 2008
Asi
an C
lear
ing
Uni
onSw
ap R
ecei
pts
/ Pay
men
ts b
y th
e A
CU
Mem
ber C
entr
al B
anks
dur
ing
1989
-200
8(In
mill
ions
of U
SDs)
Tabl
e (1
5)
Item
1989
-199
719
9819
9920
0020
0120
02-2
0071
2008
2
Rece
ipts
Paym
ents
Rece
ipts
Paym
ents
Rece
ipts
Paym
ents
Rece
ipts
Paym
ents
Rece
ipts
Paym
ents
Rece
ipts
Paym
ents
Rece
ipts
Paym
ents
Bang
lade
sh27
.219
.20.
00.
40.
00.
00.
03.
215
0.0
4.6
0.0
0.0
0.0
1.6
Bhu
tan
0.0
0.0
0.0
0.0
0.0
0.0
0.0
0.0
0.0
0.0
0.0
0.0
0.0
0.0
Indi
a17
2.1
65.2
0.0
2.3
0.0
0.0
0.0
11.2
0.0
151.
00.
00.
00.
031
5.8
Iran
0.0
206.
80.
03.
40.
00.
00.
011
.00.
016
.40.
00.
00.
012
4.0
Mya
nmar
0.0
18.0
0.0
0.0
0.0
0.0
0.0
0.0
0.0
0.0
0.0
0.0
0.0
0.0
Nep
al0.
00.
00.
00.
00.
00.
00.
00.
00.
01.
50.
00.
00.
00.
0
Paki
stan
172.
123
.57.
10.
00.
00.
028
.90.
042
.112
.00.
00.
00.
09.
6
Sri L
anka
31.3
70.0
0.0
1.0
0.0
0.0
0.0
3.5
0.0
6.6
0.0
0.0
451.
00.
0
Tota
l40
2.7
402.
77.
17.
10.
00.
028
.928
.919
2.1
192.
10.
00.
045
1.0
451.
0
1 Non
e of
the
AC
U m
embe
r cen
tral b
anks
app
lied
Sw
ap fa
cilit
y du
ring
2002
-200
7.
2 Cen
tral b
ank
of S
ri La
nka
appl
ied
for S
wap
faci
lity
in O
ctob
er 2
008.
Cou
ntry

137ACU Operations / Tables
ANNUAL REPORT 2008
Asi
an C
lear
ing
Uni
onTr
ansa
ctio
ns M
atrix
in 2
008
(In m
illio
ns o
f USD
s)
Tabl
e (1
6)
Cre
dito
rB
angl
ades
hB
huta
nIn
dia
Iran
Mya
nmar
Nep
alPa
kist
anSr
i Lan
kaTo
tal
Ban
glad
esh
0.0
14.8
3,30
2.6
3.3
0.7
88.1
275.
915
.43,
700.
8
Bhu
tan
0.1
0.0
0.0
0.0
0.0
0.0
0.0
0.0
0.1
Indi
a44
.20.
00.
011
,643
.60.
00.
014
.110
6.1
11,8
08.0
Iran
35.5
0.0
169.
30.
00.
00.
012
.547
.426
4.7
Mya
nmar
0.0
0.0
0.0
0.0
0.0
0.0
0.0
0.0
0.0
Nep
al5.
10.
00.
00.
70.
00.
02.
60.
69.
0
Paki
stan
57.2
0.0
1,43
4.2
485.
11.
60.
60.
052
.62,
031.
3
Sri L
anka
7.4
0.0
2,05
6.1
940.
33.
11.
211
8.5
0.0
3,12
6.6
Tota
l14
9.5
14.8
6,96
2.2
13,0
73.0
5.4
89.9
423.
622
2.1
20,9
40.5
Deb
tor

138 ACU Operations / Tables
ANNUAL REPORT 2008
Asi
an C
lear
ing
Uni
onTo
tal T
rans
actio
ns1 R
oute
d C
umul
ativ
ely
thro
ugh
the
AC
U d
urin
g 20
07-2
008
(In m
illio
ns o
f USD
s)
Tabl
e (1
7)
Item
Cre
dit
Deb
itTo
tal T
rans
actio
ns
2007
2008
Gro
wth
(per
cent
)20
0720
08G
row
th
(per
cent
)20
0720
08G
row
th
(per
cent
)
Ban
glad
esh
140.
014
9.5
6.8
2,62
7.9
3,70
7.4
41.1
2,76
7.9
3,85
6.9
39.3
Bhu
tan
11.9
14.9
25.2
0.1
0.1
0.0
12.0
15.0
25.0
Indi
a5,
736.
66,
962.
321
.48,
368.
611
,818
.341
.214
,105
.218
,780
.633
.1
Iran
9,38
4.0
13,0
98.9
39.6
547.
926
4.6
-51.
79,
931.
913
,363
.534
.6
Mya
nmar
1.5
5.5
266.
70.
00.
00.
01.
55.
526
6.7
Nep
al16
.390
.045
2.1
12.5
9.1
-27.
228
.899
.124
4.1
Paki
stan
342.
642
3.6
23.6
1,41
6.4
2,03
4.9
43.7
1,75
9.0
2,45
8.5
39.8
Sri L
anka
197.
622
2.0
12.3
2,85
7.1
3,13
2.3
9.6
3,05
4.7
3,35
4.3
9.8
Tota
l15
,830
.520
,966
.732
.415
,830
.520
,966
.732
.431
,661
.041
,933
.432
.4
1 Fi
gure
s in
clud
e ac
crue
d in
tere
st.
Cou
ntry
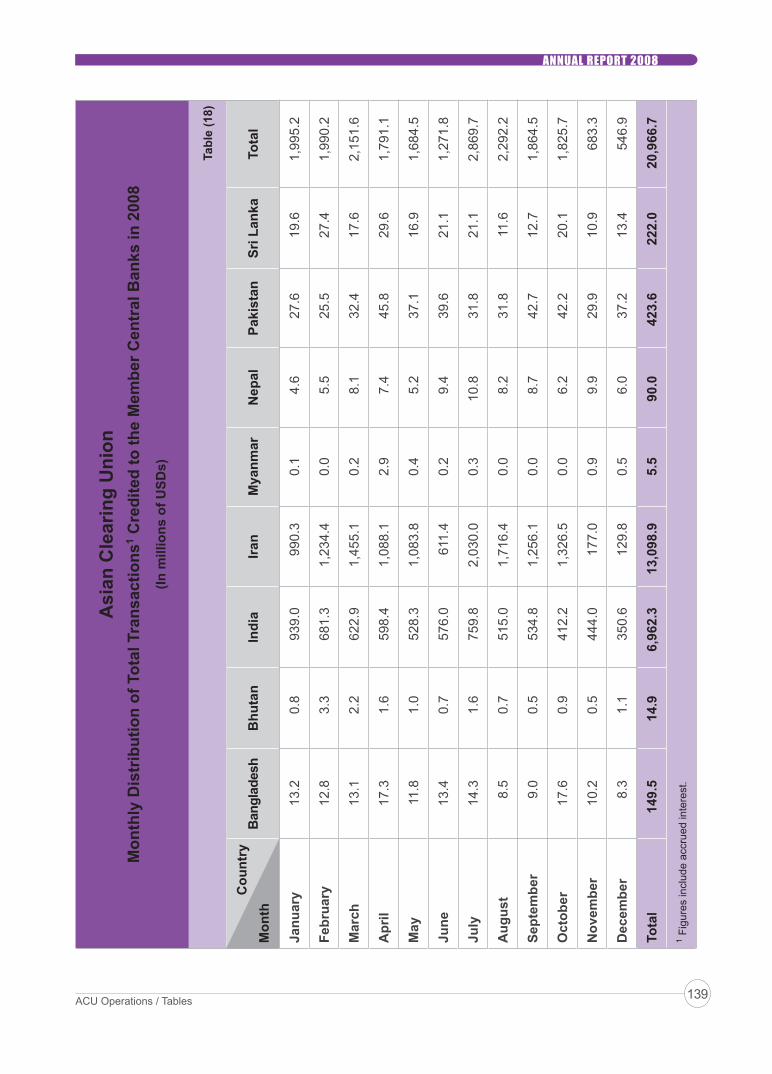
139ACU Operations / Tables
ANNUAL REPORT 2008
Asi
an C
lear
ing
Uni
onM
onth
ly D
istr
ibut
ion
of T
otal
Tra
nsac
tions
1 Cre
dite
d to
the
Mem
ber C
entr
al B
anks
in 2
008
(In m
illio
ns o
f USD
s)
Tabl
e (1
8)
Cou
ntry
Bang
lade
shB
huta
nIn
dia
Iran
Mya
nmar
Nep
alPa
kist
anSr
i Lan
kaTo
tal
Janu
ary
13.2
0.8
939.
099
0.3
0.1
4.6
27.6
19.6
1,99
5.2
Febr
uary
12.8
3.3
681.
31,
234.
40.
05.
525
.527
.41,
990.
2
Mar
ch13
.12.
262
2.9
1,45
5.1
0.2
8.1
32.4
17.6
2,15
1.6
Apr
il17
.31.
659
8.4
1,08
8.1
2.9
7.4
45.8
29.6
1,79
1.1
May
11.8
1.0
528.
31,
083.
80.
45.
237
.116
.91,
684.
5
June
13.4
0.7
576.
061
1.4
0.2
9.4
39.6
21.1
1,27
1.8
July
14.3
1.6
759.
82,
030.
00.
310
.831
.821
.12,
869.
7
Aug
ust
8.5
0.7
515.
01,
716.
40.
08.
231
.811
.62,
292.
2
Sept
embe
r9.
00.
553
4.8
1,25
6.1
0.0
8.7
42.7
12.7
1,86
4.5
Oct
ober
17.6
0.9
412.
21,
326.
50.
06.
242
.220
.11,
825.
7
Nov
embe
r10
.20.
544
4.0
177.
00.
99.
929
.910
.968
3.3
Dec
embe
r8.
31.
135
0.6
129.
80.
56.
037
.213
.454
6.9
Tota
l14
9.5
14.9
6,96
2.3
13,0
98.9
5.5
90.0
423.
622
2.0
20,9
66.7
1 Fig
ures
incl
ude
accr
ued
inte
rest
.
Mon
th

140 ACU Operations / Tables
ANNUAL REPORT 2008
Asi
an C
lear
ing
Uni
onM
onth
ly D
istr
ibut
ion
of T
otal
Tra
nsac
tions
1 Deb
ited
to th
e M
embe
r Cen
tral
Ban
ks in
200
8(In
mill
ions
of U
SDs)
Tabl
e (1
9)
Cou
ntry
Bang
lade
shB
huta
nIn
dia
Iran
Mya
nmar
Nep
alPa
kist
anSr
i Lan
kaTo
tal
Janu
ary
404.
70.
085
4.0
43.7
0.0
1.6
325.
836
5.4
1,99
5.2
Febr
uary
354.
50.
01,
246.
526
.80.
00.
818
9.7
171.
91,
990.
2
Mar
ch36
3.2
0.0
1,42
3.4
26.6
0.0
0.6
193.
114
4.7
2,15
1.6
Apr
il35
1.4
0.0
1,03
3.1
36.5
0.0
1.0
236.
113
3.0
1,79
1.1
May
292.
20.
097
7.1
24.6
0.0
0.6
165.
122
4.9
1,68
4.5
June
324.
50.
061
4.7
15.1
0.0
0.5
126.
419
0.6
1,27
1.8
July
320.
60.
01,
785.
219
.70.
00.
618
9.9
553.
72,
869.
7
Aug
ust
284.
10.
11,
565.
414
.00.
00.
916
7.5
260.
22,
292.
2
Sept
embe
r28
5.9
0.0
1,14
3.3
14.8
0.0
0.6
120.
329
9.6
1,86
4.5
Oct
ober
237.
80.
01,
019.
321
.50.
00.
513
9.1
407.
51,
825.
7
Nov
embe
r27
7.4
0.0
150.
910
.60.
00.
710
5.8
137.
968
3.3
Dec
embe
r21
1.1
0.0
5.4
10.7
0.0
0.7
76.1
242.
954
6.9
Tota
l3,
707.
40.
111
,818
.326
4.6
0.0
9.1
2,03
4.9
3,13
2.3
20,9
66.7
1 Fig
ures
incl
ude
accr
ued
inte
rest
.
Mon
th

141ACU Operations / Tables
ANNUAL REPORT 2008
Asi
an C
lear
ing
Uni
on
Net
Cre
dito
r / N
et D
ebto
r Pos
ition
s1 at t
he E
nd o
f Eac
h Se
ttlem
ent P
erio
d in
200
8(In
mill
ions
of U
SDs)
Tabl
e (2
0)
Cou
ntry
Ban
glad
esh
Bhu
tan
Indi
aIra
nM
yanm
arN
epal
Paki
stan
Sri L
anka
Tota
l
Net Creditors
Febr
uary
0.0
4.1
0.0
2,15
4.1
0.1
7.7
0.0
0.0
2,16
6.0
Apr
il0.
03.
90.
02,
479.
93.
113
.90.
00.
02,
500.
8
June
0.0
1.6
0.0
1,65
5.4
0.7
13.6
0.0
0.0
1,67
1.3
Aug
ust
0.0
2.2
0.0
3,71
2.9
0.3
17.5
0.0
0.0
3,73
2.9
Oct
ober
0.0
1.4
0.0
2,42
2.4
0.0
13.7
0.0
0.0
2,43
7.5
Dec
embe
r0.
01.
695
5.7
410.
11.
314
.50.
00.
01,
383.
2
Tota
l (A
)0.
014
.895
5.7
12,8
34.8
5.5
80.9
0.0
0.0
13,8
91.7
Net Debtors
Febr
uary
733.
20.
048
0.2
0.0
0.0
0.0
462.
349
0.3
2,16
6.0
Apr
il68
4.1
0.0
1,23
5.3
0.0
0.0
0.0
351.
023
0.4
2,50
0.8
June
591.
60.
048
7.6
0.0
0.0
0.0
214.
837
7.3
1,67
1.3
Aug
ust
582.
00.
02,
075.
70.
00.
00.
029
3.9
781.
33,
732.
9
Oct
ober
498.
60.
01,
531.
30.
00.
00.
018
4.2
223.
42,
437.
5
Dec
embe
r46
8.3
0.0
0.0
0.0
0.0
0.0
105.
180
9.8
1,38
3.2
Tota
l (B
)3,
557.
80.
05,
810.
10.
00.
00.
01,
611.
32,
912.
513
,891
.7
Tota
l (A
)-Tot
al (B
)-3
,557
.814
.8-4
,854
.412
,834
.85.
580
.9-1
,611
.3-2
,912
.5-
1 Fig
ures
incl
ude
accr
ued
inte
rest
.
Not
e: F
igur
es re
late
d to
Ban
glad
esh,
Indi
a, Ir
an, P
akis
tan,
and
Sri
Lank
a fo
r Oct
ober
and
Dec
embe
r 200
8 in
clud
e S
wap
reve
rsal
and
inte
rest
.
Mon
th

Acronyms and Abbreviations142
ANNUAL REPORT 2008
ACU Asian Clearing UnionADB Asian Development BankADP Annual Development ProgramAMUs Asian Monetary UnitsASEAN Association of Southeast Asian NationsATMs Automated Teller MachinesAWPR Weighted Average Prime Lending RateBB Bangladesh BankBE Budget EstimateBEPZA Bangladesh Export Processing Zones AuthorityBIS Bank for International SettlementBOP Balance of PaymentsBPO Business Process Outsourcingbps Bassis PointsCAD Current Account Defi citCBI Central Bank of IranCBSL Central Bank of Sri LankaCCPI Colombo Consumers’ Price IndexCIF Cost, Insurance and FreightCIS Commonwealth of Independent StatesCPI Consumer Price IndexCRR Cash Reserve RatioCRR Cash Reserve Requirement (Bangladesh)CSO Central Statistical OrganizationDEIO Department of External Investments and OperationsDGCI&S Directorate General of Commercial Intelligence and StatisticsECB European Central BankECBs External Commercial BorrowingsEOU Export Oriented UnitEPB Export Promotion BureauEPZ Export Processing Zone
Acronyms and Abbreviations
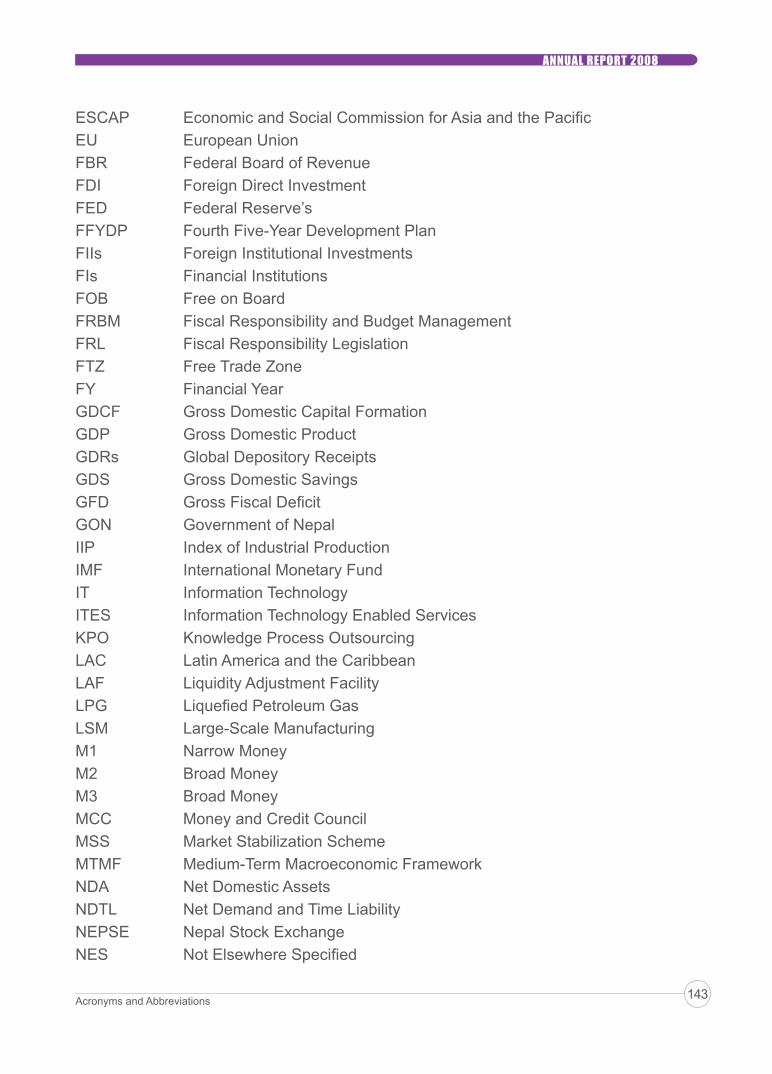
Acronyms and Abbreviations 143
ANNUAL REPORT 2008
ESCAP Economic and Social Commission for Asia and the Pacifi cEU European UnionFBR Federal Board of RevenueFDI Foreign Direct InvestmentFED Federal Reserve’sFFYDP Fourth Five-Year Development PlanFIIs Foreign Institutional InvestmentsFIs Financial InstitutionsFOB Free on BoardFRBM Fiscal Responsibility and Budget ManagementFRL Fiscal Responsibility LegislationFTZ Free Trade ZoneFY Financial YearGDCF Gross Domestic Capital FormationGDP Gross Domestic ProductGDRs Global Depository ReceiptsGDS Gross Domestic SavingsGFD Gross Fiscal Defi citGON Government of NepalIIP Index of Industrial ProductionIMF International Monetary FundIT Information TechnologyITES Information Technology Enabled ServicesKPO Knowledge Process OutsourcingLAC Latin America and the CaribbeanLAF Liquidity Adjustment FacilityLPG Liquefi ed Petroleum GasLSM Large-Scale ManufacturingM1 Narrow MoneyM2 Broad MoneyM3 Broad MoneyMCC Money and Credit CouncilMSS Market Stabilization SchemeMTMF Medium-Term Macroeconomic FrameworkNDA Net Domestic AssetsNDTL Net Demand and Time LiabilityNEPSE Nepal Stock ExchangeNES Not Elsewhere Specifi ed
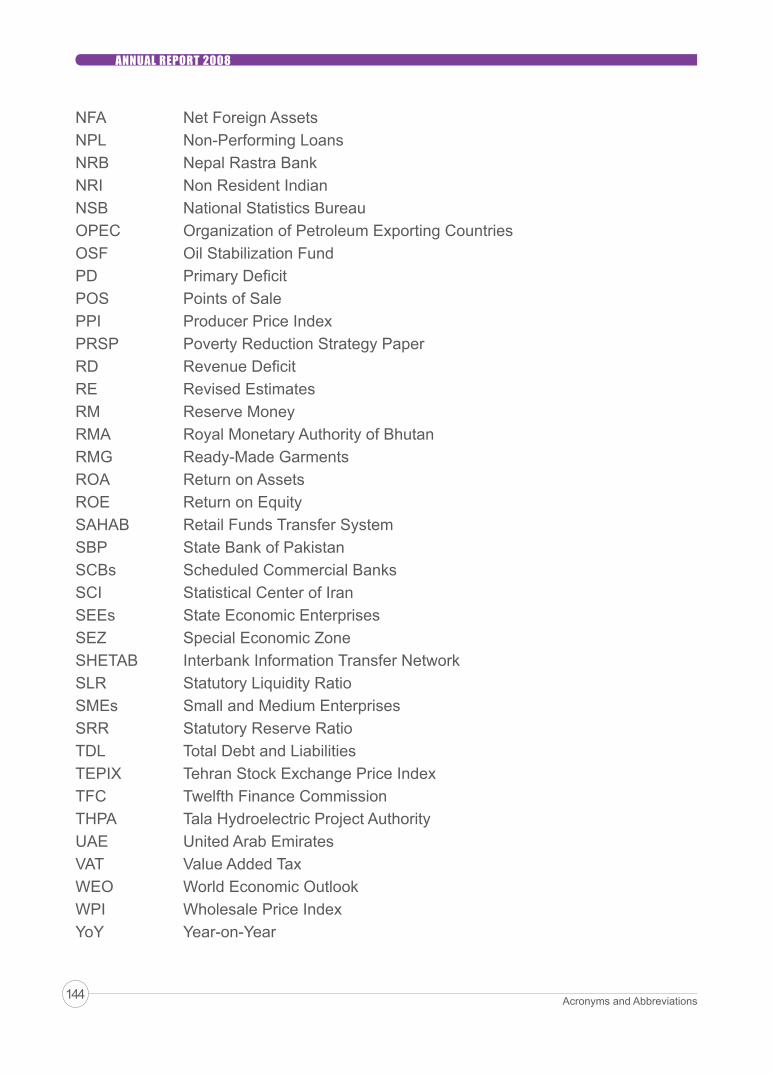
Acronyms and Abbreviations144
ANNUAL REPORT 2008
NFA Net Foreign AssetsNPL Non-Performing LoansNRB Nepal Rastra BankNRI Non Resident IndianNSB National Statistics BureauOPEC Organization of Petroleum Exporting CountriesOSF Oil Stabilization FundPD Primary Defi citPOS Points of SalePPI Producer Price IndexPRSP Poverty Reduction Strategy PaperRD Revenue Defi citRE Revised EstimatesRM Reserve MoneyRMA Royal Monetary Authority of BhutanRMG Ready-Made GarmentsROA Return on AssetsROE Return on EquitySAHAB Retail Funds Transfer SystemSBP State Bank of PakistanSCBs Scheduled Commercial BanksSCI Statistical Center of IranSEEs State Economic EnterprisesSEZ Special Economic ZoneSHETAB Interbank Information Transfer NetworkSLR Statutory Liquidity RatioSMEs Small and Medium EnterprisesSRR Statutory Reserve RatioTDL Total Debt and LiabilitiesTEPIX Tehran Stock Exchange Price IndexTFC Twelfth Finance CommissionTHPA Tala Hydroelectric Project AuthorityUAE United Arab EmiratesVAT Value Added TaxWEO World Economic OutlookWPI Wholesale Price IndexYoY Year-on-Year