assam post poll 2006 - lokniti - programme for … post...5 table-8: details of data dissemination...
TRANSCRIPT

1
I: INTRODUCTION Assam state assembly elections were held into two phases on the 3rd April and 10th April, 2006.The elections were conducted for 126 seats. The findings of the Indian Express/CNN-IBN/CSDS survey reported here are based on a post-poll survey conducted in 32out of 126 assembly constituencies in Assam where polling was held in two phases of assembly election. The aim of the present post poll was to understand a disposition of the electorates which laid them to cast vote to particular party. Apart from that, it also helps to find and analyze the gap in electorates’ opinion after pre poll survey which usually provides a vague picture of the electorates’ frame of mind. Besides this, due to large sample size and wide coverage, it was decided to collect information on aspects linked with governance like development, socio-cultural and economic aspects, health, performance of the government and expectation from the next government. Table -1: Background of the Assembly election in Assam, 2006 Total Number of Assembly Constituencies(AC) 126 Number of seats for General Category 102 Number of seats reserved for Scheduled Caste 8 Number of seats reserved for Scheduled Tribe 16 Total Number of Voters 13201138 Voter turn out (%) 76 Source: Indian election statistics are available at the Election Commission of India’s website: www.eci.gov.in. Table-2: Election Results Party Seats Contested Seats won Votes Share (percent) AGP+* 126 28 24 INC 120 53 31 BJP 125 10 12 Others ** 626 45 33 Source: Indian election statistics are available at the Election Commission of India’s website: www.eci.gov.in.
*AGP+ includes CPM, ASDC, CPI, TNGP **Others Includes IND, AUDF, BJP, AGP (P), NCP, LKS,LS,MUL,NBNP,NLP,PDF,RCPI (R), RGD,RJD,RPI,RSP,SAP,SJP(R),SP,UBNLF,UMFA, URMCA,UTNLF,AIMF,AITC,AMP,CPI(ML) (L),ASDC(P) ASDC (U), HSKP,JD (S), JD (U), LJNSP, LJP.
Table-3: Survey Frame Number of assembly constituencies surveyed 32 Number of polling station survey 124 Number of Respondents 2702 Type of Survey Post poll Survey

2
Table-4: Sample Profile: Census of India vs. Survey Variables Assam* (percent) Survey (percent) Rural 87 85 Urban 12 15 Women 48 45 Scheduled Caste 7 14 Scheduled Tribe 12 11 Hindu 65 75 Muslim 31 21 Christian 4 3 Other** -- 1
*Census 2001, Assam ** Jains and Sikhs

3
II: SURVEY DESIGN Selection of Assembly Constituency (AC): For the post poll survey, it was decided to cover three-fifth of the total assembly constituencies, that is, 32 assembly constituencies. Assam Elections were held in two phases. In order to maintain consistency with the elections held, post poll survey was also conducted in two phases. Assembly constituencies for the two phases were selected randomly using the probability proportionate to size (PPS) method. PPS method assures the same probability of larger as well as smaller sites. Probability Proportionate To Size (PPS) A list of all assembly constituencies were arranged in ascending order along with total number of electorates per assembly constituency then cumulative population of electorates was calculated. It was decided to conduct a survey in 32 assembly constituencies in the state out of the 126ACs. Thus, to arrive at sampling interval (SI) (or sampling constant), total population of electorates divided by 32 (suppose total electorates of the state was 32, 00000, divided by32 sampling interval becomes 100000). After that, a number less than calculated sampling interval is selected randomly i.e. between one and SI, in the column of cumulative population of electorates (suppose, randomly selected number was 10,000). This number is Random Start (RS). Random start is the first Assembly constituency. Calculate the following series: RS; RS+SI, RS+2SI; RS+3SI…, and these numbers of calculated series were matched in the column cumulative population of electorates and thus, lead to random selection of the ACs. Selection of Polling Stations (PS): It was predefined to interview respondent from randomly selected four polling stations of each assembly constituency. In order to select the polling station from each AC, a comprehensive list of PS in each AC was prepared and the total number of polling stations were divided by four (a pre determined number from each AC) to arrive at the sampling constant or sampling interval. First Polling station was selected randomly which ought to be less than sampling constant thereafter, sampling constant was added to the randomly selected PS to arrive at the second PS . This process was repeated for the selection of next polling stations in an assembly constituency. It is how; different polling stations were selected in each assembly constituency.

4
Selection of respondent: Thirty respondents were randomly selected from the voter list of each polling station. The reason for sample size was to circumvent clustering and it also has logistic and methodological concerns. For this, a list of voters at each polling station was obtained and the total number of voters (at each PS) was divided by thirty to arrive at sampling constant1.Sampling constant was added to the first respondent number to get next respondent and so on till selection of 30 respondent has completed. For the present household survey a structured interview schedule was used and fieldworkers were cautiously selected. Only those who have acquaintance with the region were selected and given training thereafter as it facilitate in improving interviewer performance and subsequently, of the whole survey. Table-5: Questionnaire Design 1. Language Designed English 2. Language Translated -- 3. Language Administered Assamese 4. Number of Variables 106 5. Themes • Respondent’s Background
• Comparison on performance of previous and present government
• Performance of the MLAs • Public opinion about the politics in the state. • Question of Leadership
Table-6 Details of Training Workshop of Investigator: 1. Date 2-3, April,2006 2. Venue Dept. of Political Science, Guwahati University 3. Number of Investigator 64 4. Resource person(s) • Sandhya Goswami, Assam
• Akil Ranjan Dutta, Assam Table-7: Data Collection and Processing Details 1. Date of Field work
Phase-I Phase-II
4 -8 , April , 2006 11-15, April , 2006
2. Date of Data checking 9 April, 2006 3. Venue of Checking Centre for Study of Developing Societies (CSDS) 4. Date of Data Entry 10 April, 2006 5. Venue of Data Entry Centre for Study of Developing Societies (CSDS)
1 If there are 3000 respondents of a polling station, divide 3000 by 30 that will be equal to 100. Thus 100 is the sampling constant for sampling respondents for the survey. The first respondent should be less than 100 drawn from random number table. Thus , if 89th voter is the first respondent selected then keep on adding 100, that is 89+100=189(second respondent), 189+100=289(third respondent) and so on till select 30 respondent

5
Table-8: Details of Data Dissemination Electronic Media Name Date Time CNN-IBN 10 April, 2006 8.00pm Print Media Name Title of Article Name of Author Date The Hindu (Delhi) Congress close to
majority in Assam Sanjay Kumar,Rajeev Karandikar, Sandhya Goswami and Yogendra Yadav
11, April, 2006
The Hindu (Delhi) How Assam Voted 18, May, 2006 The Hindu (Delhi) A story of political
and ethnic fragmentation
Yogendra Yadav 18, May, 2006

6
III: DETAILS OF SURVEY TEAM III. Details of Survey Team Sanjay Kumar of Centre for the Study of Developing Societies (CSDS), Delhi directed the survey. The fieldwork for the survey was coordinated by Sandhya Goswami, state coordinator of Asaam, and Akhil Ranjan Dutta. The central team which designed, coordinated and analyzed the survey compriosed D.L Sheth, V.B. Singh, Yogendra Yadav, Sanjeer Alam, Bansmita Bora, Praveen Rai, Pallavi Shrivastava, Vikas Guatam, K.A.Q.A Hilal, Himanshu Bhattacharya, Kamchan Malhotra, Ninu Nair and Ramjayam of CSDS, and Professor Rajeev Karandikar of the Indian Statistical Institute (ISI), Delhi.

7
I: ANNEXURE-1
DETAILS OF SURVEY PROFILE
Assembly Constituency
Ac. No PS No No. of respondent
2 3 22 41 21 79 22 117 22
Patharkandi
Total 87 4 4 22
44 21 84 21 124 21
Karimganj South
Total 85 6 6 23
43 22 80 22
Hailakandi
Total 67 8 11 22
48 22 85 22 122 22
Algapur
Total 88 10 5 22
41 23 77 21 113 22
Sonai
Total 88 11 4 22
42 22 80 22 118 22
Dholai (SC)
Total 88 14 7 21
38 22 69 21 100 19
Barkhola
Total 83 48 11 20
46 21 81 21 116 20
Boko (SC)
Total 82 50 10 22
43 17 76 22 109 16
Palasbari
Total 77

8
52 3 21 61 22 119 22 177 20
Dispur
Total 85 53 21 21
67 21 113 18 159 21
Gauhati East
Total 81 54 20 21
74 20 182 36
Gauhati West
Total 77 56 13 22
50 21 87 20 124 22
Kamalpur
Total 85 79 4 22
43 22 82 23 121 22
Jagiroad (SC)
Total 89 81 34 33
65 21 96 22
Laharighat
Total 76 91 20 24
120 23 170 22
Hojai
Total 69 93 20 17
50 20 84 21 110 19
Bokakhat
Total 77 95 11 23
52 20 93 20 134 20
Golaghat
Total 83 97 21 22
57 22 93 23 129 24
Dergaon (SC)
Total 91 99 30 22
60 22 90 22
Majuli (ST)
120 22

9
Total 88 102 31 21
62 22 93 21 124 16
Teok
Total 80 104 21 22
51 22 81 22
Nazira
111 22 Total 88
106 15 20 54 20 93 18 132 22
Sonari
Total 80 109 19 21
50 22 81 22 112 21
Bihupuria
Total 86 111 21 22
58 21 95 21 132 22
Lakhimpur
Total 86 113 46 22
90 22 135 22 179 22
Dhemaji (ST)
Total 88 115 21 22
52 22 83 21 114 22
Moran
Total 87 117 25 23
54 41 83 23 112 23
Lahowal
Total 110 119 19 22
50 22 81 22 112 22
Tingkhong
Total 88 122 26 22
64 22 102 22 140 22
Tinsukia
Total 88

10
124 23 22 64 22 105 22 146 22
Margherita
Total 88 126 4 22
40 21 76 22 112 22
Sadiya
Total 87 Source: CSDS Data Unit

11
II. ANNEXURE-2
MARGINAL OF ALL QUESTIONS
Q1: While taking to people about the just concluded AssemblyElection, we found that some people were able to vote and some
were not able to vote. Were you able to vote or not?
159 5.9 5.9 5.92539 94.0 94.0 99.9
4 .1 .1 100.02702 100.0 100.0
NoYesDKTotal
ValidFrequency Percent
ValidPercent
Cumulative Percent
Q1(a): (If voted) Whom did you vote for?
965 35.7 35.7 35.7399 14.8 14.8 50.5
6 .2 .2 50.740 1.5 1.5 52.2
2 .1 .1 52.31 .0 .0 52.3
14 .5 .5 52.813 .5 .5 53.3
628 23.2 23.2 76.562 2.3 2.3 78.8
149 5.5 5.5 84.39 .3 .3 84.72 .1 .1 84.8
12 .4 .4 85.2203 7.5 7.5 92.7
20 .7 .7 93.414 .5 .5 94.0
163 6.0 6.0 100.02702 100.0 100.0
01: Congress02: BJP03: JD(U)04: CPI05: CPI(M)06: BSP16: NCP42: CPI (M) (L)61: AGP62: AGP(P)63: AUDF64: UDF(P)65: NAGP66: TGP96: Independents97: Others98: DK99: NATotal
ValidFrequency Percent
ValidPercent
Cumulative Percent

12
Q1(b): (If voted) When did you finally make up your mind about whom to vote for?
233 8.6 8.6 8.6
290 10.7 10.7 19.4
504 18.7 18.7 38.0
1465 54.2 54.2 92.2
47 1.7 1.7 94.0163 6.0 6.0 100.0
2702 100.0 100.0
On the day of pollingA day or two beforepollingDuring the campaignBefore the campaignstartedDKNATotal
ValidFrequency Percent
ValidPercent
Cumulative Percent
Q1(c): (If voted) Did the election officer correctly put the mark on your
finger?
88 3.3 3.3 3.32430 89.9 89.9 93.2
21 .8 .8 94.0163 6.0 6.0 100.0
2702 100.0 100.0
Mark not foundMark foundCould not checkNATotal
ValidFrequency Percent
ValidPercent
Cumulative Percent
Q1(d): (If not Voted) What was the main reason due to which you could notvote in this election?
26 1.0 1.0 1.057 2.1 2.1 3.111 .4 .4 3.5
1 .0 .0 3.5
9 .3 .3 3.8
11 .4 .4 4.348 1.8 1.8 6.0
2539 94.0 94.0 100.02702 100.0 100.0
Out of stationNot wellNo interestPrevented/Fear ofviolenceReturned, for lackof identity proofOthersDKNATotal
ValidFrequency Percent
ValidPercent
Cumulative Percent

13
Q2: Now i will ask you about the Lok Sabha Election 2004. Wereyou able to cast your vote or not?
576 21.3 21.3 21.32099 77.7 77.7 99.0
27 1.0 1.0 100.02702 100.0 100.0
NoYesDKTotal
ValidFrequency Percent
ValidPercent
Cumulative Percent
Q2(a): (If yes) Whom did you vote in Lok Sabha Election 2004?
1071 39.6 39.6 39.6381 14.1 14.1 53.7
1 .0 .0 53.822 .8 .8 54.6
1 .0 .0 54.64 .1 .1 54.82 .1 .1 54.8
553 20.5 20.5 75.34 .1 .1 75.5
10 .4 .4 75.81 .0 .0 75.9
22 .8 .8 76.77 .3 .3 76.9
20 .7 .7 77.7603 22.3 22.3 100.0
2702 100.0 100.0
01: Congress02: BJP03: JD(U)04: CPI05: CPI(M)16: NCP34: Samata party61: AGP62: AGP(P)63: AUDF64: UDF(P)96: Independents97: Others98: DK99: NATotal
ValidFrequency Percent
ValidPercent
Cumulative Percent
Q3: Now let us talk about the election campaign during this election. How much interested were you in the election campaign this time?
1009 37.3 37.3 37.31257 46.5 46.5 83.9
407 15.1 15.1 98.929 1.1 1.1 100.0
2702 100.0 100.0
Not at allSomewhatGreat dealDKTotal
ValidFrequency Percent
ValidPercent
Cumulative Percent

14
Q4(a): Did you attend election meeting?
1264 46.8 46.8 46.81438 53.2 53.2 100.02702 100.0 100.0
NoYesTotal
ValidFrequency Percent
ValidPercent
Cumulative Percent
Q4(b): Did you helpe organised meetings
2046 75.7 75.7 75.7656 24.3 24.3 100.0
2702 100.0 100.0
NoYesTotal
ValidFrequency Percent
ValidPercent
Cumulative Percent
Q4(c): Did you join processions?
2059 76.2 76.2 76.2643 23.8 23.8 100.0
2702 100.0 100.0
NoYesTotal
ValidFrequency Percent
ValidPercent
Cumulative Percent
Q(d): Did you participate in door to door canvassing?
2416 89.4 89.4 89.4286 10.6 10.6 100.0
2702 100.0 100.0
NoYesTotal
ValidFrequency Percent
ValidPercent
Cumulative Percent
Q4(e): Did you contribute or collect money?
2583 95.6 95.6 95.6119 4.4 4.4 100.0
2702 100.0 100.0
NoYesTotal
ValidFrequency Percent
ValidPercent
Cumulative Percent

15
Q4(f): Did you distribute election leaflets
2403 88.9 88.9 88.9299 11.1 11.1 100.0
2702 100.0 100.0
NoYesTotal
ValidFrequency Percent
ValidPercent
Cumulative Percent
Q5: Did any candidate, party worker or canvesser come to yourhouse during the campaign to ask for your vote?
1146 42.4 42.4 42.41531 56.7 56.7 99.1
25 .9 .9 100.02702 100.0 100.0
NoYesDKTotal
ValidFrequency Percent
ValidPercent
Cumulative Percent
Q6: Who would you prefer as the next Chief Minister of Assam?
884 32.7 34.7 34.7762 28.2 30.0 64.7
39 1.4 1.5 66.2
56 2.1 2.2 68.4
10 .4 .4 68.8
184 6.8 7.2 76.1
72 2.7 2.8 78.9250 9.3 9.8 88.7287 10.6 11.3 100.0
2544 94.2 100.056 2.1
102 3.8158 5.8
2702 100.0
01: Tarun Gogoi02: Brindaban Goswami03: Sarbananda Sonowal04: Prafulla KumarMohanta05: Hema Prabha Saikia20: Any one fromCongress21: Any one from AGP22: Any one from BJP97: OthersTotal
Valid
98: DK99: Blank/RefusedTotal
Missing
Total
Frequency PercentValid
PercentCumulative Percent

16
Q7: While deciding to vote, what would be the most important considerationfor you?
1262 46.7 46.7 46.71247 46.2 46.2 92.9
63 2.3 2.3 95.263 2.3 2.3 97.567 2.5 2.5 100.0
2702 100.0 100.0
CandidatePartyCaste-communitySomething elseNo opinionTotal
ValidFrequency Percent
ValidPercent
Cumulative Percent
Q8: What is your assessment of the work done by the Congress govt. in Assamduring the last 5 years. Are you satisfied or dissatisfied?
411 15.2 15.2 15.21159 42.9 42.9 58.1
435 16.1 16.1 74.2629 23.3 23.3 97.5
68 2.5 2.5 100.02702 100.0 100.0
Fully satisfiedSomewhat satisfiedSomewhat dissatisfiedFully dissatisfiedNo opinionTotal
ValidFrequency Percent
ValidPercent
Cumulative Percent
Q9: Now I would like to compare the present Congress govt. in the state withthe previous AGP led govt. Which govt. do you think better?
1195 44.2 44.2 44.2693 25.6 25.6 69.9259 9.6 9.6 79.5444 16.4 16.4 95.9111 4.1 4.1 100.0
2702 100.0 100.0
Congress Govt.AGP Govt.Both equally goodBoth equally badNo opinionTotal
ValidFrequency Percent
ValidPercent
Cumulative Percent
Q10(a): The condition of roads has improved or deteriorated?
441 16.3 16.3 16.31337 49.5 49.5 65.8
258 9.5 9.5 75.4498 18.4 18.4 93.8159 5.9 5.9 99.7
9 .3 .3 100.02702 100.0 100.0
Fully improvedSomewhat improvedSomewhat deterioratedFully DeterioratedNo changesNo opinionTotal
ValidFrequency Percent
ValidPercent
Cumulative Percent

17
Q10(b): The supply of electricity has improved or deteriorated?
255 9.4 9.4 9.41066 39.5 39.5 48.9
378 14.0 14.0 62.9650 24.1 24.1 86.9326 12.1 12.1 99.0
27 1.0 1.0 100.02702 100.0 100.0
Fully improvedSomewhat improvedSomewhat deterioratedFully DeterioratedNo changesNo opinionTotal
ValidFrequency Percent
ValidPercent
Cumulative Percent
Q10(c): The supply of drinking water has improved or deteriorated?
221 8.2 8.2 8.2897 33.2 33.2 41.4390 14.4 14.4 55.8747 27.6 27.6 83.5426 15.8 15.8 99.2
21 .8 .8 100.02702 100.0 100.0
Fully improvedSomewhat improvedSomewhat deterioratedFully DeterioratedNo changesNo opinionTotal
ValidFrequency Percent
ValidPercent
Cumulative Percent
Q10(d): Quality of education in Govt. Schools has improved or deteriorated?
281 10.4 10.4 10.41027 38.0 38.0 48.4
378 14.0 14.0 62.4588 21.8 21.8 84.2304 11.3 11.3 95.4124 4.6 4.6 100.0
2702 100.0 100.0
Fully improvedSomewhat improvedSomewhat deterioratedFully DeterioratedNo changesNo opinionTotal
ValidFrequency Percent
ValidPercent
Cumulative Percent

18
Q10(e): Medical facilities in Govt. hospitals has improved or deteriorated?
178 6.6 6.6 6.6832 30.8 30.8 37.4422 15.6 15.6 53.0867 32.1 32.1 85.1324 12.0 12.0 97.1
79 2.9 2.9 100.02702 100.0 100.0
Fully improvedSomewhat improvedSomewhat deterioratedFully DeterioratedNo changesNo opinionTotal
ValidFrequency Percent
ValidPercent
Cumulative Percent
Q10(f): Law and order situation has improved or deteriorated?
252 9.3 9.3 9.3938 34.7 34.7 44.0359 13.3 13.3 57.3528 19.5 19.5 76.9423 15.7 15.7 92.5202 7.5 7.5 100.0
2702 100.0 100.0
Fully improvedSomewhat improvedSomewhat deterioratedFully DeterioratedNo changesNo opinionTotal
ValidFrequency Percent
ValidPercent
Cumulative Percent
Q11: What is your assessment of the work done by Manmohan Singh led UPA Govtat the Centre in last two-and-half years. Are you Satisfied or dissatisfied with it?
367 13.6 13.6 13.61425 52.7 52.7 66.3
371 13.7 13.7 80.1264 9.8 9.8 89.8275 10.2 10.2 100.0
2702 100.0 100.0
Fully satisfiedSomewhat satisfiedSomewhat dissatisfiedFully dissatisfiedNo opinionTotal
ValidFrequency Percent
ValidPercent
Cumulative Percent
Q12: Do you think that the present Congress govt. in the stateshould be given another chance?
1495 55.3 55.3 55.31115 41.3 41.3 96.6
92 3.4 3.4 100.02702 100.0 100.0
NoYesDKTotal
ValidFrequency Percent
ValidPercent
Cumulative Percent

19
Q13: What is your opinion about the qualition government?
513 19.0 19.0 19.0746 27.6 27.6 46.6
577 21.4 21.4 67.9
776 28.7 28.7 96.7
90 3.3 3.3 100.02702 100.0 100.0
Could not understandThere is no harm in itAcceptable only inspecial circumstancesCoalition governmentis not goodDKTotal
ValidFrequency Percent
ValidPercent
Cumulative Percent
Q14: How do you rate the present govt. of Assam in terms of corruption?
625 23.1 23.1 23.11530 56.6 56.6 79.8
421 15.6 15.6 95.3126 4.7 4.7 100.0
2702 100.0 100.0
Very corruptSomewhat corruptNot at all corruptDKTotal
ValidFrequency Percent
ValidPercent
Cumulative Percent
Q15: How would you rate Tarun Gogoi performance as the ChiefMinister of your state?
155 5.7 5.7 5.7850 31.5 31.5 37.2
1437 53.2 53.2 90.4207 7.7 7.7 98.0
53 2.0 2.0 100.02702 100.0 100.0
Very badBadGoodVery goodDKTotal
ValidFrequency Percent
ValidPercent
Cumulative Percent

20
Q16: Thinking of how you have voted in previous elections, how would you describeyourself?
923 34.2 34.6 34.6471 17.4 17.7 52.3223 8.3 8.4 60.6
1050 38.9 39.4 100.0
2667 98.7 100.035 1.3
2702 100.0
Congress supporterAGP supportterBJP supporterNot a committedsupporter of any partyTotal
Valid
DKMissingTotal
Frequency PercentValid
PercentCumulative Percent
Q17(a): Who is your MLA?
209 7.7 7.7 7.72458 91.0 91.0 98.7
35 1.3 1.3 100.02702 100.0 100.0
IncorrectCorrectDKTotal
ValidFrequency Percent
ValidPercent
Cumulative Percent
Q17(b): Which party does he belong to?
267 9.9 9.9 9.92403 88.9 88.9 98.8
32 1.2 1.2 100.02702 100.0 100.0
IncorrectCorrectDKTotal
ValidFrequency Percent
ValidPercent
Cumulative Percent
Q17(c): Has he never visited your locality?
881 32.6 32.6 32.61763 65.2 65.2 97.9
58 2.1 2.1 100.02702 100.0 100.0
NoYesDKTotal
ValidFrequency Percent
ValidPercent
Cumulative Percent

21
Q17(d): Does he have a criminal image?
1827 67.6 67.6 67.6560 20.7 20.7 88.3315 11.7 11.7 100.0
2702 100.0 100.0
NoYesDKTotal
ValidFrequency Percent
ValidPercent
Cumulative Percent
Q17(e): Is he considered corrupt?
1546 57.2 57.2 57.2885 32.8 32.8 90.0271 10.0 10.0 100.0
2702 100.0 100.0
NoYesDKTotal
ValidFrequency Percent
ValidPercent
Cumulative Percent
Q17(f): Are you satisfied with his work in your locality?
1692 62.6 62.6 62.6956 35.4 35.4 98.0
54 2.0 2.0 100.02702 100.0 100.0
NoYesDKTotal
ValidFrequency Percent
ValidPercent
Cumulative Percent
Q17(g): Would you like to give him another chance?
1753 64.9 64.9 64.9880 32.6 32.6 97.4
69 2.6 2.6 100.02702 100.0 100.0
NoYesDKTotal
ValidFrequency Percent
ValidPercent
Cumulative Percent
Q18: Keeping in view the work done by your MLA in your area during the last 5 years, how many marks will you give him out of 100?
Frequency Percent Valid Percent
Cumulative Percent
Valid -1 1 .0 .0 .0 0 102 3.8 3.8 3.8 1 9 .3 .3 4.1 2 7 .3 .3 4.4 4 3 .1 .1 4.5 5 38 1.4 1.4 5.9 6 1 .0 .0 6.0 7 2 .1 .1 6.0

22
8 1 .0 .0 6.1 9 7 .3 .3 6.3 10 174 6.4 6.4 12.8 11 2 .1 .1 12.8 12 6 .2 .2 13.1 14 2 .1 .1 13.1 15 43 1.6 1.6 14.7 17 5 .2 .2 14.9 18 1 .0 .0 15.0 19 1 .0 .0 15.0 20 259 9.6 9.6 24.6 21 2 .1 .1 24.6 22 2 .1 .1 24.7 23 1 .0 .0 24.8 25 110 4.1 4.1 28.8 26 1 .0 .0 28.9 27 3 .1 .1 29.0 28 3 .1 .1 29.1 29 8 .3 .3 29.4 30 305 11.3 11.3 40.7 31 2 .1 .1 40.7 32 3 .1 .1 40.9 33 1 .0 .0 40.9 34 2 .1 .1 41.0 35 51 1.9 1.9 42.9 36 3 .1 .1 43.0 38 1 .0 .0 43.0 39 1 .0 .0 43.0 40 257 9.5 9.5 52.6 41 1 .0 .0 52.6 42 4 .1 .1 52.7 45 53 2.0 2.0 54.7 46 1 .0 .0 54.7 47 3 .1 .1 54.8 48 3 .1 .1 55.0 49 2 .1 .1 55.0 50 261 9.7 9.7 64.7 52 3 .1 .1 64.8 54 2 .1 .1 64.9 55 31 1.1 1.1 66.0 56 5 .2 .2 66.2 57 1 .0 .0 66.2 58 1 .0 .0 66.3 59 1 .0 .0 66.3 60 171 6.3 6.3 72.6 61 1 .0 .0 72.7 62 2 .1 .1 72.8 65 35 1.3 1.3 74.1 67 2 .1 .1 74.1 68 1 .0 .0 74.2 70 155 5.7 5.7 79.9 72 1 .0 .0 79.9 73 3 .1 .1 80.1 75 43 1.6 1.6 81.6 79 1 .0 .0 81.7 80 139 5.1 5.1 86.8

23
85 26 1.0 1.0 87.8 86 1 .0 .0 87.8 87 1 .0 .0 87.9 89 1 .0 .0 87.9 90 81 3.0 3.0 90.9 95 12 .4 .4 91.3 96 1 .0 .0 91.4 97 1 .0 .0 91.4 99 27 1.0 1.0 92.4 100 27 1.0 1.0 93.4 104 1 .0 .0 93.4 221 1 .0 .0 93.5 301 1 .0 .0 93.5 302 1 .0 .0 93.6 400 1 .0 .0 93.6 483 1 .0 .0 93.6 804 1 .0 .0 93.7 888 1 .0 .0 93.7 999 170 6.3 6.3 100.0 Total 2702 100.0 100.0
Q19(a): Atrocities by armed forces have increased. Do you agree..........?
544 20.1 20.1 20.1853 31.6 31.6 51.7337 12.5 12.5 64.2712 26.4 26.4 90.5256 9.5 9.5 100.0
2702 100.0 100.0
Fully agreeSomewhat agreeSomewhat disagreeFully disagreeNo opinionTotal
ValidFrequency Percent
ValidPercent
Cumulative Percent
Q19(b): Influx of Bangladeshi immigrants has increased. Do you agree..........?
627 23.2 23.2 23.2870 32.2 32.2 55.4261 9.7 9.7 65.1656 24.3 24.3 89.3288 10.7 10.7 100.0
2702 100.0 100.0
Fully agreeSomewhat agreeSomewhat disagreeFully disagreeNo opinionTotal
ValidFrequency Percent
ValidPercent
Cumulative Percent

24
Q19(c): Employment opportunities have increased. Do you agree..........?
119 4.4 4.4 4.4655 24.2 24.2 28.6315 11.7 11.7 40.3
1435 53.1 53.1 93.4178 6.6 6.6 100.0
2702 100.0 100.0
Fully agreeSomewhat agreeSomewhat disagreeFully disagreeNo opinionTotal
ValidFrequency Percent
ValidPercent
Cumulative Percent
Q19(d): Incidence of extortion and kidnappings has increased. Do youagree..........?
294 10.9 10.9 10.9728 26.9 26.9 37.8539 19.9 19.9 57.8736 27.2 27.2 85.0405 15.0 15.0 100.0
2702 100.0 100.0
Fully agreeSomewhat agreeSomewhat disagreeFully disagreeNo opinionTotal
ValidFrequency Percent
ValidPercent
Cumulative Percent
Q19(e): Govt. failed to curb violence in Karbi anglong. Do you agree..........?
790 29.2 29.2 29.2745 27.6 27.6 56.8288 10.7 10.7 67.5318 11.8 11.8 79.2561 20.8 20.8 100.0
2702 100.0 100.0
Fully agreeSomewhat agreeSomewhat disagreeFully disagreeNo opinionTotal
ValidFrequency Percent
ValidPercent
Cumulative Percent
Q19(f): Harassment of muslims has increased on the pretext of detection offoreigners. Do you agree..........?
299 11.1 11.1 11.1593 21.9 21.9 33.0383 14.2 14.2 47.2
1096 40.6 40.6 87.7331 12.3 12.3 100.0
2702 100.0 100.0
Fully agreeSomewhat agreeSomewhat disagreeFully disagreeNo opinionTotal
ValidFrequency Percent
ValidPercent
Cumulative Percent

25
Q20: Have you heard about expulsion of Prafulla Mahanta feomAssom Gana Parishad(AGP)?
663 24.5 24.5 24.51998 73.9 73.9 98.5
41 1.5 1.5 100.02702 100.0 100.0
NoYesDKTotal
ValidFrequency Percent
ValidPercent
Cumulative Percent
Q20(a): (If yes) What is your opinion about the expulsion of Prafulla Mahanta fromthe party?
1080 40.0 40.0 40.0483 17.9 17.9 57.8166 6.1 6.1 64.0141 5.2 5.2 69.2128 4.7 4.7 73.9704 26.1 26.1 100.0
2702 100.0 100.0
Fully satisfiedSomewhat satisfiedSomewhat dissatisfiedFully dissatisfiedNo opinionNATotal
ValidFrequency Percent
ValidPercent
Cumulative Percent
Q21: Have you heard or read about the IMDT Act in Assam?
937 34.7 34.7 34.71726 63.9 63.9 98.6
39 1.4 1.4 100.02702 100.0 100.0
NoYesDKTotal
ValidFrequency Percent
ValidPercent
Cumulative Percent
Q21(a): (If yes) Heard you heard about scrapping of IMDT Act by
the Supreme Court?
153 5.7 5.7 5.71547 57.3 57.3 62.9
26 1.0 1.0 63.9976 36.1 36.1 100.0
2702 100.0 100.0
NoYesDKNATotal
ValidFrequency Percent
ValidPercent
Cumulative Percent

26
Q21(b): (If yes in Q21a) What is your opinion about the scrapping of the Act?
833 30.8 30.8 30.8316 11.7 11.7 42.5119 4.4 4.4 46.9219 8.1 8.1 55.0
60 2.2 2.2 57.31155 42.7 42.7 100.02702 100.0 100.0
Fully justifiedSomewhat justifiedSomewhat unjustifiedFully unjustifiedNo opinionNATotal
ValidFrequency Percent
ValidPercent
Cumulative Percent
Q22(a): The Central Govt. has not done nothing for big Tea garden owners inAssam. Do you agree....?
742 27.5 27.5 27.5807 29.9 29.9 57.3193 7.1 7.1 64.5338 12.5 12.5 77.0622 23.0 23.0 100.0
2702 100.0 100.0
Fully agreeSomewhat agreeSomewhat disagreeFully disagreeNo opinionTotal
ValidFrequency Percent
ValidPercent
Cumulative Percent
Q22(b): The wages for Tea garden workers should be increased. Do youagree....?
1967 72.8 72.8 72.8391 14.5 14.5 87.3
27 1.0 1.0 88.330 1.1 1.1 89.4
287 10.6 10.6 100.02702 100.0 100.0
Fully agreeSomewhat agreeSomewhat disagreeFully disagreeNo opinionTotal
ValidFrequency Percent
ValidPercent
Cumulative Percent

27
Q22(c): State Govt. has neglected the demands of small Tea garden owners/. Doyou agree....?
968 35.8 35.8 35.8870 32.2 32.2 68.0159 5.9 5.9 73.9190 7.0 7.0 80.9515 19.1 19.1 100.0
2702 100.0 100.0
Fully agreeSomewhat agreeSomewhat disagreeFully disagreeNo opinionTotal
ValidFrequency Percent
ValidPercent
Cumulative Percent
Q22(d): State Govt. is responsible for closure of Tea Gardens in Assam. Do youagree....?
1058 39.2 39.2 39.2718 26.6 26.6 65.7208 7.7 7.7 73.4231 8.5 8.5 82.0487 18.0 18.0 100.0
2702 100.0 100.0
Fully agreeSomewhat agreeSomewhat disagreeFully disagreeNo opinionTotal
ValidFrequency Percent
ValidPercent
Cumulative Percent
Q23: Have you heard or read about the police firing inKakopather?
900 33.3 33.3 33.31767 65.4 65.4 98.7
35 1.3 1.3 100.02702 100.0 100.0
NoYesDKTotal
ValidFrequency Percent
ValidPercent
Cumulative Percent
Q23(a): (If yes) What is your opinion about the Govt. handling of Kakopatherincident?
97 3.6 3.6 3.6424 15.7 15.7 19.3373 13.8 13.8 33.1774 28.6 28.6 61.7
99 3.7 3.7 65.4935 34.6 34.6 100.0
2702 100.0 100.0
Fully SatisfiedSomewhat satisfiedSomewhat dissatisfiedFully dissatisfiedNo opinionNATotal
ValidFrequency Percent
ValidPercent
Cumulative Percent

28
Q24: Would you have preffered an alliance of AGP and BJP inAssam for contesting the Assembly Elections?
1719 63.6 63.6 63.6602 22.3 22.3 85.9381 14.1 14.1 100.0
2702 100.0 100.0
NoYesDKTotal
ValidFrequency Percent
ValidPercent
Cumulative Percent
Q24(a): (If yes) If BJP and AGP were contesting Assembly Electionas allies would that have influenced your voting decision?
377 14.0 14.0 14.0203 7.5 7.5 21.5
22 .8 .8 22.32100 77.7 77.7 100.02702 100.0 100.0
NoYesDKNATotal
ValidFrequency Percent
ValidPercent
Cumulative Percent
Q24b: (If yes) How this alliance would have influenced your voting decision?
10 .4 .4 .4
33 1.2 1.2 1.6
161 6.0 6.0 7.5
9 .3 .3 7.9
154 5.7 5.7 13.6235 8.7 8.7 22.3
2100 77.7 77.7 100.02702 100.0 100.0
Shift from AGP/BJPto CongressShift from Congressto AGP/BJPMore committed toAGP/BJPMore committed toCongressNo changeDKNATotal
ValidFrequency Percent
ValidPercent
Cumulative Percent

29
Q25: Which party or alliance would you like to form the government in Assamafter this Election?
767 28.4 28.4 28.4267 9.9 9.9 38.3
2 .1 .1 38.34 .1 .1 38.5
328 12.1 12.1 50.6466 17.2 17.2 67.9
18 .7 .7 68.55 .2 .2 68.7
504 18.7 18.7 87.425 .9 .9 88.384 3.1 3.1 91.4
5 .2 .2 91.62 .1 .1 91.71 .0 .0 91.73 .1 .1 91.8
54 2.0 2.0 93.8167 6.2 6.2 100.0
2702 100.0 100.0
01: Congress02: BJP03: JD(U)04: CPI10: Congress Allies20: AGP allies30: AGP(P) Allies40: BJP allies61: AGP62: AGP(P)63: AUDF64: UDF(P)65: NAGP66: TGP96: Independents97: Others99: NATotal
ValidFrequency Percent
ValidPercent
Cumulative Percent
Q26: Do you feel close to any party?
2117 78.3 78.3 78.3585 21.7 21.7 100.0
2702 100.0 100.0
NoYesTotal
ValidFrequency Percent
ValidPercent
Cumulative Percent

30
Q26(a): (If yes) Which party?
294 10.9 10.9 10.968 2.5 2.5 13.4
3 .1 .1 13.5147 5.4 5.4 18.9
18 .7 .7 19.632 1.2 1.2 20.8
4 .1 .1 20.91 .0 .0 21.06 .2 .2 21.2
12 .4 .4 21.72117 78.3 78.3 100.02702 100.0 100.0
01: Congress02: BJP04: CPI61: AGP62: AGP(P)63: AUDF64: UDF(P)96: Independents97: Others98: DK99: NATotal
ValidFrequency Percent
ValidPercent
Cumulative Percent
Q27: Is there a party you will never vote?
2304 85.3 85.3 85.3398 14.7 14.7 100.0
2702 100.0 100.0
NoYesTotal
ValidFrequency Percent
ValidPercent
Cumulative Percent
Q27(a): (If yes) Which party?
106 3.9 3.9 3.9130 4.8 4.8 8.7
5 .2 .2 8.913 .5 .5 9.4
1 .0 .0 9.41 .0 .0 9.5
72 2.7 2.7 12.15 .2 .2 12.3
33 1.2 1.2 13.56 .2 .2 13.87 .3 .3 14.05 .2 .2 14.2
14 .5 .5 14.72304 85.3 85.3 100.02702 100.0 100.0
01: Congress02: BJP04: CPI05: CPI(M)16: NCP42: CPI (M) (L)61: AGP62: AGP(P)63: AUDF64: UDF(P)96: Independents97: Others98: DK99: NATotal
ValidFrequency Percent
ValidPercent
Cumulative Percent

31
Q28(a): How much trust do you have on Tarub Gogoi?
1033 38.2 40.2 40.2512 18.9 19.9 60.1378 14.0 14.7 74.8264 9.8 10.3 85.0124 4.6 4.8 89.9
92 3.4 3.6 93.461 2.3 2.4 95.827 1.0 1.0 96.938 1.4 1.5 98.343 1.6 1.7 100.0
2572 95.2 100.0100 3.7
30 1.1130 4.8
2702 100.0
01: One02: Two03: Three04: Four05: Five06: Six07: Seven08: Eight09: Nine10: TenTotal
Valid
88: No opinion99Total
Missing
Total
Frequency PercentValid
PercentCumulative Percent
Q28(b): How much trust do you have on Brindaban Goswami?
952 35.2 38.2 38.2711 26.3 28.6 66.8409 15.1 16.4 83.2136 5.0 5.5 88.7113 4.2 4.5 93.3
56 2.1 2.2 95.554 2.0 2.2 97.724 .9 1.0 98.619 .7 .8 99.415 .6 .6 100.0
2489 92.1 100.0111 4.1102 3.8213 7.9
2702 100.0
01: One02: Two03: Three04: Four05: Five06: Six07: Seven08: Eight09: Nine10: TenTotal
Valid
88: No opinion99Total
Missing
Total
Frequency PercentValid
PercentCumulative Percent

32
Q28(c): How much trust do you have on Prafulla Kumar Mahanta?
87 3.2 3.6 3.6384 14.2 15.8 19.3651 24.1 26.7 46.0556 20.6 22.8 68.8159 5.9 6.5 75.3114 4.2 4.7 80.0142 5.3 5.8 85.8101 3.7 4.1 90.0
99 3.7 4.1 94.1145 5.4 5.9 100.0
2438 90.2 100.0173 6.4
91 3.4264 9.8
2702 100.0
01: One02: Two03: Three04: Four05: Five06: Six07: Seven08: Eight09: Nine10: TenTotal
Valid
88: No opinion99Total
Missing
Total
Frequency PercentValid
PercentCumulative Percent
Q28(d): How much trust do you have on Santosh Mohan Deb?
140 5.2 6.9 6.9401 14.8 19.7 26.6373 13.8 18.3 44.9566 20.9 27.8 72.8
83 3.1 4.1 76.873 2.7 3.6 80.493 3.4 4.6 85.093 3.4 4.6 89.6
125 4.6 6.1 95.787 3.2 4.3 100.0
2034 75.3 100.0241 8.9427 15.8668 24.7
2702 100.0
01: One02: Two03: Three04: Four05: Five06: Six07: Seven08: Eight09: Nine10: TenTotal
Valid
88: No opinion99Total
Missing
Total
Frequency PercentValid
PercentCumulative Percent
33
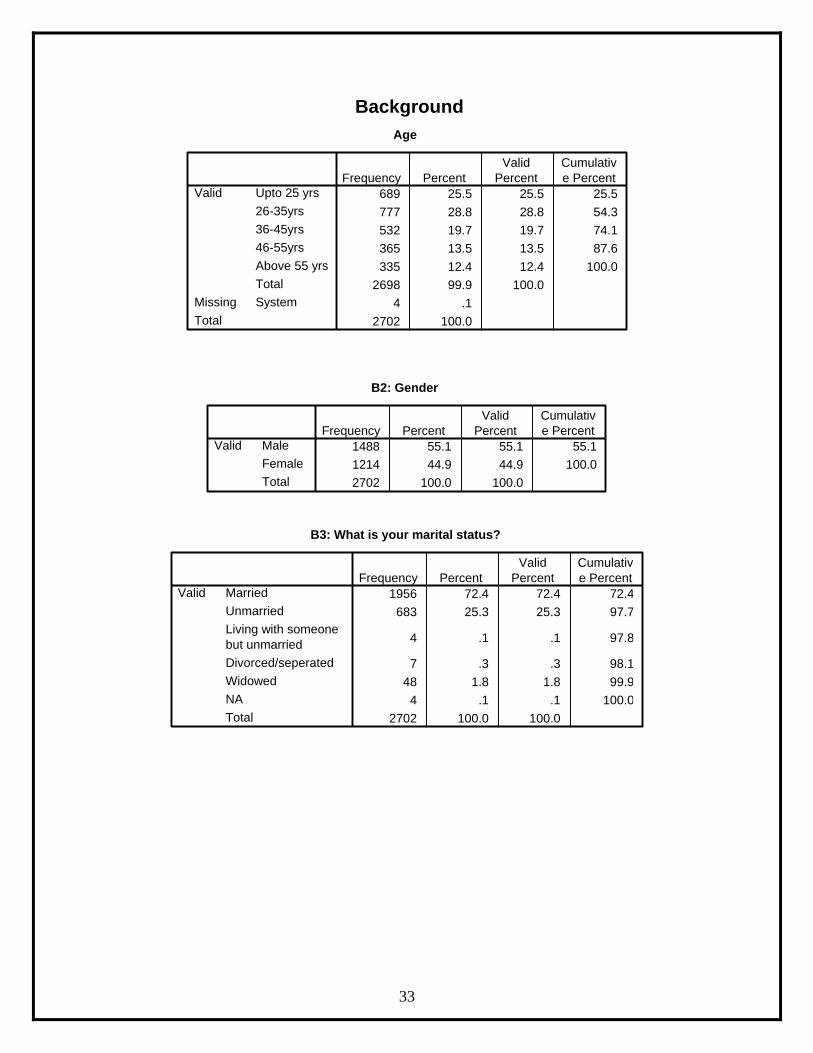
Background Age
689 25.5 25.5 25.5777 28.8 28.8 54.3532 19.7 19.7 74.1365 13.5 13.5 87.6335 12.4 12.4 100.0
2698 99.9 100.04 .1
2702 100.0
Upto 25 yrs26-35yrs36-45yrs46-55yrsAbove 55 yrsTotal
Valid
SystemMissingTotal
Frequency PercentValid
PercentCumulative Percent
B2: Gender
1488 55.1 55.1 55.11214 44.9 44.9 100.02702 100.0 100.0
MaleFemaleTotal
ValidFrequency Percent
ValidPercent
Cumulative Percent
B3: What is your marital status?
1956 72.4 72.4 72.4683 25.3 25.3 97.7
4 .1 .1 97.8
7 .3 .3 98.148 1.8 1.8 99.9
4 .1 .1 100.02702 100.0 100.0
MarriedUnmarriedLiving with someonebut unmarriedDivorced/seperatedWidowedNATotal
ValidFrequency Percent
ValidPercent
Cumulative Percent

34
B4: Education (Respondent)
467 17.3 17.3 17.3221 8.2 8.2 25.5352 13.0 13.0 38.5456 16.9 16.9 55.4437 16.2 16.2 71.5
410 15.2 15.2 86.7
307 11.4 11.4 98.135 1.3 1.3 99.4
12 .4 .4 99.8
5 .2 .2 100.02702 100.0 100.0
Non literateBelow primaryPrimary pass/Middle failMiddle pass/Matric failMatricIntermediate/Collegeno degreeGraduate or equivalentPost GraduateProfessional degreeand Higher ResearchNATotal
ValidFrequency Percent
ValidPercent
Cumulative Percent
B4a(1): Education (Father)
1114 41.2 41.2 41.2273 10.1 10.1 51.3392 14.5 14.5 65.8278 10.3 10.3 76.1300 11.1 11.1 87.2
122 4.5 4.5 91.7
125 4.6 4.6 96.427 1.0 1.0 97.4
7 .3 .3 97.6
64 2.4 2.4 100.02702 100.0 100.0
Non literateBelow primaryPrimary pass/Middle failMiddle pass/Matric failMatricIntermediate/Collegeno degreeGraduate or equivalentPost GraduateProfessional degreeand Higher ResearchNATotal
ValidFrequency Percent
ValidPercent
Cumulative Percent

35
B4a(2): Education (Mother)
1571 58.1 58.1 58.1295 10.9 10.9 69.1327 12.1 12.1 81.2201 7.4 7.4 88.6161 6.0 6.0 94.6
49 1.8 1.8 96.4
32 1.2 1.2 97.65 .2 .2 97.7
1 .0 .0 97.8
60 2.2 2.2 100.02702 100.0 100.0
Non literateBelow primaryPrimary pass/Middle failMiddle pass/Matric failMatricIntermediate/Collegeno degreeGraduate or equivalentPost GraduateProfessional degreeand Higher ResearchNATotal
ValidFrequency Percent
ValidPercent
Cumulative Percent
B5: Occupation (Respondent) Frequency Percent Valid Percent Cumulative Percent
Valid 02: Engineers 3 .1 .1 .1 03: Doctors 6 .2 .2 .3 04: Lawyers 2 .1 .1 .4 05: Accountants 3 .1 .1 .5 06: College/Univ. teachers 13 .5 .5 1.0 07: Writers 1 .0 .0 1.0 08: Modern Artists 1 .0 .0 1.1 09: Other higher professionals 2 .1 .1 1.1 10: Science and engineering
technicians 3 .1 .1 1.3
11: Computer operators 5 .2 .2 1.4 12: Alternative doctors 1 .0 .0 1.5 13: Medical technicians 9 .3 .3 1.8 14: School teachers 103 3.8 3.8 5.6 15: Nursery teachers 34 1.3 1.3 6.9 16: Folk and commercial artists 2 .1 .1 7.0 18: Priests 5 .2 .2 7.1 19: Other lower professionals 18 .7 .7 7.8 21: Elected officials(District level) 1 .0 .0 7.8 22: Managers 10 .4 .4 8.2 23: Officials Class I 8 .3 .3 8.5 24: Officials Class II 26 1.0 1.0 9.5 25: Class III Employee 25 .9 .9 10.4 26: Suprintendants 6 .2 .2 10.6 27: Traditional clerks 1 .0 .0 10.7 28: Class IV Employee 24 .9 .9 11.5 29: Other administrative workers 17 .6 .6 12.2 30: Big businessmen 3 .1 .1 12.3 31: Medium businessmen 61 2.3 2.3 14.5 32: Small businessmen 135 5.0 5.0 19.5 33: Petty shopkeeper 59 2.2 2.2 21.7 34: Hawkers,vendors 4 .1 .1 21.9
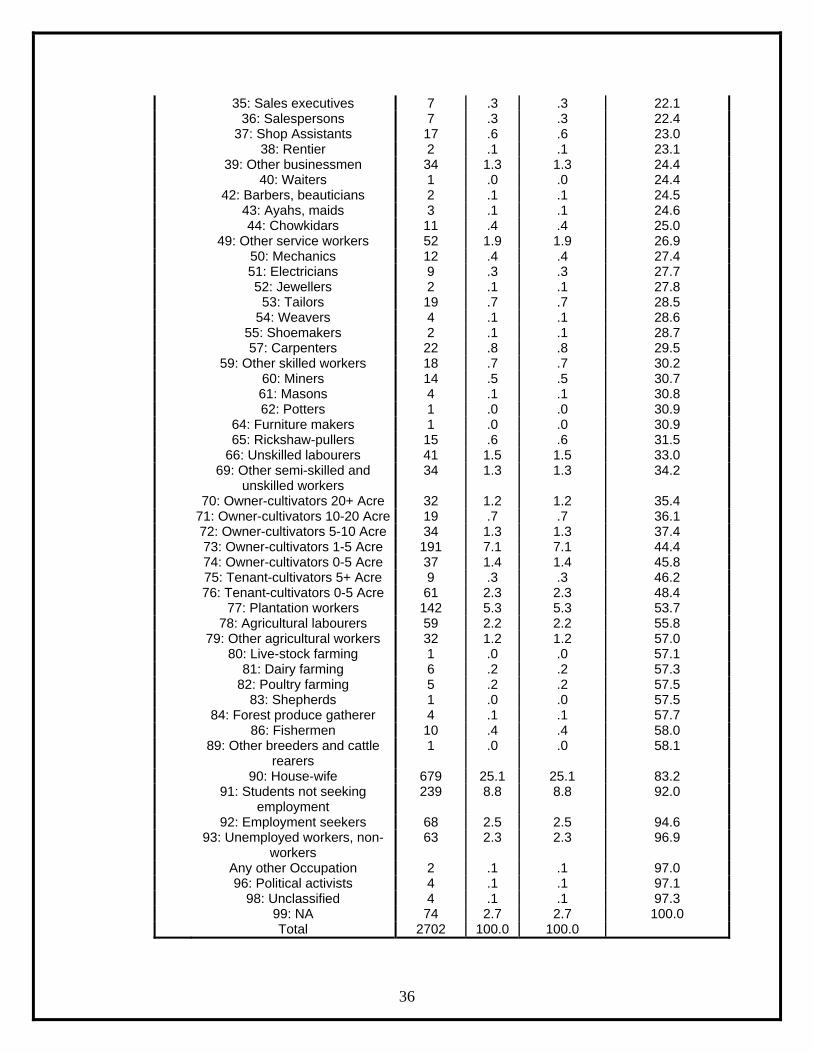
36
35: Sales executives 7 .3 .3 22.1 36: Salespersons 7 .3 .3 22.4 37: Shop Assistants 17 .6 .6 23.0 38: Rentier 2 .1 .1 23.1 39: Other businessmen 34 1.3 1.3 24.4 40: Waiters 1 .0 .0 24.4 42: Barbers, beauticians 2 .1 .1 24.5 43: Ayahs, maids 3 .1 .1 24.6 44: Chowkidars 11 .4 .4 25.0 49: Other service workers 52 1.9 1.9 26.9 50: Mechanics 12 .4 .4 27.4 51: Electricians 9 .3 .3 27.7 52: Jewellers 2 .1 .1 27.8 53: Tailors 19 .7 .7 28.5 54: Weavers 4 .1 .1 28.6 55: Shoemakers 2 .1 .1 28.7 57: Carpenters 22 .8 .8 29.5 59: Other skilled workers 18 .7 .7 30.2 60: Miners 14 .5 .5 30.7 61: Masons 4 .1 .1 30.8 62: Potters 1 .0 .0 30.9 64: Furniture makers 1 .0 .0 30.9 65: Rickshaw-pullers 15 .6 .6 31.5 66: Unskilled labourers 41 1.5 1.5 33.0 69: Other semi-skilled and
unskilled workers 34 1.3 1.3 34.2
70: Owner-cultivators 20+ Acre 32 1.2 1.2 35.4 71: Owner-cultivators 10-20 Acre 19 .7 .7 36.1 72: Owner-cultivators 5-10 Acre 34 1.3 1.3 37.4 73: Owner-cultivators 1-5 Acre 191 7.1 7.1 44.4 74: Owner-cultivators 0-5 Acre 37 1.4 1.4 45.8 75: Tenant-cultivators 5+ Acre 9 .3 .3 46.2 76: Tenant-cultivators 0-5 Acre 61 2.3 2.3 48.4 77: Plantation workers 142 5.3 5.3 53.7 78: Agricultural labourers 59 2.2 2.2 55.8 79: Other agricultural workers 32 1.2 1.2 57.0 80: Live-stock farming 1 .0 .0 57.1 81: Dairy farming 6 .2 .2 57.3 82: Poultry farming 5 .2 .2 57.5 83: Shepherds 1 .0 .0 57.5 84: Forest produce gatherer 4 .1 .1 57.7 86: Fishermen 10 .4 .4 58.0 89: Other breeders and cattle
rearers 1 .0 .0 58.1
90: House-wife 679 25.1 25.1 83.2 91: Students not seeking
employment 239 8.8 8.8 92.0
92: Employment seekers 68 2.5 2.5 94.6 93: Unemployed workers, non-
workers 63 2.3 2.3 96.9
Any other Occupation 2 .1 .1 97.0 96: Political activists 4 .1 .1 97.1 98: Unclassified 4 .1 .1 97.3 99: NA 74 2.7 2.7 100.0 Total 2702 100.0 100.0

37
B5a: Occupation (Father)
Frequency Percent Valid Percent
Cumulative Percent
Valid 02: Engineers 6 .2 .2 .2 03: Doctors 2 .1 .1 .3 04: Lawyers 4 .1 .1 .4 06: College/Univ.
teachers 4 .1 .1 .6
07: Writers 1 .0 .0 .6 09: Other higher
professionals 1 .0 .0 .7
10: Science and engineering technicians
1 .0 .0 .7
11: Computer operators 1 .0 .0 .7 12: Alternative doctors 1 .0 .0 .8 13: Medical technicians 2 .1 .1 .9 14: School teachers 113 4.2 4.2 5.0 15: Nursery teachers 23 .9 .9 5.9 18: Priests 3 .1 .1 6.0 19: Other lower
professionals 19 .7 .7 6.7
20: Elected officials(Central level)
1 .0 .0 6.7
22: Managers 5 .2 .2 6.9 23: Officials Class I 10 .4 .4 7.3 24: Officials Class II 12 .4 .4 7.7 25: Class III Employee 31 1.1 1.1 8.9 26: Suprintendants 4 .1 .1 9.0 27: Traditional clerks 6 .2 .2 9.3 28: Class IV Employee 19 .7 .7 10.0 29: Other administrative
workers 19 .7 .7 10.7
31: Medium businessmen
34 1.3 1.3 11.9
32: Small businessmen 99 3.7 3.7 15.6 33: Petty shopkeeper 35 1.3 1.3 16.9 34: Hawkers,vendors 3 .1 .1 17.0 35: Sales executives 4 .1 .1 17.1 36: Salespersons 3 .1 .1 17.2 37: Shop Assistants 7 .3 .3 17.5 39: Other businessmen 24 .9 .9 18.4 42: Barbers, beauticians 2 .1 .1 18.5 44: Chowkidars 10 .4 .4 18.8 49: Other service
workers 53 2.0 2.0 20.8
50: Mechanics 10 .4 .4 21.2 51: Electricians 6 .2 .2 21.4 53: Tailors 8 .3 .3 21.7 54: Weavers 1 .0 .0 21.7 57: Carpenters 17 .6 .6 22.4 59: Other skilled
workers 12 .4 .4 22.8
60: Miners 3 .1 .1 22.9 61: Masons 2 .1 .1 23.0 64: Furniture makers 2 .1 .1 23.1

38
65: Rickshaw-pullers 12 .4 .4 23.5 66: Unskilled labourers 30 1.1 1.1 24.6 69: Other semi-skilled
and unskilled workers 13 .5 .5 25.1
70: Owner-cultivators 20+ Acre
25 .9 .9 26.0
71: Owner-cultivators 10-20 Acre
22 .8 .8 26.8
72: Owner-cultivators 5-10 Acre
67 2.5 2.5 29.3
73: Owner-cultivators 1-5 Acre
300 11.1 11.1 40.4
74: Owner-cultivators 0-5 Acre
55 2.0 2.0 42.5
75: Tenant-cultivators 5+ Acre
18 .7 .7 43.1
76: Tenant-cultivators 0-5 Acre
80 3.0 3.0 46.1
77: Plantation workers 61 2.3 2.3 48.3 78: Agricultural
labourers 65 2.4 2.4 50.7
79: Other agricultural workers
42 1.6 1.6 52.3
80: Live-stock farming 1 .0 .0 52.3 81: Dairy farming 1 .0 .0 52.4 84: Forest produce
gatherer 1 .0 .0 52.4
86: Fishermen 4 .1 .1 52.6 90: House-wife 4 .1 .1 52.7 92: Employment
seekers 2 .1 .1 52.8
93: Unemployed workers, non-workers
2 .1 .1 52.8
Any other Occupation 5 .2 .2 53.0 96: Political activists 2 .1 .1 53.1 99: NA 1267 46.9 46.9 100.0 Total 2702 100.0 100.0
B6: Caste/Jati-biradari/Tribe Frequency Percent Valid
Percent Cumulative Percent
Valid 01: Brahmin 127 4.7 4.7 4.7 02: Bhumihar 11 .4 .4 5.1 03: Rajput 7 .3 .3 5.4 04: Kayasthas 121 4.5 4.5 9.8 05: Vaishya 31 1.1 1.1 11.0 06: Jain 10 .4 .4 11.4 07: Punjabi Khatri 2 .1 .1 11.4 09: Other upper
castes 158 5.8 5.8 17.3
11: Reddy 1 .0 .0 17.3 14: Marathas 1 .0 .0 17.4 18 1 .0 .0 17.4 19: Other PP 97 3.6 3.6 21.0

39
20: Gujjar 1 .0 .0 21.0 21: Yadav 10 .4 .4 21.4 22: Kurmi 18 .7 .7 22.1 24: Saikya 2 .1 .1 22.1 27: Gaderia 2 .1 .1 22.2 28 1 .0 .0 22.2 29: Other peasant
OBC 55 2.0 2.0 24.3
30: Bunkar 1 .0 .0 24.3 31: Darzee 2 .1 .1 24.4 33: Lakhera 6 .2 .2 24.6 34: Badhai 1 .0 .0 24.6 35: Kumhar 7 .3 .3 24.9 36: Lohar 2 .1 .1 25.0 39: Other Craftsmen
OBC 15 .6 .6 25.5
40: Kewat 42 1.6 1.6 27.1 41: Dhobi (OBC) 1 .0 .0 27.1 42: Nai 1 .0 .0 27.2 43: Teli 5 .2 .2 27.4 44: Goswami 18 .7 .7 28.0 45: Traders OBC 2 .1 .1 28.1 47: Landless
Labourers 5 .2 .2 28.3
48: Entertaining caste
1 .0 .0 28.3
49: Other service OBC
727 26.9 26.9 55.2
50: Jatav (Leatherwork)
11 .4 .4 55.6
51: Balmiki(Scavenging)
1 .0 .0 55.7
52: Pasi+Pano 9 .3 .3 56.0 53: Rajbanshis 43 1.6 1.6 57.6 54: Namasudras 117 4.3 4.3 61.9 56: Mahar 2 .1 .1 62.0 57: Dhobi(Non OBC) 4 .1 .1 62.1 58: Lowest SC 40 1.5 1.5 63.6 59: Other SCs 125 4.6 4.6 68.2 60: Boro 22 .8 .8 69.1 61: Karbi 6 .2 .2 69.3 62: Sonowal 25 .9 .9 70.2 63: Naga 11 .4 .4 70.6 64: Khasi 1 .0 .0 70.7 66: Dimasa 18 .7 .7 71.3 68: Mishing 145 5.4 5.4 76.7 69: Other STs 49 1.8 1.8 78.5 70: Ashrafs 47 1.7 1.7 80.2 71: Mughal 8 .3 .3 80.5 72: Muslim Rajput 2 .1 .1 80.6 73: Other upper
Muslim 39 1.4 1.4 82.1
74: Peasant+Traders 2 .1 .1 82.1 75:
Craftsmen+Weavers24 .9 .9 83.0
76: Service Muslim 4 .1 .1 83.2

40
77: Ex-Untouchable 1 .0 .0 83.2 78: Muslim No Caste 98 3.6 3.6 86.8 79: Other Muslims 261 9.7 9.7 96.5 80: Jat Sikh 1 .0 .0 96.5 81: Khatri Sikh 1 .0 .0 96.6 84: Other Sikh 3 .1 .1 96.7 85: Upper Christians 2 .1 .1 96.7 86: OBC Christians 6 .2 .2 97.0 87: Dalit Christians 1 .0 .0 97.0 90: Parsi 2 .1 .1 97.1 93: Dalit Buddhist 2 .1 .1 97.2 94: Other Minorities 2 .1 .1 97.2 95: Hindu No caste 1 .0 .0 97.3 97 1 .0 .0 97.3 99: NA 73 2.7 2.7 100.0 Total 2702 100.0 100.0
B6a: Caste group
376 13.9 13.9 13.9290 10.7 10.7 24.6937 34.7 34.7 59.3
1092 40.4 40.4 99.77 .3 .3 100.0
2702 100.0 100.0
SCSTOBCOtherNATotal
ValidFrequency Percent
ValidPercent
Cumulative Percent
B7: Religion
2036 75.4 75.4 75.4565 20.9 20.9 96.3
77 2.8 2.8 99.15 .2 .2 99.33 .1 .1 99.48 .3 .3 99.78 .3 .3 100.0
2702 100.0 100.0
HinduMuslimChristianSikhBuddhistJainOthersTotal
ValidFrequency Percent
ValidPercent
Cumulative Percent

41
B8: How regularly do you read newspaper?
754 27.9 27.9 27.9345 12.8 12.8 40.7429 15.9 15.9 56.6355 13.1 13.1 69.7808 29.9 29.9 99.6
11 .4 .4 100.02702 100.0 100.0
DailyFrequentlyOccassionallyRarelyNeverNo opinionTotal
ValidFrequency Percent
ValidPercent
Cumulative Percent
B9: How regularly do you listen to news on radio?
705 26.1 26.1 26.1466 17.2 17.2 43.3477 17.7 17.7 61.0428 15.8 15.8 76.8612 22.6 22.6 99.5
14 .5 .5 100.02702 100.0 100.0
DailyFrequentlyOccassionallyRarelyNeverNo opinionTotal
ValidFrequency Percent
ValidPercent
Cumulative Percent
B11: How often do you offer prayer/puja/namaj?
1436 53.1 53.1 53.1332 12.3 12.3 65.4835 30.9 30.9 96.3
71 2.6 2.6 99.028 1.0 1.0 100.0
2702 100.0 100.0
DailyWeeklyOnly on festivalsNeverNo opinionTotal
ValidFrequency Percent
ValidPercent
Cumulative Percent
B12: Locality
2293 84.9 84.9 84.9183 6.8 6.8 91.6182 6.7 6.7 98.4
44 1.6 1.6 100.02702 100.0 100.0
VillageTownCityMetropolitan CityTotal
ValidFrequency Percent
ValidPercent
Cumulative Percent

42
B12(a): (If Town/City) Type of house where R lives(Own or rented)
2293 84.9 84.9 84.9
75 2.8 2.8 87.6
62 2.3 2.3 89.9
77 2.8 2.8 92.8
52 1.9 1.9 94.7
19 .7 .7 95.4
11 .4 .4 95.8
13 .5 .5 96.3
45 1.7 1.7 98.055 2.0 2.0 100.0
2702 100.0 100.0
NAHouse/Flat with 4 ormore bedroomsHouse/Flats with 3 or 4bedroomsHouse/Flat with 2bedrooms (with kitchenand bath rooms)House/Flat with 2 Puccarooms (With kitchen)House/Flat with 2 puccarooms(Without kitchen)House with 1 puccaroom (With kitchen)House with 1 puccaroom (Without kitchen)Mainly kutcha houseSlum/Jhuggi JhopriTotal
ValidFrequency Percent
ValidPercent
Cumulative Percent
B12(b): (If Village) Type of house where R lives(Own or rented)
409 15.1 15.1 15.1322 11.9 11.9 27.1602 22.3 22.3 49.3937 34.7 34.7 84.0432 16.0 16.0 100.0
2702 100.0 100.0
NAPuccaPucca-KutchaKutchaHutTotal
ValidFrequency Percent
ValidPercent
Cumulative Percent

43
B13: Number of rooms in use in the household
4 .1 .1 .1114 4.2 4.2 4.4317 11.7 11.7 16.1601 22.2 22.2 38.3680 25.2 25.2 63.5473 17.5 17.5 81.0272 10.1 10.1 91.1
96 3.6 3.6 94.690 3.3 3.3 98.055 2.0 2.0 100.0
2702 100.0 100.0
Blank/No roomsOneTwoThreeFourFiveSixSevenEightNine and aboveTotal
ValidFrequency Percent
ValidPercent
Cumulative Percent
B14(a): Total number of family members living in thehousehold(Adults)
28 1.0 1.0 1.018 .7 .7 1.7
519 19.2 19.2 20.9553 20.5 20.5 41.4606 22.4 22.4 63.8415 15.4 15.4 79.2287 10.6 10.6 89.8122 4.5 4.5 94.3
76 2.8 2.8 97.178 2.9 2.9 100.0
2702 100.0 100.0
0123456789Total
ValidFrequency Percent
ValidPercent
Cumulative Percent

44
B14(b): Total number of family members living in thehousehold(Children)
551 20.4 20.4 20.4520 19.2 19.2 39.6826 30.6 30.6 70.2398 14.7 14.7 84.9193 7.1 7.1 92.1103 3.8 3.8 95.9
53 2.0 2.0 97.924 .9 .9 98.715 .6 .6 99.319 .7 .7 100.0
2702 100.0 100.0
0123456789Total
ValidFrequency Percent
ValidPercent
Cumulative Percent
B15(a): Car/Jeep/Van/Tractor
2503 92.6 92.6 92.6199 7.4 7.4 100.0
2702 100.0 100.0
NoYesTotal
ValidFrequency Percent
ValidPercent
Cumulative Percent
B15(b): Colour or B/W Television
1248 46.2 46.2 46.2799 29.6 29.6 75.8655 24.2 24.2 100.0
2702 100.0 100.0
NoB/WColourTotal
ValidFrequency Percent
ValidPercent
Cumulative Percent
B15(c): Scooter/Motorcycle/Moped
2085 77.2 77.2 77.2617 22.8 22.8 100.0
2702 100.0 100.0
NoYesTotal
ValidFrequency Percent
ValidPercent
Cumulative Percent

45
B15(d): Telephone
2177 80.6 80.6 80.6525 19.4 19.4 100.0
2702 100.0 100.0
NoYesTotal
ValidFrequency Percent
ValidPercent
Cumulative Percent
B15(e): Mobile telephone
2272 84.1 84.1 84.1430 15.9 15.9 100.0
2702 100.0 100.0
NoYesTotal
ValidFrequency Percent
ValidPercent
Cumulative Percent
B15(f): Fridge
2356 87.2 87.2 87.2346 12.8 12.8 100.0
2702 100.0 100.0
NoYesTotal
ValidFrequency Percent
ValidPercent
Cumulative Percent
B15(g): Air Conditioner
2661 98.5 98.5 98.541 1.5 1.5 100.0
2702 100.0 100.0
NoYesTotal
ValidFrequency Percent
ValidPercent
Cumulative Percent
B15(h): Electric fan/Cooler
1459 54.0 54.0 54.01243 46.0 46.0 100.02702 100.0 100.0
NoYesTotal
ValidFrequency Percent
ValidPercent
Cumulative Percent
B15(i): Bicycle
572 21.2 21.2 21.22130 78.8 78.8 100.02702 100.0 100.0
NoYesTotal
ValidFrequency Percent
ValidPercent
Cumulative Percent

46
B15(k): Pumping set
2334 86.4 86.4 86.4368 13.6 13.6 100.0
2702 100.0 100.0
NoYesTotal
ValidFrequency Percent
ValidPercent
Cumulative Percent
B16: Total monthly household income
387 14.3 14.3 14.3432 16.0 16.0 30.3538 19.9 19.9 50.2307 11.4 11.4 61.6320 11.8 11.8 73.4479 17.7 17.7 91.2182 6.7 6.7 97.9
45 1.7 1.7 99.612 .4 .4 100.0
2702 100.0 100.0
Upto Rs. 1,000Rs. 1,001 - Rs. 2,000Rs. 2,001 - Rs. 3,000Rs. 3,001 - Rs. 4,000Rs. 4,001 - Rs. 5,000Rs. 5,001 - Rs. 10,000Rs. 10,001 - Rs. 20,000Rs. 20,001 and aboveNATotal
ValidFrequency Percent
ValidPercent
Cumulative Percent
B17: Language spoken
1304 48.3 48.3 48.3782 28.9 28.9 77.2
96 3.6 3.6 80.83 .1 .1 80.91 .0 .0 80.9
30 1.1 1.1 82.042 1.6 1.6 83.647 1.7 1.7 85.3
2 .1 .1 85.41 .0 .0 85.41 .0 .0 85.51 .0 .0 85.56 .2 .2 85.7
15 .6 .6 86.3
182 6.7 6.7 93.0
175 6.5 6.5 99.5
14 .5 .5 100.02702 100.0 100.0
01: Assamese02: Bengali04: Hindi05: Kannada06: Kashmiri09: Manipuri11: Nepali/Gokhali12: Oriya13: Punjabi15: Sindhi17: Telugu20: English22: Dogri25: Other NorthIndian Languages26: Other Northeast languages27: Other Indianlanguages99: NATotal
ValidFrequency Percent
ValidPercent
Cumulative Percent

47
III: ANNEXURE-3:
Vote Casted to different parties with respect to gender, age, education, locality, religion and caste in Assam assembly election, Post-poll Survey, 2006
Source: CSDS Data Unit, Assam, Election Study, Post-poll – 2006 Note: All figures in percent, Sample Size: 2702 *AGP+ includes CPM, ASDC, CPI, TNGP **Others Includes IND, AUDF, BJP, AGP (P), NCP, LKS,LS,MUL,NBNP,NLP,PDF,RCPI (R), RGD,RJD,RPI,RSP,SAP,SJP(R),SP,UBNLF,UMFA, URMCA,UTNLF,AIMF,AITC,AMP,CPI(ML) (L),ASDC(P) ASDC (U), HSKP,JD (S), JD (U), LJNSP, LJP. Note: Those who did not cast vote and hold no opinion are excluded
INC AGP+* BJP Others* * All 39 15 26 21
Gender Male 39 15 25 21
Female 38 16 26 20 Age Groups
Upto 25 yrs 38 16 25 21 26-35yrs 38 14 26 23 36-45yrs 36 16 28 20 46-55yrs 39 19 24 19
Above 55 yrs 40 17 25 18 Education (Respondent)
Non Literate 48 10 24 19 Upto Primary 42 13 20 26 Upto Matric 33 18 27 22
College and above 36 19 29 17 Locality
Rural 38 15 25 22 Urban 38 20 29 13
Religion Hindu 35 20 29 17
Muslim 50 1 12 37 Others**** 48 11 27 15
Caste/Community Brahmin 30 28 25 17
Kayasthas 26 25 39 10 Other Upper Castes 34. 8 35 22
Upper castes 48 25 23 4 Dominant Peasant Proprietors 18 15 16 52
Other Backward Castes 41 30 15 14 Scheduled Caste 27 37 17 19 Scheduled Tribe 29 20 36 15
Muslims 52 2 11 35 Other religious Groups 38 19 19 24
Other service OBCs 40 11 33 16 Namasudras 30 33 211 16 Other SCs 42 17 36 4 Mishing 41 6 29 23
Other Religions 51 1 13 35

48
**** Others includes Sikh, Christian, Buddhist, Jain, Parsi and Other Rural¹ includes village, having minimum 5000 population Urban² includes town (below one lakh), city (above one lakh) and Metropolitan (above 10 lakh)