assesment of genetic diversity of phaseolus …
TRANSCRIPT

JNTS No 49 / 2019 (XXIV) 73
ASSESMENT OF GENETIC DIVERSITY OF PHASEOLUS GERMPLASM BY MORPHOLOGICAL QUANTITATIVE
CHARACTERS
Valbona HOBDARI, Belul GIXHARI, Fetah ELEZI, Doriana BODE and Hajdar KUÇI
Institute of Plant Genetic Resources, Agricultural University of Tirana, Albania
_________________________________________________________ ABSTRACT
A study was carried out for the characterisation and pre-evaluation of genetic diversity present in the Phaseolus germplasm stored in Albanian Gene Bank and 50 local common bean accessions of different origins were involved to identify andselect the most important accessions with favourable characteristics for use in breeding programs. The study was carried out at the Experimental Field of Agriculture University of Tirana during two subsequent growing seasons, 2017 and 2018. ANOVA analysis and Tukey-Kramer test found significant differences for most of the quantitative morphological characters. PCA results showed that the first three PCs contribute for a substantial proportion of total variation, 77.8%. The percentages of total variation accounted for by each of the first three PCs were 54.2%; 13.0% and 10.6%, respectively. PCA and ordination analysis identified the quantitative morphological characters with more significant contribution on respective PC1 and PC2 variances (PoL, SeL, SeY, PLH, PoW and SeW characters). Principal Component Analysis (PCA) and Dimensional Ordination method revealed considerable amount of diversity between common beans, identified the variances of the first three principal components (77.8%) and the proportion of the total variance each factor contributes for. Principal Component Analysis, in respect of genetic variability among 50 common bean accessions of different origin, divide these accessions into four groups. The amount of genetic variability found between common bean genotypes is enough for the selection of desirable characters valuable for common bean breeding programs and facilitates the maintenance of its germplasm in Gene Bank. Keywords: Genetic diversity, Phaseolus germplasm, morphological characters
74 JNTS No 49 / 2019 (XXIV)
1. INTRODUCTION
Common beans are the main source of protein in human nutrition in many
parts of the world. Thousands of legume species exist, but common beans
(Phaseolus vulgaris L.) are from far the most consumed. Common bean
(Phaseolus vulgaris L.) is a widely cultivated crop due to its good nutritional
composition (high protein content in dry seed and a good source of fiber)
besides its high market value. This vegetable is consumed either as a dry bean
(pulse) or as fresh bean (fresh vegetable) and it is considered one of the most
important grains for human alimentation. In some countries, beans are the
primary source of protein in human diet.
Common bean (Phaseolus vulgaris L.) originates in Latin America and
was domesticated in Mexico more than 6000 years ago. It spread from Latin
America to Europe, Africa and other parts of the world. It grows well in areas
of medium rainfall from the tropics to the temperate regions. Genius
Phaseolus counts a total of 56 species. All species of this genus are with 2n =
22 chromosomes, except for a single species which possesses 2n = 20
chromosomes.
The conservation, study and uses of local plant resources is a basic
problem for breeding programs in many countries. During conservation of
germplasm the seeds undergo quantitative and qualitative changes. For
preserving genetic diversity, characterization of bean accessions allows the
identification of genetic variability present on bean germplasm, as it helps
describe the differences between accessions and address breeding programs
(Gixhari et. al., 2016). This is particularly crucial today, due to the increasing
influence of different anthropogenic factors that can affect the genetic
diversity of various valuable species (Krasteva et. al., 2002).
In Albania, the bean (Phaseolus vulgaris) is one of the most important
crops. Actually, over 90% of bean cultivation area is cultivated with native
bean landraces (Canko et. al., 2008). In Albania, beans germplasm represents
the important genetic resources used directly by farmers and consumers.
The Albanian Gene Bank, part of the Agriculture University of Tirana,
holds approximately 307 accessions of common bean germplasm. Common
bean germplasm is composed especially by local genotypes or landraces.
Landraces harbour amount of diversity that is of interest for future breeding
work, as well as for developing new varieties and consequently need to be
preserved for future generations (Negri and Tosti 2002; Stoilova et. al., 2004;
Stoilova et. al., 2005). Despite its economic importance, bean germplasm has
not been characterized very well genetically, and little is known about the
nature of the variability of this germplasm. Therefore, the information about
JNTS No 49 / 2019 (XXIV) 75
extent of uses of various gene pools are extremely valuable for the rational
planning of the use of bean germplasm in breeding programs (Gixhari et. al.,
2016).
Traditionally, germplasm diversity is evaluated by morphological
descriptors (Hobdari et al., 2012; Gixhari et. al., 2016), which remain the only
legitimate marker types accepted by the International Union for the Protection
of New Varieties of Plants (UPOV 1990; 2009). Characterization of
germplasm collections, based on morphological and agronomic traits, is of
high interest for breeding work (Stoilova 2007; Gixhari et. al., 2013; Hobdari
and Gixhari 2017). In some cases, other traits important for producing typical
and high-quality products are also taken in consideration (Pereira et al., 2005;
Stoilova 2007). Singh et al., (1991a) and Gixhari et. al., (2014) suggested the
combination of agro-morphological, biochemical and molecular data for
diversity studies since this combination offers complementary results.
Albanian Gene Bank has carried out several studies using morphological
and agronomic traits, during regeneration and characterization procedures
(Hobdari et. al., 2012; 2017; Bode et. al., 2013; Gixhari et. al., 2013; Gixhari
et.al., 2014), but bean germplasm stored in GenBank has still a considerable
number of accessions that need to be analysed and characterized.
The present study aims to analyse the genetic diversity among fifty
common bean accessions (genotypes) and the identification of the most
important morphological characters for use in breeding programs of bean
germplasm.
2. MATERIALS AND METHODS
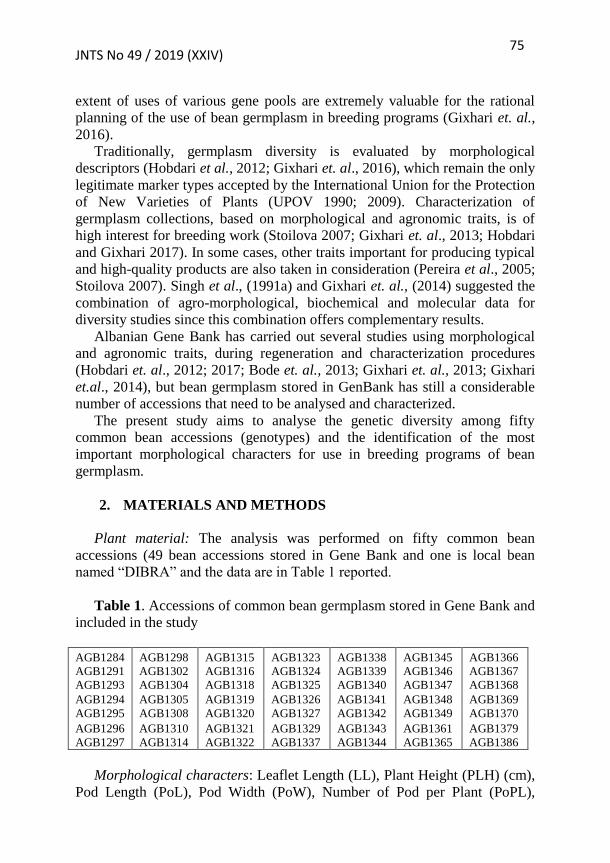
Plant material: The analysis was performed on fifty common bean
accessions (49 bean accessions stored in Gene Bank and one is local bean
named “DIBRA” and the data are in Table 1 reported.
Table 1. Accessions of common bean germplasm stored in Gene Bank and
included in the study
AGB1284 AGB1298 AGB1315 AGB1323 AGB1338 AGB1345 AGB1366
AGB1291 AGB1302 AGB1316 AGB1324 AGB1339 AGB1346 AGB1367
AGB1293 AGB1304 AGB1318 AGB1325 AGB1340 AGB1347 AGB1368
AGB1294 AGB1305 AGB1319 AGB1326 AGB1341 AGB1348 AGB1369
AGB1295 AGB1308 AGB1320 AGB1327 AGB1342 AGB1349 AGB1370
AGB1296 AGB1310 AGB1321 AGB1329 AGB1343 AGB1361 AGB1379
AGB1297 AGB1314 AGB1322 AGB1337 AGB1344 AGB1365 AGB1386
Morphological characters: Leaflet Length (LL), Plant Height (PLH) (cm),
Pod Length (PoL), Pod Width (PoW), Number of Pod per Plant (PoPL),

76 JNTS No 49 / 2019 (XXIV)
Number of Seeds per Pod (SPo), Seed Length (SeL), Seed Width (SeW) and
Seed Yield (SeY).
The experimental site: The study for the assessment of common bean
accessions diversity was carried out at the experimental field of Agriculture
University of Tirana (latitude: 402405N; longitude: 0194108E; elevation:
40m) during two subsequent growing seasons; 2017 and 2018.
Field observations: The measurements and field observations were carried
out based on Gene Bank standards (FAO 2014), Recognized Reconstruction
Guidelines (Salcedo 2008) and Descriptors (IBPGR 1982) for characterization
and evaluation of genetic material.
Cultural practices: Sowing date and growing conditions as the distance
between plants in a row and between rows, fertilizer application, number of
plants established, plant protection, harvest date, etc. were the same for each
bean accession and consistent with established farming practices of the area
and with the variety used.
Statistical Analysis: The differences between common bean accessions and
comparison for all the means of observed and evaluated characters were
carried out using ANOVA analysis and Tukey-Kramer test. Principal
Components Analysis (PCA) on correlation method was used to analyse
relationships between bean genotypes and to identify the most important
morphological characters that influence highly on the total variability. All
statistic data were calculated employing the SAS JMP Statistical Discovery
(2012), and a dendrogram (ward method) and two-dimensional relationship
diagram (phaseolus genotypes x morphological characters) were carried out.
3. RESULTS AND DISCUSSIONS
Analysis of morphological quantitative characters: ANOVA analysis
found the presence of significant differences between common bean
accessions for the greatest number of morphological characters at the
probability P0.05 and P0.01. High degree of variation was observed for PLH,
PoPL, PoL and especially for SeY characters. Low differences were found for
PoW, SePo and SeW morphological characters (Table 2).
JNTS No 49 / 2019 (XXIV) 77
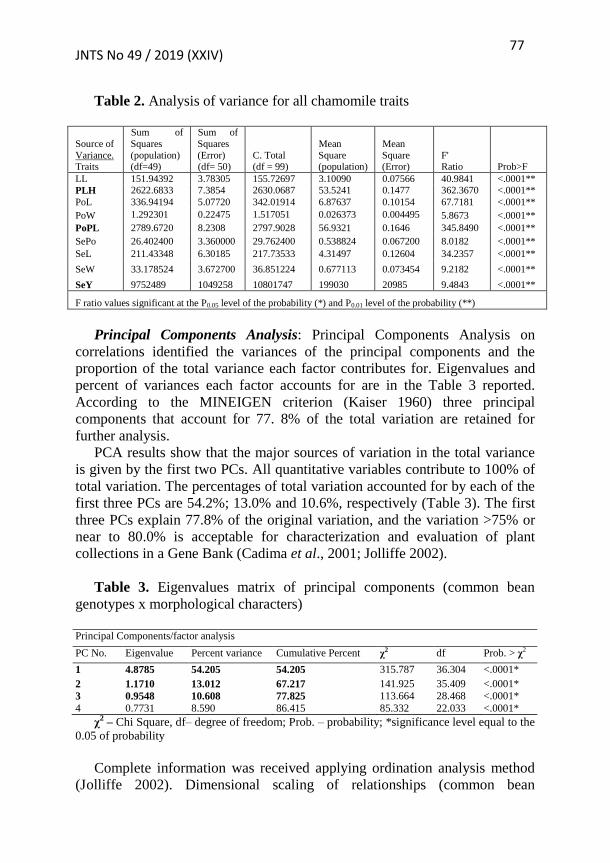
Table 2. Analysis of variance for all chamomile traits
Source of
Variance. Traits
Sum of
Squares
(population) (df=49)
Sum of
Squares
(Error) (df= 50)
C. Total (df = 99)
Mean
Square (population)
Mean
Square (Error)
F' Ratio Prob>F
LL 151.94392 3.78305 155.72697 3.10090 0.07566 40.9841 <.0001**
PLH 2622.6833 7.3854 2630.0687 53.5241 0.1477 362.3670 <.0001**
PoL 336.94194 5.07720 342.01914 6.87637 0.10154 67.7181 <.0001**
PoW 1.292301 0.22475 1.517051 0.026373 0.004495 5.8673 <.0001**
PoPL 2789.6720 8.2308 2797.9028 56.9321 0.1646 345.8490 <.0001**
SePo 26.402400 3.360000 29.762400 0.538824 0.067200 8.0182 <.0001**
SeL 211.43348 6.30185 217.73533 4.31497 0.12604 34.2357 <.0001**
SeW 33.178524 3.672700 36.851224 0.677113 0.073454 9.2182 <.0001**
SeY 9752489 1049258 10801747 199030 20985 9.4843 <.0001**
F ratio values significant at the P0.05 level of the probability (*) and P0.01 level of the probability (**)
Principal Components Analysis: Principal Components Analysis on
correlations identified the variances of the principal components and the
proportion of the total variance each factor contributes for. Eigenvalues and
percent of variances each factor accounts for are in the Table 3 reported.
According to the MINEIGEN criterion (Kaiser 1960) three principal
components that account for 77. 8% of the total variation are retained for
further analysis.
PCA results show that the major sources of variation in the total variance
is given by the first two PCs. All quantitative variables contribute to 100% of
total variation. The percentages of total variation accounted for by each of the
first three PCs are 54.2%; 13.0% and 10.6%, respectively (Table 3). The first
three PCs explain 77.8% of the original variation, and the variation >75% or
near to 80.0% is acceptable for characterization and evaluation of plant
collections in a Gene Bank (Cadima et al., 2001; Jolliffe 2002).
Table 3. Eigenvalues matrix of principal components (common bean
genotypes x morphological characters)
Principal Components/factor analysis
PC No. Eigenvalue Percent variance Cumulative Percent χ2 df Prob. > χ2
1 4.8785 54.205 54.205 315.787 36.304 <.0001*
2 1.1710 13.012 67.217 141.925 35.409 <.0001*
3 0.9548 10.608 77.825 113.664 28.468 <.0001*
4 0.7731 8.590 86.415 85.332 22.033 <.0001*
χ2 – Chi Square, df– degree of freedom; Prob. – probability; *significance level equal to the
0.05 of probability
Complete information was received applying ordination analysis method
(Jolliffe 2002). Dimensional scaling of relationships (common bean

78 JNTS No 49 / 2019 (XXIV)
genotypes x morphological characters) that contributes for the larger
proportion of the total variance in PC1, PC2 and PC3 revealed by PCA
showed that the contribution of each bean genotypes and of each quantitative
morphological character was found in equal on the total of variation.
PC1
PC2 PC3
PC4
Fig. 1: Relationships among common bean genotypes based on morphological characters
revealed by PCA.
PC analysis found 9 and 17 common bean accessions included in PC1 and
PC2 that contribute for 67.2% of total variation, and contribution for 19.2%
on the total variation was attribute of 24 bean accessions included in PC3 and
PC4 (Table 3; Figure 1).
For PC1 (with 54.2% contribute on the total variation) characters as PoL,
SeL and SeY were the most important source for the variation of PC1 (Figure
1). Two morphological characters as LL and SePo showed important negative
influence on the PC1 variance (Table 4, Figure 1).
Variation in PC2 (13.0% of total variation) was mainly the result of
differences in PLH, PoW, SeW and SeY morphological characters. SeY
characters contributes the part of variation not expressed on PC1 (Table 4,
Figure 1).
For PC3 (with only 10.6% contribute on the total variation) characters as
PLH and PoPL were the most important source for the variation on the PC3
variance. PLH character contributes the part of variation not expressed on
PC1 and PC2 and SeW showed important negative influence on the PC3
variance (Table 4, Figure 1).

JNTS No 49 / 2019 (XXIV) 79
Table 4. Matrix of vectors of three PC for common bean genotypes x
morphological characters
No Quantitative morphological characters PC1 PC2 PC3
1 Leaflet Length LL -0.41268 0.17135 -0.05907
2 Plant height PLH 0.17348 0.45097 0.64573
3 Pod Length PoL 0.40725 -0.06017 0.09272
4 Pod Width PoW -0.27196 0.56788 0.00802
5 Pods per Plant PoPL -0.22226 0.01640 0.51430
6 Seeds per Pod SePo -0.43501 -0.01069 -0.00608
7 Seed Length SeL 0.38151 -0.11562 -0.00501
8 Seed Width SeW 0.17122 0.58029 -0.54582
9 Seed Yield SeY 0.38247 0.30111 0.09165
In bold all eigenvectors > 0.30
The data about genetic relationships between bean genotypes and the most
important morphological characters provides better understanding of
germplasm sampling. Separation of common bean accessions (genotypes) into
four different PCs, and where the division among bean genotypes included on
the PC1 and PC2 was very clear, is useful for the choice of parents for further
crosses in breeding programs. This is not simple for the bean genotypes of
PC3 and PC4 that both have similar most of the morphological characteristics.
The study identified the morphological characters with more significant
weighting on respective PC1 and PC2 variances (PoL, SeL, SeY, PLH, PoW
and SeW characters), which can be used successfully as morphological
quantitative markers for evaluation and characterization of the bean
germplasm.
The amount of genetic variability found in this study is available to the
breeders for selection of desirable characters. This variability is a valuable
source for creation of new gene combinations in bean breeding programs.
4. CONCLUSIONS
The field trials carried out in the present study helped characterize for the
first time fifty common bean genotypes and identify the most important
morphological diversity within and between bean genotypes, very useful for
bean breeding programs.
PCA results showed that the first three PCs contribute for a substantial
proportion of total variation, 77.8%.
The percentages of total variation accounted for by each of the first three
PCs were 54.2%; 13.0% and 10.6% respectively.

80 JNTS No 49 / 2019 (XXIV)
PCA and ordination analysis identified the quantitative morphological
characters with more significant contribution on respective PC1 and PC2
variances (PoL, SeL, SeY, PLH, PoW and SeW characters), which can be
used successfully as morphological quantitative markers for evaluation and
characterization of the bean germplasm.
The amount of genetic variability found between bean genotypes is
sufficient for selection of desirable characters and for creation of new gene
combinations to sustain common bean breeding programs.
REFERENCES
Bode D, Elezi F, Gixhari B. 2013. Morphological characterization and
interrelationships among descriptions in Phaseolus vulgaris accessions.
Agriculture and Forestry. 59(2): 175-185, Podgorica.
Cadima JFCL, Jolliffe IT. 2001. Variable selection and the interpretation
of principal subspaces. Journal of Agricultural, Biological, and
Environmental Statistics. 6: 62–79.
Canko A, Celami A, Shehu R. 2008. Teknologjia e kultivimit të
kultivarëve autokton të fasules. Project: Strengthening sustainable use of plant
genetic resources for food and agriculture in Albania. TCP/ALB/3102 (D).
FAO. 2014. Gene bank Standards for Plant Genetic Resources for Food
and Agriculture. Rev. ed. Rome.
Gixhari B, Doko A, Hobdari V, Vrapi H. 2016. Diversity of Grass Pea
(L. sativum) landraces for sustainable field Grass Pea breeding in Albania.
International Journal of Ecosystems and Ecology Sciences (IJEES). 6 (1): 81-
88.
Gixhari B, Ismaili H, Lashi F, Ibraliu A, Dias S. 2013. Diversity of
Albanian plant genetic resources inventory assesed by eurisco passport
descriptors. Albanian Journal of Agriculture Sciences. 12 (4): 741-746.
Gixhari B, Pavelkova M, Ismaili H, Vrapi H, Jaupi A, Smýkal P. 2014.
Genetic diversity of Albanian Pea (Pisum sativum L.) landraces assessed by
morphological traits and molecular markers. Czech Journal of Genetics and
Plant Breeding. 50 (2):177–184.
Gixhari B, Vrapi H, Hobdari V. 2014.Morphological characterization of
pea (P. sativum L.) genotypes stored in Albanian Gene Bank. Albanian
Journal of Agriculture Sciences. 169-173
Hobdari V, Bode D, Gixhari B, Elezi E, Doko A. 2017 Morphological
characterization of durum wheat (T.durum Desf.) germplasm stored in
Albanian Gene Bank. Albanian Journal of Agricultural Sciences (AJAS),
Albanian Journal of Agriculture Sciences. ISSN: 2218-2020. 16. Special
issue. University of Tirana Research paper. 609-615.

JNTS No 49 / 2019 (XXIV) 81
Hobdari V, Gixhari B. 2017. Analysis of variability in qualitative traits of
L. sativum accessions in Albanian Gene Bank. Albanian Journal of
Agriculture Sciences. 565-569.
Hobdari V, Gixhari B, Elezi E, Bode D, Dias S, Libohova Z. 2012.
Characterization of Grass Pea (Lathyrus sativum) Genotypes Stored in
Albanian Gene Bank. Journal of International Environmental Application &
Science (JIEAS). 7 (4): 709-714.
IBPGR. 1982. Descriptors for Phaseolus vulgaris. IBPGR, International
Plant Genetic Resources Institute, Rome.
Jolliffe IT. 2002. Principal Component Analysis, Second edition, p.cm-
Springer Series in Statistics. UK.143-180.
Kaiser HF. 1960. The application of electronic computers to factor
analysis. Educational and Psychological Measurement. 20:141-151.
Krasteva L, Sevov V, Kicheva P, Shamov D, Sabeva M, Neykov S,
Popova Z, Lozanov I. 2002. Local plant genetic resources in Bulgaria ON-
Farm conservation. Scientific Session of Jubilee, 120 years. Agricultural
Science in Sadovo. Institute of Plant Genetic Resources. I: 57-63.
Negri V, Tosti N. 2002. Phaseolus genetic diversity maintained on-farm
in Central Italy. Genetic Resources and Crop Evolution. 49: 511-520.
Salcedo JM. 2008. Regeneration guidelines: common bean. In: Dulloo
ME, Thormann I, Jorge MA. and Hanson J, editors. Crop specific
regeneration guidelines [CD-ROM]. CGIAR System-wide Genetic Resource
Programme. Rome, Italy. 9.
SAS. JMP Statistical Discovery 2012. 10. SAS Institute Inc.
Singh SP, Gepts P, Debouck DG. 1991a. Races of common bean
(Phaseolus vulgaris, Fabaceae). Economic Botany. 45:379-396.
Stoilova T. 2007. The collection of dry beans as initial material for
breeding. International Research Conference-125 Years Agricultural Research
in Sadovo, Plovdiv, June 13-14. Institute of Plant Genetic Resources,
Sadovo.1: 53-58.11.
Stoilova T, Pereira G, Tavares-de-Sousa MM, Carnide V. 2005. Diversity in common bean landraces (Phaseolus vulgaris L.) from Bulgaria
and Portugal. Journal of Central European Agriculture. 6 (4): 443-448.
Stoilova T, Pereira G, Sabeva M, Chavdarov P. 2004. Study on the
phenotypic variability in landraces of dry beans (Phaseolus vulgaris L.). Field
Crops Studies. I (2): 226-233.
UPOV. 1990. Guidelines for the conduct of tests for distinctness,
homogeneity, and stability. Document UPOV TG/4/7. Geneva, Switzerland.
UPOV. 2009. International Union for the Protection of New Varieties of
Plants. Guidelines for the conduct of tests for distinctness, uniformity and
stability. (UPOV Code: PISUM_SAT) TG/7/10.

82 JNTS No 49 / 2019 (XXIV)