assessing 2070 water demand in the bay area
TRANSCRIPT
Assessing 2070 Water Demand in the Bay Area
Anne Thebo, Ph.D.Senior Researcher, Pacific Institute
Meeting the Bay Area’s Water DemandSPUR Digital DiscourseMay 5, 2021
pacinst.org | @PacificInstitut
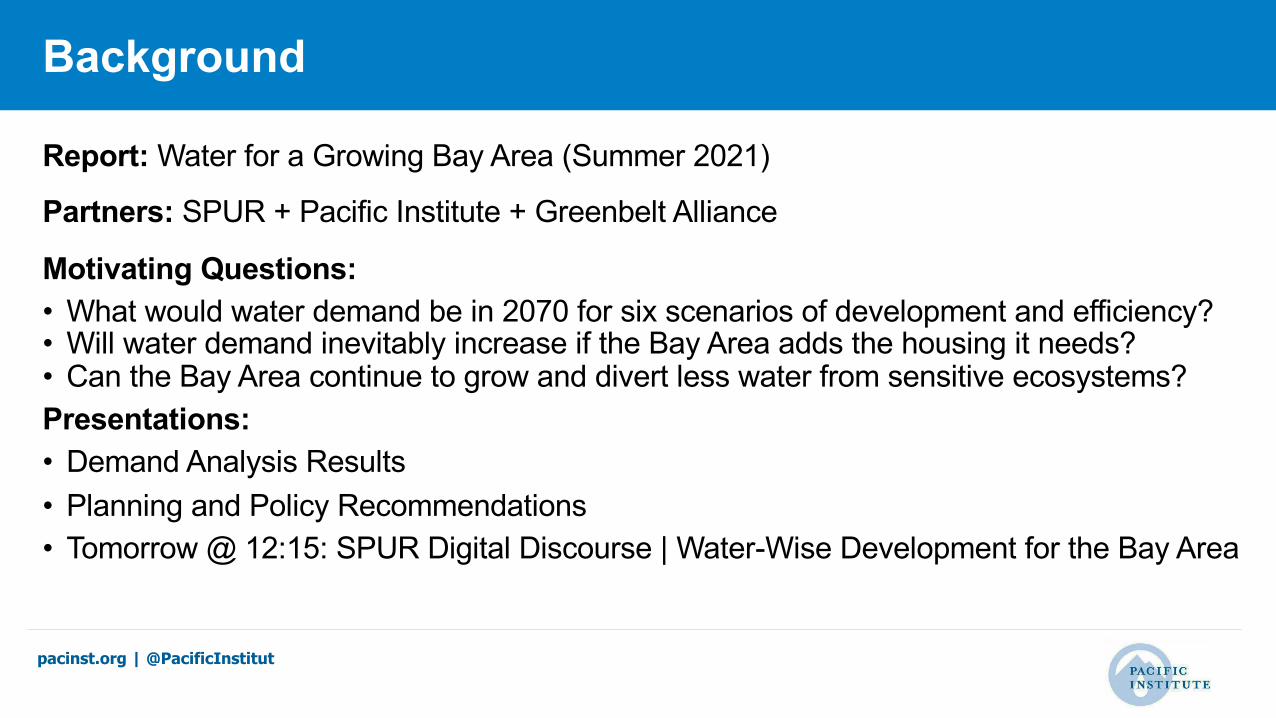
Report: Water for a Growing Bay Area (Summer 2021)
Partners: SPUR + Pacific Institute + Greenbelt Alliance
Motivating Questions:• What would water demand be in 2070 for six scenarios of development and efficiency?• Will water demand inevitably increase if the Bay Area adds the housing it needs?• Can the Bay Area continue to grow and divert less water from sensitive ecosystems?Presentations:• Demand Analysis Results• Planning and Policy Recommendations• Tomorrow @ 12:15: SPUR Digital Discourse | Water-Wise Development for the Bay Area
Background

pacinst.org | @PacificInstitut
Scenario Analysis: Estimating Water Demand in 2070
3 Efficiency x 2 Development Scenarios = 6 Scenarios Per Water Use Class
• Indoor Residential• Outdoor Residential• Commercial, Industrial, and
Institutional (CII)
Three Classes of Water Use
• Current (Baseline)• 2070 Business as Usual (BAU)• 2070 SPUR
Two 2070 Development
Scenarios
• Inefficient• Efficient• Highly Efficient
Three Efficiency Scenarios
Housing Population Jobs3.0 M 8.2 M 5.5 M
+1.4 M +4.5 M +2.1 M+2.2 M +6.8 M +2.1 M

pacinst.org | @PacificInstitut
Key Findings
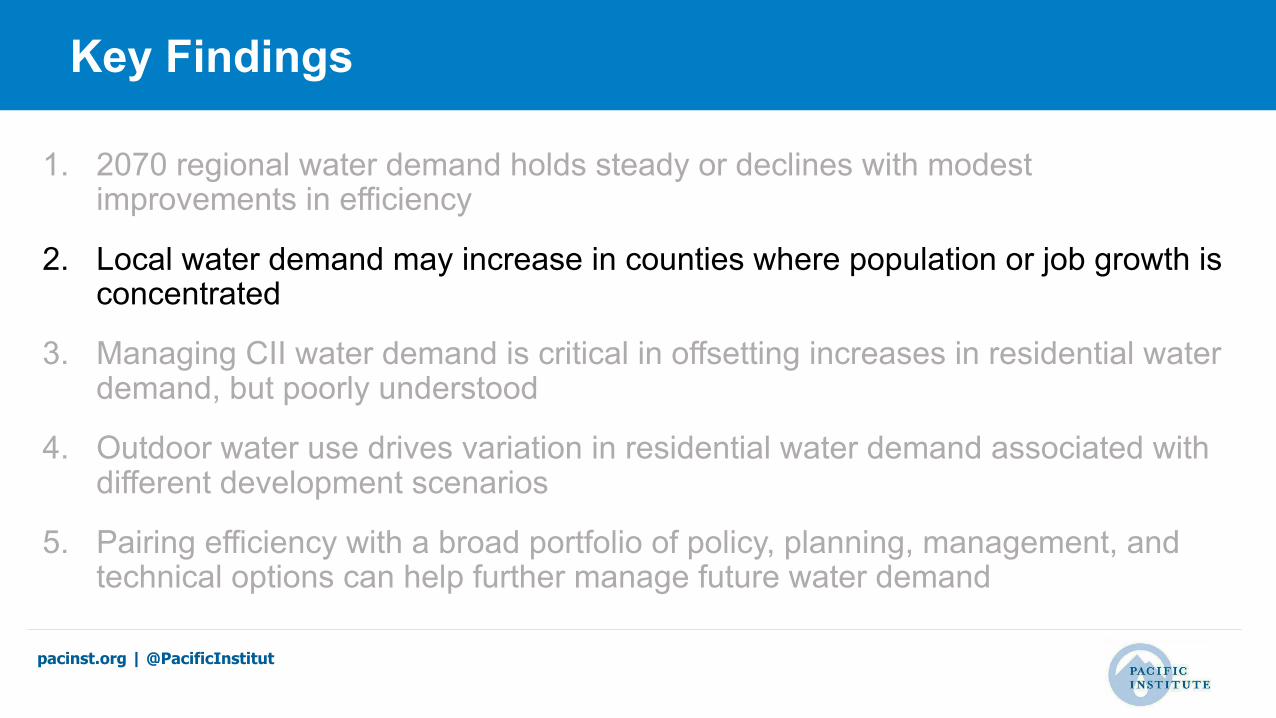
1. 2070 regional water demand holds steady or declines with modest improvements in efficiency
2. Local water demand may increase in counties where population or job growth is concentrated
3. Managing CII water demand is critical in offsetting increases in residential water demand, but poorly understood
4. Outdoor water use drives variation in residential water demand associated with different development scenarios
5. Pairing efficiency with a broad portfolio of policy, planning, management, and technical options can help further manage future water demand

pacinst.org | @PacificInstitut
2070 regional water demand holds steady or declines with modest improvements in efficiency
Baseline2070 SPUR Scenario adds 2.2M additional units of housing vs. 1.4 M in 2070 BAU
pacinst.org | @PacificInstitut
Key Findings
1. 2070 regional water demand holds steady or declines with modest improvements in efficiency
2. Local water demand may increase in counties where population or job growth is concentrated
3. Managing CII water demand is critical in offsetting increases in residential water demand, but poorly understood
4. Outdoor water use drives variation in residential water demand associated with different development scenarios
5. Pairing efficiency with a broad portfolio of policy, planning, management, and technical options can help further manage future water demand

pacinst.org | @PacificInstitut
Local water demand may increase in counties where population or job growth is concentrated
pacinst.org | @PacificInstitut
Key Findings
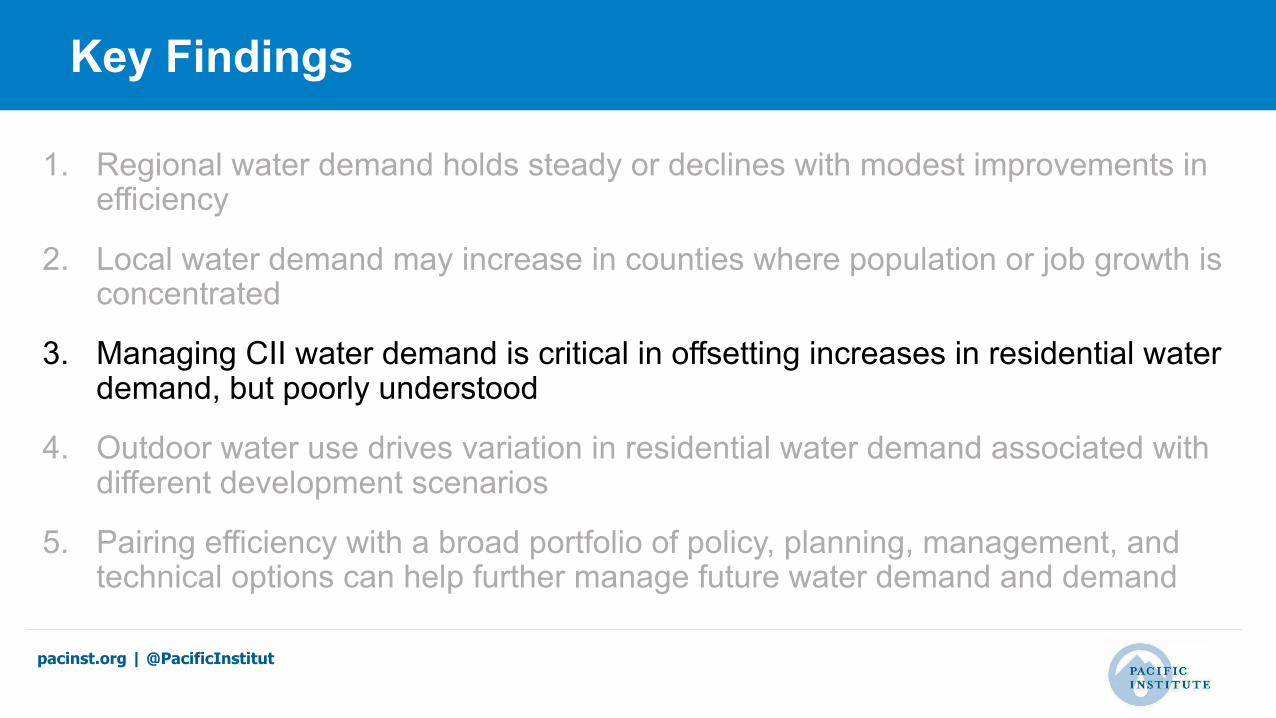
1. Regional water demand holds steady or declines with modest improvements in efficiency
2. Local water demand may increase in counties where population or job growth is concentrated
3. Managing CII water demand is critical in offsetting increases in residential water demand, but poorly understood
4. Outdoor water use drives variation in residential water demand associated with different development scenarios
5. Pairing efficiency with a broad portfolio of policy, planning, management, and technical options can help further manage future water demand and demand
pacinst.org | @PacificInstitut
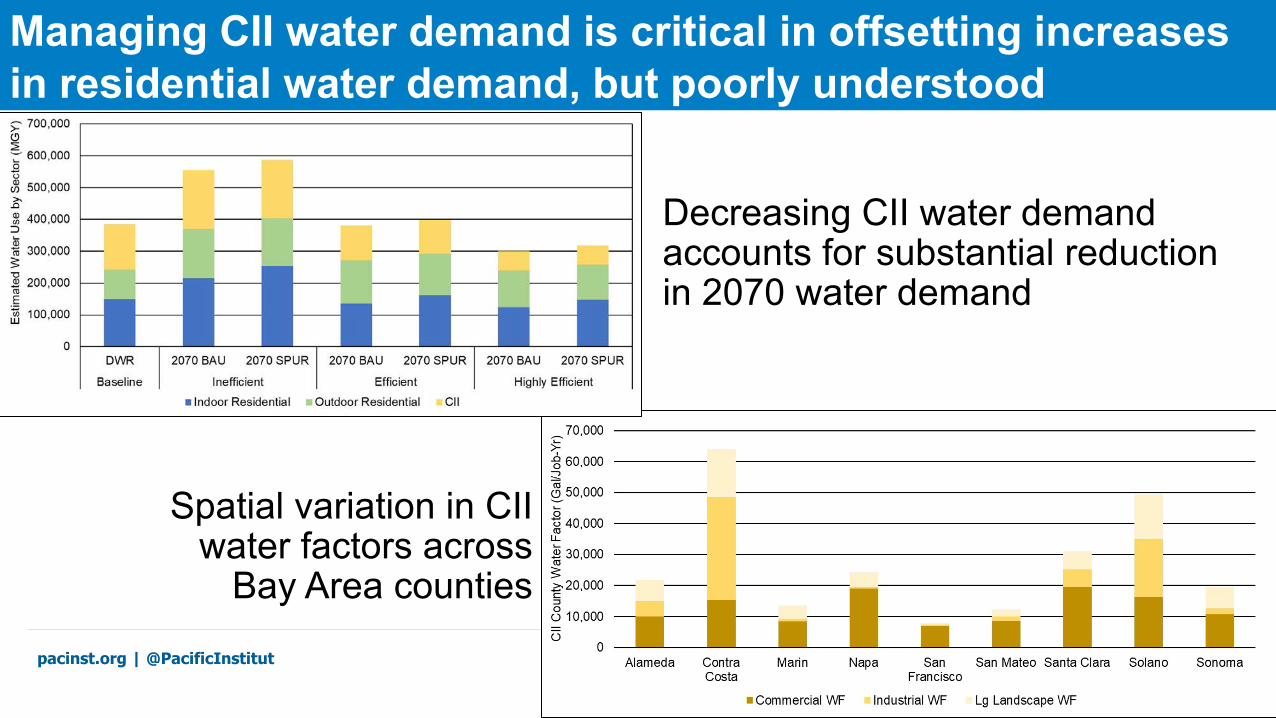
Managing CII water demand is critical in offsetting increases in residential water demand, but poorly understood
Decreasing CII water demand accounts for substantial reduction in 2070 water demand
Spatial variation in CII water factors across
Bay Area counties
pacinst.org | @PacificInstitut
Key Findings
1. 2070 regional water demand holds steady or declines with modest improvements in efficiency
2. Local water demand may increase in counties where population or job growth is concentrated
3. Managing CII water demand is critical in offsetting increases in residential water demand, but poorly understood
4. Outdoor water use drives variation in residential water demand associated with different development scenarios
5. Pairing efficiency with a broad portfolio of policy, planning, management, and technical options can help further manage future water demand and demand
pacinst.org | @PacificInstitut
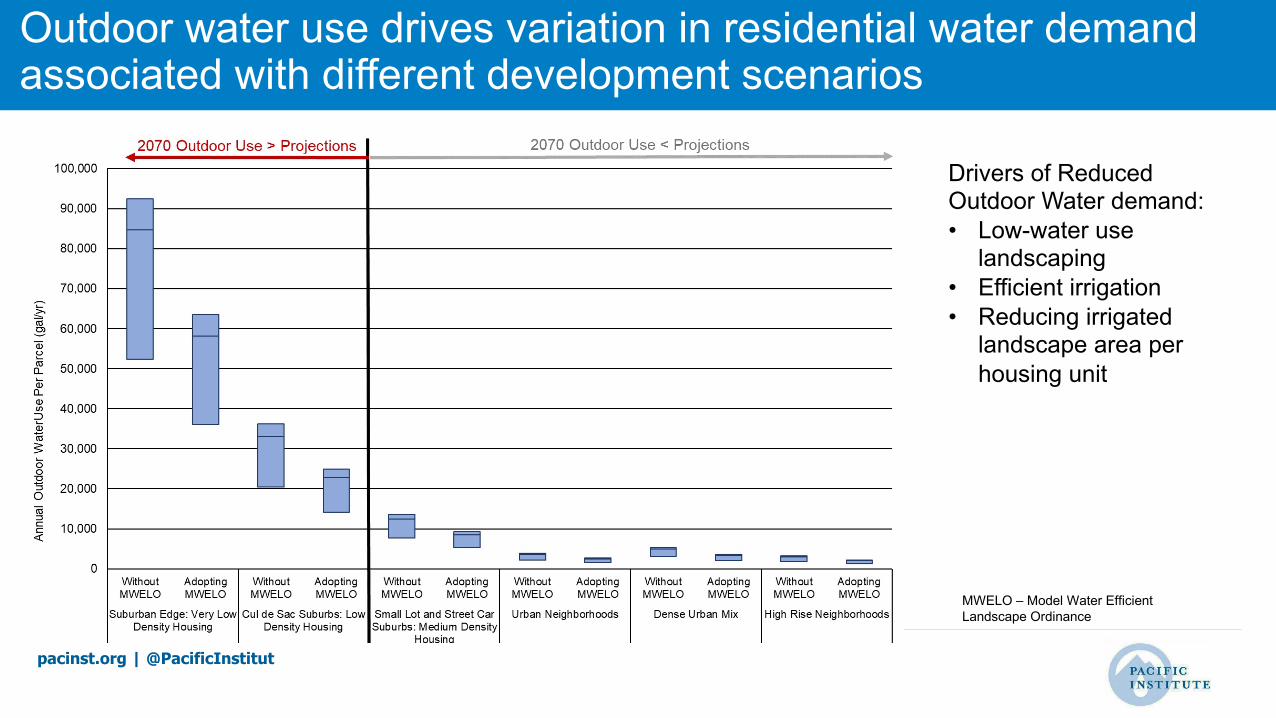
Outdoor water use drives variation in residential water demand associated with different development scenarios
Drivers of Reduced Outdoor Water demand:• Low-water use
landscaping• Efficient irrigation• Reducing irrigated
landscape area per housing unit
MWELO – Model Water Efficient Landscape Ordinance
pacinst.org | @PacificInstitut
Key Findings
1. 2070 regional water demand holds steady or declines with modest improvements in efficiency
2. Local water demand may increase in counties where population or job growth is concentrated
3. Managing CII water demand is critical in offsetting increases in residential water demand, but poorly understood
4. Outdoor water use drives variation in residential water demand associated with different development scenarios
5. Pairing efficiency with a broad portfolio of policy, planning, management, and technical options can help further manage future water demand
pacinst.org | @PacificInstitut
Senior Researcher, Pacific Institute
Anne Thebo
Thank You
pacinst.org | @PacificInstitut
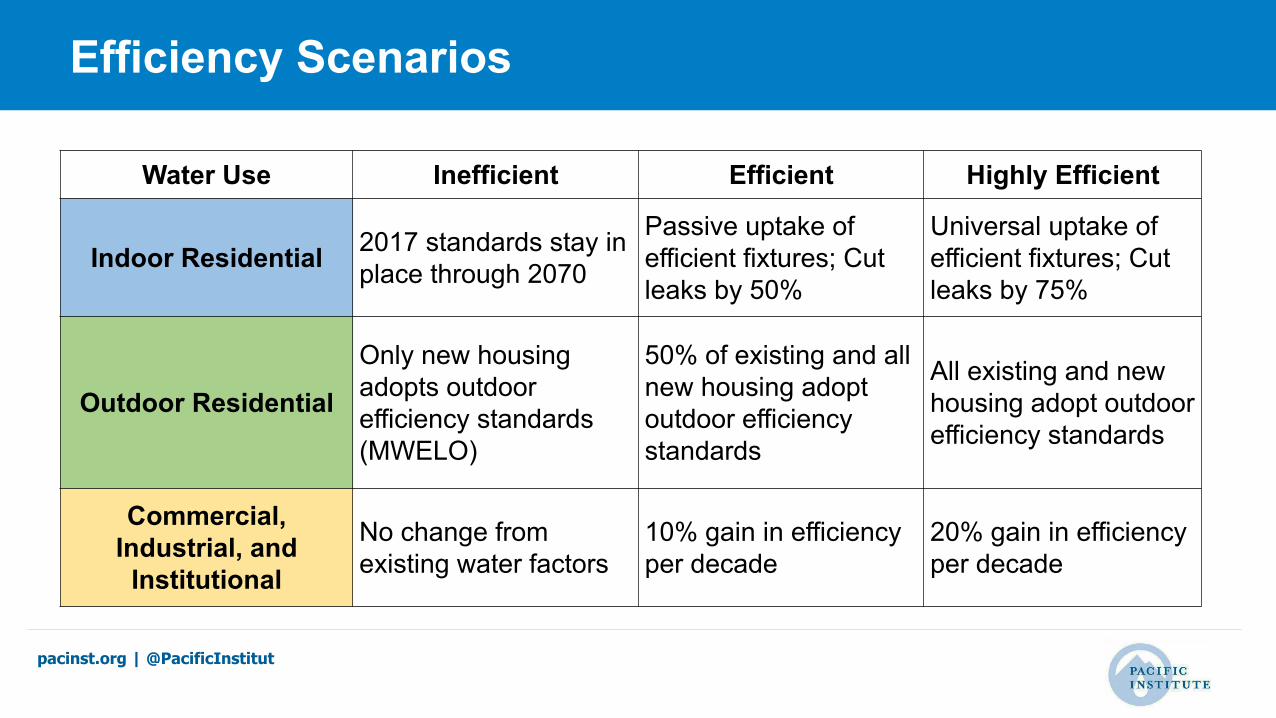
Efficiency Scenarios
Water Use Inefficient Efficient Highly Efficient
Indoor Residential 2017 standards stay in place through 2070
Passive uptake of efficient fixtures; Cut leaks by 50%
Universal uptake of efficient fixtures; Cut leaks by 75%
Outdoor Residential
Only new housing adopts outdoor efficiency standards (MWELO)
50% of existing and all new housing adopt outdoor efficiency standards
All existing and new housing adopt outdoor efficiency standards
Commercial, Industrial, and
Institutional
No change from existing water factors
10% gain in efficiency per decade
20% gain in efficiency per decade

pacinst.org | @PacificInstitut
Development Scenarios Evaluated
Scenarios
Housing Units (Million)
Estimated Population
(Million)
Jobs (Million)
Current (Baseline) 2.98 8.20 5.522070 Business as Usual (BAU) 4.38 12.65 7.62
2070 SPUR 5.18 14.98 7.62

pacinst.org | @PacificInstitut
Estimating Water Demand in 2070: Scenario Analysis
6 Efficiency and Development Scenarios (+ Baseline)
3 Classes of Water Use:• Indoor Residential• Outdoor Residential• Commercial, Industrial,
and Institutional (CII)