assessing affective differences between a virtual general
TRANSCRIPT
Portland State University Portland State University
PDXScholar PDXScholar
Chemistry Faculty Publications and Presentations Chemistry
8-15-2019
Assessing Affective Differences between a Virtual Assessing Affective Differences between a Virtual
General Chemistry Experiment and a Similar Hands-General Chemistry Experiment and a Similar Hands-
On Experiment On Experiment
Cory Hensen Portland State University, [email protected]
Jack Barbera Portland State University, [email protected]
Follow this and additional works at: https://pdxscholar.library.pdx.edu/chem_fac
Part of the Chemistry Commons, and the Online and Distance Education Commons
Let us know how access to this document benefits you.
Citation Details Citation Details Published as Hensen, C., & Barbera, J. (2019). Assessing Affective Differences between a Virtual General Chemistry Experiment and a Similar Hands-On Experiment. Journal of Chemical Education, 96(10), 2097-2108.
This Post-Print is brought to you for free and open access. It has been accepted for inclusion in Chemistry Faculty Publications and Presentations by an authorized administrator of PDXScholar. Please contact us if we can make this document more accessible: [email protected].

Journal of Chemical Education 1/2/21 Page 1 of 31
Assessing Affective Differences Between A Virtual General Chemistry Experiment and a Similar Hands-On Experiment Cory Hensen and Jack Barbera
Department of Chemistry, Portland State University, Portland, Oregon, 97207-0751, United States
ABSTRACT 5 To date, few general chemistry laboratory studies have included affective measures despite
calls for more research on aspects of this domain. This shortage of studies may be partially due to the
scarcity of affective measures that have been designed for, or tested in, the college laboratory setting.
To provide measures for use in this environment, several existing affective scales were adapted for this
new context. Before data from the scales were utilized to study the environment, evidence was 10
provided for the validity and reliability of the data generated from them. Once sufficient evidence was
provided, it was possible to determine affective differences between students completing a Beer’s Law
experiment in the traditional hands-on laboratory (control group) and a similar experiment in a virtual
environment (treatment group). To assess expected differences between environments, scales for
anxiety, emotional satisfaction, intellectual accessibility, usefulness of lab, equipment usability, and 15
open-endedness of lab were selected. To account for potential between-student differences, scales for
feeling-related initial interest and value-related initial interest were selected. Overall, students who
completed the virtual experiment scored significantly lower on the emotional satisfaction, intellectual
accessibility, usefulness of lab, and equipment usability scales. However, it was noted that student
responses in the virtual environment varied significantly by which teaching assistant (TA) instructed 20
the section. To test for a possible instructor effect, data from the virtual sections were grouped by TA
as ‘Virtual Group A’ and ‘Virtual Group B’. Group A contained the TAs who had sections with lower
averages on the emotional satisfaction scale as compared to group B. After controlling for instructor,
differences between student responses in the ‘Hands-On’ sections and ‘Virtual Group A’ sections were
no longer significant while significant differences remained between the responses in the ‘Hands-On’ 25
and ‘Virtual Group B’ sections. This outcome indicated that the TA instructing the course may have
been more influential on students’ affective outcomes than the environment in which the experiment
was performed.

Journal of Chemical Education 1/2/21 Page 2 of 31
GRAPHICAL ABSTRACT 30
KEYWORDS General Public, Chemical Education Research, Computer-Based Learning, Distance Learning
Reference Information: Cory Hensen and Jack Barbera, “Assessing Affective Differences Between a Virtual General Chemistry Experiment and a Similar Hands-On Experiment,” Journal of Chemical Education, 2019, 96, 10, 2097-35 2108, DOI:10.1021/acs.jchemed.9b00561.

Journal of Chemical Education 1/2/21 Page 3 of 31
INTRODUCTION Over the past decade, there has been a steady increase in the number of students electing to
take college classes from a distance, which typically involves taking online courses.1 While this may
provide an acceptable learning experience for courses in many fields, online courses pose a specific 40
challenge to the laboratory component of the chemistry curriculum. Currently, the American Chemical
Society (ACS) requires 400 hours of laboratory instruction for a student to earn an ACS certified
bachelor’s degree.2 This requirement highlights the common belief that laboratory courses are
essential to an undergraduate chemistry degree. Thus, universities have sought out varying ways to
include a chemistry laboratory experience for students who elect to complete courses in a non-45
traditional environment. One of the most common approaches to address this challenge is to offer a
laboratory course that uses at-home kits.3-5 These kits allow students to be exposed to laboratory
basics, such as glassware and reagents, in a space of their choosing. More recently, institutions have
taken advantage of advances in technology to offer alternatives that rely on the use of computers.
The technologic approach can be categorized in two distinct ways. The first category includes 50
experiments that incorporate the use of a remote laboratory environment. Remote laboratories involve
a student using a computer interface to control an instrument that is housed at a different
institution.6-7 For example, a student controls a robotic system to put a sample into an instrument to
take a physical measurement and data from the instrument is then reported back to the student. This
method allows students to collect real-time data from physical instruments without being physically 55
present for the data collection. The second category includes experiments that simulate the entire
process, including data collection. This approach, called a virtual laboratory environment, drastically
reduces operating costs as there are no physical laboratory spaces, reagents, or instruments to
maintain. There have been a number of different approaches to the virtual laboratory ranging from
simple simulations8-9 to fully-immersive environments10-11 and multiple environments in-between.12-15 60
Regardless of which environment is chosen as an alternative to the physical laboratory, it is
imperative that potential differences between environments be evaluated to ensure that students have
similar outcomes to the students in the traditional hands-on laboratory across the three domains of
learning (cognitive, psychomotor, and affective). Outcomes in the cognitive domain include aspects of
Journal of Chemical Education 1/2/21 Page 4 of 31
the knowledge acquired in an experiment16, outcomes in the psychomotor domain include the skills 65
acquired from the experience17, and outcomes in the affective domain include aspects of students’
attitudes and emotions regarding an experiment or the learning envrionment18. The cognitive domain
is frequently measured by administering content-based items such as prelab or postlab quizzes in a
laboratory environment or test questions in a lecture environment. The psychomotor domain is
frequently measured in the laboratory setting with the use of laboratory practical exams that measure 70
specific skills students are expected that have learned. The affective domain includes a wide range of
constructs including motivation, emotion, interest, values, attitudes, and many more. Within each
construct, there may be further subconstructs such as self-efficacy within the broader construct of
motivation. These constructs can then be targeted for specific interventions and measured to
determine whether an intervention has positive or negative impacts. In the college setting, it has 75
previously been reported that motivation, self-esteem, self-perceptions, feelings of confidence, self-
concept of ability, and teacher praise are some of the most important affective constructs to target.19
More specifically, for the laboratory the construct of general attitude has been proposed as an
important affective construct, as one of the goals of the science laboratory is to increase students’
attitude toward science.20 Aspects of these three domains need to be measured to determine what, if 80
any, differences exist between learning environments.
Differences Between Traditional and Alternative Environments Several studies have been conducted to examine the advantages and disadvantages of
incorporating virtual experiments in various curricula ranging from high school chemistry
laboratories11, 21 to upper-division college laboratories13-14. These studies generally fall into two 85
categories. The first category includes comparative studies that examine differences between a virtual
and a traditional hands-on experiment using treatment and control groups. The second category
includes studies that describe the virtual environment used and the potential advantages and
disadvantages they have without the use of a comparative group.
At the general chemistry level, Hawkins and Phelps conducted a comparative study with 84 90
students completing a virtual electrochemistry experiment and 85 students completing the equivalent
traditional hands-on experiment.15 The students completed a pretest and a posttest content knowledge

Journal of Chemical Education 1/2/21 Page 5 of 31
quiz to determine if there were any cognitive domain differences between the groups. No statistical
difference between the two groups was detected. As there were remaining questions if virtual
experiments could provide the same psychomotor outcomes as a traditional hands-on laboratory 95
environment, the researchers measured both groups’ ability to complete a hands-on practical
regardless of which environment they completed the experiment in and again no statistical difference
was detected. While the researchers concluded that no differences were detected between
environments in the cognitive and psychomotor domains, they did not measure any aspects of the
affective domain. 100
A comparative study that focused on potential differences in the affective domain was
conducted by Pyatt and Sims at the high school level.21 In their study, students were assessed using a
newly created affective instrument, the Virtual and Physical Experimentation Questionnaire (VPEQ),
that measured students’ attitude towards various aspects of the two environments. This instrument
measured aspects of usefulness of computers, anxiety towards computers, equipment usability, open-105
endedness of lab, and usefulness of lab. Within-person differences were controlled for by using a 2x2
Latin square (crossover) study design in which the 184 students completed both a virtual experiment
and a traditional hands-on experiment.22 Results indicated a higher average for the virtual experiment
for the constructs of equipment usability and open-endedness of lab but no detectable difference
between environments for the construct of usefulness of lab. The significance of these differences was 110
not tested. In addition to these affective constructs, cognitive domain differences were measured by
scoring laboratory reports. The first experiment was scored using a binary scale whereas the second
was scored on a four-point scale. No significant difference was detected between groups in the first
experiment but a significant difference was detected in the second experiment, with the scores of the
students who completed the traditional hands-on experiment being significantly lower than the scores 115
of the students who completed the virtual experiment. The scoring system for the cognitive
assessments changed between experiments to allow for more resolution and thus could explain why
significance was found for the second experiment but not the first. Future work should be done to
elaborate on the affective and cognitive differences seen in this comparative study and how they
compare to the collegiate level. 120

Journal of Chemical Education 1/2/21 Page 6 of 31
Grove and colleagues measured differences across all three domains of learning for a college
hybrid curriculum that incorporated LearnSmart Labs by McGraw-Hill Education.23 Rather than
measure differences for a specific experiment, the differences measured were for the entire hybrid
curriculum as a whole. In total, 195 students completed the hybrid curriculum across the 2015
calendar year. In this curriculum, students alternated between a virtual experiment and a traditional 125
hands-on experiment. There were no statistically significant differences found when measuring
cognitive outcomes using the ACS General Chemistry Laboratory Assessment or psychomotor
outcomes using a hands-on laboratory practical. However, the hybrid students had a significantly
lower mean scale score on the affective portion of the Meaningful Learning in the Laboratory
Instrument (MLLI), which has 8 items that measure a general affective state. Upon further 130
examination of the items, it was revealed that students in the hybrid curriculum had lower affective
aspects with the exception of worrying about completing the lab on time when compared to the hands-
on students, however, it was not possible to determine what differences were specific to the virtual
environment as the hybrid curriculum included both types of experiments and data was collected only
at the beginning and end of the curriculum. 135
Irby and colleagues focused more narrowly within a hybrid curriculum to better understand if
students who completed an electrical conductivity experiment in a virtual environment engaged with
the chemistry triplet24, which models the different levels of understanding in chemistry:
submicroscopic, macroscopic, and symbolic, to a different degree than students who completed a
similar hands-on experiment.25 Their study utilized a pretest-posttest alternative treatment with a 140
control group study design26 where there was a control section that did not use the hybrid curriculum
and two treatment sections that did. The two treatment sections were staggered so that in any given
week, one section was completing a hands-on experiment while the other section was completing a
virtual experiment on a different topic. This allowed for the institution to offer three laboratory sections
while only having two laboratory rooms available. However, this meant that the control section and the 145
two treatment sections had a different order of experiments over the course of the term. For example,
the “leading” hybrid section completed the conductivity experiment in week seven whereas the
“trailing” hybrid section and the hands-on students completed the experiment in week six. After

Journal of Chemical Education 1/2/21 Page 7 of 31
comparing the sections, no statistically significant differences were found on the cognitive outcomes,
as measured by pre- and post-assessments, nor students’ use of the chemistry triplet. However, the 150
authors note that this could be a function of the small sample size as the students who completed the
experiment in the virtual environment appeared to connect between the triplet levels more often
despite the difference not being statistically significant.
Winkelmann and colleagues used the virtual platform Second Life (SL) to measure differences
across the three domains of learning for two specific experiments rather than a hybrid curriculum.10 155
In this study, 55 students completed both a gas law experiment and a titration experiment in the SL
platform while 67 students completed both experiments in a traditional hands-on (control)
environment. Both the control and the SL group showed cognitive gains on the post-quiz as compared
to the pre-quiz, however, the SL group had significantly higher gains in both experiments. Within the
psychomotor domain, students in both groups performed equally well on a follow-up hands-on 160
laboratory practical. To measure differences within the affective domain, students were asked general
questions authored by the researchers about their experience in the respective learning environment.
These general questions were elaborated on in written responses and focus groups. Students reported
that the SL experiments took less time to complete, they felt that they learned more in the traditional
hands-on experiment, and had higher perceived grades in the SL experiment as compared with 165
previous hands-on experiments. Future research can expand on these findings by using affective
instruments with measured psychometric properties rather than general self-authored questions.
The second type of commonly conducted study pertaining to alternative labs does not contain a
traditional hands-on laboratory control group. Instead, in descriptive studies, the advantages and
disadvantages of a specific virtual platform are investigated. Winkelmann and colleagues conducted a 170
study on SL at the high-school level before conducting the comparative study at the college level.11 In
this study, seven high school students completed a SL experiment as part of a summer class. The
students were evaluated on aspects of their attitude using a modified version of the Inquiry Laboratory
Attitudes Survey27. However, the scale was developed for inquiry-labs and had not been
psychometrically evaluated for the new context. The students were also evaluated on their cognitive 175
outcomes by assessing their laboratory report. The students were able to successfully complete the

Journal of Chemical Education 1/2/21 Page 8 of 31
experiment, as indicated by their laboratory report score, and reported that they felt the SL experiment
was shorter than their other experiments in the term. In addition to this study, descriptions of how SL
can be used more broadly in chemistry as a discipline has been the subject of multiple articles.28-29
Woodfield and colleagues created a suite of virtual experiments including one as part of an 180
inorganic laboratory curriculum14 and one as part of an organic laboratory curriculum13. These
studies are descriptive in nature and thus they did not have a control group. In their inorganic study,
they found that students were able to use the virtual environment to complete experiments that would
be challenging to complete in a traditional hands-on laboratory setting. For example, the students
were given 26 cations and 11 reagents that they could combine, which would have required significant 185
prep time for the traditional hands-on laboratory. Many of the students reported qualitatively that the
virtual experiment helped them learn the content. Similarly, in their organic study, they found that the
students who had a positive experience with the virtual experiment were more likely to have a higher
course grade. Unlike the Hawkins and Phelps study, Woodfield and colleagues focused more on
affective differences. They found that students in both the inorganic and organic study preferred the 190
virtual experiment for the adaptability of the environment to perform experiments that are not as
feasible to do in traditional hands-on laboratories. However, they used general Likert-type items to ask
affective questions that were not rooted in any specific construct and also they did not measure any
psychomotor outcomes.
Overall, the comparative and descriptive studies on virtual experiments in the chemistry 195
curricula point to either no difference11, 15 or a slight potential benefit10, 13-14, 21 in the cognitive domain
when students complete the experiment virtually. This is in line with studies measuring the cognitive
domain when the alternative environment is an at-home kit3, 30 or a remote environment31-34. In
addition to the cognitive domain, there was no difference in the students’ ability to perform the
laboratory skill covered in the experiment for the studies that included a psychomotor measure.10, 15 200
However, of the comparative and descriptive studies, only one study used an affective measure that
has been psychometrically tested.21 The remaining studies either did not measure the affective
domain, or used items that had unknown psychometric properties to measure the affective domain.
This is a common challenge across all laboratory studies and not solely on studies involving
Journal of Chemical Education 1/2/21 Page 9 of 31
alternative environments, as there have been few affective measures developed or adapted for 205
chemistry laboratories.
Affective Domain Measures for the Laboratory In response to a historically heavy focus on cognitive outcomes in research studies, the
National Research Council has called for studies in discipline-based education research (DBER) to
include the evaluation of outcomes within the affective domain.35 Despite this call, a majority of 210
chemistry laboratories studies either provide limited scope to the affective domain or do not include it
at all. A primary reason for this has been the lack of affective measures designed for and tested
specifically in the laboratory. A recent instrument, the MLLI36, was designed to address this issue and
it has allowed researchers to study how aspects of the affective domain in the laboratory change over
time37 and based on an intervention38-39. Additionally, it has been used to categorize student profiles40. 215
Another example of an affective instrument developed specifically for the laboratory is the chemistry
laboratory anxiety instrument (CLAI)41.
While not developed specifically for the laboratory, instruments to measure various aspects of
the affective domain of chemistry students include the Metacognitive Activities Inventory (MCAI)42, the
Chemistry Expectations Survey (CHEMX)43, the Chemistry Self-Concept Inventory (CSCI)44, the 220
Attitude toward the Subject of Chemistry (ASCI)45 and the revised version (ASCIv2)46, the Colorado
Learning Attitudes about Science Survey (CLASS-Chem)47, and the Academic Motivation Scale (AMS-
Chem)48. These instruments serve as potential measures for the affective domain in the laboratory
setting. However, for any of these instruments to be used in studies of the laboratory environment
their functioning in this new context would need to undergo psychometric testing to ensure that there 225
was sufficient evidence of data validity and reliability.
Psychometric Testing Whenever an instrument is distributed within a different setting than originally developed for,
evidence for the validity and reliability of data from the instrument in the new context needs to be
provided.49-51 For example, it is possible that questions asked in a classroom setting do not function in 230
the same way in a laboratory setting. Thus, the internal structure of the instrument could be different
and pose a threat to the validity. Another issue that could arise from adapting an existing instrument
Journal of Chemical Education 1/2/21 Page 10 of 31
to a new context is that students no longer interpret the questions as they were initially intended. For
example, an item asking if the student “feels comfortable” may be interpreted in multiple ways. One
way students may interpret the item is if they feel comfortable with big-picture concepts but 235
alternatively, it may be interpreted is if they feel physically comfortable in the laboratory setting itself.
Differences like this pose a threat to the response process aspect of validity.52 Additionally, to
accurately compare treatment and control groups with the same instrument, invariance testing needs
to take place to show that both groups have the same relationship to the variables being measured.53
If evidence is provided that items are functioning in both contexts, it is possible to use the items to 240
measure meaningful differences between groups.
Research Questions Previous work on the differences between traditional hands-on and alternative laboratory
environments has found very little or no difference on measures in the cognitive domain, however,
there have been fewer studies on the differences in the affective domain. This study aims to address 245
this gap by investigating differences between a virtual environment and a traditional hands-on
environment within the affective domain of learning. Before differences can be tested, evidence for the
validity and reliability of the data generated from the scales used needs to be provided. As such, this
research is guided by the following three questions:
1. To what degree can previously developed scales be adapted for use in the laboratory environment? 250
2. What evidence of validity and reliability supports data collected with the adapted scales?
3. How do various aspects of the affective domain compare when students complete a general
chemistry experiment virtually as opposed to a traditional hands-on experiment?
Methodology Overview 255
A post-test-only alternative treatment control group research design was chosen to investigate
the effect of virtual experiments on affective outcomes.54 To address Research Question 1, several
affective scales were selected and modified for use in the laboratory setting. Cognitive interviews were
used to evaluate the validity of the modified scales. The scales were distributed within the interview
Journal of Chemical Education 1/2/21 Page 11 of 31
format to determine how students responded and to assess any issues with the response process for 260
the selected items. To address Research Question 2, psychometric analysis was performed to address
the internal structure of the individual scales, the scales relation to each other, and the internal
consistency of the scales. To address Research Question 3, comparative statistics were used to
determine what, if any, affective differences existed between environments. As this project has multiple
facets, the research questions will be used to organize the methodology and results sections. 265
Human Subject Research All parts of this research were approved by the institutional review board at the author’s home
institution, Portland State University. Participants in the laboratory courses had the option to provide
informed consent and only those participants who consented are represented in the data.
Research Question 1: Selection of Scales 270
Anderson summarized that there are seven central student affective characteristics: values,
academic self-esteem, anxiety, interests, locus of control, attitudes, and preferences.55 Anxiety,
attitudes, and interests were chosen for inclusion in this study. The selection was limited to three to
avoid survey fatigue, thereby reducing the chance of students reporting less thoughtful answers. The
Attitude toward the Subject of Chemistry Inventory (ASCI) scales for the cognitive aspect of attitude 275
(intellectual accessibility) and the affective aspect of attitude (emotional satisfaction) were selected
based on one of the general goals of the chemistry laboratory; to increase students’ attitude toward
science.20 The original ASCI scales were chosen over the modified version of the scales (ASCIv2)
because the scales were being adapted for a new context. Thus, all original items were tested as it was
unclear if the modifications made would be the same modifications needed for a different context. 280
Additionally, there may be differences in students’ anxiety as those completing an experiment within
technology-based alternative environments, such as a virtual environment, do not need to consider the
safety hazards of chemicals nor do they have to wear proper personal protective equipment (PPE).
Therefore, an anxiety scale based on the Chemistry Laboratory Anxiety Instrument (CLAI) and the
ASCI anxiety scale was created. There may also be specific environment differences, such as ease of 285
equipment use, and thus items from the Virtual and Physical Experimentation Questionnaire (VPEQ)
were selected. Beyond these differences, there may be differences in students’ incoming interest

Journal of Chemical Education 1/2/21 Page 12 of 31
towards chemistry. To control for any incoming differences, an interest scale previously adapted for
chemistry56 was selected. The modified version of each scale used in this study is provided in the
Supporting Information. 290
Research Question 1: Modifying and Adapting Selected Scales
Emotional Satisfaction and Intellectual Accessibility The ASCI and the modified version (ASCIv2) have been widely used to measure students’
attitude changes across the implementation of an intervention.57-59 Although the ASCI was originally
administered in the laboratory45, the items were operationalized to chemistry as a whole. Therefore, 295
the frame of reference of these scales was altered by changing from the original frame of reference of
“Chemistry is…” to “This experiment was…”. The emotional satisfaction and intellectual accessibility
scales are comprised of semantic differential questions. A semantic differential question contains a
spectrum between two polar opposite words such as safe and unsafe.60 The administration of the
scales was done electronically and as a result, it was possible to change the original seven-point 300
semantic differential scale to a sliding scale from 0 to 100. This change allowed the students to select
anywhere along the spectrum. No additional changes were made to the scales.
Anxiety Students’ anxiety levels may differ between laboratory environments and have been shown to
be related to student attitude.45 While the original ASCI did have semantic differential items on 305
anxiety, there was little reasoning given for why some of the word pairs were chosen. For example, it
was unclear how the ‘disgusting-attractive’ item pair informed aspects of anxiety. Therefore, after
careful review of the original ASCI anxiety items, only the ‘relaxed-tense’ pair was selected for use. In
addition to this item, the stems from the twenty items on the Chemistry Laboratory Anxiety
Instrument (CLAI) were used to create additional anxiety semantic differential item pairings. For 310
example, multiple CLAI items measured students’ nervousness while performing a range of tasks and
therefore ‘nervous’ was chosen as one of the words for the semantic differential. The opposite word for
each word pair was decided by the researchers and were later tested for evidence of validity. For the
case of nervous, calm was chosen as the opposite word. In total, there were four word pairs selected

Journal of Chemical Education 1/2/21 Page 13 of 31
based on the CLAI stems that, with the original ASCI item, gave a total of five word pairs: nervous-315
calm, safe-unsafe, anxious-unconcerned, apprehensive-at ease, and relaxed-tense.
Usefulness of Lab, Equipment Usability, and Open-endedness of Lab The VPEQ was designed to measure specific differences between the virtual environment and
the traditional hands-on environment when used in a crossover research design.21 The 39 original
items were analyzed to determine which could be modified to fit the current research design in which 320
students complete an experiment in either the treatment or the control environment. For example,
item 11 stated “the regular lab experiments worked better than the computer experiments” and item
29 stated “computer simulations work better than regular experiments”. These items were combined to
ask students if the experiment worked well. After analyzing the original items, ten items were selected
that could be generalized or modified for use in the current research design. These ten items were 325
given on a five-point (strongly agree-strongly disagree) Likert-type scale.
Interest Scale In addition to expected differences across environments, there may be additional differences
between students that could relate to their laboratory experience and outcomes. Previous research
found a link between students’ incoming interest levels and course performance.61 Therefore, the two 330
components of initial interest, feeling-related interest and value-related interest, were measured to
account for potential differences in incoming ability.62 As these scales were adapted to measure
students’ incoming general interest in chemistry, no modifications were required. However, they had
not been applied to or evaluated within the laboratory environment prior to this study.
Research Question 1: Scale Testing 335
Response Process Validity Students were recruited for a response process interview from the general chemistry laboratory
sections during the Winter 2017 term. Classroom announcements were made at the beginning of a
laboratory period and students were provided a link to sign up for interview slots. Participants were
compensated ($20 gift card) for participating in the interview. During the interview, participants 340
completed the items from the anxiety, emotional satisfaction, intellectual accessibility, usefulness of
lab, equipment usability, open-endedness of lab, initial interest-feeling, and initial interest-value
Journal of Chemical Education 1/2/21 Page 14 of 31
scales one item at a time. For each item, they were asked to provide their reasoning for selecting a
particular response to determine if there was evidence for response process validity. This type of
validity is an evaluation of the respondents understanding of an item to ensure its alignment with the 345
authors intended meaning.52, 63 If the rationale students provided was not aligned with the
researcher’s intended meaning, the item was flagged for modification or removal. If students gave a
rationale that was aligned with the intended meaning, there was validity evidence that the item was
being interpreted as intended and could be used in future implementations of the scale in the given
context. 350
Research Questions 2 and 3: Implementation of Experiments Population
All sections of the general chemistry laboratory at Portland State University were assigned to
complete the selected experiment in either the virtual environment (treatment group) or the traditional
hands-on environment (control group). This is an approximately random selection as students enroll 355
in the section that best fits their schedule. Students were not made aware ahead of time which
sections would complete the experiment in a virtual environment. A total of 28 sections of the general
chemistry laboratory taught by 14 graduate teaching assistants (TAs) were offered in the Fall 2018
term with a total enrollment of 634 students. Sixteen of these sections completed the virtual
experiment and twelve sections completed the traditional hands-on experiment. For logistical reasons, 360
the sections were unable to be balanced at fourteen sections for each environment. While all students
completed the experiment in their section’s assigned environment, only responses from students who
consented to participate in the study were analyzed.
Experiment Selection and Design The concept of Beer’s Law is commonly covered in an experiment during the first term of a 365
general chemistry laboratory sequence and as such was selected for this research study. In this
institution’s hands-on experiment, students use a known concentration of Allura Red to make a
calibration curve and calculate the concentration of Allura Red in red Gatorade. The matching virtual
experiment was chosen as the ‘Spectrophotometry: Calibration Curves’ experiment within LearnSmart
Labs by McGraw-Hill Education. In this virtual experiment, students are randomly given either a red, 370

Journal of Chemical Education 1/2/21 Page 15 of 31
yellow, or blue dye. They are given five prefilled test tubes with known concentration of the selected
dye to create the calibration curve and a test tube with unknown concentration. Additionally, since the
virtual students did not have to create their own solutions from a stock solution, they were also tasked
with first completing the ‘Dilute Solutions’ experiment in the LearnSmart environment. This
experiment had them dilute a stock solution to two different concentrations, which allowed them to 375
still gain practice with the concept of diluting a stock solution.
Data Collection Students completed either the traditional hands-on or virtual experiment in the laboratory
room with their TA and laboratory partner. Once students completed the experiment, the TA prompted
them to use the laboratory computers to answer the scale items administered through the Qualtrics 380
program. Included among the scale items was a ‘check item’. A check item is a question that asks
students to select a specific response option to ensure that students are carefully reading and
responding to the items. For this study, the check item read “Please select strongly agree for this
question”. Therefore, it is assumed any student who did not select strongly agree for the question was
not carefully reading the items and thus their data was not used for analysis. 385
Research Question 2: Analysis After collecting the affective item responses, the structure of the scales was examined to
provide evidence of the internal structural validity of each scale. To do this, confirmatory factor
analysis (CFA) was used to evaluate a priori models of each scale. The analyses were conducted using
version 0.6-3 of the R package lavaan64. To account for any non-normality in the data, the maximum 390
likelihood with Satorra-Bentler corrections (MLM) estimator was used for all CFA models. Additionally,
previous research provided links between the feeling and value aspects of interest56 and between the
constructs of anxiety, emotional satisfaction, and intellectual accessibility65. Therefore, a two factor
and a three-factor model, respectively, were tested to confirm those relations. All scales were reviewed
for potential modifications if individual factor loadings were below a cutoff value of 0.4 or if the fit 395
indices were out of range (i.e., CFI below 0.95, SRMR above 0.08, and/or RMSEA above 0.06) as
recommend by Hu and Bentler.66 Additionally, the internal consistency of each scale was tested and
modifications were made if any scales had an omega value below the generally accepted cutoff value of

Journal of Chemical Education 1/2/21 Page 16 of 31
0.70. McDonald’s omega is similar to the commonly reported alpha but is more appropriate for
congeneric models, which is a model where factor loadings and error terms are not constrained to be 400
equal.67 Therefore, single-factor congeneric CFA models were tested for each scale.
Research Question 3: Analysis Once all scale data was deemed to have acceptable model fit, invariance testing took place to
examine if both the treatment and control groups responded to the items in a similar fashion. To test
for measurement invariance, each model was tested with the data split by group rather than combined 405
into a single data set. If the global model fit is still within the acceptable range when the model is
tested by group (with equal loadings and intercepts) or if the CFI changes by less than or equal to
0.01, then measurement invariance is determined and the two groups can be compared on the
affective items.68 A relatively small change in the CFI indicates that specifying the model to have equal
loadings and intercepts did not change the model in a meaningful way. This indicates that the two 410
groups were responding in a similar fashion. If the model fit changed drastically then further
investigation of the response differences would be warranted. Once invariance was determined, a
multivariate analysis of variance (MANOVA) was conducted using version 24 of SPSS to evaluate group
means on multiple affective scales to determine if there are any statistical differences in the measured
affective domain aspects between the virtual and traditional hands-on environment. 415
RESULTS Research Question 1: Response Process Validity
Ten students participated in an interview. Each student completed the items from scales one
item at a time and then gave their reasoning for their response selection. For example, on the
intellectual accessibility scale, a student selected that the experiment was closer to the ‘confusing’ side 420
of the word pair ‘confusing-clear’ because “I think the procedure was a little unclear”. This response
aligned with the intended interpretation of the word pair and thus provided evidence for response
process validity. For all but one item, students gave reasoning for their selected answer that correctly
aligned with the intended meaning of the item. This increased the confidence that the newly created
anxiety scale was functioning as intended. All ten students struggled to correctly interpret the item, 425
“There is opportunity for me to pursue my own experimental interests” from the VPEQ usefulness of
Journal of Chemical Education 1/2/21 Page 17 of 31
lab scale. All students interviewed were confused about what the term “experimental interests” meant.
Therefore, this item was discarded and all other items were retained.
Research Questions 2 and 3: Population There were 634 students enrolled in the first term general chemistry laboratory in the Fall 430
2018 term. Of those students, 448 students consented to have their data analyzed. There were 52
students who incorrectly responded to the check item “Please select strongly agree for this question”
and thus were removed from the data set leaving 396 students in the final cleaned data set of which
178 of the students completed the traditional hands-on experiment and 218 completed the virtual
experiment. 435
Research Question 2: Reliability and Validity Evidence of Data Provided By Scales
Individual Model Testing and Modifications Before the difference in means between laboratory environments were analyzed, the scales were
tested individually as single-factor, congeneric, CFA models to ensure they functioned as intended.
This took place for each scale with four or more indicator items before analyzing the relations between 440
individual scales. The equipment usability and open-endedness of lab scales each consisted of two
items and the initial interest-value scale consisted of three items. Thus, it was not possible to test the
model fit for these scales as they would not be over-identified models.69
Single-factor model results for the anxiety scale indicated that each fit statistic was outside the
chosen cutoff criteria (Table 1). Additionally, the CFI for the intellectual accessibility scale was outside 445
of the chosen cutoff. All other scales had CFI and SRMR values that were within the acceptable cutoff
range and most scales had RMSEA values outside of the cutoff range, as shown in Table 1. However,
when the degrees of freedom in a model are low (e.g. less than 50), the RMSEA is biased and should be
interpreted with caution.70 The degrees of freedom are low for these models and as such the RMSEA
was not used as a primary indicator of fit. The lack of model fit for the anxiety and intellectual 450
accessibility scales required further investigation before analysis.
Along with model fit, the internal consistency of each scale with four or more items was tested.
Cronbach’s alpha is commonly used to measure this reliability, however, as the single-factor models

Journal of Chemical Education 1/2/21 Page 18 of 31
were tested as congeneric, McDonald’s omega was more appropriate.67 All scales had an acceptable
internal consistency as shown by the omega value in Table 1. 455
As the anxiety scale did not have acceptable fit, the loadings were examined and it was noted
that the word pair ‘safe-unsafe’ loading was 0.165, which was significantly lower than the other items
and below the chosen cutoff value of 0.4. Therefore, this item was removed and upon retesting the
single-factor model, the anxiety scale had acceptable fit indices, as noted as ‘modified anxiety’ in Table
1, and had satisfactory internal consistency. The loadings of the intellectual accessibility scale did not 460
have any values below the chosen cutoff value, therefore, the modification indices of this scale were
investigated to determine if there were feasible relations between variables that would improve model
fit. A high modification index between the error terms of the ‘hard-easy’ and ‘challenging-
unchallenging’ word pairs was detected. Cohen’s w was calculated to determine the effect of
correlating these terms, it was determined that the modification would result in a large effect of 0.46.71 465
Given the large effect and the word pair similarities, it is possible that they did not have independence
of errors and thus the error terms for these items were correlated. This modified model showed
acceptable model fit with good internal consistency, noted as ‘modified intellectual accessibility’ in
Table 1.
Table 1: Fit indices and internal consistency values for single-factor models. Indices in italics are 470 outside of the recommended range. Omega values are only shown for congeneric models deemed to have acceptable fit.
CFI SRMR RMSEA df Omega Emotional Satisfaction 0.95 0.04 0.26 2 0.88
Intellectual Accessibility 0.91 0.05 0.22 5 --- Modified Intellectual Accessibility 0.99 0.02 0.10 4 0.85
Anxiety 0.85 0.09 0.21 5 --- Modified Anxiety 0.99 0.02 0.05 2 0.81
Usefulness of Lab 1.00 0.01 0.05 2 0.85 Initial Interest-Feeling 0.98 0.02 0.14 2 0.88
Two-factor and Three-factor Model Testing The ASCI scales were published with correlations between anxiety, intellectual accessibility,
and emotional satisfaction. Therefore, a three-factor model was tested to determine if the newly 475
created anxiety scale correlated to the existing scales in a similar fashion. The four-item anxiety scale,
the emotional satisfaction, and the intellectual accessibility with the correlated item error term were

Journal of Chemical Education 1/2/21 Page 19 of 31
tested as a three-factor CFA model, as seen in Figure 1. The three-factor model produced acceptable fit
indices (CFI: 0.95, RMSEA: 0.08, SRMR: 0.04) allowing correlation comparisons to be made to the
previously reported values. 480
The three-factor model had a strong positive correlation between the intellectual accessibility
and emotional satisfaction factors (0.91). Both intellectual accessibility and emotional satisfaction
correlated negatively with anxiety (-0.65 and -0.66 respectively), as expected.45 Bauer reported the
correlation between anxiety and emotional satisfaction as -0.72, between anxiety and intellectual
accessibility as -0.58, and between emotional satisfaction and intellectual accessibility as 0.62.45 485
While the correlation to anxiety is similar, Bauer used different word pairs for the anxiety scale and
did not have a correlated error term for intellectual accessibility. Similarly, Xu and Lewis did not have
the correlated error term, had one less item for intellectual accessibility and did not include an anxiety
scale in their ASCIv2. Even with the differences, they reported a similar correlation of 0.80 between
their version of emotional satisfaction and intellectual accessibility.72 These correlations were similar 490
to the previously reported correlations with the exception of the correlation between emotional
satisfaction and intellectual accessibility, which was higher than previously reported. This could
indicate that the affective and cognitive aspects of attitude may not be as distinct in the laboratory
environment using these scales or that the addition of the original fifth item and the correlated error
term strengthened the relation between the scales. 495
Figure 1: Three-factor model showing correlations between ASCI scales including Anxiety (Anx), Emotional Satisfaction (ES), and Intellectual Accessibility (IA). Correlation coefficients from original ASCI (a)45 and ASCIv2 (b)46 shown for comparison.
The interest scale had been previously reported in the literature as a two-factor model.56 Thus, 500
the ‘feeling’ and ‘value’ components were tested as a two-factor model and produced an acceptable fit
(CFI: 0.98, RMSEA: 0.07, SRMR: 0.03). The correlation between the ‘feeling’ and ‘value’ factors was
0.77, which was similar to the reported value of 0.69 as noted in Figure 2.

Journal of Chemical Education 1/2/21 Page 20 of 31
Figure 2: Two-factor model and correlations between initial interest scales. Correlation coefficient from original Ferrell and Barbera data (a)56 shown for comparison. 505
After testing the models, it was determined that the three-factor model of the anxiety,
emotional satisfaction, intellectual accessibility scales and the two-factor model of the initial interest-
feeling and initial interest-value scales had acceptable fit in this context and produced similar
correlations to their prior setting and format. These results added to the confidence that the scales 510
were functioning as intended, including the initial interest-value scale that could not be evaluated as a
single-factor model. However, before the individual scales can be used to compare the two
environments, measurement invariance had to be shown to ensure that both groups were responding
to the scales in a similar manner.
Invariance Testing 515
Each single-factor model was retested by group to measure the change in the global fit indices
with equal intercepts and loadings. Under these conditions, the CFI for all models only changed
slightly except for the one-factor intellectual accessibility model, as shown in Table 2. This result
indicates that both the virtual and the hands-on students were interpreting the scale items similarly
and a comparison between group means could be made for the individual scales. The intellectual 520
accessibility scale had acceptable fit indices, despite the relatively large change in CFI, when tested as
a grouped model (CFI: 0.95, SRMR: 0.07, RMSEA: 0.13) and as such, it was also deemed acceptable
for inclusion in the group mean analysis.
Table 2: Difference in fit indices for models by group. 525
DCFI DSRMR DRMSEA df Emotional Satisfaction -0.01 0.01 -0.09 10
Intellectual Accessibility -0.04 0.05 0.03 16 Anxiety -0.01 -0.03 -0.03 10
Usefulness of Lab -0.01 0.04 0.01 10 Initial Interest-Feeling 0.01 0.01 -0.07 10
Journal of Chemical Education 1/2/21 Page 21 of 31
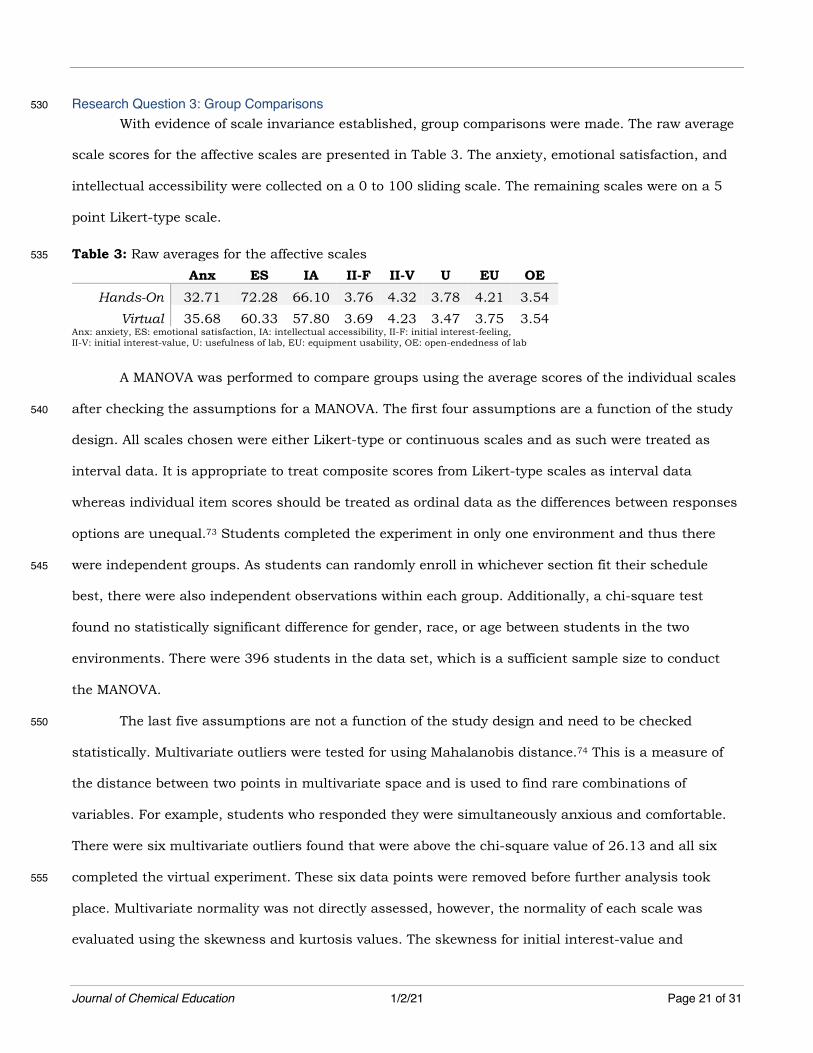
Research Question 3: Group Comparisons 530
With evidence of scale invariance established, group comparisons were made. The raw average
scale scores for the affective scales are presented in Table 3. The anxiety, emotional satisfaction, and
intellectual accessibility were collected on a 0 to 100 sliding scale. The remaining scales were on a 5
point Likert-type scale.
Table 3: Raw averages for the affective scales 535
Anx ES IA II-F II-V U EU OE Hands-On 32.71 72.28 66.10 3.76 4.32 3.78 4.21 3.54
Virtual 35.68 60.33 57.80 3.69 4.23 3.47 3.75 3.54 Anx: anxiety, ES: emotional satisfaction, IA: intellectual accessibility, II-F: initial interest-feeling, II-V: initial interest-value, U: usefulness of lab, EU: equipment usability, OE: open-endedness of lab
A MANOVA was performed to compare groups using the average scores of the individual scales
after checking the assumptions for a MANOVA. The first four assumptions are a function of the study 540
design. All scales chosen were either Likert-type or continuous scales and as such were treated as
interval data. It is appropriate to treat composite scores from Likert-type scales as interval data
whereas individual item scores should be treated as ordinal data as the differences between responses
options are unequal.73 Students completed the experiment in only one environment and thus there
were independent groups. As students can randomly enroll in whichever section fit their schedule 545
best, there were also independent observations within each group. Additionally, a chi-square test
found no statistically significant difference for gender, race, or age between students in the two
environments. There were 396 students in the data set, which is a sufficient sample size to conduct
the MANOVA.
The last five assumptions are not a function of the study design and need to be checked 550
statistically. Multivariate outliers were tested for using Mahalanobis distance.74 This is a measure of
the distance between two points in multivariate space and is used to find rare combinations of
variables. For example, students who responded they were simultaneously anxious and comfortable.
There were six multivariate outliers found that were above the chi-square value of 26.13 and all six
completed the virtual experiment. These six data points were removed before further analysis took 555
place. Multivariate normality was not directly assessed, however, the normality of each scale was
evaluated using the skewness and kurtosis values. The skewness for initial interest-value and

Journal of Chemical Education 1/2/21 Page 22 of 31
equipment usability were both below the generally accepted cutoff for normal data of negative one.75
All other values were within the range of negative one to positive one. A MANOVA is robust to
skewness76 and therefore it is still possible to analyze the data with the skewness in the two scales. To 560
test if there was a linear relationship between groups for each scale, scatterplots by group for each
scale were analyzed and there was a linear trend in the scatterplot for all scales. Homoscedasticity is
measured to ensure students in both environments had similar variances on the affective scales.
Homoscedasticity was assessed through Levene’s test and it was found that the scales intellectual
accessibility, emotional satisfaction, usefulness of lab, equipment usability, and open-endedness of lab 565
all had a significant result indicating that the variances were different between groups of students.
Similarly to skewness, a MANOVA is robust to homoscedasticity violations and can still be conducted.
Lastly, the variance inflation factor (VIF) was tested and all scales had a value greater than one and
less than ten, which means that there was no multicollinearity. Multicollinearity is measured to
ensure that no two variables are so highly correlated that they are essentially measuring the same 570
construct.
The results of the MANOVA indicated that there were significantly lower averages on emotional
satisfaction, intellectual accessibility, usefulness of lab, and equipment usability for the virtual
students. The emotional satisfaction and equipment usability scale score differences had a medium
effect size, as measured by partial eta squared77, while the differences in intellectual accessibility and 575
usefulness of lab scale scores had small effect sizes. The significant differences are represented in bold
in Table 4 and the full MANOVA results can be found in the Supporting Information. No statistical
difference between groups was detected for initial interest-feeling, initial interest-value, anxiety, or
open-endedness of lab and as such, these scales were not included in further analyses.
Table 4: Significance and effect size of the group mean differences 580
p-value Effect Size Anxiety 0.237 0.004 (small)
Emotional Satisfaction <0.001 0.049 (medium) Intellectual Accessibility 0.001 0.027 (small)
Initial Interest-Feeling 0.466 0.001 (small) Initial Interest- Value 0.238 0.004 (small)
Usefulness of Lab 0.001 0.028 (small)

Journal of Chemical Education 1/2/21 Page 23 of 31
Equipment Usability <0.001 0.056 (medium) Open-endedness of Lab 0.971 0.000 (small)
While the initial MANOVA revealed significant differences between environments, there were 14
graduate TAs in charge of teaching the laboratory and the differences detected could be the result of
an instructor-effect and not necessarily reflective of the environment itself. To investigate for this
possibility, the students’ scale scores were plotted by which TA taught their section, an example is
seen in Figure 3. While it would be possible to conduct a MANOVA with posthoc tests to determine if 585
the averages by TA were statistically different from each other, the sample size by TA in this study do
not provide sufficient power to warrant such a test. Given this limitation, the data was examined
visually. Upon inspection, it was noted that students who completed the virtual experiment with TAs
numbered 11-14 (Figure 3) had a lower average for emotional satisfaction than those who completed
the virtual experiment with the other TAs (7-10). Therefore, it was possible that the differences in TAs 590
were influencing the significant differences found in the initial MANOVA. To test this, the data from
the sections taught by TAs 1-6 were grouped together (Hands-On), by TAs 7-10 were grouped together
(Virtual Group A), and by TAs 11-14 were grouped together (Virtual Group B). The MANOVA was rerun
with three groups instead of two to determine if an instructor-effect was leading to the differences
between environments. 595
Figure 3: Average emotional satisfaction for each TAs sections.

Journal of Chemical Education 1/2/21 Page 24 of 31
Instructor Effect As each group had a sufficient sample size for use of Bonferroni corrections as the posthoc
test, it was possible to compare the three groups to determine if the visual grouping was meaningful.
Virtual Group A and Virtual Group B were compared and significant differences in the emotional 600
satisfaction, usefulness of lab, and equipment usability scales were found (Table 5). These differences
support the groupings of TAs, although it should be noted that there was no significant difference
between the groups for the intellectual accessibility scale. These two groups were then compared
separately with the Hands-On group to determine if splitting the virtual TAs changed the initial
findings that virtual students had lower averages on the emotional satisfaction, intellectual 605
accessibility, usefulness of lab, and equipment usability scales. When Virtual Group A was compared
with the Hands-On group, no significant difference was found for any of the affective constructs (Table
5). However, there was a significant difference for all four scales when Virtual Group B was compared
with the Hands-On group. These results suggest an instructor effect is present since the findings were
not consistent when each virtual group was separately compared with the Hands-On group. 610
Table 5: p-values for posthoc comparisons between groups. Emotional
Satisfaction Intellectual Accessibility
Usefulness of Lab
Equipment Usability
Virtual Group A-Virtual Group B 0.005 0.336 0.006 0.002 Hands-On-Virtual Group A 0.160 0.214 0.883 0.119 Hands-On Virtual Group B <0.001 0.001 <0.001 <0.001
DISCUSSION With an increase in the use of alternative laboratory environments, it is important to measure
differences that exist between the alternative and traditional hands-on environments. However, there 615
has been a lack of affective instruments that have been designed or modified for the laboratory
environment to measure these differences. Therefore, an anxiety scale adapted from the CLAI and
ASCI, the emotional satisfaction and intellectual accessibility scales from the ASCI, the initial interest-
feeling and initial interest-value scales, and the usefulness of lab scale from the VPEQ were modified
for the laboratory environment and the psychometric properties were tested. All scales had acceptable 620
fit indices after modification and measurement invariance was established, as noted in Tables 1 and 2.

Journal of Chemical Education 1/2/21 Page 25 of 31
The three-factor model of anxiety, emotional satisfaction, and intellectual accessibility and the two-
factor model of initial interest-feeling and initial interest-value had acceptable fit and produced
correlations that were similar to previously reported values. The scales for open-endedness of lab and
equipment usability were not tested with factor models as they had too few items but were included 625
when running the MANOVA. With all scales functioning as intended and measurement invariance
established, the group means were compared to determine what affective differences may exist
between environments.
The students who completed the virtual Beer’s Law experiment had a higher average anxiety
score and lower averages on all other affective aspects. These findings were in agreement with previous 630
research23 that found students experience less favorable affective outcomes when completing a virtual
chemistry experiment in the LearnSmart environment as compared with the traditional hands-on
environment. However, when instructor effect was accounted for in the present study, the results were
split. No significant differences were detected between the scale scores of students in the traditional
hands-on environment and students who completed the experiment in the virtual environment with a 635
TA in group A (Hands-On-Virtual Group A in Table 5). However, all four scales showed a significant
difference when the same comparison was made between students in the traditional hands-on
environment and students who had a TA in Virtual Group B (Hands-On-Virtual Group B in Table 5).
This instructor effect indicates that which TA the students had may be a more decisive factor in their
scores on the affect constructs measured than which environment they completed the experiment in. 640
One possible explanation for the difference seen in students’ affective scores could be due to
the TAs prior teaching experience. One TA in the Hands-On group, one TA in Virtual Group A, and
three TAs in virtual group B were all teaching laboratories for the first time at this institution. It was
possible that the added burden of teaching in a new environment, while still becoming generally
comfortable with teaching, could have negatively impacted their section. If the virtual experiment took 645
place after these TAs had gained additional teaching experience, it is possible that the difference
between TAs would have been smaller.

Journal of Chemical Education 1/2/21 Page 26 of 31
CONCLUSIONS Although previous research on virtual chemistry laboratories has indicated no statistical
differences in cognitive and psychomotor outcomes, little research had been presented on affective 650
differences. Therefore, this research adapted and modified existing affective scales for the chemistry
laboratory and administered them to students conducting a virtual Beer’s law experiment and a
traditional hands-on version of the experiment. The scales were tested for the laboratory environment
context to ensure they were functioning as intended in the new context. Evidence for the response
process validity was provided by student interviews. All scales produced acceptable fit indices when 655
tested with a single-factor, congeneric, CFA model, which supports structural validity. Internal
consistency reliability of the scales was supported with acceptable McDonald’s omega values. This
evidence provides support that it is possible to modify existing affective measures that have been
designed for, and tested in, the classroom setting and apply them to the laboratory setting. With
functioning affective scales for the laboratory, future studies can increase the body of literature on 660
affective laboratory outcomes.
The functional scales were used to determine what differences in affective constructs may exist
between a virtual experiment and a hands-on experiment. After controlling for instructor-effect,
statistical differences were split based on which TA the students had. It is possible that the TA’s
comfort level with teaching the experiment in the environment they were assigned to impacted the 665
students’ affective aspects in the laboratory. With previous studies finding no difference in the
cognitive and psychomotor domain and this study finding split differences in the affective domain
when controlling for instructor effect, laboratory coordinators have evidence that seeking an
alternative environment may not significantly harm their student outcomes for this particular
experiment. However, the possibility of an instructor-effect should be taken into consideration when 670
considering how students react to an alternative environment.
Recently, there has been a call for future studies to better understand the impact laboratories
have on student learning.78 Future work should be conducted to examine the effect that a TA has on
the student’s experience. With a lack of uniform TA training or experience, it is possible that students
completing identical experiments with a different TA may have drastically different experiences and 675
Journal of Chemical Education 1/2/21 Page 27 of 31
outcomes. The best practices for training TAs are not well understood79 and future research should
investigate how the instructor-effect can be mitigated through rigorous TA training programs. In this
study, these differences were found to impact affective outcomes more than the environment the
students completed the experiment in.
CONSIDERATIONS FOR FUTURE RESEARCH 680 Knowing that there is an instructor effect present in this study, and possibly other studies, on
the chemistry laboratory, future research should aim to control for instructor effects as much as
possible. Suggestions include increasing the length of training time around the virtual experiment
and/or qualitatively observing each classroom to make note of possible differences between TAs.
Although it is difficult to ensure different instructors are equal across sections, taking steps early in 685
the research process to control for the possible differences will allow for clarity on if any findings are
due to the intervention or the instructor.
LIMITATIONS While split differences between environments were found in this specific context, the results
should not be generalized to other contexts without further testing. The traditional hands-on 690
experiment the students completed was a confirmatory lab in nature and the results may be different
from an inquiry-based, project-based, or other types of hands-on curricula. The virtual experiment
was completed using a modified procedure in the LearnSmart Labs and the results may be different if
a different virtual environment is used. The research took place at Portland State University, a non-
traditional urban university in the Pacific Northwest, and the results may be different at different 695
institutions. Future work should focus on testing affective differences between environments in a wide
range of contexts to determine how generalizable these findings are.
Additionally, although the students enrolled randomly in sections and did not know which
environment or TA they would have at the time of registration, it is still possible that a larger portion of
students with negative attitudes towards chemistry enrolled in the four virtual sections with less 700
favorable affective aspects. ‘Initial interest’ was measured to attempt to capture this difference but may
not have adequately captured all incoming differences. As such, it would not be appropriate to use the
modified and newly created affective scales to make conclusions about individual TA effectiveness.

Journal of Chemical Education 1/2/21 Page 28 of 31
There are many factors that could influence the differences seen and it is possible that those factors
could be outside of the TAs control. Lastly, the analysis was conducted by combining sections to have 705
enough power to detect differences between environments, which leaves the possibility that the
findings are not representative of an individual’s experience as there may be differences between
environments for individual students that were not captured when the data was aggregated.
ASSOCIATED CONTENT Supporting Information 710
The Supporting Information is available on the ACS Publications website at DOI:
10.1021/acs.jchemed.XXXXXXX. Administered survey items, initial MANOVA results, and scale
scores by TA group.
AUTHOR INFORMATION Corresponding Author 715
*E-mail: [email protected]
ACKNOWLEDGMENTS We would like to thank the graduate teaching assistants, students, the laboratory coordinator,
and stockroom staff that were involved with this work. Without all of them, this study would not have
been possible. Additionally, we would like to thank McGraw-Hill Education who generously allowed us 720
to use the LearnSmart Labs platform for this work.
REFERENCES 1. Seaman, J. E.; Allen, I. E.; Seaman, J., Grade Increase: Tracking Distance Education in the United States. Babson Survey Research Group 2018, http://www.onlinelearningsurvey.com/highered.html (accessed July 2019). 725 2. Committee on Professional Training Undergraduate Professional Education in Chemistry: ACS Guidelines and Evaluation Procedures for Bachelor’s Degree Programs; American Chemical Society Washington, DC: 2015. 3. Kennepohl, D., Using home-laboratory kits to teach general chemistry. Chem. Educ. Res. Pract. 2007, 8 (3), 337-346. 730 4. Hoole, D.; Sithambaresan, M., Analytical chemistry labs with kits and CD-based instructions as teaching aids for distance learning. J. Chem. Educ. 2003, 80 (11), 1308-1310. 5. Boschmann, E., Teaching chemistry via distance education. J. Chem. Educ. 2003, 80 (6), 704-708. 6. Ma, J.; Nickerson, J. V., Hands-on, simulated, and remote laboratories: A comparative literature review. ACM Computing Surveys (CSUR) 2006, 38 (3), 1-24. 735 7. Herranz, J.; Carro, G.; Contreras, A.; Camacho, E. M.; Garcia-Loro, F.; Gil, M. C. In From a Hands-on Chemistry Lab to a Remote Chemistry Lab: Challenges and Constrains, Online Engineering & Internet of Things, Columbia University, Auer, M.; Zutin, D., Eds. Springer:New York, pp 125-131. 8. Perkins, K.; Adams, W.; Dubson, M.; Finkelstein, N.; Reid, S.; Wieman, C.; LeMaster, R., PhET: Interactive simulations for teaching and learning physics. The physics teacher 2006, 44 (1), 18-23. 740

Journal of Chemical Education 1/2/21 Page 29 of 31
9. Clark, T. M.; Chamberlain, J. M., Use of a PhET interactive simulation in general chemistry laboratory: Models of the hydrogen atom. J. Chem. Educ. 2014, 91 (8), 1198-1202. 10. Winkelmann, K.; Keeney-Kennicutt, W.; Fowler, D.; Macik, M., Development, Implementation, and Assessment of General Chemistry Lab Experiments Performed in the Virtual World of Second Life. J. Chem. Educ. 2017, 94 (7), 849-858. 745 11. Winkelmann, K.; Scott, M.; Wong, D., A study of high school students’ performance of a chemistry experiment within the virtual world of second life. J. Chem. Educ. 2014, 91 (9), 1432-1438. 12. Reece, A. J.; Butler, M. B., Virtually the Same: A Comparison of STEM Students Content Knowledge, Course Performance, and Motivation to Learn in Virtual and Face-to-Face Introductory Biology Laboratories. Journal of College Science Teaching 2017, 46 (3), 83-89. 750 13. Woodfield, B. F.; Andrus, M. B.; Andersen, T.; Miller, J.; Simmons, B.; Stanger, R.; Waddoups, G. L.; Moore, M. S.; Swan, R.; Allen, R., The virtual ChemLab project: A realistic and sophisticated simulation of organic synthesis and organic qualitative analysis. J. Chem. Educ. 2005, 82 (11), 1728-1735. 14. Woodfield, B. F.; Catlin, H. R.; Waddoups, G. L.; Moore, M. S.; Swan, R.; Allen, R.; Bodily, G., The virtual ChemLab project: a realistic and sophisticated simulation of inorganic qualitative analysis. J. Chem. Educ. 2004, 755 81 (11), 1672-1678. 15. Hawkins, I.; Phelps, A. J., Virtual laboratory vs. traditional laboratory: Which is more effective for teaching electrochemistry? Chem. Educ. Res. Pract. 2013, 14 (4), 516-523. 16. Bloom, B. S.; Engelhart, M. D.; Furst, E. J.; Hill, W. H.; Krathwohl, D. R., Taxonomy of educational objectives, handbook I: The cognitive domain. David McKay: New York, 1956. 760 17. Simpson, E., Educational Objectives in the Psychomotor Domain. In Behavioral Objectives in Curriculum Development: Selected Readings and Bibliography, Educational Technology Publications: New Jersey, 1971. 18. Krathwohl, D. R.; Bloom, B. S.; Masia, B. B., Taxonomy of educational objectives, handbook ii: Affective domain. New York: David McKay Company. Inc. ISBN 0-679-30210-7, 0-582-32385 1964, 1. 19. Hunt, W. C. Teaching and Learning in the Affective Domain: A Review of the Literature; Washington 765 Office of the State Superintendent of Public Instruction: Olympia, WA, 1987. 20. Hofstein, A., The role of laboratory in science teaching and learning. In Sci. Educ., Springer: 2017; pp 357-368. 21. Pyatt, K.; Sims, R., Virtual and physical experimentation in inquiry-based science labs: Attitudes, performance and access. J. Sci. Educ. Technol. 2012, 21 (1), 133-147. 770 22. Grant, D. A., The latin square principle in the design and analysis of psychological experiments. Psychol. Bull. 1948, 45 (5), 427-442. 23. Enneking, K. M.; Breitenstein, G. R.; Coleman, A. F.; Reeves, J. H.; Wang, Y.; Grove, N. P., The Evaluation of a Hybrid, General Chemistry Laboratory Curriculum: Impact on Students’ Cognitive, Affective, and Psychomotor Learning. J. Chem. Educ. 2019, 96 (6), 1058-1067. 775 24. Johnstone, A. H., Macro- and micro-chemistry. School Science Review 1982, (64), 377-379. 25. Irby, S. M.; Borda, E. J.; Haupt, J., Effects of Implementing a Hybrid Wet Lab and Online Module Lab Curriculum into a General Chemistry Course: Impacts on Student Performance and Engagement with the Chemistry Triplet. J. Chem. Educ. 2017, 95 (2), 224-232. 26. Mack, M. R.; Hensen, C.; Barbera, J., Metrics and Methods Used To Compare Student Performance Data 780 in Chemistry Education Research Articles. J. Chem. Educ. 2019, 96 (3), 401-413. 27. Chatterjee, S.; Williamson, V. M.; McCann, K.; Peck, M. L., Surveying students' attitudes and perceptions toward guided-inquiry and open-inquiry laboratories. J. Chem. Educ. 2009, 86 (12), 1427-1432. 28. Lang, A. S.; Bradley, J.-C., Chemistry in second life. Chem. Cent. J. 2009, 3 (1), 14. 29. Murray-Rust, P., Chemistry for everyone. Nature 2008, 451 (7179), 648-651. 785 30. Casanova, R. S.; Civelli, J. L.; Kimbrough, D. R.; Heath, B. P.; Reeves, J. H., Distance learning: A viable alternative to the conventional lecture-lab format in general chemistry. J. Chem. Educ. 2006, 83 (3), 501-507. 31. Sonnenwald, D. H.; Whitton, M. C.; Maglaughlin, K. L., Evaluating a scientific collaboratory: Results of a controlled experiment. ACM Trans Comput Hum Interact 2003, 10 (2), 150-176. 32. Scanlon, E.; Colwell, C.; Cooper, M.; Di Paolo, T., Remote experiments, re-versioning and re-thinking 790 science learning. Comput. Educ. 2004, 43 (1-2), 153-163. 33. Corter, J. E.; Esche, S. K.; Chassapis, C.; Ma, J.; Nickerson, J. V., Process and learning outcomes from remotely-operated, simulated, and hands-on student laboratories. Comput. Educ. 2011, 57 (3), 2054-2067.

Journal of Chemical Education 1/2/21 Page 30 of 31
34. Kennepohl, D.; Baran, J.; Currie, R., Remote instrumentation for the teaching laboratory. J. Chem. Educ. 2004, 81 (12), 1814-1816. 795 35. National Research Council, Discipline-based education research: Understanding and improving learning in undergraduate science and engineering. 2012, National Academies Press: Washington, DC, https://doi.org/10.17226/13362 (accessed July 2019). 36. Galloway, K. R.; Bretz, S. L., Development of an assessment tool to measure students’ meaningful learning in the undergraduate chemistry laboratory. J. Chem. Educ. 2015, 92 (7), 1149-1158. 800 37. Galloway, K. R.; Bretz, S. L., Measuring meaningful learning in the undergraduate general chemistry and organic chemistry laboratories: a longitudinal study. J. Chem. Educ. 2015, 92 (12), 2019-2030. 38. Schmidt-McCormack, J. A.; Muniz, M. N.; Keuter, E. C.; Shaw, S. K.; Cole, R. S., Design and implementation of instructional videos for upper-division undergraduate laboratory courses. Chem. Educ. Res. Pract. 2017, 18 (4), 749-762. 805 39. Flaherty, A.; O’Dwyer, A.; Mannix-McNamara, P.; Leahy, J., Evaluating the Impact of the “Teaching as a Chemistry Laboratory Graduate Teaching Assistant” Program on Cognitive and Psychomotor Verbal Interactions in the Laboratory. J. Chem. Educ. 2017, 94 (12), 1831-1843. 40. Galloway, K. R.; Bretz, S. L., Using cluster analysis to characterize meaningful learning in a first-year university chemistry laboratory course. Chem. Educ. Res. Pract. 2015, 16 (4), 879-892. 810 41. Bowen, C. W., Development and score validation of a chemistry laboratory anxiety instrument (CLAI) for college chemistry students. Educ. Psychol. Meas. 1999, 59 (1), 171-185. 42. Cooper, M. M.; Sandi-Urena, S., Design and validation of an instrument to assess metacognitive skillfulness in chemistry problem solving. J. Chem. Educ. 2009, 86 (2), 240-245. 43. Grove, N.; Bretz, S. L., CHEMX: An instrument to assess students' cognitive expectations for learning 815 chemistry. J. Chem. Educ. 2007, 84 (9), 1524-1529. 44. Bauer, C. F., Beyond "student attitudes": Chemistry self-concept inventory for assessment of the affective component of student learning. J. Chem. Educ. 2005, 82 (12), 1864-1870. 45. Bauer, C. F., Attitude toward chemistry: a semantic differential instrument for assessing curriculum impacts. J. Chem. Educ. 2008, 85 (10), 1440-1445. 820 46. Xu, X.; Lewis, J. E., Refinement of a chemistry attitude measure for college students. J. Chem. Educ. 2011, 88 (5), 561-568. 47. Adams, W. K.; Wieman, C. E.; Perkins, K. K.; Barbera, J., Modifying and validating the Colorado Learning Attitudes about Science Survey for use in chemistry. J. Chem. Educ. 2008, 85 (10), 1435-1439. 48. Liu, Y.; Ferrell, B.; Barbera, J.; Lewis, J. E., Development and evaluation of a chemistry-specific version 825 of the academic motivation scale (AMS-Chemistry). Chem. Educ. Res. Pract. 2017, 18 (1), 191-213. 49. Furr, R. M., Psychometrics: an introduction. Sage Publications: Thousand Oaks, CA, 2017. 50. Arjoon, J. A.; Xu, X.; Lewis, J. E., Understanding the state of the art for measurement in chemistry education research: Examining the psychometric evidence. J. Chem. Educ. 2013, 90 (5), 536-545. 51. Barbera, J.; VandenPlas, J., All assessment materials are not created equal: the myths about instrument 830 development, validity, and reliability. In Investigating classroom myths through research on teaching and learning, 2011; Vol. 1074, pp 177-193. 52. Schwartz, P.; Barbera, J., Evaluating the content and response process validity of data from the chemical concepts inventory. J. Chem. Educ. 2014, 91 (5), 630-640. 53. Milfont, T. L.; Fischer, R., Testing measurement invariance across groups: Applications in cross-cultural 835 research. Int. J. Psychol. Res. 2010, 3 (1), 111-130. 54. Mack, M. R.; Hensen, C.; Barbera, J., Metrics and Methods Used To Compare Student Performance Data in Chemistry Education Research Articles. J. Chem. Educ. 96 (3), 401-413. 55. Anderson, L. W.; Bourke, S. F., Assessing affective characteristics in the schools. Routledge: 1981. 56. Ferrell, B.; Barbera, J., Analysis of students' self-efficacy, interest, and effort beliefs in general chemistry. 840 Chem. Educ. Res. Pract. 2015, 16 (2), 318-337. 57. Chan, J. Y.; Bauer, C. F., Effect of peer-led team learning (PLTL) on student achievement, attitude, and self-concept in college general chemistry in randomized and quasi experimental designs. JRST 2015, 52 (3), 319-346. 58. Mooring, S. R.; Mitchell, C. E.; Burrows, N. L., Evaluation of a Flipped, Large-Enrollment Organic 845 Chemistry Course on Student Attitude and Achievement. J. Chem. Educ. 2016, 93 (12), 1972-1983.
Journal of Chemical Education 1/2/21 Page 31 of 31
59. Vishnumolakala, V. R.; Southam, D. C.; Treagust, D. F.; Mocerino, M.; Qureshi, S., Students’ attitudes, self-efficacy and experiences in a modified process-oriented guided inquiry learning undergraduate chemistry classroom. Chem. Educ. Res. Pract. 2017, 18 (2), 340-352. 60. Heise, D. R., The semantic differential and attitude research. Attitude measurement 1970, 4, 235-253. 850 61. Ferrell, B.; Phillips, M. M.; Barbera, J., Connecting achievement motivation to performance in general chemistry. Chem. Educ. Res. Pract. 2016, 17 (4), 1054-1066. 62. Harackiewicz, J. M.; Durik, A. M.; Barron, K. E.; Linnenbrink-Garcia, L.; Tauer, J. M., The role of achievement goals in the development of interest: Reciprocal relations between achievement goals, interest, and performance. J. Educ. Psychol. 2008, 100 (1), 105-122. 855 63. American Educational Research Association; American Psychological Association; National Council on Measurement in Education; Joint Committee on Standards for Educational Psychological Testing, Standards for educational and psychological testing. Amer Educational Research Assn: 1999. 64. Rosseel, Y., Lavaan: An R package for structural equation modeling and more. Version 0.5–12 (BETA). J. Stat. Softw. 2012, 48 (2), 1-36. 860 65. Kurbanoglu, N. I.; Akim, A., The relationships between university students’ chemistry laboratory anxiety, attitudes, and self-efficacy beliefs. Aust. J. Teach. Educ. 2010, 35 (8), 48-59. 66. Hu, L. t.; Bentler, P. M., Cutoff criteria for fit indexes in covariance structure analysis: Conventional criteria versus new alternatives. Strct. Equ. Modeling 1999, 6 (1), 1-55. 67. Komperda, R.; Pentecost, T. C.; Barbera, J., Moving beyond Alpha: A Primer on Alternative Sources of 865 Single-Administration Reliability Evidence for Quantitative Chemistry Education Research. J. Chem. Educ. 2018, 95 (9), 1477-1491. 68. Cheung, G. W.; Rensvold, R. B., Evaluating goodness-of-fit indexes for testing measurement invariance. structural equation modeling a multidisciplinary journal 2002, 9 (2), 233-255. 69. Duncan, O. D., Introduction to structural equation models. Academic Press, Inc: New York, New York, 870 1975. 70. Kenny, D. A.; Kaniskan, B.; McCoach, D. B., The performance of RMSEA in models with small degrees of freedom. Sociol. Methods. Res. 2015, 44 (3), 486-507. 71. Cohen, J., A power primer. Psychol. Bull. 1992, 112 (1), 155-159. 72. Xu, X.; Villafane, S. M.; Lewis, J. E., College students’ attitudes toward chemistry, conceptual knowledge 875 and achievement: structural equation model analysis. Chem. Educ. Res. Pract. 2013, 14 (2), 188-200. 73. Boone, H. N.; Boone, D. A., Analyzing likert data. Journal of extension 2012, 50 (2), 1-5. 74. De Maesschalck, R.; Jouan-Rimbaud, D.; Massart, D. L., The mahalanobis distance. Chemometr. Intell. Lab. Syst. 2000, 50 (1), 1-18. 75. Potthast, M. J., Confirmatory factor analysis of ordered categorical variables with large models. Br. J. 880 Math. Stat. Psychol. 1993, 46 (2), 273-286. 76. Olson, C. L., Comparative robustness of six tests in multivariate analysis of variance. J. Am. Stat. Assoc. 1974, 69 (348), 894-908. 77. Richardson, J. T., Eta squared and partial eta squared as measures of effect size in educational research. Educ. Res. Rev. 2011, 6 (2), 135-147. 885 78. Bretz, S. L., Evidence for the Importance of Laboratory Courses. J. Chem. Educ. 2019, 96 (2), 193-195. 79. Reeves, T. D.; Marbach-Ad, G.; Miller, K. R.; Ridgway, J.; Gardner, G. E.; Schussler, E. E.; Wischusen, E. W., A conceptual framework for graduate teaching assistant professional development evaluation and research. CBE Life Sci. Educ. 2016, 15 (2), 1-9.
890