assessing and addressing farm worker food security and addressing farm worke… · assessing and...
TRANSCRIPT
ASSESSING AND ADDRESSING FARM WORKER FOOD SECURITY
YOLO COUNTY, 2015
Gail Wadsworth, Thea Rittenhouse and Sarah Cain March 2016
PO Box 1047
Davis, CA 95617-1047

Contents
Acknowledgements .............................................................................................................................................. 1
Executive Summary.............................................................................................................................................. 1
Introduction ............................................................................................................................................................ 2
Project Overview .............................................................................................................................................. 2
Barriers to Healthy Food Access for Farm Workers in Rural Regions ........................................ 4
Food Security Defined .................................................................................................................................... 6
How many people lived in food-insecure households in 2014? ................................................ 7
Food Insecurity in California ....................................................................................................................... 7
Food Insecurity among Latinos .................................................................................................................. 8
Food Insecurity among Farm workers .................................................................................................... 9
Barriers to Healthy Food Access among Farm workers ................................................................. 10
Methods ................................................................................................................................................................. 11
Choice of Study Location ............................................................................................................................ 11
Survey ................................................................................................................................................................ 12
Food Inventory ............................................................................................................................................... 13
Results .................................................................................................................................................................... 13
Farm worker Survey .................................................................................................................................... 13
Demographics ............................................................................................................................................ 13
Farm worker Food Security Summary ............................................................................................. 15
Knowledge of Food Assistance Programs ....................................................................................... 18
Nutrition/ Common Foods ........................................................................................................................ 23
Food Program Assessment ........................................................................................................................ 28
Physical Access: ......................................................................................................................................... 28
RURAL FOOD DELIVERY ................................................................................................................................ 29
Cultural Access .......................................................................................................................................... 29
Preferences ................................................................................................................................................. 30
Discussion and Recommendations ............................................................................................................. 31
References ............................................................................................................................................................ 34
Appendices ........................................................................................................................................................... 36
Appendix I: Survey Instruments ............................................................................................................. 36
Farm Worker Food Security Survey-- English .............................................................................. 36
Entravista-- Espanol ................................................................................................................................ 43
Appendix II: Map showing % Latino distribution in Yolo County .............................................. 50
Appendix III: Food Bank Service Directory ......................................................................................... 52
FOOD BANK DISTRIBUTION CHAIN ............................................................................................ 52
DONORS ..................................................................................................................................................... 52
FOOD BANK WAREHOUSE ................................................................................................................. 52
WEEKLY DISTRIBUTIONS ..................................................................................................................... 54
BI-MONTHLY DISTRIBUTIONS ........................................................................................................... 55
Appendix IV: Compiled Quarterly Inventories of Fresh Fruits and Vegetables .................... 59
End Notes ..................................................................................................................................................... 60
List of Tables and Figures Figure 1 Yolo County ........................................................................................................................................... 2
Figure 2 Food Desert in UC 2011 Report ..................................................................................................... 3
Figure 3 Low Access at 1 and 10 miles ......................................................................................................... 4
Figure 4 US trends in food insecurity over time ....................................................................................... 6
Figure 5 Food Security in USA—USDA ERS ................................................................................................ 7
Figure 6 Food Security over Time, State of CA – CHIS ............................................................................ 8
Figure 7 Latino Food Security over Time, CA-- CHIS............................................................................... 8
Figure 8 RENTAL COSTS IN YOLO COUNTY ........................................................................................... 10
Figure 9 Work Type Reported by Participants ....................................................................................... 14
Figure 10 Location of Primary Residence in Yolo County .................................................................. 14
Figure 11 Yolo County showing Rural v Urban locations and Locations where interviewed
workers live.......................................................................................................................................................... 15
Figure 12 Frequency that Food Ran Out All Data .................................................................................. 16
Figure 13 Frequency Food Ran Out by Community ............................................................................. 16
Figure 14 Eaten Less? ....................................................................................................................................... 17
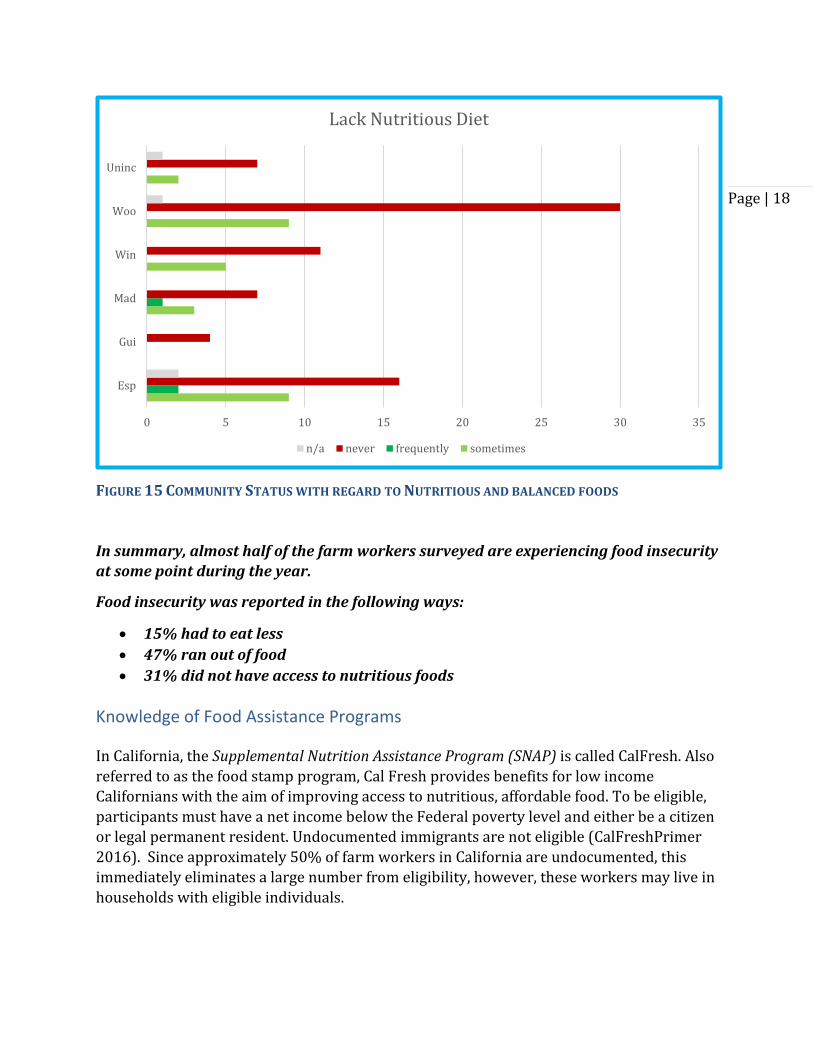
Figure 15 Community Status with regard to Nutritious and balanced foods ............................. 18
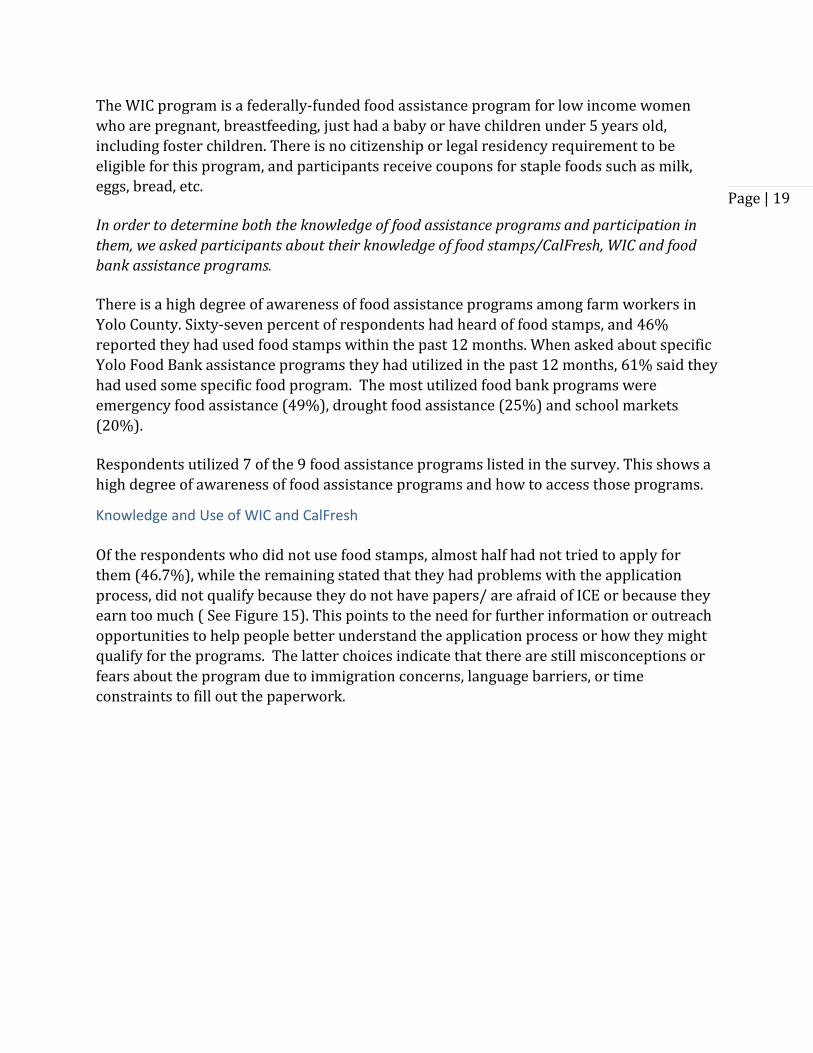
Figure 16 Reasons for not using SNAP ...................................................................................................... 20
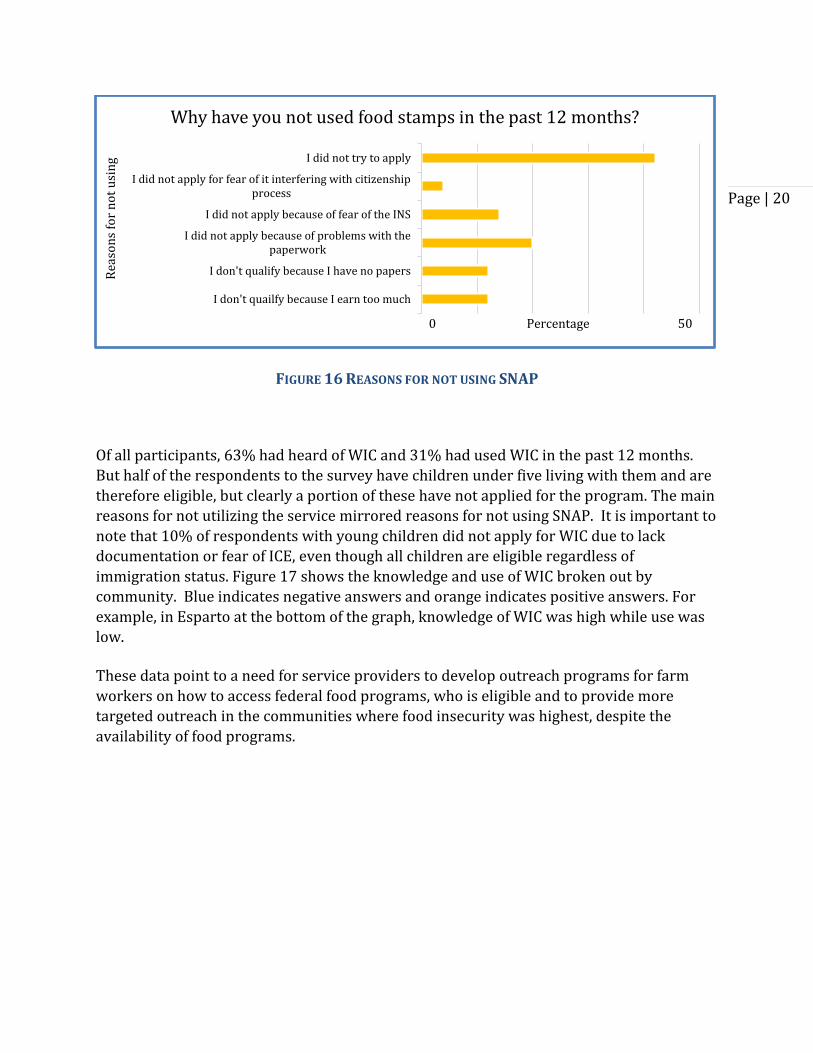
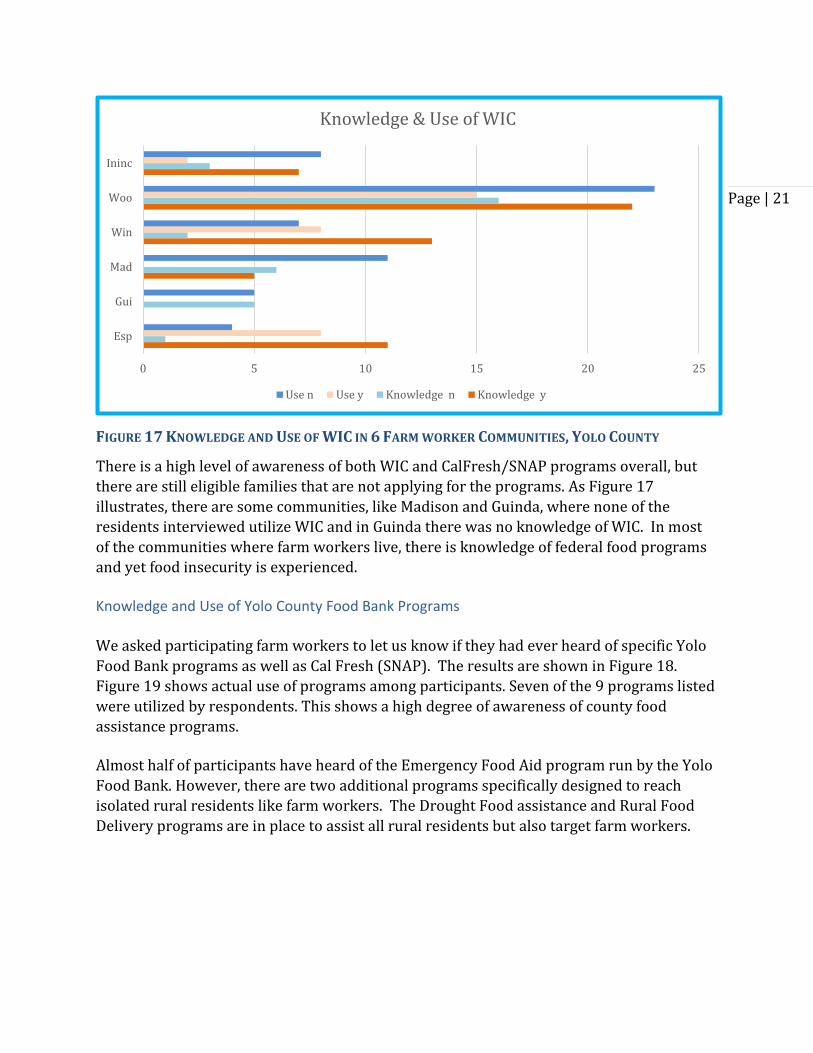
Figure 17 Knowledge and Use of WIC in 6 Farm worker Communities, Yolo County ............ 21
Figure 18 Percent of Participants who have Heard of Programs .................................................... 22
Figure 19 Use of SNAP and/or Food Bank Programs .......................................................................... 22
Figure 20 Fruit and Vegetable Purchases ................................................................................................. 24
Figure 21 Breakfast Items Eaten in Last 24 Hours ............................................................................... 25
Figure 22 Lunch Items Eaten in Last 24 Hours: Fruits and Vegetables ........................................ 25
Figure 23 Snacks Eaten in Last 24 Hours ................................................................................................. 26
Figure 24 Dinner Items Eaten in Last 24 Hours ..................................................................................... 27
Figure 25 Map showing low access at 1 and 10 miles, where interviewees live, and where
Yolo Food Bank programs deliver ............................................................................................................... 28
Figure 26 Fruit and Vegetable Preferences Ranked ............................................................................. 30
Figure 27 Preferences Availability at Yolo Food Bank ....................................................................... 31
Figure 28-- % Latino or Hispanic 2010 US Census ............................................................................... 50
Figure 29 Percent Poverty, Farm workers interviewed, Food Bank Programs ......................... 51
Page | 1
Acknowledgements Thanks to the farmers, agencies and organizations of Yolo County who were generous in
sharing their time and perspectives for this project.
Many thanks to the staff of the Yolo County Food Bank who allowed us access to their
facilities, even during very busy times. Especially to Kevin Sanchez, Executive Director, for
agreeing to partner on this study; and Corkey Mapalo, Director of Warehouse
Operations, and Misty O’Donnell, Assistant Warehouse Manager, for bearing with our
intrusions.
A great appreciation to RISE, Inc, Yolo County, Executive Director Tico Zendejas and staff
who assisted in administration of the farm worker surveys.
Gratitude to Peter Leiggi for many hours of work gathering data and for Arc GIS data
management and map generation.
Funding for this project was made available by the USDA National Institute for Food and
Agriculture.
Executive Summary
California Institute for Rural Studies assessed the food assistance resources in Yolo County
and the level of food insecurity among selected Yolo County farm workers living in a rural
food desert. The project was designed to address the USDA Community Food Projects
Competitive Grant Program priorities by determining the level of farm worker food
security and planning long-term solutions utilizing the existing network of food assistance
resources in Yolo County.
In 2000, the county estimated a population of 6,900 farm workers with 26,236 farm
worker related persons. For this project, we focused our efforts on farm worker families
living in rural communities in Yolo County and, using survey methodology, assessed their
level of food security. We also identified the current extent of farm worker participation in
food assistance programs. We created three food inventories: types of foods farm workers
prefer, actual fruit and vegetable consumption, and types of food offered by the Yolo Food
Bank. In this way we were able to determine where the gaps exist, and how to address
them to better serve farm worker communities. Based on our results, we offer guidance for
Page | 2
food programs in Yolo County regarding both optimal geographic locations for food
distribution to reach farm workers and the types of foods that are appropriate for this
population. This report outlines the level of food insecurity among rural farm workers in
Yolo County and includes a directory of food resources for the county, map of distribution
locations and suggestions for improving services specifically for farm workers.
Introduction Project Overview Ironically, the same agricultural workers who are responsible for producing an abundance
of food find themselves at serious risk of hunger, diet-related chronic diseases, unsafe
living and working conditions and inadequate access to health care. As a farm worker
interviewed for one of our recent projects noted, “I’m disappointed in this country, which is
supposed to be the best in the world. Here it’s not true that if you work hard you’ll have health
and housing. I’ve been working day and night, and no, in this country there is no health.”
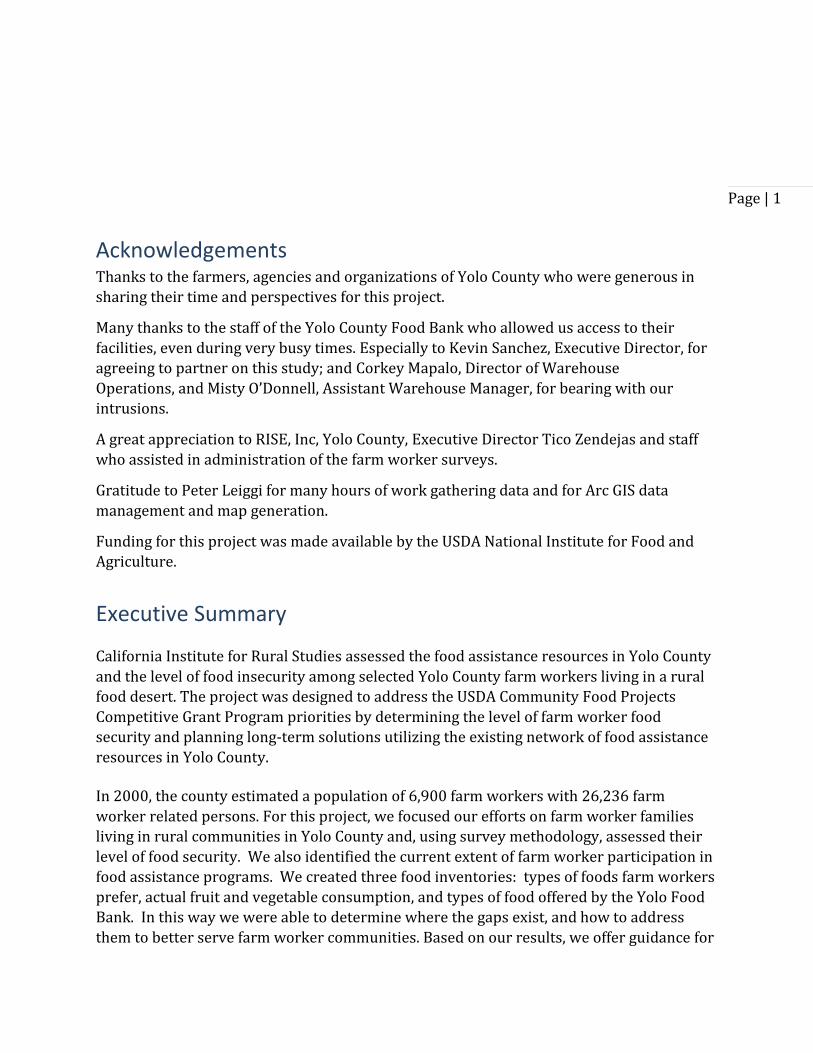
Yolo County is located in Northern
California just west of the capital of
Sacramento. Eighty-five percent of
the county is agricultural land and
that is how the residents like it.
Davis is the largest city in the
county with over 65,000
inhabitants and an on-campus
resident population close to 6,000.
For more than a century, the
University of California, Davis, has
been at the vanguard of agricultural
research and innovation. More than
30 international seed research
companies are headquartered in the
county. Out of the 58 counties in
California, Yolo is ranked 41st in the state by area but 20th for agricultural production. In
2014, the county’s agricultural gross production hit an all-time record high at
$801,205,000, and an increase of 11% from 2013 (Yolo Dept. of Ag 2016). A large
proportion of crops grown in Yolo County are specialty crops and organic production, both
requiring high labor inputs. County agriculture is very diverse with processing tomatoes,
wine grapes, dairy, nuts, berries, vegetable row crops, poultry, forage, nursery crops and
more. There are close to 1,000 farms, 91 of them are certified organic. In addition there are
six certified farmers markets, and 19 Community Supported Agriculture programs in the
FIGURE 1 YOLO COUNTY

Page | 3
county. Local general plans and land-use management practices are developed with the
goal of farmland preservation.
Additionally, Yolo County has a robust farm to school program, written into the Yolo
County general plan and managed by Yolo County Department of Agriculture since 2010.
Farm to school programs in the county bring more local fresh fruits and vegetables into
school cafeterias, build and plan school gardens, provide from scratch cooking lessons for
school cafeteria staff, and have been important in creating various nutrition education
programs, school wellness policies and obesity prevention programs. Yolo County farm to
school participating agencies and programs include; Davis Farm to School, Winters Farm to
School, UC Cooperative Extension, WIC
Nutrition with Obesity Prevention, Rural
Innovations Sustainable Enterprise and
Yolo Farm to Fork.
Even with all of these agricultural,
community and programmatic assets,
there is still food insecurity in Yolo
County at rates more than double both
the US average (14.5) and the California
average (15.6), hovering at 32% of adults
living in food insecure households. i Yolo
County has responded to this problem
with programs designed to increase food
access and affordability. The Yolo Food
Bank provides food to 25,000 residents a
month and distributes nearly 3 million pounds of food and grocery items annually to
residents in need of food assistance. They do this through a network of 60 non-profit
partners. More than 25% of the food provided is fresh produce. The food bank partners
with local farmers to source locally-grown fruits and vegetables.
In 2011, student researchers at UC Davis completed a project for the Yolo County Ag and
Food Alliance to determine the feasibility of creating a food hub in the county. ii While the
team did not feel confident that a food hub would succeed in Yolo County, they did compile
a large amount of data on the Yolo County food and agriculture system. In the process of
this project, they mapped Yolo County food deserts. Figure 2 shows the extent of the food
desert, located in rural Yolo County in purple as mapped in 2011. Many of the residents
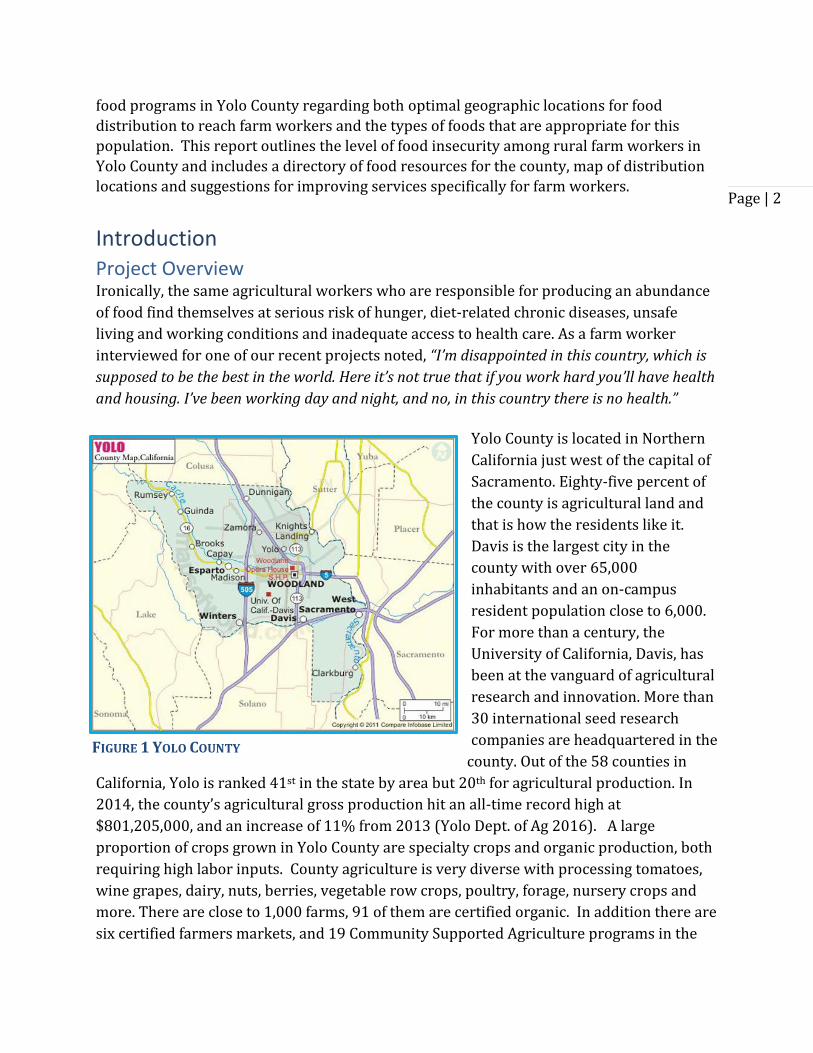
living within this area are farm workers. Figure 3 shows the USDA category “Low access at
1 and 10 miles” indicating distances to supermarkets: more than one mile in urban areas
and 10 miles in rural areas. The majority of Yolo County fits the low access definition.
FIGURE 2 FOOD DESERT IN UC 2011 REPORT
Page | 4
FIGURE 3 LOW ACCESS AT 1 AND 10 MILES
In 2000, Yolo County estimated a population of 6,900 farm workers with 26,236 farm
worker related persons.iii Because of the challenges of enumerating farm workers, the
range of population estimates for farm workers and their families is quite large in Yolo
County as is the case, nationally. Yolo County maintains two farm worker housing facilities
totaling 150 units for migrant farm worker families. At capacity, these housing centers can
house 805 individuals. The units are limited to use by families who reside more than 50
miles away for most of the year but come to the county to work in agriculture. As a result,
they are open for a maximum of six months. In addition to these known migrant farm
worker housing units, there are on-farm housing facilities in the county that can house an
estimated 506 farm employees. With the trend to year-round production of crops in
California, farm workers in the state are less migratory and tend to reside near their
workplaces year round. iv As a result of the lack of housing facilities for non-migrating
workers, most are now forced to live in private market dwellings and many of these are in
rural towns and cities in Yolo County.
Barriers to Healthy Food Access for Farm Workers in Rural Regions There are many barriers to healthy food access in rural communities, such as the food
desert described above. Our ongoing research at CIRS shows that food stamp utilization is
Page | 5
low among farm workers. Reasons given by farm workers for not applying for SNAP
include a perception of ineligibility, challenges to understanding the application processes
and fears about applying for public assistance related to documentation status. Young
single male farm workers who do not live in families may have limited cooking skills, may
not have access to kitchen facilities and thus may be more likely to eat processed or pre-
prepared meals. In the California Agricultural Worker Health Survey (CAWHS) CIRS
determined that a full 17% of farm workers lacked kitchen facilities where they lived. v
Farm workers suffer from disproportionately high rates of diet related diseases such as
diabetes, obesity, hypertension, and anemia. The CAWHS also found that 18% of male farm
workers had at least two of the three following risk factors for chronic disease: high serum
cholesterol, high blood pressure, or obesity. In addition, 81% of male and 76% of female
study subjects were overweight, with obesity rates of 28% and 37% respectively. Despite
the demanding physical nature of agricultural labor, in general, indicators for diet related
conditions among farm workers are worse than both the Latino and the general
populations of the US. Stanford University researchersvi found that for every five years of
residence in the US, male migrant workers in the Salinas Valley showed a 35% increase in
fast food consumption and a 50% increase in alcohol consumption. Over a ten year period,
the same researchers found the prevalence of obesity increased 47% among male farm
workers in general, and 91% for men living in migrant housing facilities. vii
In two previous CIRS studies of farm worker communities in California levels of food
insecurity were well above county, state and federal levels. In our first assessment, 45% of
the workers we interviewed in Fresno County were food insecure viii and in our second
assessment, 66% of the workers we interviewed in Salinas, Monterey County, were food
insecure. ix These studies were completed in two of the most productive agricultural
counties in the country. The Fresno County work was completed prior to the financial
downturn and the Monterey County study was completed in the midst of the financial
crisis.
In this project, CIRS assessed the food security of farm workers in Yolo County and their
access to food programs that already exist, using survey and mapping methods. Included in
the survey were questions focused on food access, use of food assistance programs,
barriers to use, and food preferences. In addition, CIRS compiled and reviewed data on
county based food programs to determine which ones reach farm workers and where gaps
may exist.
This report will explain the results of our farm worker survey and food bank inventory,
including recommendations for any potential improvements in the programs. This report
includes maps showing where farm workers interviewed live in relation to the service
areas of food programs. We have also created maps showing where Latinos live and where
people in poverty live in the county.
Page | 6
Based on all information collected, we have compiled a set of recommendations for
improving services to farm worker families living in the rural food desert of Yolo County.
These can be found beginning on page 30.
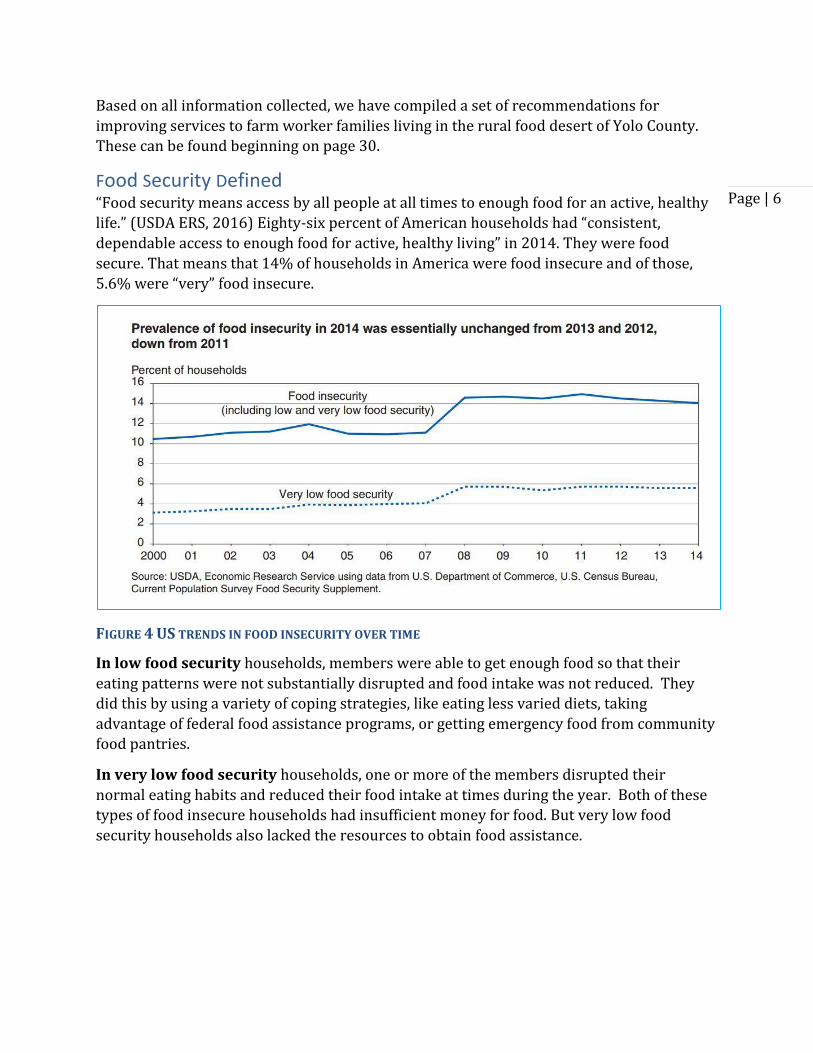
Food Security Defined “Food security means access by all people at all times to enough food for an active, healthy
life.” (USDA ERS, 2016) Eighty-six percent of American households had “consistent,
dependable access to enough food for active, healthy living” in 2014. They were food
secure. That means that 14% of households in America were food insecure and of those,
5.6% were “very” food insecure.
FIGURE 4 US TRENDS IN FOOD INSECURITY OVER TIME
In low food security households, members were able to get enough food so that their
eating patterns were not substantially disrupted and food intake was not reduced. They
did this by using a variety of coping strategies, like eating less varied diets, taking
advantage of federal food assistance programs, or getting emergency food from community
food pantries.
In very low food security households, one or more of the members disrupted their
normal eating habits and reduced their food intake at times during the year. Both of these
types of food insecure households had insufficient money for food. But very low food
security households also lacked the resources to obtain food assistance.
Page | 7
The leading risk factors associated with food insecurity include: earning an income below
the poverty level, living in a Hispanic or African-American household, and living in a female
headed household (Nord, Andrews et al. 2009)
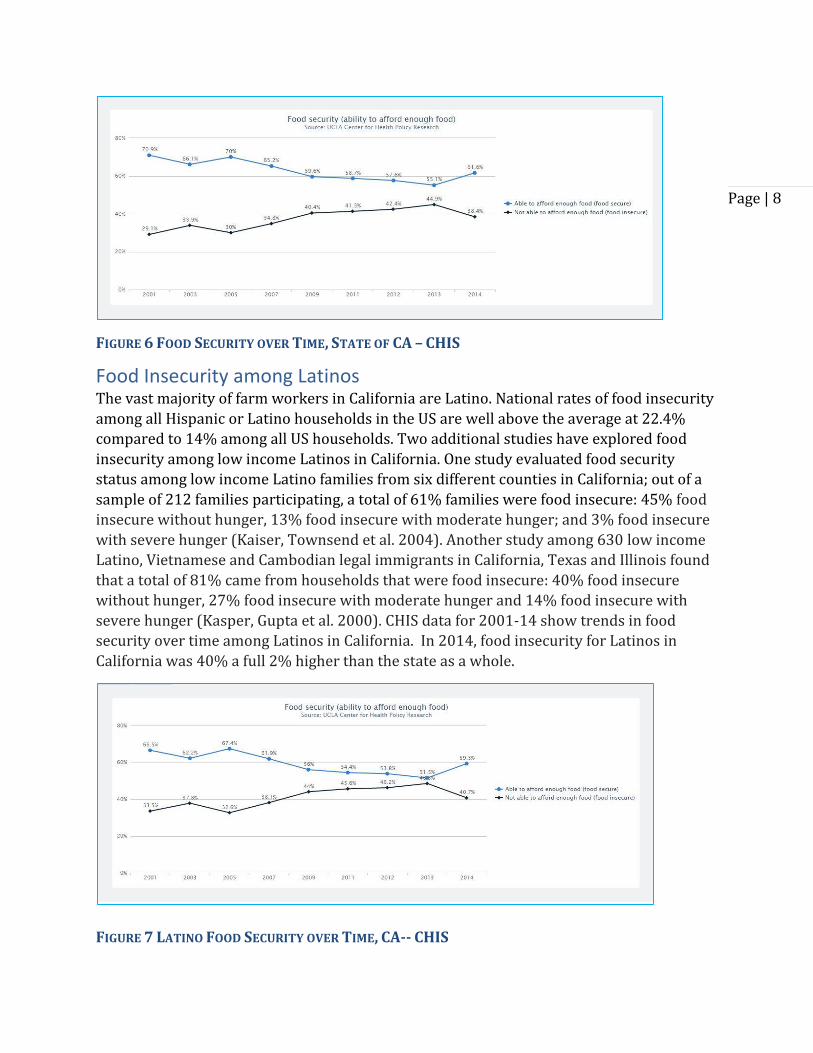
Food Insecurity in California It is ironic that in California—the state that leads the nation in food production -- the
prevalence of food insecurity is still about the national average at 13.5% (+ 0.65). Food
insecurity is disproportionately related to socioeconomic status, with high levels of food
insecurity occurring in low income populations. Approximately 4 million low income
Californians experienced food insecurity during 2011-12. While 38.4% of low income
California residents are food insecure only 18.1% currently receive SNAP benefits
(California Health Interview Survey).x
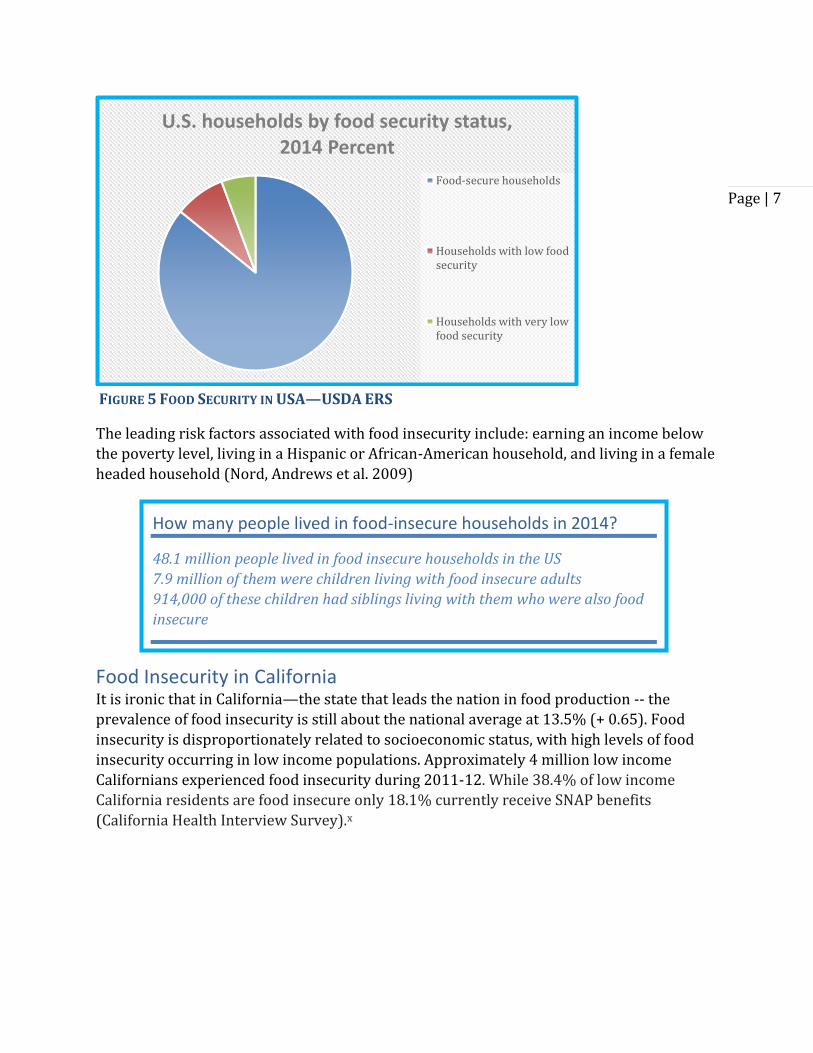
U.S. households by food security status, 2014 Percent
Food-secure households
Households with low foodsecurity
Households with very lowfood security
FIGURE 5 FOOD SECURITY IN USA—USDA ERS
How many people lived in food-insecure households in 2014?
48.1 million people lived in food insecure households in the US
7.9 million of them were children living with food insecure adults
914,000 of these children had siblings living with them who were also food
insecure
Page | 8
FIGURE 6 FOOD SECURITY OVER TIME, STATE OF CA – CHIS
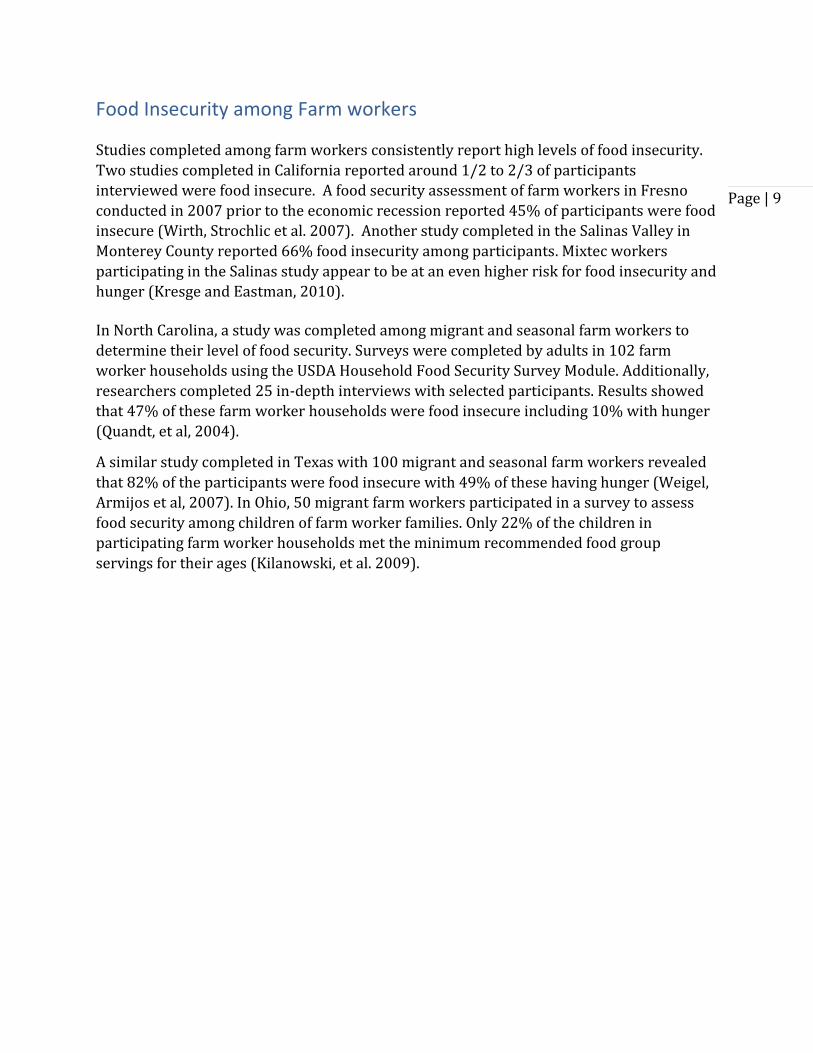
Food Insecurity among Latinos The vast majority of farm workers in California are Latino. National rates of food insecurity
among all Hispanic or Latino households in the US are well above the average at 22.4%
compared to 14% among all US households. Two additional studies have explored food
insecurity among low income Latinos in California. One study evaluated food security
status among low income Latino families from six different counties in California; out of a
sample of 212 families participating, a total of 61% families were food insecure: 45% food
insecure without hunger, 13% food insecure with moderate hunger; and 3% food insecure
with severe hunger (Kaiser, Townsend et al. 2004). Another study among 630 low income
Latino, Vietnamese and Cambodian legal immigrants in California, Texas and Illinois found
that a total of 81% came from households that were food insecure: 40% food insecure
without hunger, 27% food insecure with moderate hunger and 14% food insecure with
severe hunger (Kasper, Gupta et al. 2000). CHIS data for 2001-14 show trends in food
security over time among Latinos in California. In 2014, food insecurity for Latinos in
California was 40% a full 2% higher than the state as a whole.
FIGURE 7 LATINO FOOD SECURITY OVER TIME, CA-- CHIS
Page | 9
Food Insecurity among Farm workers
Studies completed among farm workers consistently report high levels of food insecurity.
Two studies completed in California reported around 1/2 to 2/3 of participants
interviewed were food insecure. A food security assessment of farm workers in Fresno
conducted in 2007 prior to the economic recession reported 45% of participants were food
insecure (Wirth, Strochlic et al. 2007). Another study completed in the Salinas Valley in
Monterey County reported 66% food insecurity among participants. Mixtec workers
participating in the Salinas study appear to be at an even higher risk for food insecurity and
hunger (Kresge and Eastman, 2010).
In North Carolina, a study was completed among migrant and seasonal farm workers to
determine their level of food security. Surveys were completed by adults in 102 farm
worker households using the USDA Household Food Security Survey Module. Additionally,
researchers completed 25 in-depth interviews with selected participants. Results showed
that 47% of these farm worker households were food insecure including 10% with hunger
(Quandt, et al, 2004).
A similar study completed in Texas with 100 migrant and seasonal farm workers revealed
that 82% of the participants were food insecure with 49% of these having hunger (Weigel,
Armijos et al, 2007). In Ohio, 50 migrant farm workers participated in a survey to assess
food security among children of farm worker families. Only 22% of the children in
participating farm worker households met the minimum recommended food group
servings for their ages (Kilanowski, et al. 2009).
Page | 10
Barriers to Healthy Food Access among Farm workers
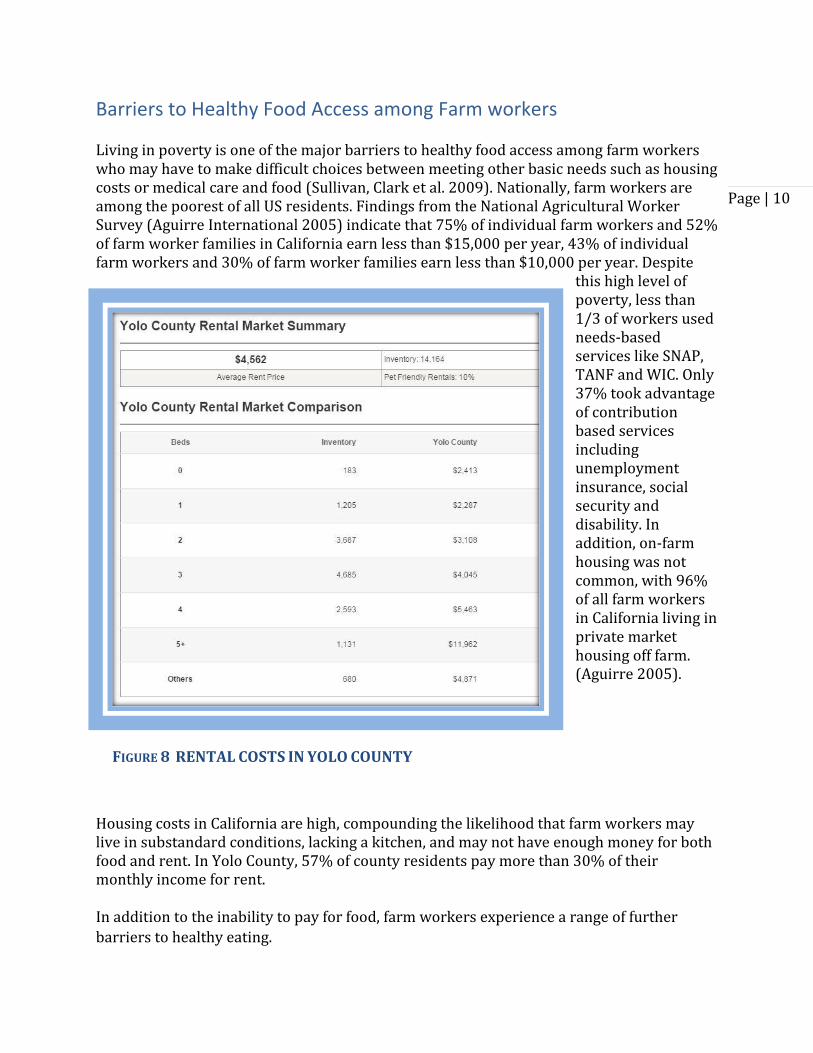
Living in poverty is one of the major barriers to healthy food access among farm workers who may have to make difficult choices between meeting other basic needs such as housing costs or medical care and food (Sullivan, Clark et al. 2009). Nationally, farm workers are among the poorest of all US residents. Findings from the National Agricultural Worker Survey (Aguirre International 2005) indicate that 75% of individual farm workers and 52% of farm worker families in California earn less than $15,000 per year, 43% of individual farm workers and 30% of farm worker families earn less than $10,000 per year. Despite
this high level of poverty, less than 1/3 of workers used needs-based services like SNAP, TANF and WIC. Only 37% took advantage of contribution based services including unemployment insurance, social security and disability. In addition, on-farm housing was not common, with 96% of all farm workers in California living in private market housing off farm. (Aguirre 2005).
Housing costs in California are high, compounding the likelihood that farm workers may live in substandard conditions, lacking a kitchen, and may not have enough money for both food and rent. In Yolo County, 57% of county residents pay more than 30% of their monthly income for rent.
In addition to the inability to pay for food, farm workers experience a range of further
barriers to healthy eating.
FIGURE 8 RENTAL COSTS IN YOLO COUNTY
Page | 11
These commonly include:
isolation in rural "food deserts"
unstable income and employment due to seasonal nature of work
inadequate housing and cooking facilities
lack of transportation
low utilization of food assistance programs
Non-utilization of assistance programs can be attributed to a lack of legal status (about half
of farm workers in CA are undocumented1), lack of understanding regarding eligibility for
programs, and seasonal income fluctuation. The data for this study’s population can be
seen in the results section below.
Methods
Choice of Study Location
Yolo County was selected as the site for this study for a variety of reasons explained below.
Rural Yolo County has been identified as a food desert but no research has been done to
pinpoint where farm workers live in this region and to what level they are food insecure.
Yolo County as a whole shows very low rates of SNAP enrollment with only 31% of eligible
individuals participating in the program. The school lunch program, which has an active
farm to school component has 77% of those eligible enrolled but the school breakfast
program is reaching only 33% of those eligible and the summer nutrition program serves a
bleak 19% of those eligible.xi
Yolo County is primarily rural and agricultural with a large population of farm workers.
Nationally, eighty percent of farm workers are males with two-thirds of them being under
the age of 35. Sixty percent of farm workers are married. But about 40% of them are males
unaccompanied by family members. More than half of all farm workers live in households
with some non-family members and 75% of undocumented farm workers live in
households that contain no family members.xii All of these factors may contribute to low
enrollment in SNAP and other food assistance programs.
Our purpose was to outline a plan toward improvement of community food security in a
defined low income community by analyzing existing resources. Farm workers are among
the lowest wage earners in the country averaging around $13,000 per year. Many workers
are employed seasonally, reducing their ability to purchase healthy foods to an even
greater extent during the period of unemployment. In fact, previous CIRS work in Salinas
1 NAWS
Page | 12
showed that food insecurity increased among participating farm workers during the off
season.xiii About half of farm workers are undocumented, limiting their access to SNAP
benefits and increasing their need for alternative food programs or sources of food.
Resources abound for addressing food inequality in Yolo County, including the University of
California, Davis, the Yolo County Food Bank with over sixty partner organizations, and a
large community of farmers. In addition, Yolo County has multiple programs and agencies
in place to address the challenges of providing healthy food to low income residents.
Survey
Convenience surveys were administered in Spanish to farm workers in Yolo County.
Convenience sampling is a specific type of “non-probability” sampling method that relies on
data collection from population members who are conveniently available to participate in
the study. The first available primary data source was used for the research without
additional requirements. In other words, this sampling method involves getting
participants wherever you can find them and typically wherever is convenient. In this case,
surveys were administered at farm worker health fairs, at migrant health clinics and in
workplaces.
We designed a short survey instrument that would still maintain its effectiveness in
addressing the issues of food security and other objectives of this study (see Appendices A
and B for the English- and Spanish-language survey instruments). The survey includes
questions from validated instruments but we added non-validated questions including
questions from the Fresno Farm worker Food Security Assessment questionnaire (Wirth,
Strochlic et al. 2007) and the Salinas Farm worker Food Security Assessment questionnaire
(Kresge and Eastman 2009).
The USDA Six-item Short Form of the U.S. Household Food Security Survey Module was the
validated instrument included in the survey. This shortened version of the USDA Food
Security Module was developed as a brief tool to identify food security status among the
general American population (Blumberg, Bialostosky et al. 1999).
A total of 114 farm workers were interviewed in-person between March and October 2015.
All farm workers participating in this survey were working and/or living in Yolo County at
the time of the study. Survey administrators included community-based outreach workers
from RISE, Inc and a professionally trained researcher.
Three initial screening questions were administered to determine participant eligibility.
These questions confirmed that each participant was at least 18 years of age, currently
lived and/or worked in Yolo County, and worked in agriculture currently or at some time in
the previous year.
Page | 13
Food Inventory
Another aspect of our study was an evaluation of available foods at the Yolo County Food
Bank at various points in the year. We inventoried seasonal and fresh foods four times
throughout the course of the project. Our goal in gathering this data was to see if the foods
provided by the food bank as fresh offerings were both familiar and desired by Yolo County
farm workers. We cross checked the inventories with data provided from farm worker
surveys about food preferences.
Results
Farm worker Survey
Demographics
There were 60 male respondents and 54 female respondents to our survey. All of the
respondents had worked in agriculture at some time during the 12 months prior to the
survey. All of the respondents either lived or worked in Yolo County. More than half (69%)
of respondents were married, compared with 31% single. More than half (69%) of married
respondents lived with their spouses, compared to 30% of married spouses living alone.
The majority (68%) of the respondents had children under 18 years of age living with
them. The average number of children in each household was 2 with the highest number
being 4.
The average age of survey respondents was 31.5 years old. Almost all (97%) reported
Spanish as the primary language spoken in the household. Two respondents spoke English
at home while 1 spoke Mixtec and 1 spoke Triqui.2
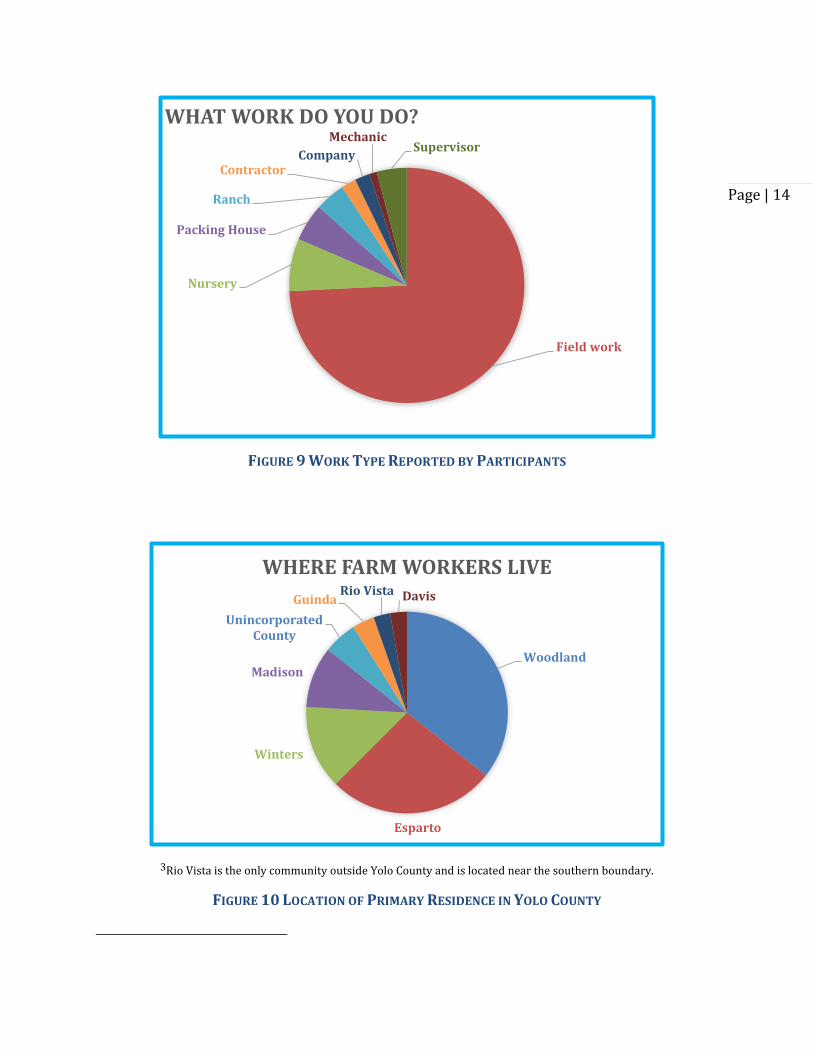
Ninety percent of respondents were employed in agriculture at the time they were
surveyed. The main types of agricultural employment were: fieldwork, nursery work, field
supervisor, labor contractor, packing house, ranch hand, and mechanic. At the time of the
survey, 8.9% of participants were unemployed. The unemployment rate overall for Yolo
County in 2015 was 6.4% and specifically during the months of our study was 6%. The
primary reasons stated by participants for unemployment were: seasonal employment,
company/farm operation went out of business, and caring for a sick spouse. Two
respondents were students at the time of the survey.
2 Mixtec and Triqui are indigenous Mexican languages.
Page | 14
FIGURE 9 WORK TYPE REPORTED BY PARTICIPANTS
3Rio Vista is the only community outside Yolo County and is located near the southern boundary.
FIGURE 10 LOCATION OF PRIMARY RESIDENCE IN YOLO COUNTY
Field work
Nursery
Packing House
Ranch
ContractorCompany
MechanicSupervisor
WHAT WORK DO YOU DO?
Woodland
Esparto
Winters
Madison
Unincorporated County
GuindaRio Vista Davis
WHERE FARM WORKERS LIVE
Page | 15
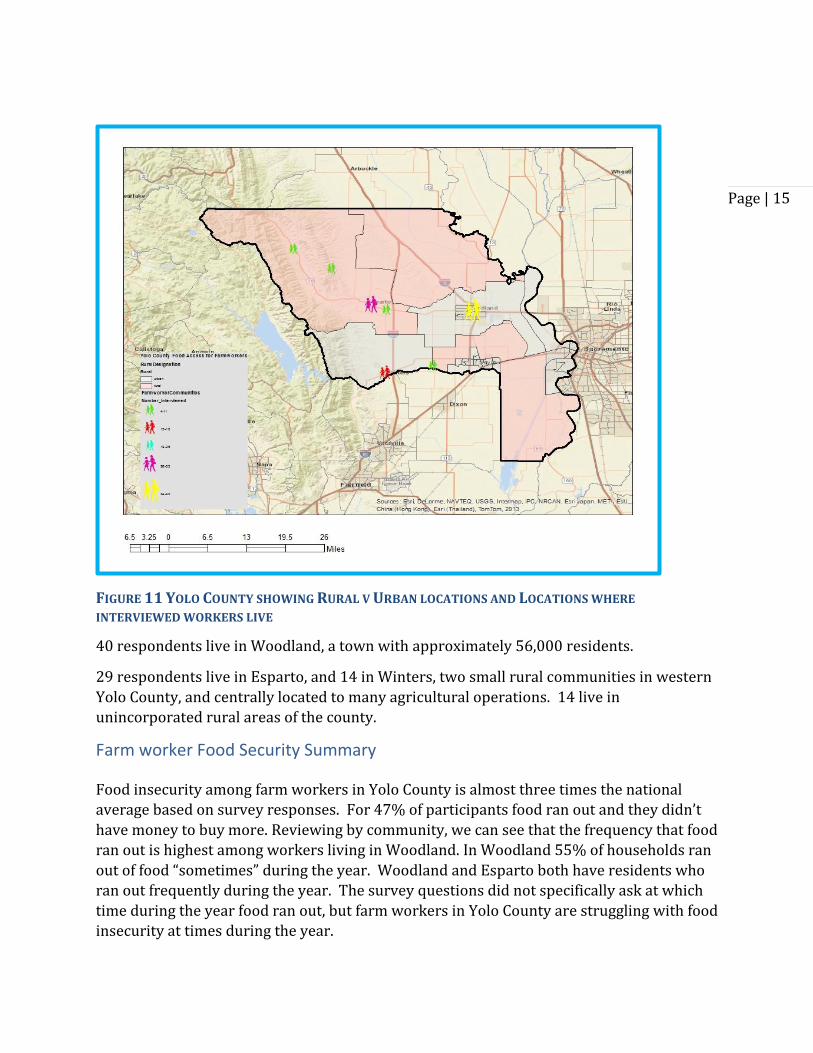
FIGURE 11 YOLO COUNTY SHOWING RURAL V URBAN LOCATIONS AND LOCATIONS WHERE
INTERVIEWED WORKERS LIVE
40 respondents live in Woodland, a town with approximately 56,000 residents.
29 respondents live in Esparto, and 14 in Winters, two small rural communities in western
Yolo County, and centrally located to many agricultural operations. 14 live in
unincorporated rural areas of the county.
Farm worker Food Security Summary
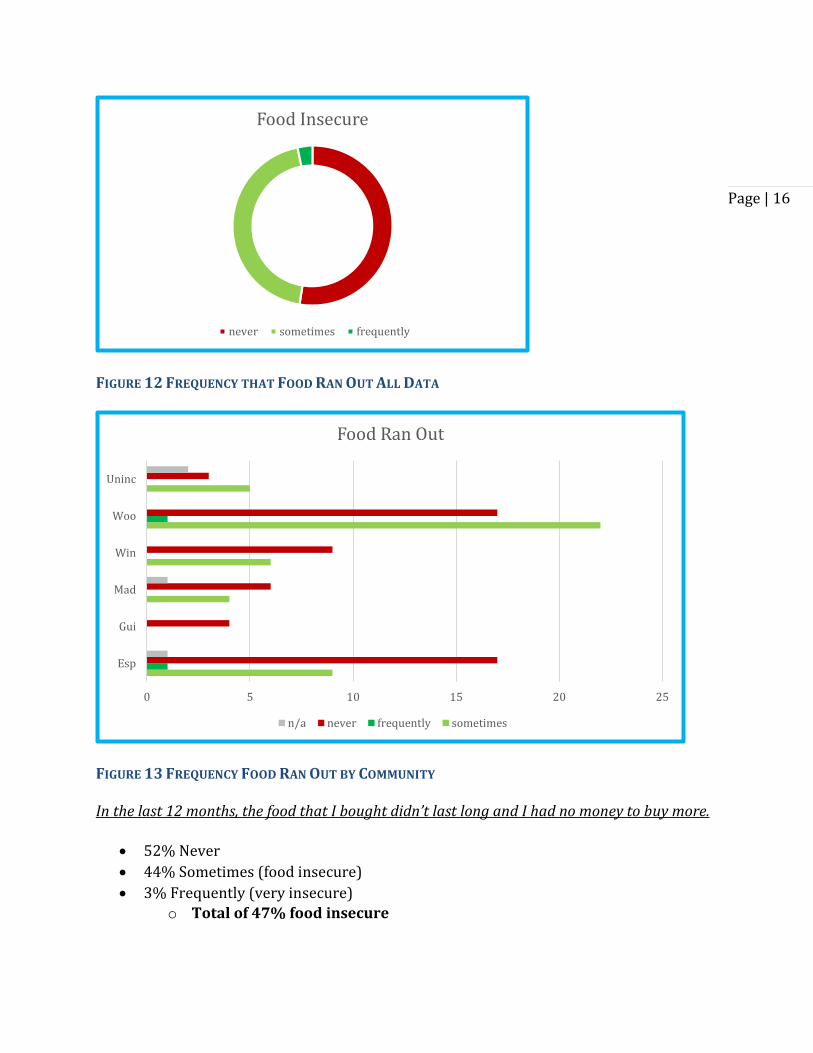
Food insecurity among farm workers in Yolo County is almost three times the national
average based on survey responses. For 47% of participants food ran out and they didn’t
have money to buy more. Reviewing by community, we can see that the frequency that food
ran out is highest among workers living in Woodland. In Woodland 55% of households ran
out of food “sometimes” during the year. Woodland and Esparto both have residents who
ran out frequently during the year. The survey questions did not specifically ask at which
time during the year food ran out, but farm workers in Yolo County are struggling with food
insecurity at times during the year.
Page | 16
FIGURE 12 FREQUENCY THAT FOOD RAN OUT ALL DATA
FIGURE 13 FREQUENCY FOOD RAN OUT BY COMMUNITY
In the last 12 months, the food that I bought didn’t last long and I had no money to buy more.
52% Never
44% Sometimes (food insecure)
3% Frequently (very insecure)
o Total of 47% food insecure
Food Insecure
never sometimes frequently
0 5 10 15 20 25
Esp
Gui
Mad
Win
Woo
Uninc
Food Ran Out
n/a never frequently sometimes
Page | 17
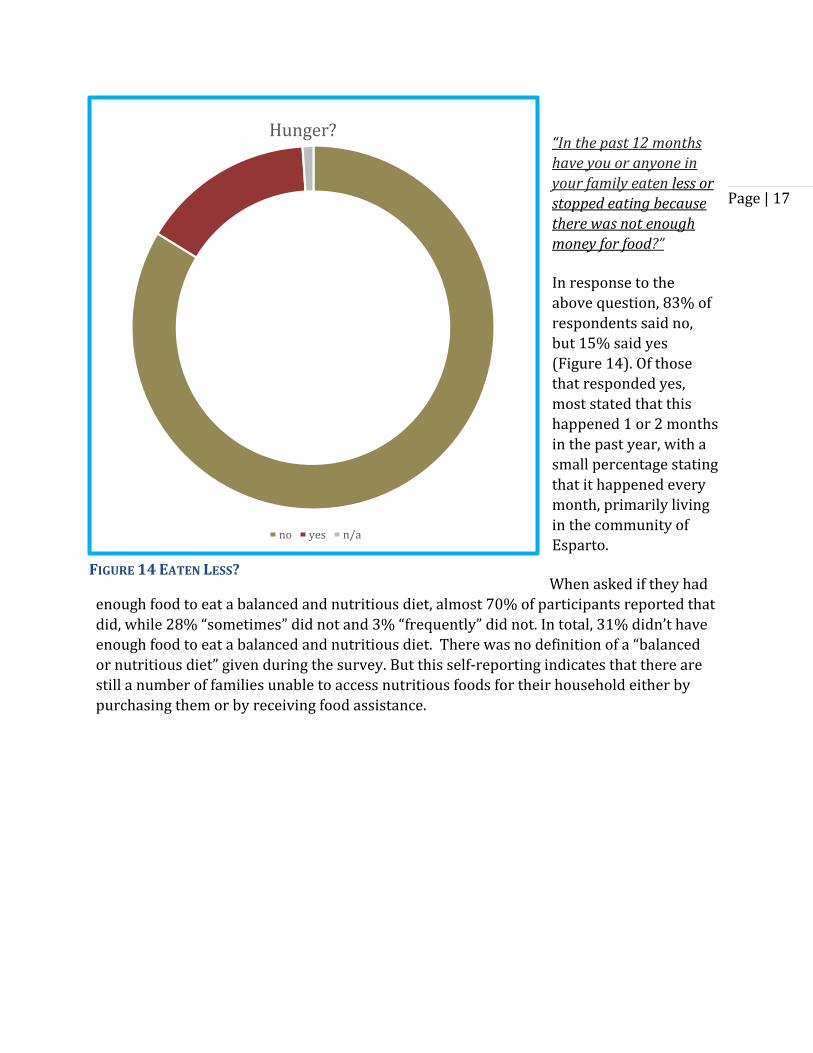
“In the past 12 months
have you or anyone in
your family eaten less or
stopped eating because
there was not enough
money for food?”
In response to the
above question, 83% of
respondents said no,
but 15% said yes
(Figure 14). Of those
that responded yes,
most stated that this
happened 1 or 2 months
in the past year, with a
small percentage stating
that it happened every
month, primarily living
in the community of
Esparto.
When asked if they had
enough food to eat a balanced and nutritious diet, almost 70% of participants reported that
did, while 28% “sometimes” did not and 3% “frequently” did not. In total, 31% didn’t have
enough food to eat a balanced and nutritious diet. There was no definition of a “balanced
or nutritious diet” given during the survey. But this self-reporting indicates that there are
still a number of families unable to access nutritious foods for their household either by
purchasing them or by receiving food assistance.
Hunger?
no yes n/a
FIGURE 14 EATEN LESS?
Page | 18
FIGURE 15 COMMUNITY STATUS WITH REGARD TO NUTRITIOUS AND BALANCED FOODS
In summary, almost half of the farm workers surveyed are experiencing food insecurity
at some point during the year.
Food insecurity was reported in the following ways:
15% had to eat less
47% ran out of food
31% did not have access to nutritious foods
Knowledge of Food Assistance Programs
In California, the Supplemental Nutrition Assistance Program (SNAP) is called CalFresh. Also
referred to as the food stamp program, Cal Fresh provides benefits for low income
Californians with the aim of improving access to nutritious, affordable food. To be eligible,
participants must have a net income below the Federal poverty level and either be a citizen
or legal permanent resident. Undocumented immigrants are not eligible (CalFreshPrimer
2016). Since approximately 50% of farm workers in California are undocumented, this
immediately eliminates a large number from eligibility, however, these workers may live in
households with eligible individuals.
0 5 10 15 20 25 30 35
Esp
Gui
Mad
Win
Woo
Uninc
Lack Nutritious Diet
n/a never frequently sometimes
Page | 19
The WIC program is a federally-funded food assistance program for low income women
who are pregnant, breastfeeding, just had a baby or have children under 5 years old,
including foster children. There is no citizenship or legal residency requirement to be
eligible for this program, and participants receive coupons for staple foods such as milk,
eggs, bread, etc.
In order to determine both the knowledge of food assistance programs and participation in
them, we asked participants about their knowledge of food stamps/CalFresh, WIC and food
bank assistance programs.
There is a high degree of awareness of food assistance programs among farm workers in
Yolo County. Sixty-seven percent of respondents had heard of food stamps, and 46%
reported they had used food stamps within the past 12 months. When asked about specific
Yolo Food Bank assistance programs they had utilized in the past 12 months, 61% said they
had used some specific food program. The most utilized food bank programs were
emergency food assistance (49%), drought food assistance (25%) and school markets
(20%).
Respondents utilized 7 of the 9 food assistance programs listed in the survey. This shows a
high degree of awareness of food assistance programs and how to access those programs.
Knowledge and Use of WIC and CalFresh
Of the respondents who did not use food stamps, almost half had not tried to apply for
them (46.7%), while the remaining stated that they had problems with the application
process, did not qualify because they do not have papers/ are afraid of ICE or because they
earn too much ( See Figure 15). This points to the need for further information or outreach
opportunities to help people better understand the application process or how they might
qualify for the programs. The latter choices indicate that there are still misconceptions or
fears about the program due to immigration concerns, language barriers, or time
constraints to fill out the paperwork.
Page | 20
FIGURE 16 REASONS FOR NOT USING SNAP
Of all participants, 63% had heard of WIC and 31% had used WIC in the past 12 months.
But half of the respondents to the survey have children under five living with them and are
therefore eligible, but clearly a portion of these have not applied for the program. The main
reasons for not utilizing the service mirrored reasons for not using SNAP. It is important to
note that 10% of respondents with young children did not apply for WIC due to lack
documentation or fear of ICE, even though all children are eligible regardless of
immigration status. Figure 17 shows the knowledge and use of WIC broken out by
community. Blue indicates negative answers and orange indicates positive answers. For
example, in Esparto at the bottom of the graph, knowledge of WIC was high while use was
low.
These data point to a need for service providers to develop outreach programs for farm
workers on how to access federal food programs, who is eligible and to provide more
targeted outreach in the communities where food insecurity was highest, despite the
availability of food programs.
I don't quailfy because I earn too much
I don't qualify because I have no papers
I did not apply because of problems with thepaperwork
I did not apply because of fear of the INS
I did not apply for fear of it interfering with citizenshipprocess
I did not try to apply
Rea
son
s fo
r n
ot
usi
ng
0 Percentage 50
Why have you not used food stamps in the past 12 months?
Page | 21
FIGURE 17 KNOWLEDGE AND USE OF WIC IN 6 FARM WORKER COMMUNITIES, YOLO COUNTY
There is a high level of awareness of both WIC and CalFresh/SNAP programs overall, but
there are still eligible families that are not applying for the programs. As Figure 17
illustrates, there are some communities, like Madison and Guinda, where none of the
residents interviewed utilize WIC and in Guinda there was no knowledge of WIC. In most
of the communities where farm workers live, there is knowledge of federal food programs
and yet food insecurity is experienced.
Knowledge and Use of Yolo County Food Bank Programs
We asked participating farm workers to let us know if they had ever heard of specific Yolo
Food Bank programs as well as Cal Fresh (SNAP). The results are shown in Figure 18.
Figure 19 shows actual use of programs among participants. Seven of the 9 programs listed
were utilized by respondents. This shows a high degree of awareness of county food
assistance programs.
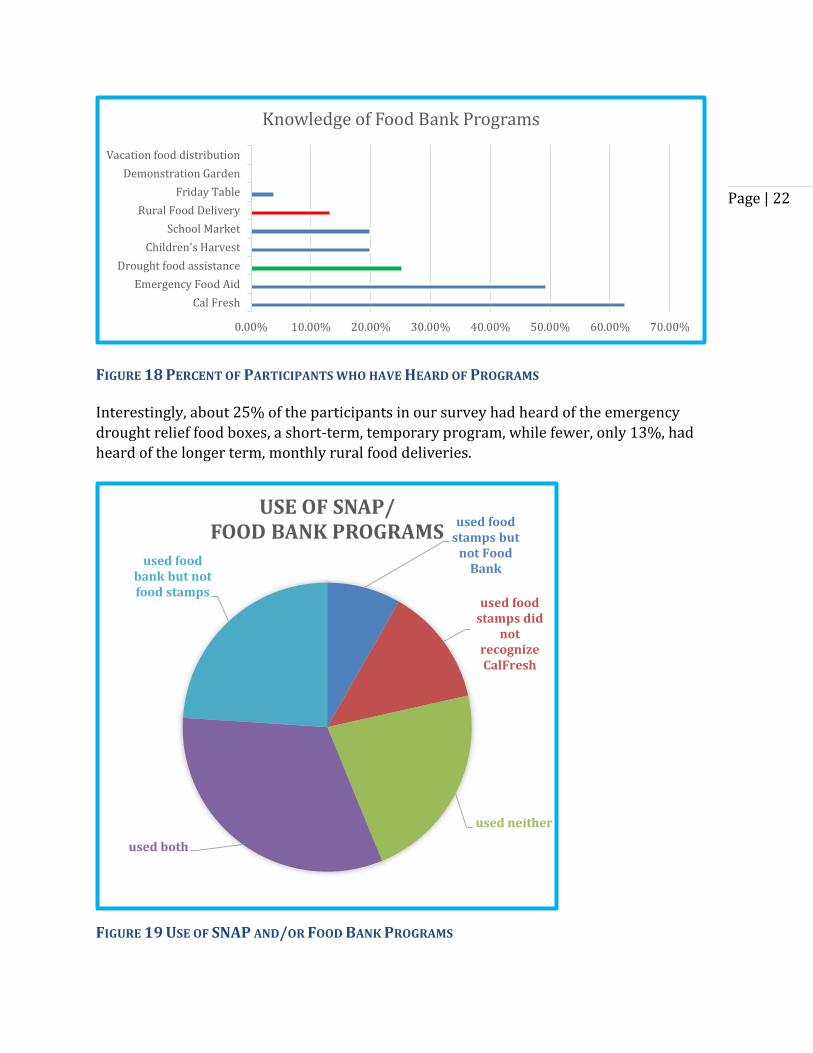
Almost half of participants have heard of the Emergency Food Aid program run by the Yolo
Food Bank. However, there are two additional programs specifically designed to reach
isolated rural residents like farm workers. The Drought Food assistance and Rural Food
Delivery programs are in place to assist all rural residents but also target farm workers.
0 5 10 15 20 25
Esp
Gui
Mad
Win
Woo
Ininc
Knowledge & Use of WIC
Use n Use y Knowledge n Knowledge y
Page | 22
FIGURE 18 PERCENT OF PARTICIPANTS WHO HAVE HEARD OF PROGRAMS
Interestingly, about 25% of the participants in our survey had heard of the emergency
drought relief food boxes, a short-term, temporary program, while fewer, only 13%, had
heard of the longer term, monthly rural food deliveries.
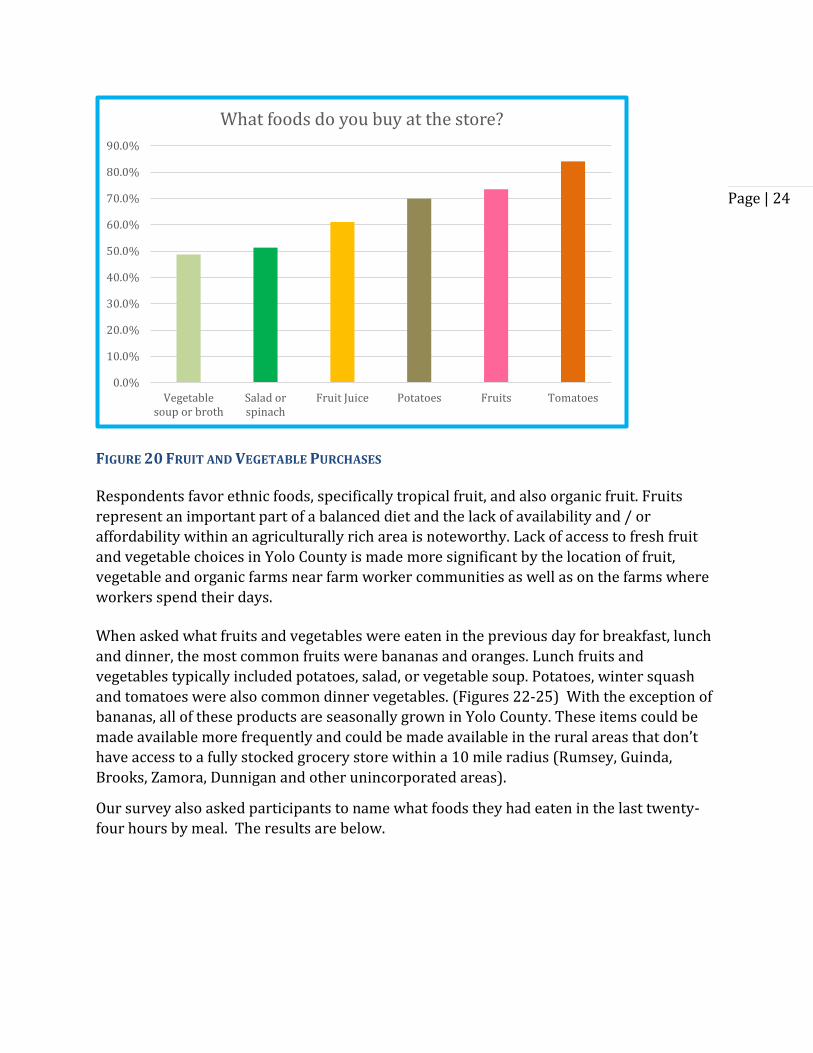
FIGURE 19 USE OF SNAP AND/OR FOOD BANK PROGRAMS
Cal Fresh
Emergency Food Aid
Drought food assistance
Children's Harvest
School Market
Rural Food Delivery
Friday Table
Demonstration Garden
Vacation food distribution
0.00% 10.00% 20.00% 30.00% 40.00% 50.00% 60.00% 70.00%
Knowledge of Food Bank Programs
used food stamps but
not Food Bank
used food stamps did
not recognize CalFresh
used neither
used both
used food bank but not food stamps
USE OF SNAP/ FOOD BANK PROGRAMS

Page | 23
Nutrition/ Common Foods
The second part of the survey asked participants questions about the fruits and vegetables
that they like to buy, and what they eat during the day.
The questions included:
What which fruits and vegetables do you choose to buy in the store?
What types of fruits and vegetables would you like to buy more for yourself or your
family if it was affordable?
List all of the fruits and vegetables that you ate yesterday (breakfast/lunch/dinner).
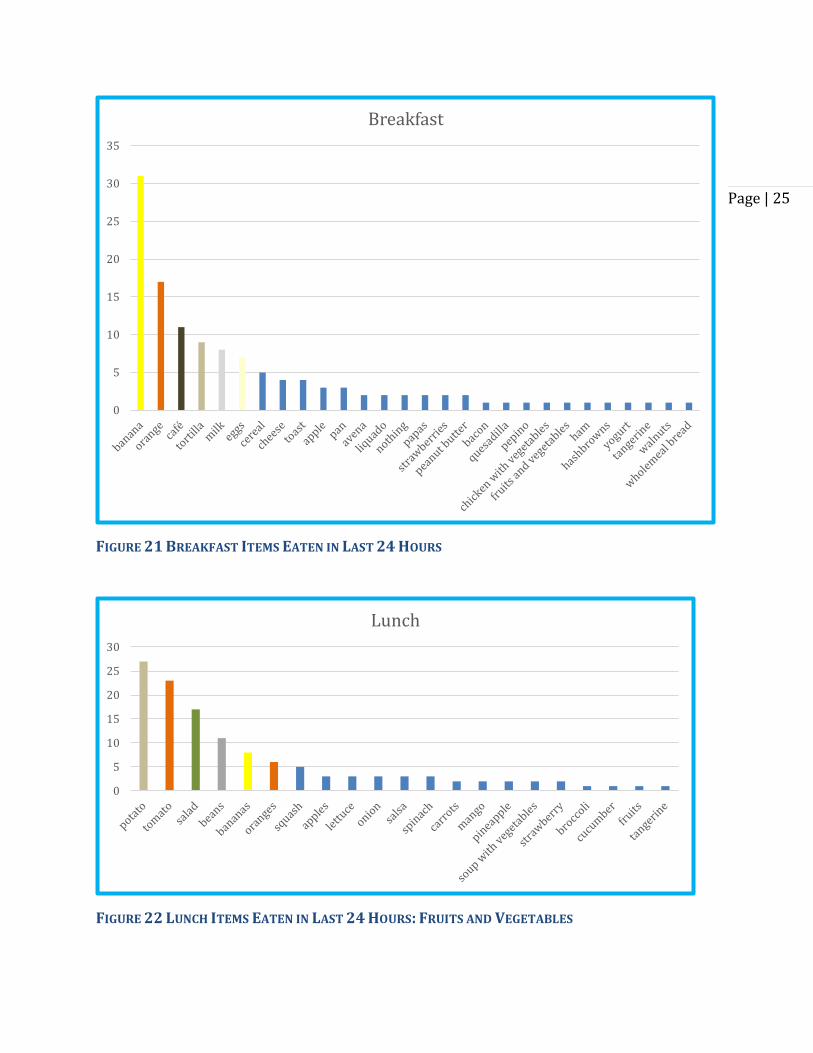
The most common fruit and/or vegetable that respondents chose in the grocery store was
tomatoes (84%), followed by “fruits” (74%) and potatoes (70%). When asked what food
they would like to buy more if money was not an object, the top items included tomatoes,
strawberries, mangos, pineapples, avocados, watermelon, chayote, blackberry, banana
pineapple guava and melons. Some respondents stated that if they could afford to buy
organic, they would.
Fruit is typically a more expensive food item to purchase and may be considered a “luxury”,
especially when challenged to meet basic food needs. However, fresh tomatoes are a main
staple of the Latino4 diet, and the results indicate that they are sometimes not affordable.
Yolo County is a top producer of processing and fresh market tomatoes.
4 The majority of farm workers in California are from Mexico.
Page | 24
FIGURE 20 FRUIT AND VEGETABLE PURCHASES
Respondents favor ethnic foods, specifically tropical fruit, and also organic fruit. Fruits
represent an important part of a balanced diet and the lack of availability and / or
affordability within an agriculturally rich area is noteworthy. Lack of access to fresh fruit
and vegetable choices in Yolo County is made more significant by the location of fruit,
vegetable and organic farms near farm worker communities as well as on the farms where
workers spend their days.
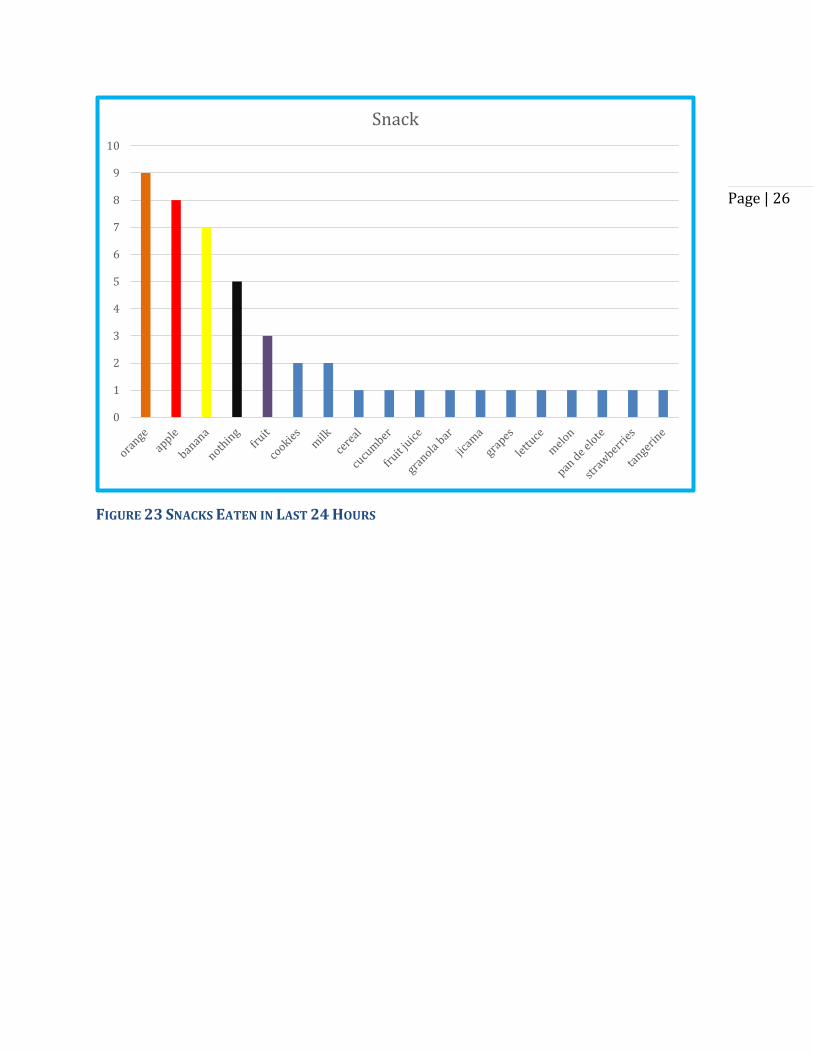
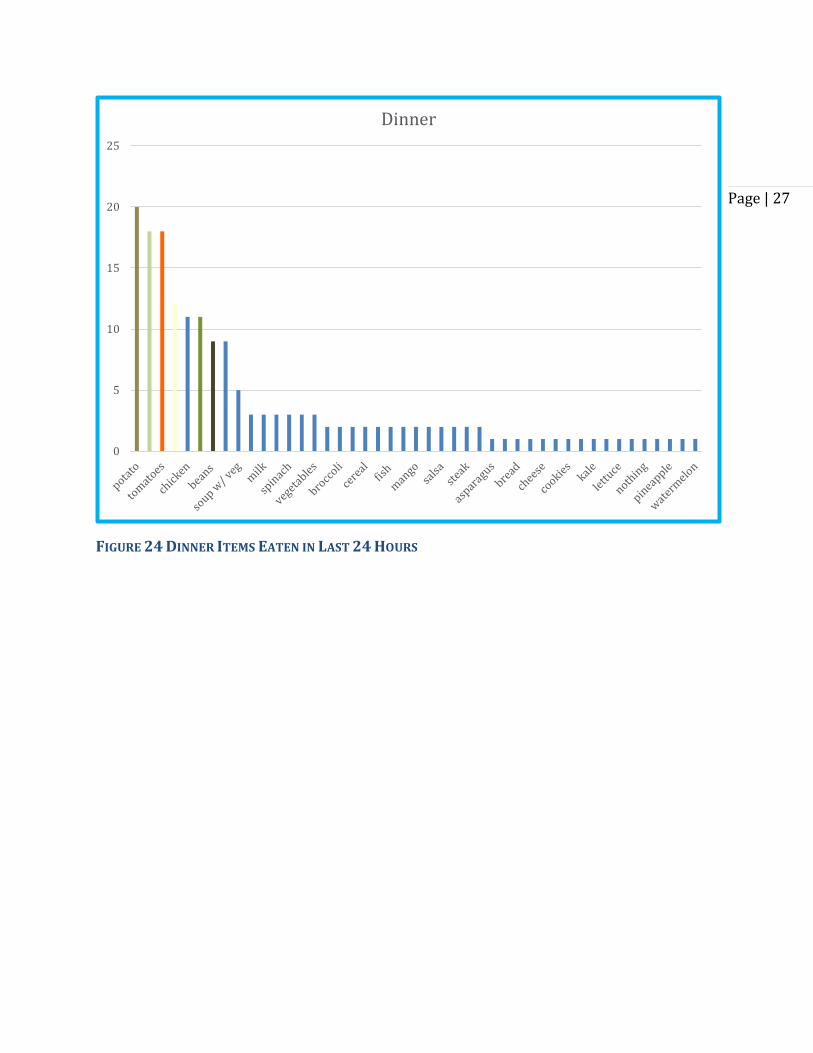
When asked what fruits and vegetables were eaten in the previous day for breakfast, lunch
and dinner, the most common fruits were bananas and oranges. Lunch fruits and
vegetables typically included potatoes, salad, or vegetable soup. Potatoes, winter squash
and tomatoes were also common dinner vegetables. (Figures 22-25) With the exception of
bananas, all of these products are seasonally grown in Yolo County. These items could be
made available more frequently and could be made available in the rural areas that don’t
have access to a fully stocked grocery store within a 10 mile radius (Rumsey, Guinda,
Brooks, Zamora, Dunnigan and other unincorporated areas).
Our survey also asked participants to name what foods they had eaten in the last twenty-
four hours by meal. The results are below.
0.0%
10.0%
20.0%
30.0%
40.0%
50.0%
60.0%
70.0%
80.0%
90.0%
Vegetablesoup or broth
Salad orspinach
Fruit Juice Potatoes Fruits Tomatoes
What foods do you buy at the store?
Page | 25
FIGURE 21 BREAKFAST ITEMS EATEN IN LAST 24 HOURS
FIGURE 22 LUNCH ITEMS EATEN IN LAST 24 HOURS: FRUITS AND VEGETABLES
0
5
10
15
20
25
30
35
Breakfast
0
5
10
15
20
25
30
Lunch
Page | 26
FIGURE 23 SNACKS EATEN IN LAST 24 HOURS
0
1
2
3
4
5
6
7
8
9
10
Snack
Page | 27
FIGURE 24 DINNER ITEMS EATEN IN LAST 24 HOURS
0
5
10
15
20
25
Dinner
Page | 28
Food Program Assessment
Physical Access:
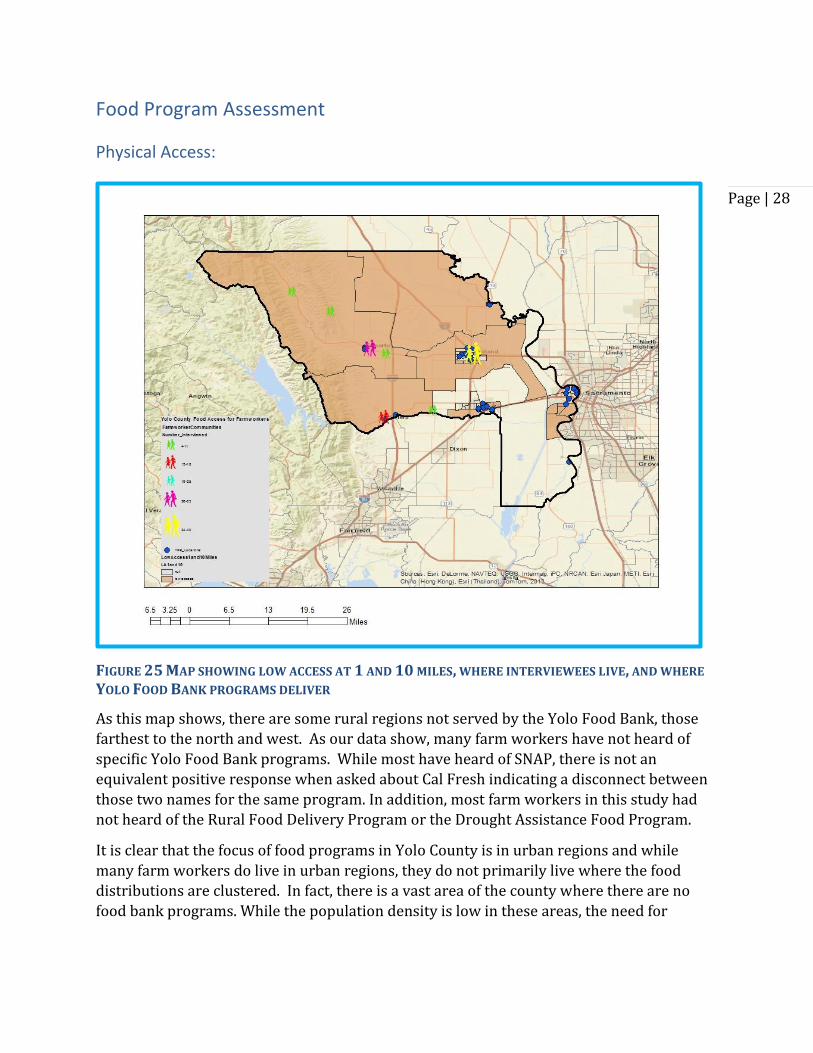
FIGURE 25 MAP SHOWING LOW ACCESS AT 1 AND 10 MILES, WHERE INTERVIEWEES LIVE, AND WHERE
YOLO FOOD BANK PROGRAMS DELIVER
As this map shows, there are some rural regions not served by the Yolo Food Bank, those
farthest to the north and west. As our data show, many farm workers have not heard of
specific Yolo Food Bank programs. While most have heard of SNAP, there is not an
equivalent positive response when asked about Cal Fresh indicating a disconnect between
those two names for the same program. In addition, most farm workers in this study had
not heard of the Rural Food Delivery Program or the Drought Assistance Food Program.
It is clear that the focus of food programs in Yolo County is in urban regions and while
many farm workers do live in urban regions, they do not primarily live where the food
distributions are clustered. In fact, there is a vast area of the county where there are no
food bank programs. While the population density is low in these areas, the need for
Page | 29
assistance appears to be high. For example, in
Guinda the farm workers we interviewed had no
knowledge of federal food programs whatsoever.
It should be noted that there is a high population
of farm workers living in the City of Woodland
and there are a wide number of food programs in
that city. However, our interviews show that for
58% of those surveyed in Woodland, food ran
out either sometimes or frequently. This is
exactly the same percentage of workers who
reported using WIC. For workers in urban areas,
access to food programs is not an issue.
However, knowledge of them might be.
Cultural Access
This section is a comparison between the stated
preferences of farm workers we interviewed and
the Yolo Food Bank inventories of fruits and
vegetables we conducted quarterly. This was
completed to determine the “cultural fit”
between what farm workers choose to eat and
what is included in county food assistance
programs.
To determine food preferences, we asked a
series of questions regarding purchase of fruits
and vegetables as well as consumption of fruits
and vegetables. Figure 19 shows the results of
the question asking participants what fruits and
vegetables they purchase most often from a list
provided to them.
Over half of all participants purchased from all of
these groups: tomatoes – including salsa fresca,
chili verde and tomatillos—fruits and fruit juices,
potatoes, salads or spinach and vegetable broths
and soups. In addition, we asked participants
what fruits and vegetables they would like to buy
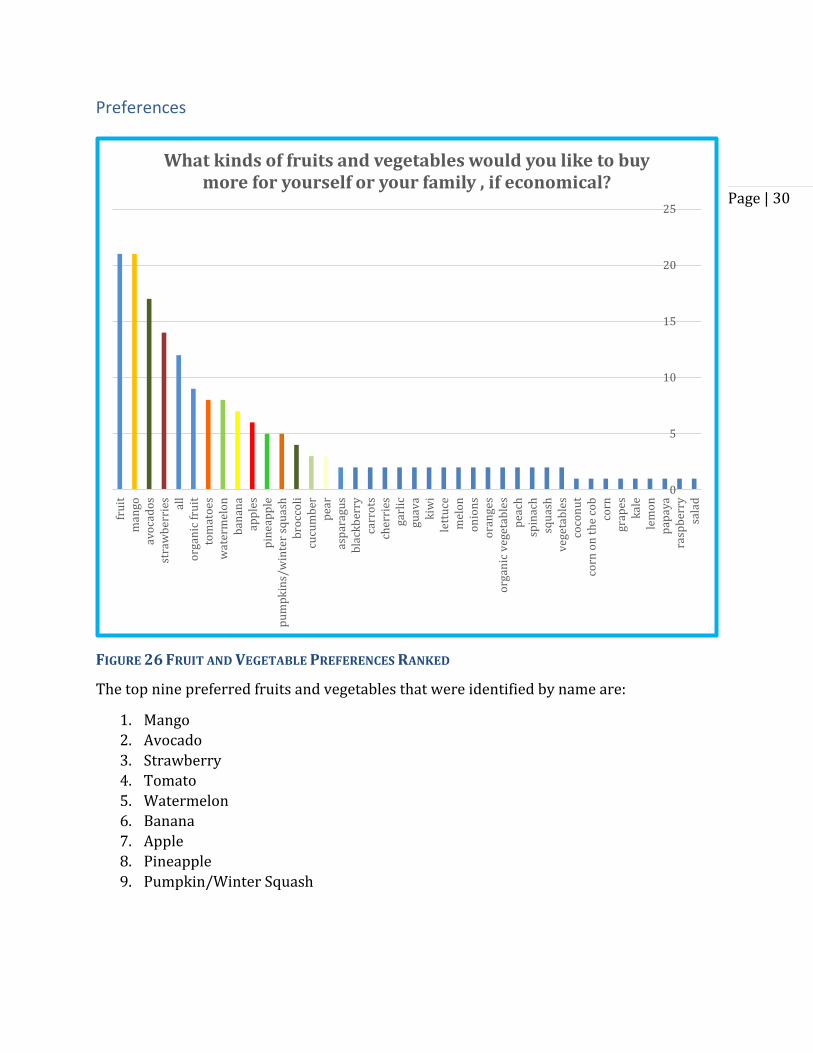
if economical. Results are in Figure 26.
RURAL FOOD DELIVERY
“RFD was developed in
1998 to address the unique
needs of food insecure
families and individuals
living in remote
areas. Research shows that
people living in rural areas
experience higher rates of
poverty and lack access to
fresh, nutritious foods. These
areas tend to lack emergency
food providers and resources
for people who need them.
To provide people in remote
areas with ongoing access to
healthy foods, the Yolo Food
Bank puts together 25-pound
food boxes each month that
contain a variety of grocery
items. An average 650 food
boxes are delivered to 9 sites
each month. An additional
150 boxes are created during
the summer season to provide
food to families and
individuals living at 2 local
Migrant Centers.”
Yolo Food Bank
Page | 30
Preferences
FIGURE 26 FRUIT AND VEGETABLE PREFERENCES RANKED
The top nine preferred fruits and vegetables that were identified by name are:
1. Mango
2. Avocado
3. Strawberry
4. Tomato
5. Watermelon
6. Banana
7. Apple
8. Pineapple
9. Pumpkin/Winter Squash
0
5
10
15
20
25
fru
itm
ango
avo
cad
os
stra
wb
erri
es all
org
anic
fru
itto
mat
oes
wat
erm
elo
nb
anan
aap
ple
sp
inea
pp
lep
um
pk
ins/
win
ter
squ
ash
bro
cco
licu
cum
ber
pea
ras
par
agu
sb
lack
ber
ryca
rro
tsch
erri
esga
rlic
guav
ak
iwi
lett
uce
mel
on
on
ion
so
ran
ges
org
anic
veg
etab
les
pea
chsp
inac
hsq
uas
hv
eget
able
sco
con
ut
corn
on
th
e co
bco
rngr
apes
kal
ele
mo
np
apay
ara
spb
erry
sala
d
What kinds of fruits and vegetables would you like to buy more for yourself or your family , if economical?
Page | 31
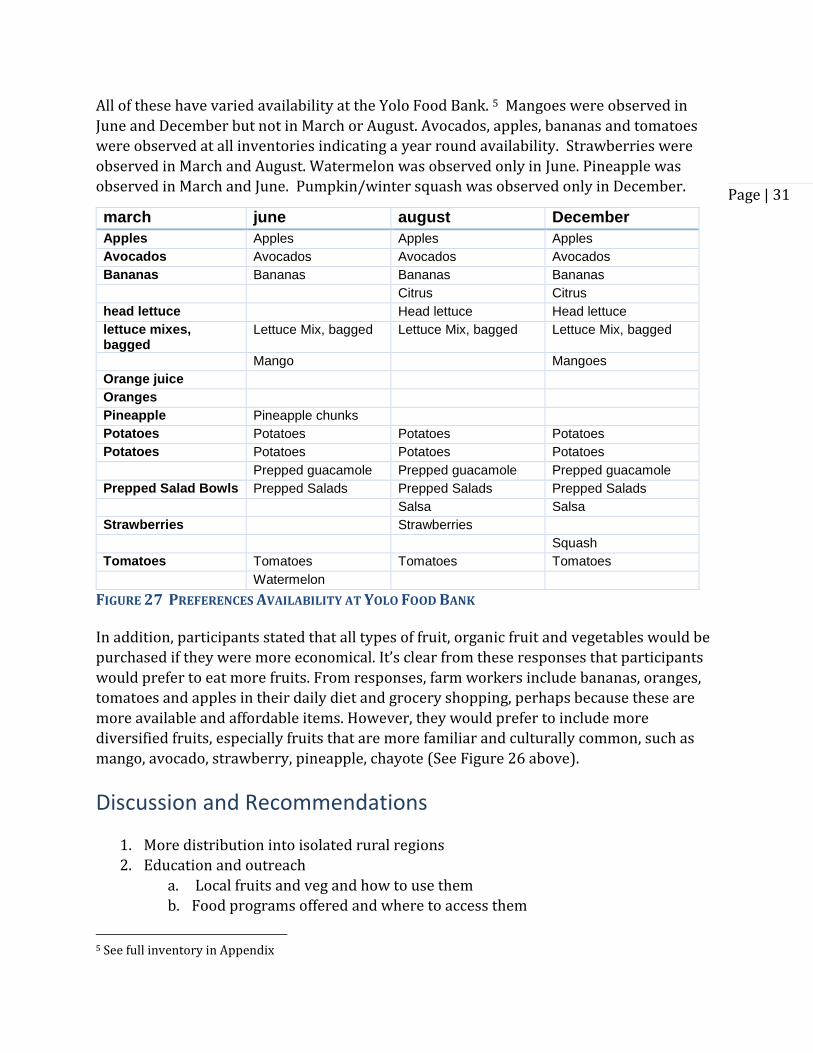
All of these have varied availability at the Yolo Food Bank. 5 Mangoes were observed in
June and December but not in March or August. Avocados, apples, bananas and tomatoes
were observed at all inventories indicating a year round availability. Strawberries were
observed in March and August. Watermelon was observed only in June. Pineapple was
observed in March and June. Pumpkin/winter squash was observed only in December.
march june august December
Apples Apples Apples Apples
Avocados Avocados Avocados Avocados
Bananas Bananas Bananas Bananas
Citrus Citrus
head lettuce Head lettuce Head lettuce
lettuce mixes, bagged
Lettuce Mix, bagged Lettuce Mix, bagged Lettuce Mix, bagged
Mango Mangoes
Orange juice
Oranges
Pineapple Pineapple chunks
Potatoes Potatoes Potatoes Potatoes
Potatoes Potatoes Potatoes Potatoes
Prepped guacamole Prepped guacamole Prepped guacamole
Prepped Salad Bowls Prepped Salads Prepped Salads Prepped Salads
Salsa Salsa
Strawberries Strawberries
Squash
Tomatoes Tomatoes Tomatoes Tomatoes
Watermelon
FIGURE 27 PREFERENCES AVAILABILITY AT YOLO FOOD BANK
In addition, participants stated that all types of fruit, organic fruit and vegetables would be
purchased if they were more economical. It’s clear from these responses that participants
would prefer to eat more fruits. From responses, farm workers include bananas, oranges,
tomatoes and apples in their daily diet and grocery shopping, perhaps because these are
more available and affordable items. However, they would prefer to include more
diversified fruits, especially fruits that are more familiar and culturally common, such as
mango, avocado, strawberry, pineapple, chayote (See Figure 26 above).
Discussion and Recommendations
1. More distribution into isolated rural regions
2. Education and outreach
a. Local fruits and veg and how to use them
b. Food programs offered and where to access them
5 See full inventory in Appendix
Page | 32
c. SNAP/Cal Fresh who is qualified
3. Frozen fruits and veg in seasons when preferred are not available fresh
4. Outreach to farmers for local fruit donations
a. Food benefits for workers on farms
b. Distribution in small rural stores
5. Suggestions for replacements of favored fruits with local fruits
6. Geographic expansion of community based food bank programs
Our outcomes were accomplished through an integrated research project addressing both
farm workers and food programs: in a sense, “matchmaking.” We gained a better
knowledge of where farm workers live in rural Yolo County. We determined the level of
food security of these workers. And we determined both overlap and gaps in food
assistance programs currently serving residents of Yolo County.
It is clear from the data presented in this report that farm workers are food insecure even
though they have knowledge about food assistance programs at both the federal (SNAP,
WIC) and county levels.
Reviewing the map generated showing low access to super markets and Yolo Food Bank
food assistance programs (Figure 24), there is a clear need for more outreach and
distribution in isolated rural regions, especially in the northwest section of the county.
While farm workers in Yolo County follow the pattern in California and live primarily in
urban areas where private market housing is available, even those who live in Woodland
and Winters have challenges with food security.
Reviewing the knowledge and use of food programs provided by farm workers, it is clear
that some educational outreach is warranted. While Latino farm workers prefer fruits they
are familiar with, it might be worthwhile to develop an educational program highlighting
local fruits and vegetables specifically targeted to farm worker families. Information for
farm workers about food programs—what they are, who qualifies and where to access
them—should be distributed to farm workers in a suitable format. A quick facts sheet on
federal food programs would be very useful, especially for those workers who have not yet
been reached, almost half of those interviewed.
There seems to be a need for improved connections between farms and local retail outlets,
especially small local shops in rural northwestern Yolo County. With information on what fresh
fruits and vegetables farm workers will use, the Yolo Food Bank may need to seek a source for
some of the preferred items that are cost prohibitive for farm workers. Farm employers may
want to develop some benefit for farm workers to make sure they have access to fresh fruits and
vegetables as a component of their employment.
Yolo Food Bank may need to increase staff time to solicit donations from local farms for
preferred food items for the existing distribution channels. Alternatively, it might be feasible for
Page | 33
the food bank to work directly with local farms to offer produce to farm workers at a reduced
price.
The food bank may want to seek access to more culturally preferred frozen fruits, like berries,
canned fruits, like pineapple or dried fruits, like mangoes. Alternatively, they may want to
develop an easy to understand fact sheet that offers suggestions for substituting tropical fruits
with locally grown ones, explaining the taste and health benefits.
By working with the Yolo Food Bank, researchers were able to have an open dialogue with
the primary food assistance provider in the county. We expect that the results we present
here will encourage food assistance providers to focus on rural and remote farm worker
communities and provide appropriate food choices to those communities. In addition, the
outcomes should provide a target for SNAP educators and providers.
The current program at Yolo Food Bank called the Kids Farmers Market program, is an
excellent example of an existing program that delivers fresh fruits and vegetable to families
in Yolo County. Expanding this program geographically would be an excellent way to get
more local foods that are culturally appropriate and nutritious to farm worker families.
This program could provide foods such as tomatoes, watermelons, potatoes and winter
squash, and offer these items at more rural schools or rural community gathering locations,
like churches and health clinics.
Page | 34
References
Boule, Danielle, George Hubert, Anna Jensen, Alannah Kull, Julia Van Soelen Kim, Courtney
Marshall, Kelsey Meagher, Thea Rittenhouse. 2011. 1Context Matters: Visioning a Food Hub
in Yolo and Solano Counties. Prepared for The Ag and Food Alliance. Retrieved 3/2/2014
from:http://aginnovations.org/articles/view/context_matters_visioning_a_food_hub_in_yol
o_and_solano_counties/
California Department of Public Health. 2016. About WIC and How to Apply. Retrieved
2/15/2015 from: http://www.cdph.ca.gov/programs/wicworks/Pages/AboutWICandHowtoApply.aspx
California Food Policy Advocates. 2010 Yolo County Nutrition and Food Insecurity Profile. Retrieved 3/18/2014 from:
http://cfpa.net/GeneralNutrition/CFPAPublications/CountyProfiles/2010/CountyProfile-
Yolo-2010.pdf
California Health Interview Survey (CHIS). 2016. Ask CHIS online data tool.
http://ask.chis.ucla.edu/AskCHIS/tools/_layouts/AskChisTool/home.aspx#/results
accessed 2/5/16
Kilanowski, Jill and Laura C. Moore. 2010. Food Security and Dietary Intake in Midwest
Migrant Farm worker Children. Journal of Pediatric Nursing, Volume 25, Issue 5, October
2010, Pages 360–366.
Kresge, Lisa and Chelsea Eastman. 2010. Increasing Food Security among Agricultural
Workers in California’s Salinas Valley. California Institute for Rural Studies.
United States Department of Labor. The National Agricultural Workers Survey Report.
Retrieved 3/20/2014 from: http://www.doleta.gov/agworker/report/ch1.cfm
Villarejo, Don. 2014. California’s Hired Farm Workers Move to the Cities: The Outsourcing
of Responsibility for Farm Labor Housing. California Rural Legal Assistance Priorities
Conference, Asilomar, California July 16, 2013; revised manuscript, January 24, 2014
Retrieved 3/15/2014 from:
http://www.crla.org/sites/all/files/u6/2014/rju0214/VillarejoFrmLbrHsngHlth_CRLA_01
2414.pdf
Villarejo ,Don, David Lighthall, Daniel Williams, Ann Souter, Richard Mines, Bonnie Bade,
Steve Samuels, Stephen McCurdy. 2000. Suffering in Silence: A Report on the Health of
Page | 35
California Agricultural Workers. California Institute for Rural Studies and The California
Endowment.
Winkleby, Marilyn A., Soowon Kim, Guido G. Urizar Jr., David Ahn, Maria Garcia Jennings
and John Snider. 2006. Ten-year changes in cancer-related health behaviors and screening
practices among Latino women and men in California. Ethnicity and Health, 11(1): 1-17.
Winkleby, Marilyn A., John Snider, Bonnie Davis, Maria Garcia Jennings; David K. Ahn. 2003.
Cancer-related health behaviors and screening practices among Latinos: Findings from a
community and agricultural labor camp survey.
Wirth, Cathy, Ron Strochlic and Christy Getz.2007. Hunger in the Fields: Food Insecurity
among Farm workers in Fresno, County. California Institute for Rural Studies. Ethnicity and
Disease, 13: 376-386.
Yolo Department of Agriculture. 2016. 2014 Yolo County Agricultural Report
Yolo County Planning and Public Works Department, March 2003. 2002-2007 Yolo County Housing Element.
Page | 36
Appendices Appendix I: Survey Instruments Farm Worker Food Security Survey-- English Qualifications
Good morning (good afternoon). My name is ________. I am a health promoter with [insert
name here]. We are conducting a survey to learn more about nutrition among farm
workers here, in Yolo County. This information will serve to improve nutrition among farm
workers and their families.
I have a survey that will take 15-20 minutes. This survey is completely
confidential. Furthermore, you do not need to respond to any questions that you do not
wish to answer, and you may terminate the interview at any time.
Would you be interested in participating in this survey?
Before we start, I have a few questions for you to confirm that you qualify for the survey.
1. Gender [Don't ask, just note]
Male
Female
2. Are you 18 years of age or older?
Yes
No:
ASK TO SPEAK TO SOMEONE THAT MEETS THESE REQUIREMENTS. IF THERE IS NOT A
PERSON THAT QUALIFIES, FINISH HERE.
Thank you very much; those are all the questions that we have for
you. This survey requires that we speak to people who are 18 years old
or older.
3. Have you, or a family member that resides with you, worked in agriculture during the
Page | 37
past 12 months, such as in the field, in a packing house, or a nursery?
Yes
No FINISH HERE. Thank you very much. These are all the questions we have for you.
This survey requires that we speak to people who have worked in agriculture during the
past 12 months.
4. Do you live or work here, in Yolo County?
Yes
No FINISH HERE. Thank you very much. These are all the questions we have for you. This
survey requires that we speak to people who live or work in Yolo County.
5. In what community do you live?
6. Are you married?
Yes
No
If yes, Do you live with your husband/wife here?
7. Do you have children under the age of 18 that live with you, either yours or your
partner’s children?
Yes
No
If yes, how many?
U.S. Household Food Security Survey Module: Six-Item Short Form
Transition into Module :
These next questions are about the food eaten in your household in the last 12 months,
since (current month) of last year and whether you were able to afford the food you need.
Page | 38
NOTE: If the placement of these items in the survey makes the transition/introductory
sentence unnecessary, add the word “Now” to the beginning of question HH3: “Now I’m
going to read you....”
FILL INSTRUCTIONS: Select the appropriate fill from parenthetical choices depending on
the number of persons and number of adults in the household.
I’m going to read you several statements that people have made about their food situation.
For these statements, please tell me whether the statement was often true, sometimes true,
or never true for (you/your household) in the last 12 months—that is, since last (name of
current month).
8. The first statement is, “The food that (I/we) bought just didn’t last, and (I/we) didn’t
have money to get more.” Was that often, sometimes, or never true for (you/your
household) in the last 12 months?
Sometimes true
Never true
DK or Refused
9. “(I/we) couldn’t afford to eat balanced meals.” Was that often, sometimes, or never true
for (you/your household) in the last 12 months?
Often true
Sometimes true
Never true
DK or Refused
10. In the last 12 months, since last (name of current month), did (you/you or other adults
in your household) ever cut the size of your meals or skip meals because there wasn't
enough money for food?
Yes
No (Skip to Q12)
DK (Skip to Q12)
11. [IF YES ABOVE, ASK] How often did this happen—almost every month, some months
but not every month, or in only 1 or 2 months?
Page | 39
Almost every month
Some months but not every month
Only 1 or 2 months
DK
12. In the last 12 months, did you ever eat less than you felt you should because there
wasn't enough money for food?
Yes
No
DK
13. In the last 12 months, were you every hungry but didn't eat because there wasn't
enough money for food?
Yes
No
DK
Food Programs
Now I have some questions for you regarding food assistance programs. I would like to
remind you that everything we have discussed is completely confidential, and you do not
have to respond to any questions you do not wish to answer.
14. Have you heard about food stamps or EBT?
Yes
No
DK
15. Have you used food stamps or EBT in the past 12 months?
Yes
No
DK
Page | 40
16. Have you gotten food from any food aid programs, like the food bank or pantry?
Yes
No
DK
17. Will you name the food aid program (s) if you can?
Emergency food assistance
Drought food assistance
Rural food delivery
Friday's table
Children's harvest
Kid's farmers' market (school)
Demonstration garden
Holiday food distribution
Other (please specify)
18. If you have not used EBT in the last month, why not?[DO NOT READ RESPONSES,
CHECK ALL THAT APPLY]
We do not qualify because we earn too much income
We do not qualify because we don’t have papers (legal residency)
Because of problems with the paperwork
Because of fear of immigration (being deported)
Because it could intervene with the process of becoming a citizen
I have not tried to obtain food stamps/enroll in EBT
Other (please specify)
19. Do you have children under the age of 5 who live here with you or (IF THE
INTERVIEWEE IS A WOMAN) are you pregnant?
Page | 41
Yes
No
DK/refus
20. Have you heard of WIC?
Yes
No
DK/refuse
21. Have you used WIC in the past 12 months?
Yes [Skip to Q 23]
No
DK/Ref
22. Why haven't you used WIC?
We do not qualify because we earn too much income
We do not qualify because we don’t have papers (legal residency)
Because of problems with the paperwork
Because of fear of immigration (being deported)
Because it could intervene with the process of becoming a citizen 6
I have not tried to obtain food stamps/enroll in EBT
Other (please specify)
23. What foods do you choose when you shop?
Fruit juice, such as orange, apple, or grape juice, whether fresh, frozen, canned or in aguas
frescas (except sodas or similar types of drinks)
Fruits – whether fresh, canned, frozen
Tomatoes, fresh salsa, tomatillos, or green chilies
Salad Greens (such as lettuce or spinach)
Page | 42
Soups or broths with vegetables
Potatoes, of any type—baked, mashed or fried
Any other type of vegetable, such as green beans, cabbage, corn or broccoli
Other (please specify)
24. What types of fruits and vegetables would you like to buy more of for yourself or your family if it was affordable? (Please list all fruits and vegetables)
25. I am going to ask you about what you and your family ate yesterday.
What did you eat for breakfast? (Write down all fruits and vegetables)
What did you eat for lunch? (Write down fruits and vegetable)
What did you eat for a snack? (Write down fruits and vegetables)
What did you eat for dinner? (Write down fruits and vegetables)
Demographic Information
Now I have some last questions.
25. How old are you?
26. What language do you mainly speak at home?
English
Spanish
Triqui
Mixteco
Purepecha
Other (please specify)
27. What is your current employment status?
Employed
Unemployed
Page | 43
DK/Ref
28. If you are employed, what is your job?
29. If unemployed are you:
Disabled
Retired
Full time student
Other (please specify)
Entravista-- Espanol INTRODUCCION
Buenos días (buenas tardes). Me llamo ________. Soy un/a promotor/a de salud con
___________ [nombre del la organización]. Estamos llevando a cabo una encuesta
para aprender sobre la nutrición entre los trabajadores agrícolas en Yolo county.
Esta información servirá para mejorar la nutrición de los trabajadores agrícolas y sus
familias.
Tengo una encuesta que tarda aproximadamente 15 minutos.
La encuesta es completamente confidencial y no tiene que responder a ninguna pregunta que
no prefiere contestar. En cualquier momento puede terminar la entrevista.
¿Le interesaría participar en esta encuesta?
Antes que nada, le tengo unas preguntas para ver si califica.
1. ENTREVISTADOR/A: MARQUE EL SEXO DEL ENTREVISTADO/A:
Hombre
Mujer
2. Ud. Tiene 18 anos o mas?
Sí
No
PREGUNTE POR ALGUIEN MÁS. SI NO HAY OTRA PERSONA,
TERMINE AQUÍ: Muchas gracias, estas son todas la preguntas que le
tenemos. Esta encuesta está dirigida a personas con 18 años o más de edad.
Page | 44
3. ¿Ud., o algún familiar que vive aquí con Ud., ha trabajado en la agricultura durante los
últimos 12 meses – aun que sea de temporada - en el fil, en una empacadora o en una florería o
nursería?
Sí
No
TERMINE AQUI. Muchas gracias, estas son todas la preguntas que le
tenemos. Esta encuesta está dirigida a personas que han trabajado en la
agricultura durante los últimos 12 meses.
4. ¿Vive o trabaja Ud. aquí en Yolo County?
1Sí
No
TERMINE AQUI. Muchas gracias, estas son todas la preguntas que
tenemos. Esta encuesta está dirigida a personas que viven o trabajan en Yolo county.
5. Donde vive Ud? Apunte el nombre de la comunidad
_________________________________
6. ¿Esta casado/a?
Sí - ¿Vive su esposo/a aquí? _____Sí _____No
No
7. ¿Tiene hijos menores de 18 años que viven con Ud, suyos o de su pareja?
Sí ¿Cuántos? ____________ (solo menores de 18 años)
No
AHORA LE VOY A LEER ALGUNAS RESPUESTAS DE LA GENTE SOBRE SU SITUACIÓN DE COMIDA
EN SU FAMILIA O EN SU CASA. PARA CADA REPUESTA, FAVOR DE INDICARME SI HA OCURRIDO
PARA UD. / SU FAMILIA FRECUENTEMENTE, A VECES, O NUNCA EN LOS ÚLTIMOS 12 MESES.
(PARA LAS SIGUIENTES PREGUNTAS, SI HAY SOLO UNA PERSONA EN EL
HOGAR, USE "YO,” “MI,” Y “USTED”. DE OTRA MANERA, USE "NOSOTROS,”
“NUESTROS,” Y “SU FAMILIA.”)
8. “La comida que compré (compramos) no duró mucho y no había dinero para comprar más.”
¿En los últimos 12 meses, si ha ocurrido frecuentamente, a veces, nunca o no sabe?
Frecuentemente
A Veces
Nunca
No sabe
Page | 45
rehuse
9. “(Yo/Nosotros) no teníamos lo suficiente para comer una comida balanceada (nutritiva).”
¿En los últimos 12 meses, si ha ocurrido frecuentamente, a veces, nunca o no sabe?
Frecuentemente
A Veces
Nunca
No sabe
rehuse
10. En los últimos 12 meses ¿Usted o algún miembro de su familia comió menos o dejó de
comer porque no había suficiente dinero para la comida?
Sí
11. [#10 es sí, haga esta pregunta] ¿Con qué frecuencia ocurre esto? How often did this
happen—almost every month, some months but not every month, or in only 1 or 2 months?
Casi cada mes
Algunos meses pero no cada meses ______ Cual meses? _______________________
A veces- 1 mes o 2 meses
No sabe o rehuse
12. En los últimos 12 meses, ¿Comió ustedmenos de lo que pensaba que debía porque no hubo
suficiente dinero para comida?
Sí
No
No sabe o rehuse
13. En los últimos 12 meses, ¿Alguna vez tuvo hambre pero no comió porque no tuvo suficiente
dinero para comida?
Si
No
ACCESO A PROGRAMAS DE ASSISTENCIA ALIMENTARIA
Ahora le tengo unas preguntas sobre programas de asistencia de comida. Quiero recordarle que
Page | 46
todo lo que hemos hablado hoy es completamente confidencial, y que no tiene que responder
a ninguna pregunta que no desee.
14. ¿Ha oído de estampillas de comida?
Sí
15. ¿Ha usado estampillas de comida o EBT en los últimos 12 meses?
No
No sabe
16. ¿Ha recibido usted la comida de los programas de ayuda alimentaria, como el banco de
alimentos o despensa de la comida?
17. ¿Se identificará el nombre del programa si te acuerdas?
Ayuda alimentaria de emergencia
Asistencia alimentaria de sequía
Delivery de comida rural
“Tabla del Viernes”
“Cosecha de los niños”
Mercado en la escuela
Jardín de demostración
Distribución de alimentos de vacaciones
Otro________________________________________________
18. ¿Por qué no ha usado estampillas de comida en los últimos 12 meses?
[NO LEER LAS RESPUESTAS, MARQUE TODAS LAS QUE APLIQUEN]
No califican porque ganan demasiado
Page | 47
No califican porque no tienen papeles
No ha aplicado por problemas con el papeleo
No ha aplicado por miedo de la migra
No ha aplicado por miedo de que pueda intervenir con su proceso de ciudadanía
No ha tratado de conseguirlo
Otro
________________________________________________________
19. ¿Tiene Ud. hijos menores de 5 años que viven aquí con usted o (SI ES MUJER) está
embarazada?
Sí
20. ¿Ha oído de WIC?
Sí
No sabe (
21. ¿Ha usado el WIC en los últimos 12 meses?
Sí ( PASE A LA PREGUNTA 23)
No
22. ¿Por qué no ha usado el WIC en los últimos 12 meses?
[NO LEA LAS RESPUESTAS, MARQUE TODAS LAS QUE APLIQUEN]
No califican porque ganan demasiado
No califican porque no tienen papeles
No ha aplicado por problemas con el papeleo
No ha aplicado por miedo de la migra
No ha aplicado por miedo de que pueda intervenir con su proceso de ciudadanía
No ha tratado de conseguirlo
Otro:
23. ¿Qué alimentos elegir para comprar en la tienda?
Jugo de frutas ( naranja, manzana, uva, aguas frescas )
Page | 48
Frutas ( con hielo, fresca o enlatados) Fruits
Tomates- salsa fresca, chili verde, tomatillos
Ensalada o espinaca
Sopa o caldo con vegetales
Papas ( fritas, para horno o revueltas)
Otros vegetales o frutas- (POR FAVOR ESPECIFIQUE)
24. ¿Qué tipos de frutas y verduras ¿desea comprar más para usted o su familia, si fuera
económico? (Por favor indique todas las frutas y verduras))
25. Voy a preguntarle sobre lo que usted y su familia comieron ayer
¿Qué comió para el desayuno? (Anote todas las frutas y verduras)
¿Qué comió para el almuerzo? (Anote frutas y verdura)
¿Qué comió para un bocado? (Anote frutas y verduras)
¿Qué comió para la cena? (Anote frutas y verduras)
Demographic Information
Tengo algunas preguntas finales.
26. ¿Cuántos años tienes?
27. ¿Qué idioma se habla en su hogar?
Ingles
Espanol
Triqui
Mixteco
Purepecha
Otro (por favor especifique)
Page | 49
28. ¿Cuál es su situación en el empleo?
Empleado
Desempleado
No Se o Rehuse
29. Si usted es empleado, ¿cuál es su trabajo?
30. ¿Si está desempleado
esta minusválido,
se retiró
un estudiante
Otro _______________________________
¡Muchísimas gracias por participar en esta encuesta! La información que nos ha
proporcionado nos va a servir mucho para mejorar el estado nutricional de los
trabajadores agrícolas.
NOMBRE DEL ENTREVISTADOR/A:
__________________________________________
FECHA DE LA ENTREVISTA:
___________________________________
( ¿Piensa Ud. que el entrevistado contesto a las preguntas honestamente?)
Si
No
¿Tiene algún otro comentario?:
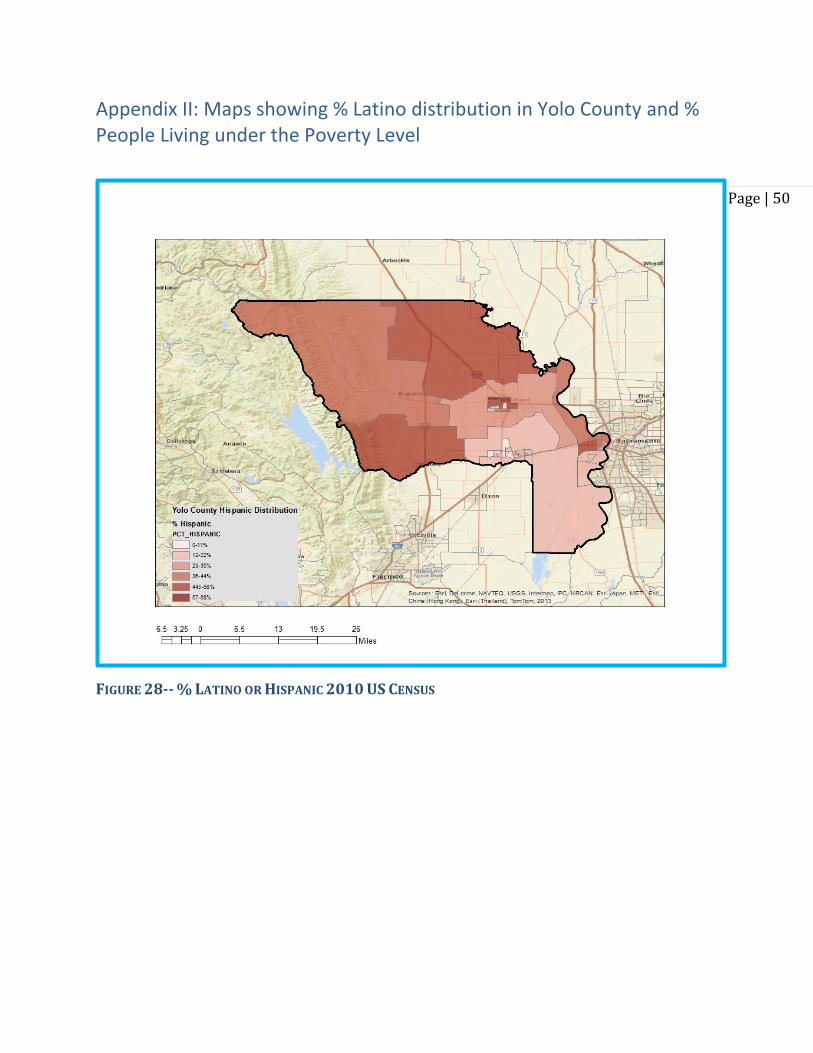
Page | 50
Appendix II: Maps showing % Latino distribution in Yolo County and % People Living under the Poverty Level
FIGURE 28-- % LATINO OR HISPANIC 2010 US CENSUS
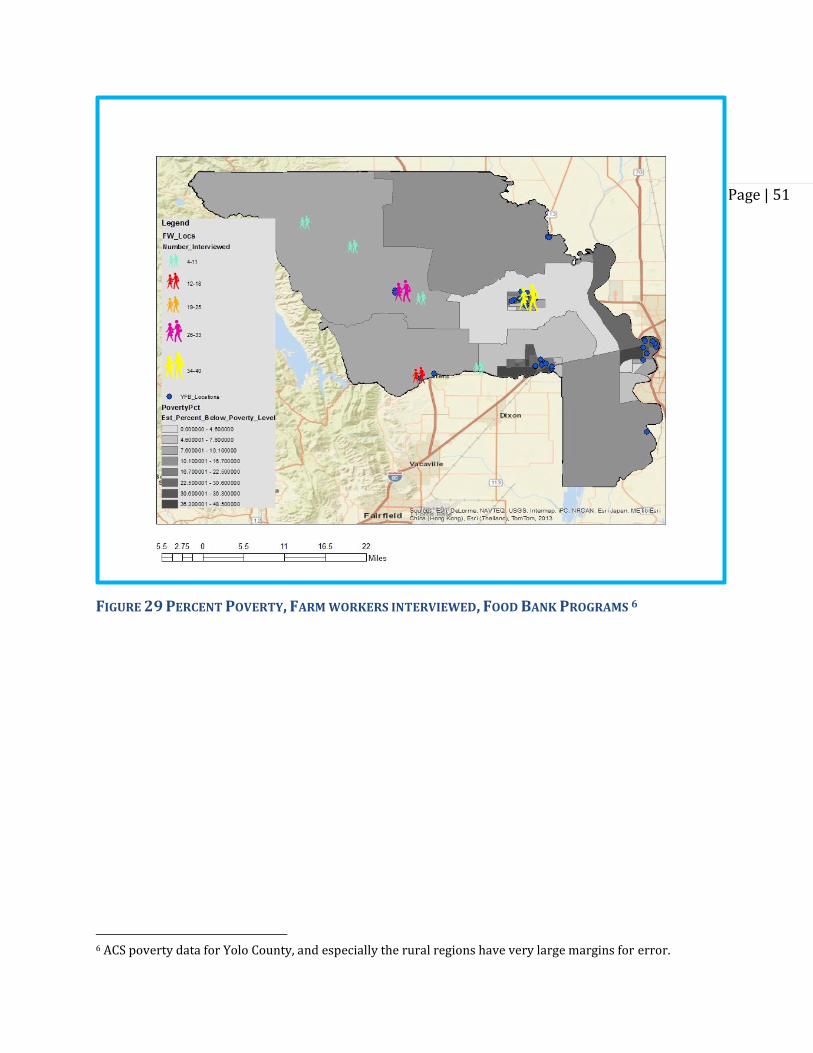
Page | 51
FIGURE 29 PERCENT POVERTY, FARM WORKERS INTERVIEWED, FOOD BANK PROGRAMS 6
6 ACS poverty data for Yolo County, and especially the rural regions have very large margins for error.
Page | 52
Appendix III: Food Bank Service Directory http://www.yolofoodbank.org/
FOOD BANK DISTRIBUTION CHAIN
DONORS
Every day, through the generosity of our donors, local growers provide farm-fresh produce from
the fields around us. Grocers and retailers offer us perishables such as meat, bread, milk and
cheese. Area ranchers give fresh eggs, tree fruits and nuts. Food drives run by groups and
individuals yield much needed canned goods for our Rural Food Delivery (RFD) program. And
of course, without the generous monetary donations, we would not be able to purchase the items
that we need to balance our offerings.
FOOD BANK WAREHOUSE Staffed with eight full-time and part-time employees and over 300 volunteers, the warehouse
collects and receives 3 million pounds of food annually. This comes in the form of fresh, frozen
and shelf-stable meats, dairy, bread and grains, canned goods, baby food and even pet food.
Household products such as cleaners, paper goods, laundry soap and other toiletries are donated
and made available. All of our donated product is sorted, repacked, and prepared for distribution
to our partner agencies and our own express programs.
AGENCIES AND PROGRAMS
Through our 60 partner agencies and nine direct distribution programs, we provide food to food
closets, faith-based organizations, emergency shelters, migratory centers, soup kitchens, low
income housing sites, after-school programs, senior housing, Family Resource Centers, summer
lunch program and residential programs in Yolo County.
35,000+ HUNGRY RESIDENTS
Through our partner agencies and our own direct distribution programs we reach more than
25,000 residents each month representing children, working families, recently unemployed,
veterans, students, seniors, migrant farm workers and the working poor. According to statistics,
Yolo County has more than 35,000 people who are considered food-insecure.
Drought Food Assistance Program (DFAP)
Yolo Food Bank's Drought Food Assistance Program is an effort designed to provide
food assistance to Yolo County residents who are either unemployed or have reduced
employment because of the drought. Recipients of the program will receive pre-packed
Page | 53
boxes of non-perishable foods. Yolo Food Bank collaborates with several partner
organizations to provide drought food assistance at 12 sites throughout Yolo County.
Who qualifies for drought food assistance?
Anyone who lives in Yolo County and has less or no work because of the drought.
What type of documentation is needed to receive drought food assistance?
None, this is a self-certification program. Participants only need to sign a form that
certifies that they have less or no work because of the drought.
What type of food will participants receive?
Clients will receive a 30-pound box of non-perishable foods.
Where can individuals access drought food assistance?
Please see our distribution schedule below.
DFAP March Flyer (PDF)
Emergency Food Assistance Program (EFAP)
EFAP is a Federal program that supplements the diets of low income Americans by
providing them with emergency food and nutrition assistance at no cost. U.S.
Department of Agriculture (USDA) foods are purchased at the national level and made
available to state agencies to distribute. States then provide the food to local agencies
that have been selected to distribute commodities in their region. The Yolo Food Bank
distributes EFAP commodities in Yolo County.
Products distributed through this program vary each month but often include non-
perishable goods, frozen proteins, fresh produce and grains. Currently, Yolo Food Bank
provides monthly emergency food to approximately 2,500 low income households at
more than 32 locations, including the Food Bank, food closets, and congregate feeding
programs.
To qualify for this program, individuals must self certify that they meet income
guidelines that have been determined by the State of California.
Alternate Pick-Up Forms
Participants can pick-up for up to three other recipients who are unable to attend the distribution.
Alternates must complete a form below or a signed note from the eligible recipient to authorize
pick-up. All notes or forms must be submitted to the site volunteers in order to pick-up for
Page | 54
others. All notes should contain: date, written authorization for alternate to pick up, alternate’s
name, recipient’s household size.
Alternate Pick-Up Form (English)
Alternate Pick-Up Form (Spanish)
*Recipients are asked to attend only one site per month and bring bag or container to
their distribution.
EFAP March Schedule
Rural Food Delivery (RFD)
RFD was developed in 1998 to address the unique needs of food insecure families and
individuals living in remote areas. Research shows that people living in rural areas
experience higher rates of poverty and lack access to fresh, nutritious foods. These
areas tend to lack emergency food providers and resources for people who need them.
To provide people in remote areas with ongoing access to healthy foods, the Yolo Food
Bank puts together 25-pound food boxes each month that contain a variety of grocery
items. An average 650 food boxes are delivered to 9 sites each month. An additional
150 boxes are created during the summer season to provide food to families and
individuals living at 2 local Migrant Centers.
RFD boxes are delivered with EFAP each month to sites in the following locations:
Clarksburg, Dunnigan, Esparto, Guinda, Knights Landing, Winters, Woodland, and Yolo.
Fresh Produce Distributions
Our fresh produce distributions provide families and individuals with ongoing access to
healthy foods. Community members in need of food assistance can attend weekly
distributions in Yolo County to receive fruits, vegetables, and other perishable goods
including bread and dairy when available.
WEEKLY DISTRIBUTIONS
Woodland Locations
Yolo Food Bank
Fridays: 6:45– 8:00am
1244 Fortna Avenue (distribution happens next to the warehouse, located behind the
Food Bank office)
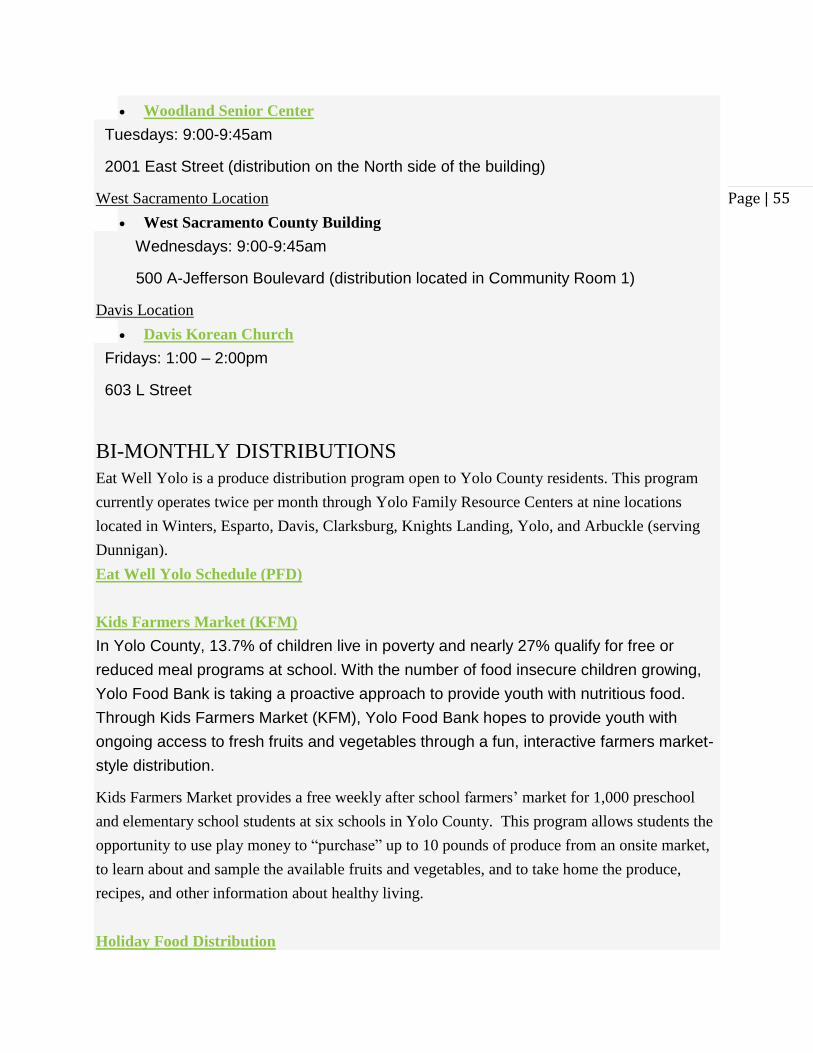
Page | 55
Woodland Senior Center
Tuesdays: 9:00-9:45am
2001 East Street (distribution on the North side of the building)
West Sacramento Location
West Sacramento County Building
Wednesdays: 9:00-9:45am
500 A-Jefferson Boulevard (distribution located in Community Room 1)
Davis Location
Davis Korean Church
Fridays: 1:00 – 2:00pm
603 L Street
BI-MONTHLY DISTRIBUTIONS
Eat Well Yolo is a produce distribution program open to Yolo County residents. This program
currently operates twice per month through Yolo Family Resource Centers at nine locations
located in Winters, Esparto, Davis, Clarksburg, Knights Landing, Yolo, and Arbuckle (serving
Dunnigan).
Eat Well Yolo Schedule (PFD)
Kids Farmers Market (KFM)
In Yolo County, 13.7% of children live in poverty and nearly 27% qualify for free or
reduced meal programs at school. With the number of food insecure children growing,
Yolo Food Bank is taking a proactive approach to provide youth with nutritious food.
Through Kids Farmers Market (KFM), Yolo Food Bank hopes to provide youth with
ongoing access to fresh fruits and vegetables through a fun, interactive farmers market-
style distribution.
Kids Farmers Market provides a free weekly after school farmers’ market for 1,000 preschool
and elementary school students at six schools in Yolo County. This program allows students the
opportunity to use play money to “purchase” up to 10 pounds of produce from an onsite market,
to learn about and sample the available fruits and vegetables, and to take home the produce,
recipes, and other information about healthy living.
Holiday Food Distribution

Page | 56
Thanksgiving Holiday Food Distribution 2015
Yolo Food Bank is excited to announce that we will be hosting a Thanksgiving Holiday
Food Distribution this November. In an effort to provide food for Thanksgiving, Yolo
Food Bank will distribute 2,000 meal kits to residents throughout Yolo County. Each
meal kit will include a turkey, an assortment of fresh seasonal produce, a bag of rice
and a bag of beans.
To receive a meal kit, participants must:
Be residents of Yolo County
Attend the distribution serving the town where they live
Bring proof of address - this may include a driver license, a bill or mail
Participants may only receive one meal kit per household.
Thanksgiving Holiday Food Distribution Locations
Clarksburg
When: Friday, November 20, 2015
Distribution details:
Only Clarksburg residents will be served
Pre-registration is required for this site
Pre-registration will be open until November 12th or until all meal kits have been
reserved
Please call Yolo County Children’s Alliance for more information: (530) 902-6850
Dunnigan
When: Thursday, November 19, 2015
Distribution details
Only Dunnigan residents will be served
Pre-registration is required for this site
Pre-registration will be open until November 12th or until all meal kits have been
reserved
Please call Family Action Center of Colusa County for more information: (530) 476-
0822
Davis
When: Saturday, November 21, 2015
Where: Pole Line Road Baptist Church – 770 Pole Line Road Davis, CA 95618
Distribution details:
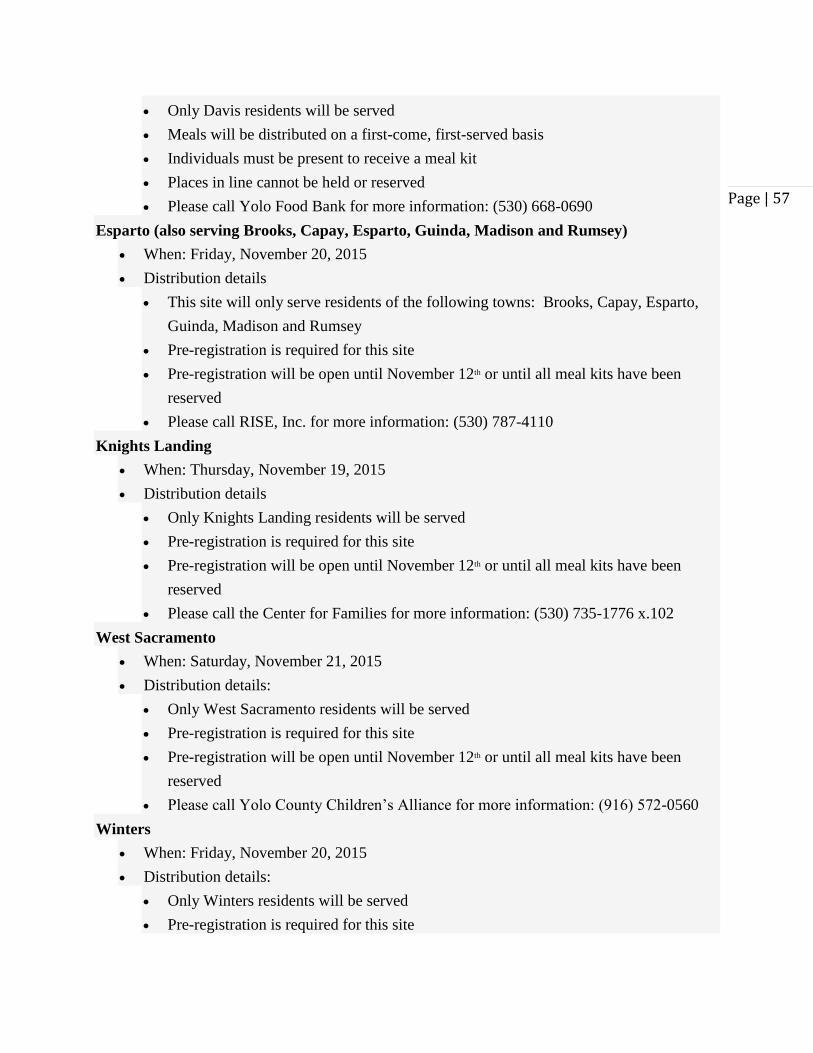
Page | 57
Only Davis residents will be served
Meals will be distributed on a first-come, first-served basis
Individuals must be present to receive a meal kit
Places in line cannot be held or reserved
Please call Yolo Food Bank for more information: (530) 668-0690
Esparto (also serving Brooks, Capay, Esparto, Guinda, Madison and Rumsey)
When: Friday, November 20, 2015
Distribution details
This site will only serve residents of the following towns: Brooks, Capay, Esparto,
Guinda, Madison and Rumsey
Pre-registration is required for this site
Pre-registration will be open until November 12th or until all meal kits have been
reserved
Please call RISE, Inc. for more information: (530) 787-4110
Knights Landing
When: Thursday, November 19, 2015
Distribution details
Only Knights Landing residents will be served
Pre-registration is required for this site
Pre-registration will be open until November 12th or until all meal kits have been
reserved
Please call the Center for Families for more information: (530) 735-1776 x.102
West Sacramento
When: Saturday, November 21, 2015
Distribution details:
Only West Sacramento residents will be served
Pre-registration is required for this site
Pre-registration will be open until November 12th or until all meal kits have been
reserved
Please call Yolo County Children’s Alliance for more information: (916) 572-0560
Winters
When: Friday, November 20, 2015
Distribution details:
Only Winters residents will be served
Pre-registration is required for this site
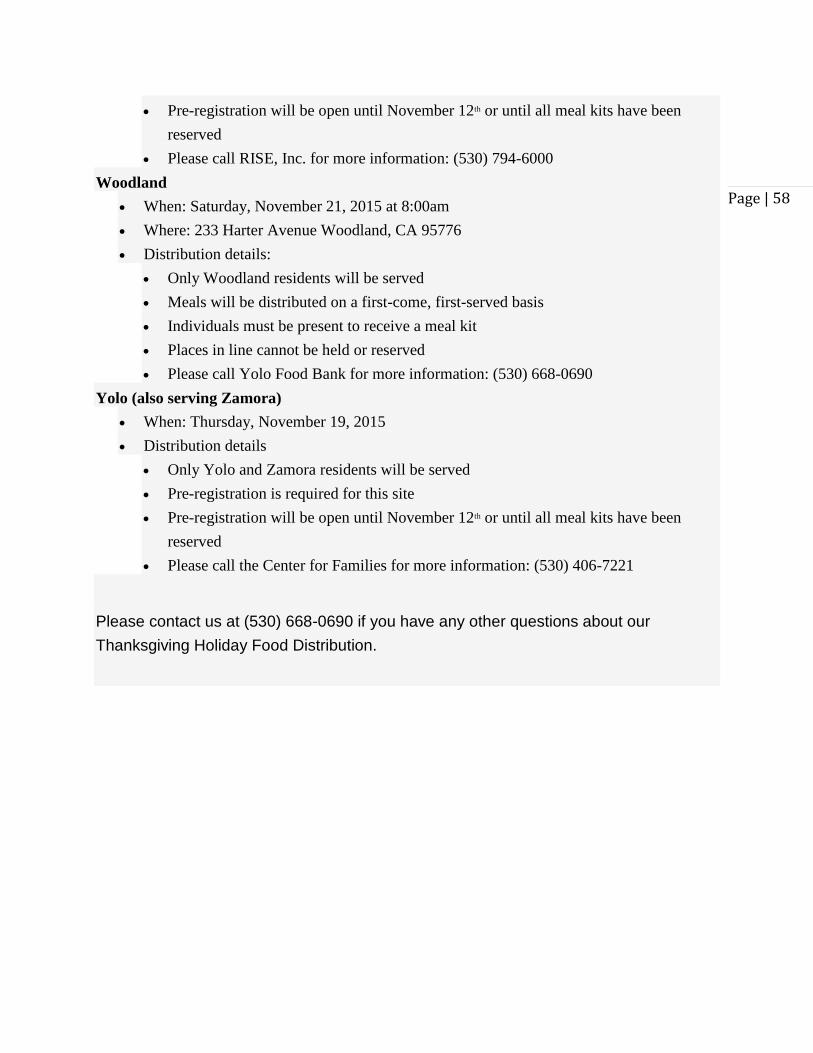
Page | 58
Pre-registration will be open until November 12th or until all meal kits have been
reserved
Please call RISE, Inc. for more information: (530) 794-6000
Woodland
When: Saturday, November 21, 2015 at 8:00am
Where: 233 Harter Avenue Woodland, CA 95776
Distribution details:
Only Woodland residents will be served
Meals will be distributed on a first-come, first-served basis
Individuals must be present to receive a meal kit
Places in line cannot be held or reserved
Please call Yolo Food Bank for more information: (530) 668-0690
Yolo (also serving Zamora)
When: Thursday, November 19, 2015
Distribution details
Only Yolo and Zamora residents will be served
Pre-registration is required for this site
Pre-registration will be open until November 12th or until all meal kits have been
reserved
Please call the Center for Families for more information: (530) 406-7221
Please contact us at (530) 668-0690 if you have any other questions about our
Thanksgiving Holiday Food Distribution.
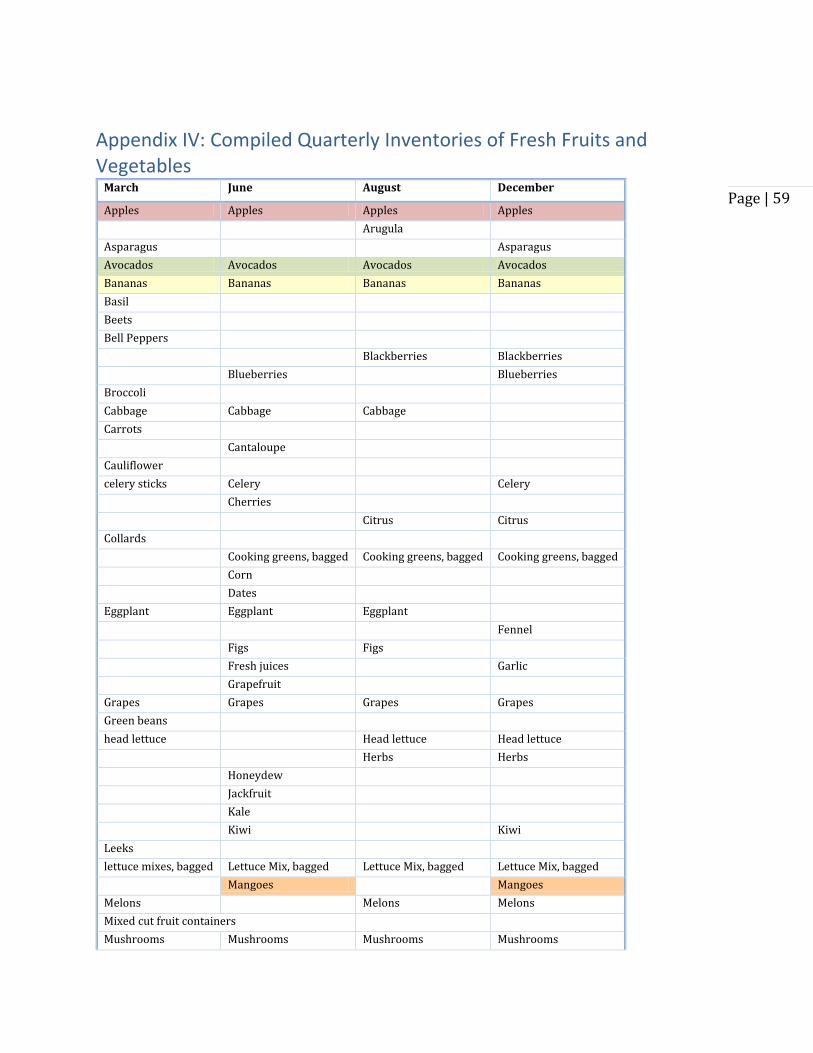
Page | 59
Appendix IV: Compiled Quarterly Inventories of Fresh Fruits and Vegetables
March June August December
Apples Apples Apples Apples
Arugula
Asparagus Asparagus
Avocados Avocados Avocados Avocados
Bananas Bananas Bananas Bananas
Basil
Beets
Bell Peppers
Blackberries Blackberries
Blueberries Blueberries
Broccoli
Cabbage Cabbage Cabbage
Carrots
Cantaloupe
Cauliflower
celery sticks Celery Celery
Cherries
Citrus Citrus
Collards
Cooking greens, bagged Cooking greens, bagged Cooking greens, bagged
Corn
Dates
Eggplant Eggplant Eggplant
Fennel
Figs Figs
Fresh juices Garlic
Grapefruit
Grapes Grapes Grapes Grapes
Green beans
head lettuce Head lettuce Head lettuce
Herbs Herbs
Honeydew
Jackfruit
Kale
Kiwi Kiwi
Leeks
lettuce mixes, bagged Lettuce Mix, bagged Lettuce Mix, bagged Lettuce Mix, bagged
Mangoes Mangoes
Melons Melons Melons
Mixed cut fruit containers
Mushrooms Mushrooms Mushrooms Mushrooms
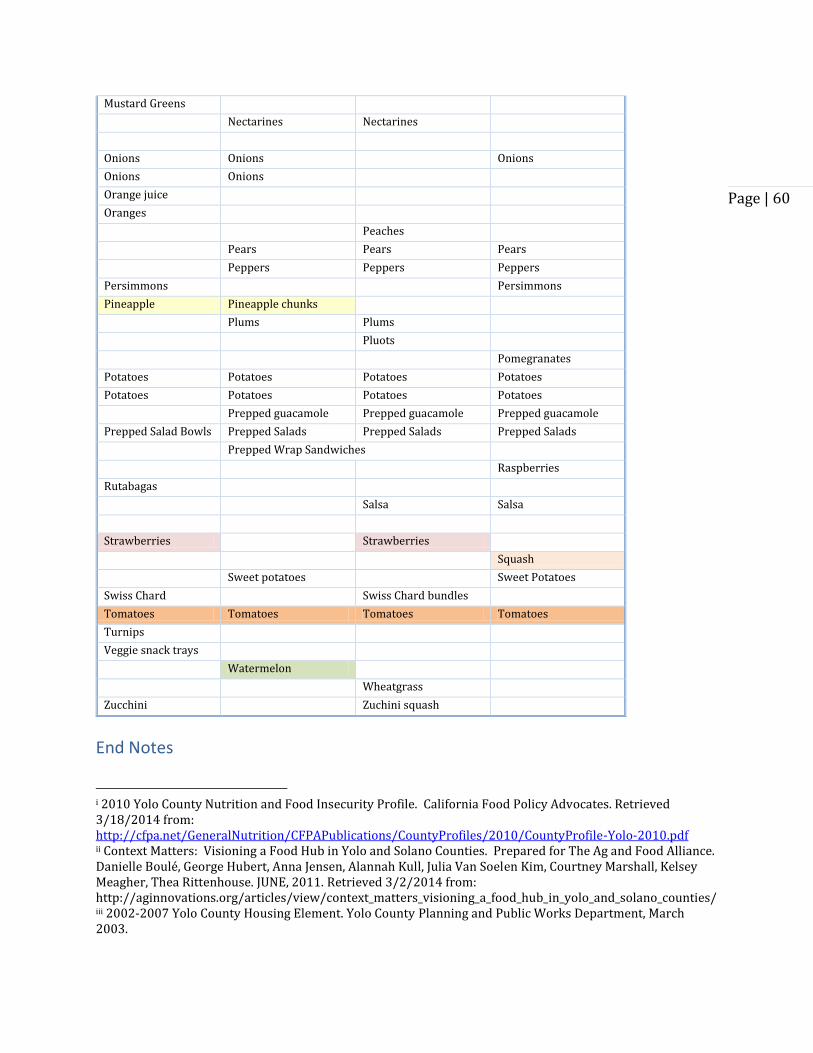
Page | 60
Mustard Greens
Nectarines Nectarines
Onions Onions Onions
Onions Onions
Orange juice
Oranges
Peaches
Pears Pears Pears
Peppers Peppers Peppers
Persimmons Persimmons
Pineapple Pineapple chunks
Plums Plums
Pluots
Pomegranates
Potatoes Potatoes Potatoes Potatoes
Potatoes Potatoes Potatoes Potatoes
Prepped guacamole Prepped guacamole Prepped guacamole
Prepped Salad Bowls Prepped Salads Prepped Salads Prepped Salads
Prepped Wrap Sandwiches
Raspberries
Rutabagas
Salsa Salsa
Strawberries Strawberries
Squash
Sweet potatoes Sweet Potatoes
Swiss Chard Swiss Chard bundles
Tomatoes Tomatoes Tomatoes Tomatoes
Turnips
Veggie snack trays
Watermelon
Wheatgrass
Zucchini Zuchini squash
End Notes
i 2010 Yolo County Nutrition and Food Insecurity Profile. California Food Policy Advocates. Retrieved 3/18/2014 from: http://cfpa.net/GeneralNutrition/CFPAPublications/CountyProfiles/2010/CountyProfile-Yolo-2010.pdf ii Context Matters: Visioning a Food Hub in Yolo and Solano Counties. Prepared for The Ag and Food Alliance. Danielle Boulé, George Hubert, Anna Jensen, Alannah Kull, Julia Van Soelen Kim, Courtney Marshall, Kelsey Meagher, Thea Rittenhouse. JUNE, 2011. Retrieved 3/2/2014 from: http://aginnovations.org/articles/view/context_matters_visioning_a_food_hub_in_yolo_and_solano_counties/ iii 2002-2007 Yolo County Housing Element. Yolo County Planning and Public Works Department, March 2003.
Page | 61
iv California’s Hired Farm Workers Move to the Cities: The Outsourcing of Responsibility for Farm Labor Housing Don Villarejo, Ph.D. California Rural Legal Assistance Priorities Conference, Asilomar, California July 16, 2013; revised manuscript, January 24, 2014 Retrieved 3/15/2014 from: http://www.crla.org/sites/all/files/u6/2014/rju0214/VillarejoFrmLbrHsngHlth_CRLA_012414.pdf v Suffering in Silence: A Report on the Health of California Agricultural Workers. Don Villarejo, David Lighthall, Daniel Williams, Ann Souter, Richard Mines, Bonnie Bade, Steve Samuels, Stephen McCurdy. California Institute for Rural Studies and The California Endowment. November 2000. vi Cancer-related health behaviors and screening practices among Latinos: Findings from a community and agricultural labor camp survey. Winkleby, Marilyn A., John Snider, Bonnie Davis, Maria Garcia Jennings; David K. Ahn. 2003. Ethnicity and Disease, 13: 376-386. vii Ten-year changes in cancer-related health behaviors and screening practices among Latino women and men in California. Winkleby, Marilyn A., Soowon Kim, Guido G. Urizar Jr., David Ahn, Maria Garcia Jennings and John Snider. 2006. Ethnicity and Health, 11(1): 1-17. viii Hunger in the Fields: Food Insecurity among Farm workers in Fresno County. Cathy Wirth, Ron Strochlic and Christy Getz. California Institute for Rural Studies, November 2007. ix Increasing Food Security among Agricultural Workers in California’s Salinas Valley. Lisa Kresge and Chelsea Eastman. California Institute for Rural Studies, June 2010. x http://ask.chis.ucla.edu/AskCHIS/tools/_layouts/AskChisTool/home.aspx#/results accessed 2/5/16 xi California Food Policy Advocates, 2010b xiiThe National Agricultural Workers Survey Report. Retrieved 3/20/2014 from:
http://www.doleta.gov/agworker/report/ch1.cfm xiii Kresge and Eastman. 2010